
Abstract
A circular city (CC) promotes circular economy (CE) principles. Efficient urban solid waste management (USWM) strategies are essential for promoting a CE at the municipal level. New tools are needed to evaluate waste management (WM) and increase the reuse and recycling of materials to accelerate the transition towards a CC. These tools could assist decision and policymakers in adopting, implementing, and monitoring circular practices. This study proposes creating an index (USWM-index) to evaluate WM in urban areas and discuss how it could be better managed in future sustainable circular cities in Brazil. The index allows city managers to integratively and sustainably assess their USWM. Decision-makers can also use the index to set goals and objectives for recycling and reusing generated waste in cities. The index comprises 19 indicators and 51 sub-indicators. These elements were divided into five groups: Operational, Environmental, Political-economic, Educational, and Social. Cities can assess their performance in each group by using the USWM-index. The index was applied to four Brazilian cities. All cities had their USWM classified as average, and they did not have initiatives to transition to sustainable circular cities regarding WM. This study presents guidelines for transitioning from a linear city to a sustainable circular city in terms of WM.
Keywords
Introduction
Circular economy (CE) consists of a production model that replaces the traditional linear production model and promotes the production of goods without increasing raw material consumption while eliminating generated waste. According to the Ellen Macarthur Foundation (EMF, 2015a), a CE is restorative and regenerative in principle. CE seeks to keep products, components and materials at their highest utility and value levels at all times. Production processes need to be designed and reformulated circularly to avoid using natural resources and to keep materials in production cycles by reusing, remanufacturing and recycling them (Bonciu, 2014). There are six main actions that promote CE (ReSOLVE framework), that is, generate, share, optimize, loop, virtualize and exchange products (EMF, 2015b; Prendeville et al., 2018).
According to Girard and Nocca (2019), a CE model can help achieve sustainability within cities. For the EMF, implementing a circular vision can bring economic, social and environmental benefits to cities worldwide (EMF, 2019). A circular city (CC) is dedicated to closing loops and transforming linear processes into circular processes to eliminate waste and waste generation (Girard and Nocca, 2019). According to the Circular City Declaration (2020), a CC promotes business models and economic behaviours that decouple resources from economic activities, maintaining product value and utility and maintaining components, materials and nutrients for as long as possible. Consequently, cities can close material cycles and minimize harmful resource use and waste generation. Thus, municipal solid waste (MSW) is essential for extending product lifespans and closing material cycle loops (Tsai et al., 2020).
However, studies on how cities might close loops and become circular are still incipient. Policymakers need to understand and monitor transitions from linear cities towards CCs. In this process, indicators need to be created and studied to monitor and support the transition towards a circular model. According to Girard and Nocca (2019), there is no one-size-fits-all set of indicators for assessing city circularization. The authors explained that each city that is becoming circular uses specific indicators created by it to monitor implementing circular initiatives. These indicators related to urban solid waste management (USWM) might include the waste recycling rate (%/year), the percentage of solid waste material sent to landfills (%/year or tons/year), the percentage of solid waste material that is composted (%/year), the amount of recycled goods used by city administrations (%/year) or the percentage of household waste that is reused or recycled (%/year).
Cities worldwide have been creating plans and actions to implement the CEs, and waste management (WM) initiatives are present among them all. Amsterdam Circular, for example, employed strategies focused on organic waste to eliminate food waste (Gemeente Amsterdam, 2020). The Circular Copenhagen strategy has sought to prioritize reusing materials. There, the city encouraged and created options for swapping and reusing materials (City of Copenhagen, 2019). Paris adopted a zero-waste strategy, where among several other WM actions, they opened citywide ‘ressourceries’ to teach Parisians how to repair things, thereby reducing solid waste generation (Mairie de Paris, 2017).
In Brazil, WM has been defined by the national solid waste policy (NSWP). This law set forth a series of guidelines that follow the WM concepts of a CC, like using Reverse Logistics (RL) and waste hierarchy (prioritizing the non-generation, reduction, reuse and recycling). However, it was not created in the context of CC. The NSWP was enacted in Brazil in 2010. Since then, Brazilian cities have been implementing the guidelines established in this policy. According to the Panorama of Solid Waste in Brazil – 2020, Brazilian cities are still far from reaching the NSWP goals (Abrelpe – Brazilian Association of Public Cleaning and Special Waste, 2020).
The Panorama of Solid Waste in Brazil report showed that 40.5% of all waste generated in municipalities is still disposed of improperly. Although 73% of all Brazilian cities have enacted some selective collection initiatives (even if incipient), the collection still does not cover the whole city. Inadequate waste separation results in overloaded final disposal systems and more natural resource extraction. The national average for recycling is below 4%, showing the fragility of existing recycling programmes, the inexistence of structured markets for absorbing recycled waste, and logistical and tax difficulties are barriers for the sector. These facts were exposed in the Panorama report showing the significant challenges that still need to be overcome to fully meet the goals established in the NSWP (Abrelpe – Brazilian Association of Public Cleaning and Special Waste, 2020).
Given these challenges, indicators need to be analysed and compared to help public managers in their WM decision-making processes (Moraes et al., 2020; Polaz and Teixeira, 2009; Silva et al., 2019). The NSWP states that WM needs to be constantly monitored (Brazil, 2010) to identify main problems, like those pointed out by Abrelpe – Brazilian Association of Public Cleaning and Special Waste (2020), and create solutions and improvements targets.
Tools for assessing WM are essential in helping Brazilian cities achieve the NSWP goals and organize the transition towards sustainable CCs. This study seeks to develop an assessment tool for USWM considering guidelines in the NSWP. The proposed tool is called the USWM-index. The USWM-index was tested in four Brazilian cities, and we were able to suggest improvements to make the WM strategic for promoting CC models. After applying the USWM-index within the selected cities, we identified the main challenges faced by these cities and pointed out actions that could be applied to transition towards a sustainable CC.
USWM in Brazil
In Brazil, solid WM is regulated by the NSWP. This policy systematized guidelines for WM in the country and began considering environmental, social, cultural, economic, technological and public health aspects. The NSWP defined post-consumption RL as an economic and social development instrument characterized by a set of actions and procedures that allow solid waste from the industrial sector to be collected and reinserted into productive chains. When this is not possible, waste must be disposed of in an environmentally friendly way.
The NSWP also outlined shared responsibility, whereby the public sector, businesses and citizens are responsible for product life cycles. Furthermore, the NSWP established the role of federal, state and municipal governments in the management processes (Brazil, 2010). Municipal authorities are fundamental when integrating USWM practices. They are responsible for implementing and articulating the managing steps and establishing parameters and indicators for evaluating the management.
According to the NSWP, cities need to promote holistic WM and create integrated municipal solid waste management plan (ISWMP). These plans need to present guidelines for urban solid waste (USW). USW comprises household waste and municipal cleaning waste. Household waste originates in homes and is produced from the daily activities of citizens, for example, cooking, cleaning, repairing, decorating, furnishing, hobbies, clothing and personal hygiene. Municipal cleaning waste originates from sweeping and cleaning public roads and other municipal cleaning services. USW comprises food waste, paper, cardboard, plastic packaging, cloth, wood, glass, metal, toilet paper, disposable diapers, leaves, branches, earth and sand. USW may also contain residues that have not been properly disposed of, for example, used cell phones and batteries, light bulbs, leftover paints, insecticides, oils, greases and syringes.
Managerial operational processes should begin with diagnosing the waste situation in cities. At this stage, the city administration seeks out information on the origin of waste, its volumes, composition and characteristics. This step is essential in elaborating other management steps, which are (1) separation and storage: which should preferably be performed at the generation site; (2) collection and transportation: must be performed with adequate frequency and is the responsibility of cities; (3) environmentally friendly disposal options: including reuse, recycling, composting, recovery, energy use or other disposal methods allowed by public agencies; and (3) final disposal: the USW that cannot be recovered or treated, and tailings resulting from various treatment processes should be sent for final disposal, with priority given to using landfills in Brazil (Gonçalves et al., 2018).
The NSWP emphasizes the importance of including the informal sector in collecting and sorting USW. Brazilian cities must create mechanisms to form and support cooperatives and other associations for recyclable material collectors. According to Fuss et al. (2021), these workers are essential mediators in CEs in developing countries.
Methodology
To formulate the USWM-index, we used the same methodology as Moraes et al. (2020), Moraes et al. (2022), and Hugo and Lima (2021). The study was performed in four stages: (1) selecting and ranking indicators, (2) evaluating the highest levels of the hierarchy using the analytic hierarchy process (AHP) method, (3) formulating the index using the weighted-linear-combination aggregation method and (4) applying the index at Brazilian cities, and giving suggestions for possible measures that could be adopted to promote circularization in these studied areas.
Stage 1 – Identifying the indicators
A literature review was performed to identify the indicators. As a result, we identified 612 indicators for evaluating WM. We used the same criteria as Silva et al. (2019) to select indicators to comprise the index. The authors stated that, for an indicator to be selected, it should have an evaluation method, fit the definition of USW, should be measurable, and in case of any redundant indicators, only one should be chosen.
Detailing the indicator selection process: (1) The Consistency of the indicator was checked. We verified whether an indicator could be used to assess a relevant aspect of municipal WM; (2) The Applicability of this indicator was checked. We verified whether an indicator could be measured (if it presented an evaluation method); (3) The Redundancy of the indicator was checked. We verified whether an indicator presented information already brought by another indicator previously selected; (4) The Usability of the indicator was checked. We verified whether an indicator gives decision-makers relevant information to evaluate WM.
After applying these criteria, the initial set of indicators was reduced to 51. These indicators were divided into criteria based on the type of knowledge given by the indicator. Each indicator became part of one criterion and received the name ‘sub-indicators’. The criteria were divided into (1) an Operational group, (2) an Environmental group, (3) a Political-economic group, (4) an Educational group and (5) a Social group. Therefore, we obtain the hierarchical structure used to apply the AHP method. This hierarchy was based on studies from Moraes et al. (2020).
Stage 2 – Evaluating the groups and criteria using AHP
The second stage evaluated the highest levels of the hierarchical structure (groups and indicators) using the AHP method. The AHP method is a multi-criteria decision analysis (MCDA) method developed to identify and assign weights to multiple selection criteria, considering existing alternatives. The method helps decision-making in complex environments (Saaty, 1980). Of the various MCDA methods, AHP is adequate for decision-making related to WM because the method can include opinions from different stakeholders, who often have conflicting views, as suggested by Mapa and Lima (2012), Moraes et al. (2020), Parekh et al. (2015) and Siman et al. (2020).
For applying the AHP method, one needs to compare the elements of the same hierarchical level using pairwise comparison matrices, according to Saaty (1980). These matrices must be answered by specialists or people involved in decision-making processes (Enomoto and Lima, 2007). In this work, 19 experts working with MSW answered the AHP matrix. There were representatives from the public, private and academic sectors among these professionals.
The professionals consulted filled in the matrices that compared: (1) the groups, (2) the environmental group indicators, (3) the political and economic group indicators, (4) the educational group indicators and (5) the social group indicators. The comparisons were made according to the AHP importance scale. The last step of the AHP method is to analyse the results from the comparison matrices, following the method from Saaty (1980), to find the weight of each element in each matrix.
Stage 3 – Formulating the index
For the formulation of the global and sectorial USWM-index, a weighted linear combination was used similar to Moraes et al. (2020), Moraes et al. (2022) and Hugo and Lima (2021).
The weights for the groups and indicators in the AHP were used as a multiplicative factor in equations (1) and (2). For the sub-indicators (the last level in the hierarchical structure), the AHP method was not used to evaluate the weights. The method was avoided because the large number of sub-indicators makes the matrices extensive and complex, making the specialists’ evaluation process more difficult. Therefore, the same weight was used for the sub-indicators.
The use of this method for assigning weights makes it possible to adapt the index according to data availability or local requirements for WM. For example, if it is impossible to measure a criterion's sub-indicators in a specific municipality, these sub-indicators will be disregarded. The weights of the group this criterion belongs to are distributed equally among all criteria. Therefore the sum of the weights of the criteria in the group is 1. As a result, the sum of the sub-indicators for the same indicator was equal to 1.
The indicator measurements were normalized so the aggregation method could be applied. Standardized scores ranging from 0 to 1 were used (Moraes et al., 2020). The index was calculated using equations (1) and (2).

Where:
fi = Group weight from specialists
ci = Weight obtained from the specialists for the indicator
si = Weight for the sub-indicator i.
wi = Normalized score for the sub-indicator i (with 0 < w < 1).
Where:
fig = Group weight
ci = Indicator weight for the analysed group
si = Sub-indicator weight for the analysed group.
wi = Normalized score for the sub-indicator i (with 0 < w < 1).
A scale ranging from 0 to 1 was used to assess the indices. The closer the index is to 1, the better the management. Management can be classified as being: efficient (index above 0.8), average (index between 0.5 and 0.8) and inefficient (index below 0.5).
Stage 4 – Applying the index and suggestions for USWM
Four small- (<100,000 inhabitants) and medium- (between 100,000 and 1,000,000 inhabitants) sized cities were selected to validate the index. Small- and medium-sized cities represent 94.91% of all Brazilian cities (IBGE – Brazilian Institute of Geography and Statistics, 2011), and for this reason, specific studies are needed for them. The cities used in this study were Santa Rita do Sapucaí (small-sized city), Pouso Alegre (medium-sized city), Machado (small-sized city) and Três Corações (medium-sized city).
All these cities are located in the southern region of Minas Gerais state (Figure 1).
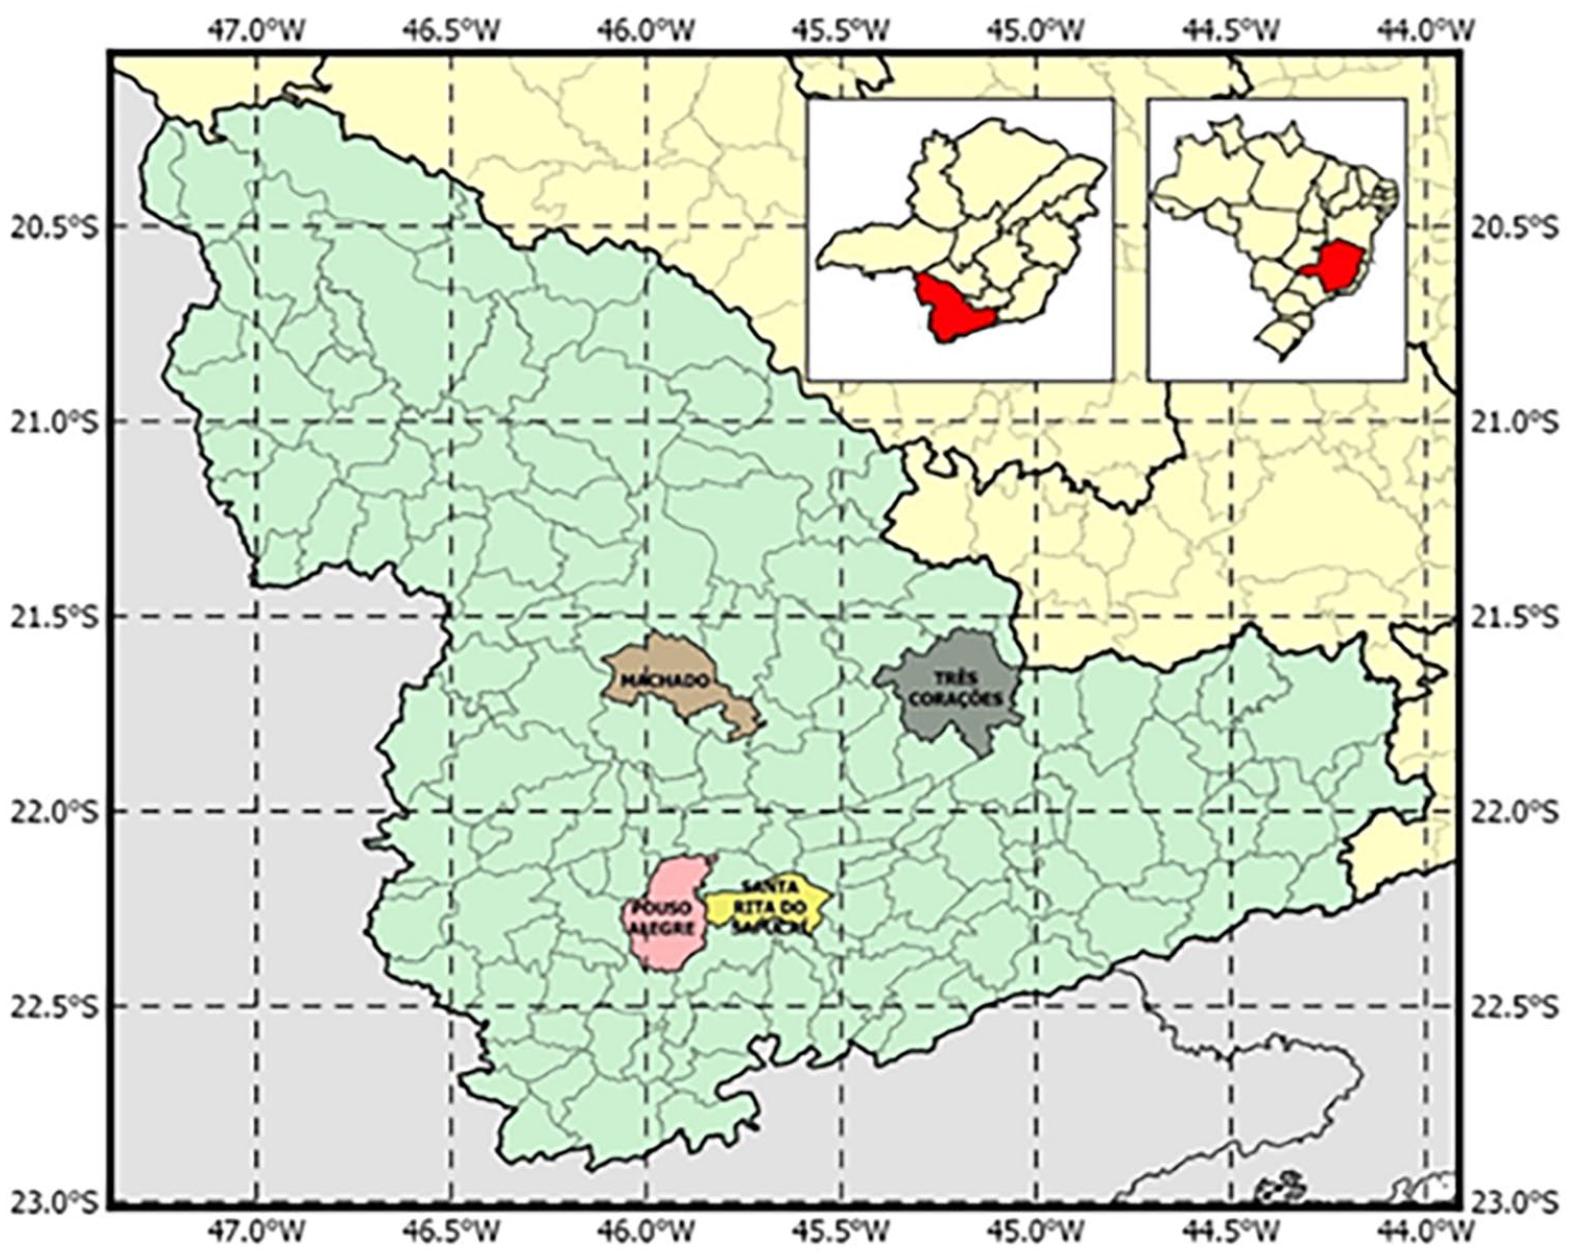
Location of studied cities.
Data were collected via visits to city halls, landfills, collection centres, recycling companies, collection associations and garbage collectors. After the data collection phase, the indexes were calculated, and the USWM was evaluated. Finally, we proposed a series of initiatives to improve current USWM practices to help cities become circular by improving their WM.
Results and discussions
The 51 sub-indicators identified in the literature review are presented in Table 1. The table also contains explanations and metrics for each element, showing the hierarchical structure.
Description of the hierarchical structure.
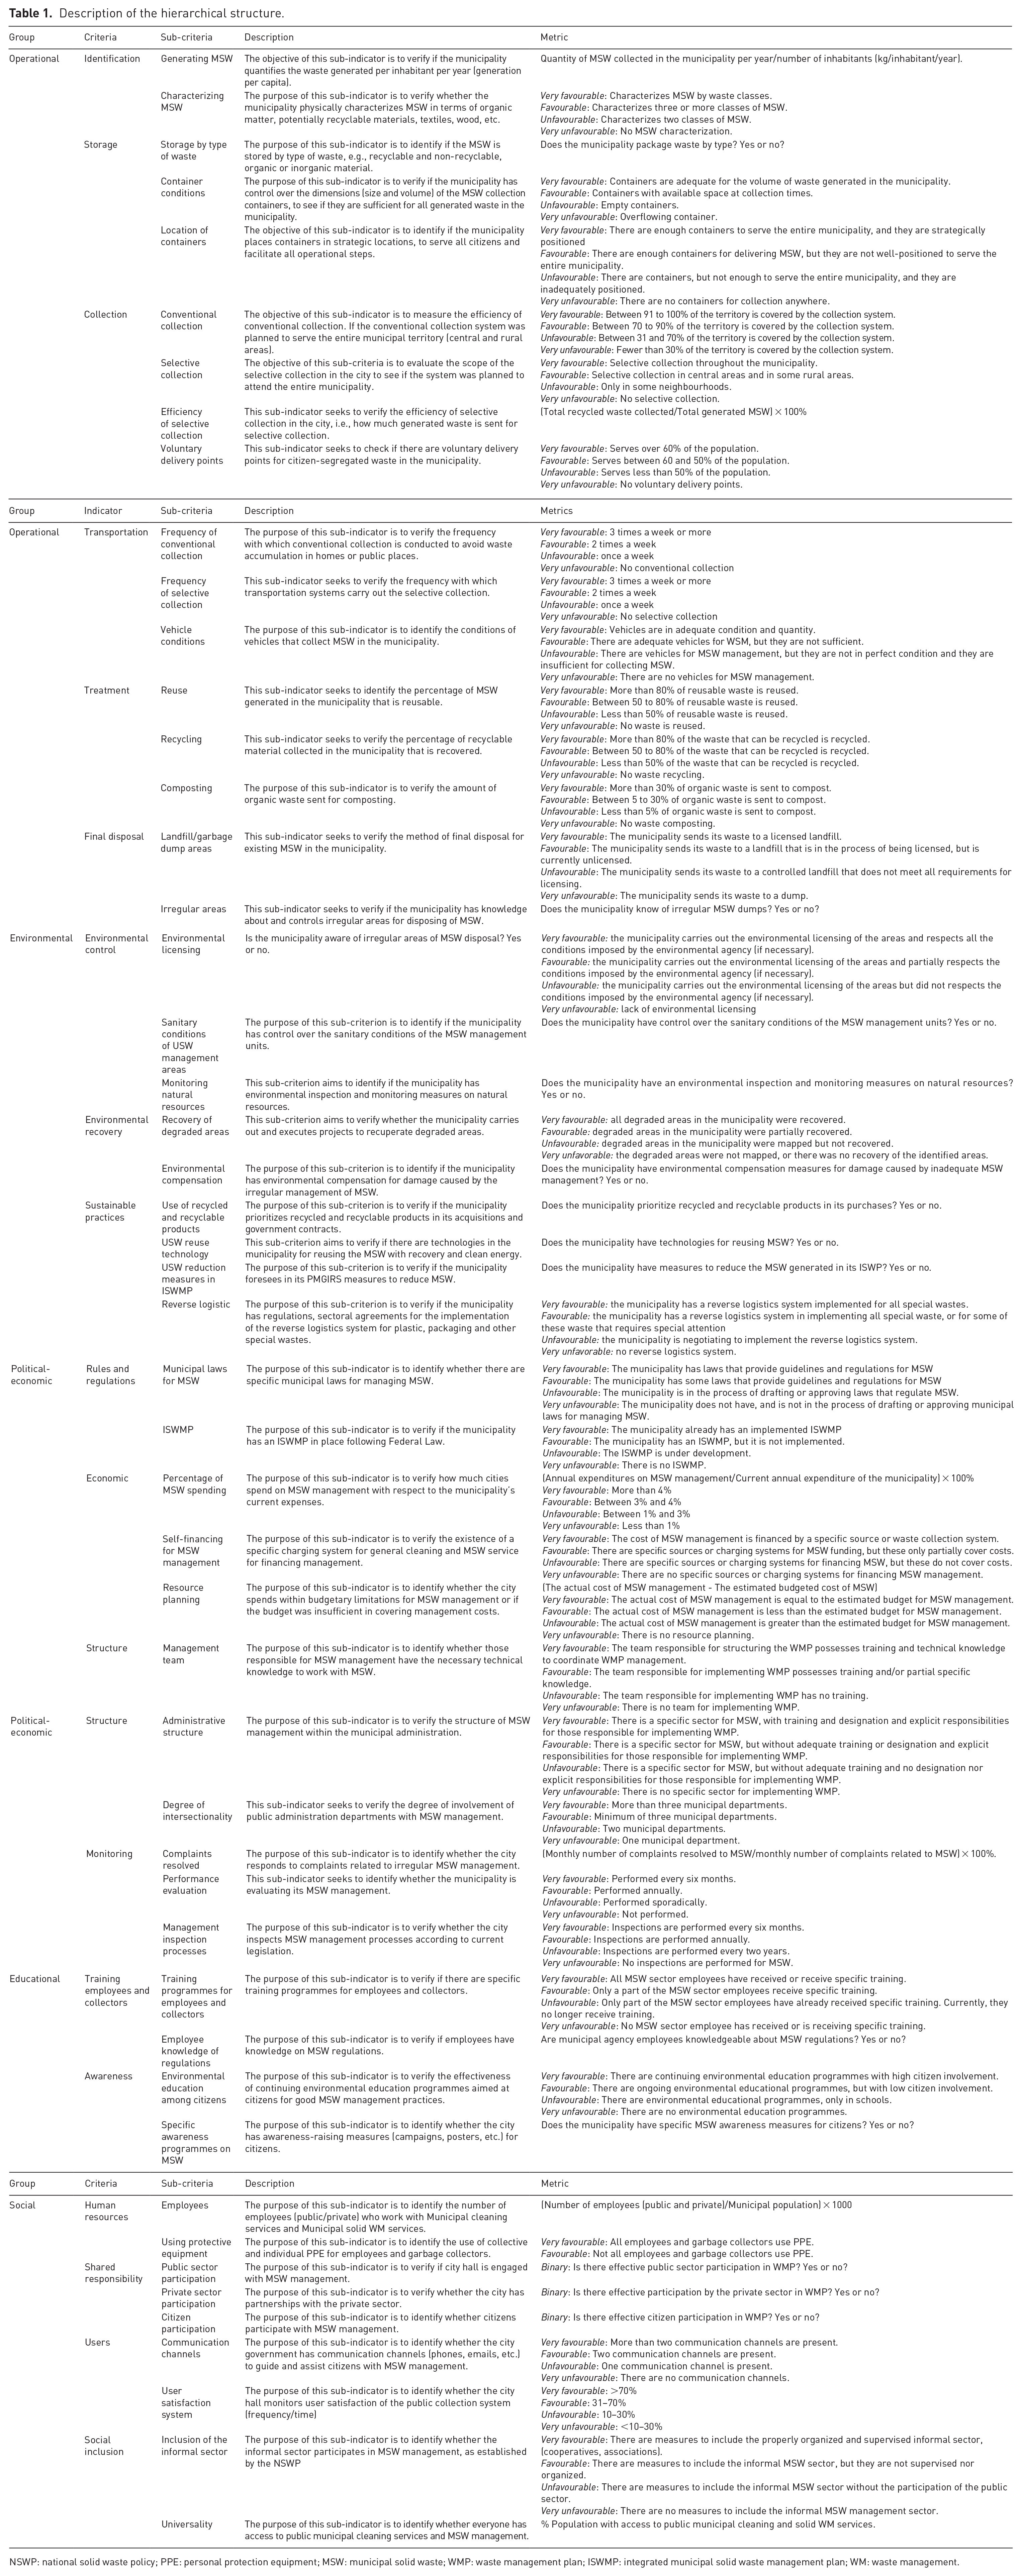
NSWP: national solid waste policy; PPE: personal protection equipment; MSW: municipal solid waste; WMP: waste management plan; ISWMP: integrated municipal solid waste management plan; WM: waste management.
The results of the expert assessment using the AHP method are presented in Figure 2. According to the evaluators, the most significant group was the Environmental group (weight equal to 0.26), highlighting concerns about preserving and conserving natural resources and adopting sustainable practices that are important for the transition to the circular model of cities. The second most significant group is the Operational group (equal to 0.22). It points out that the steps necessary for proper waste disposal are relevant to the experts consulted. It is important to emphasize that in the stage called ‘treatment’, the existence of reuse, recycling and composting in the operational management processes is evaluated within this group. These steps are essential for closing material cycles in a CC. The Political-economic group had a weight equal to 0.21, the social group 0.16, and the educational group 0.15.
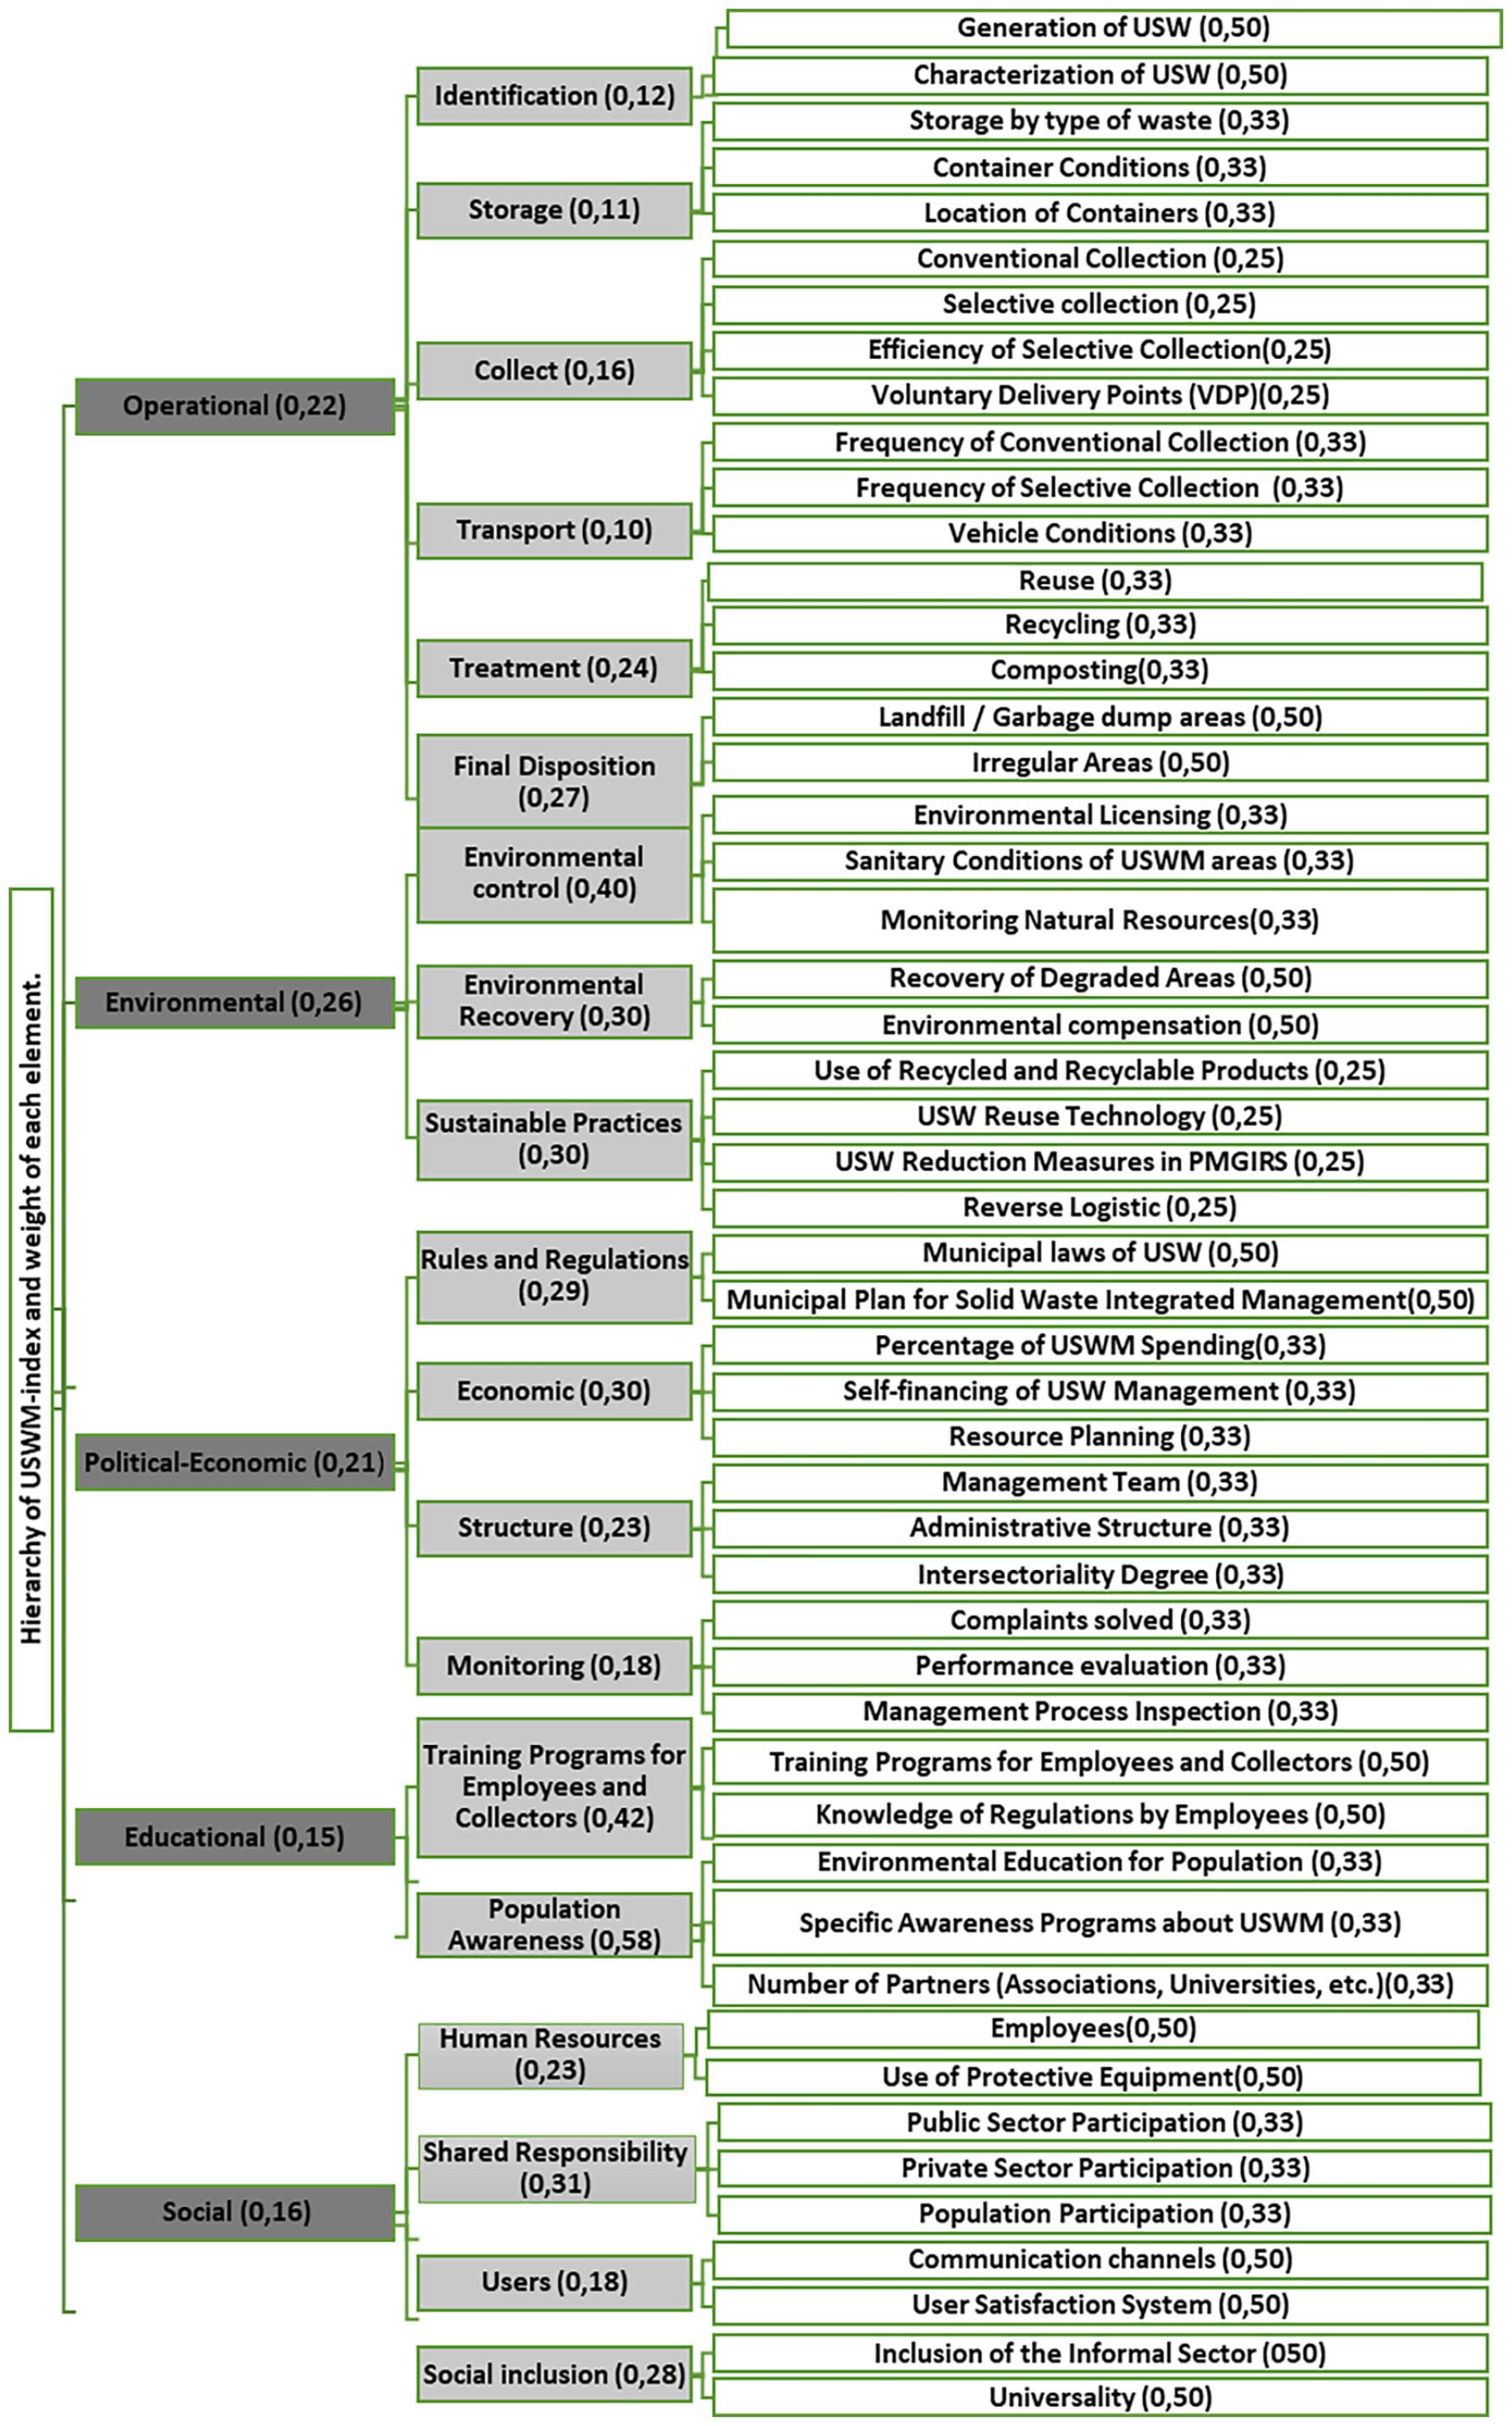
Weight of each element of the hierarchical structure.
After collecting data in the cities, we measured most of the sub-indicators; however, we could not measure all sub-indicators given the lack of data availability. The results for scores for each sub-indicator are presented in Table 2. The indicators that could not be measured are highlighted in Table 2. Lacking information was also a problem Moraes et al. (2020) encountered. Standardizing the indicator weights for the lowest level allowed us to remove and insert new sub-criteria, allowing us to calculate the index even when data for some indicators were missing.
Scores for the sub-indicators.
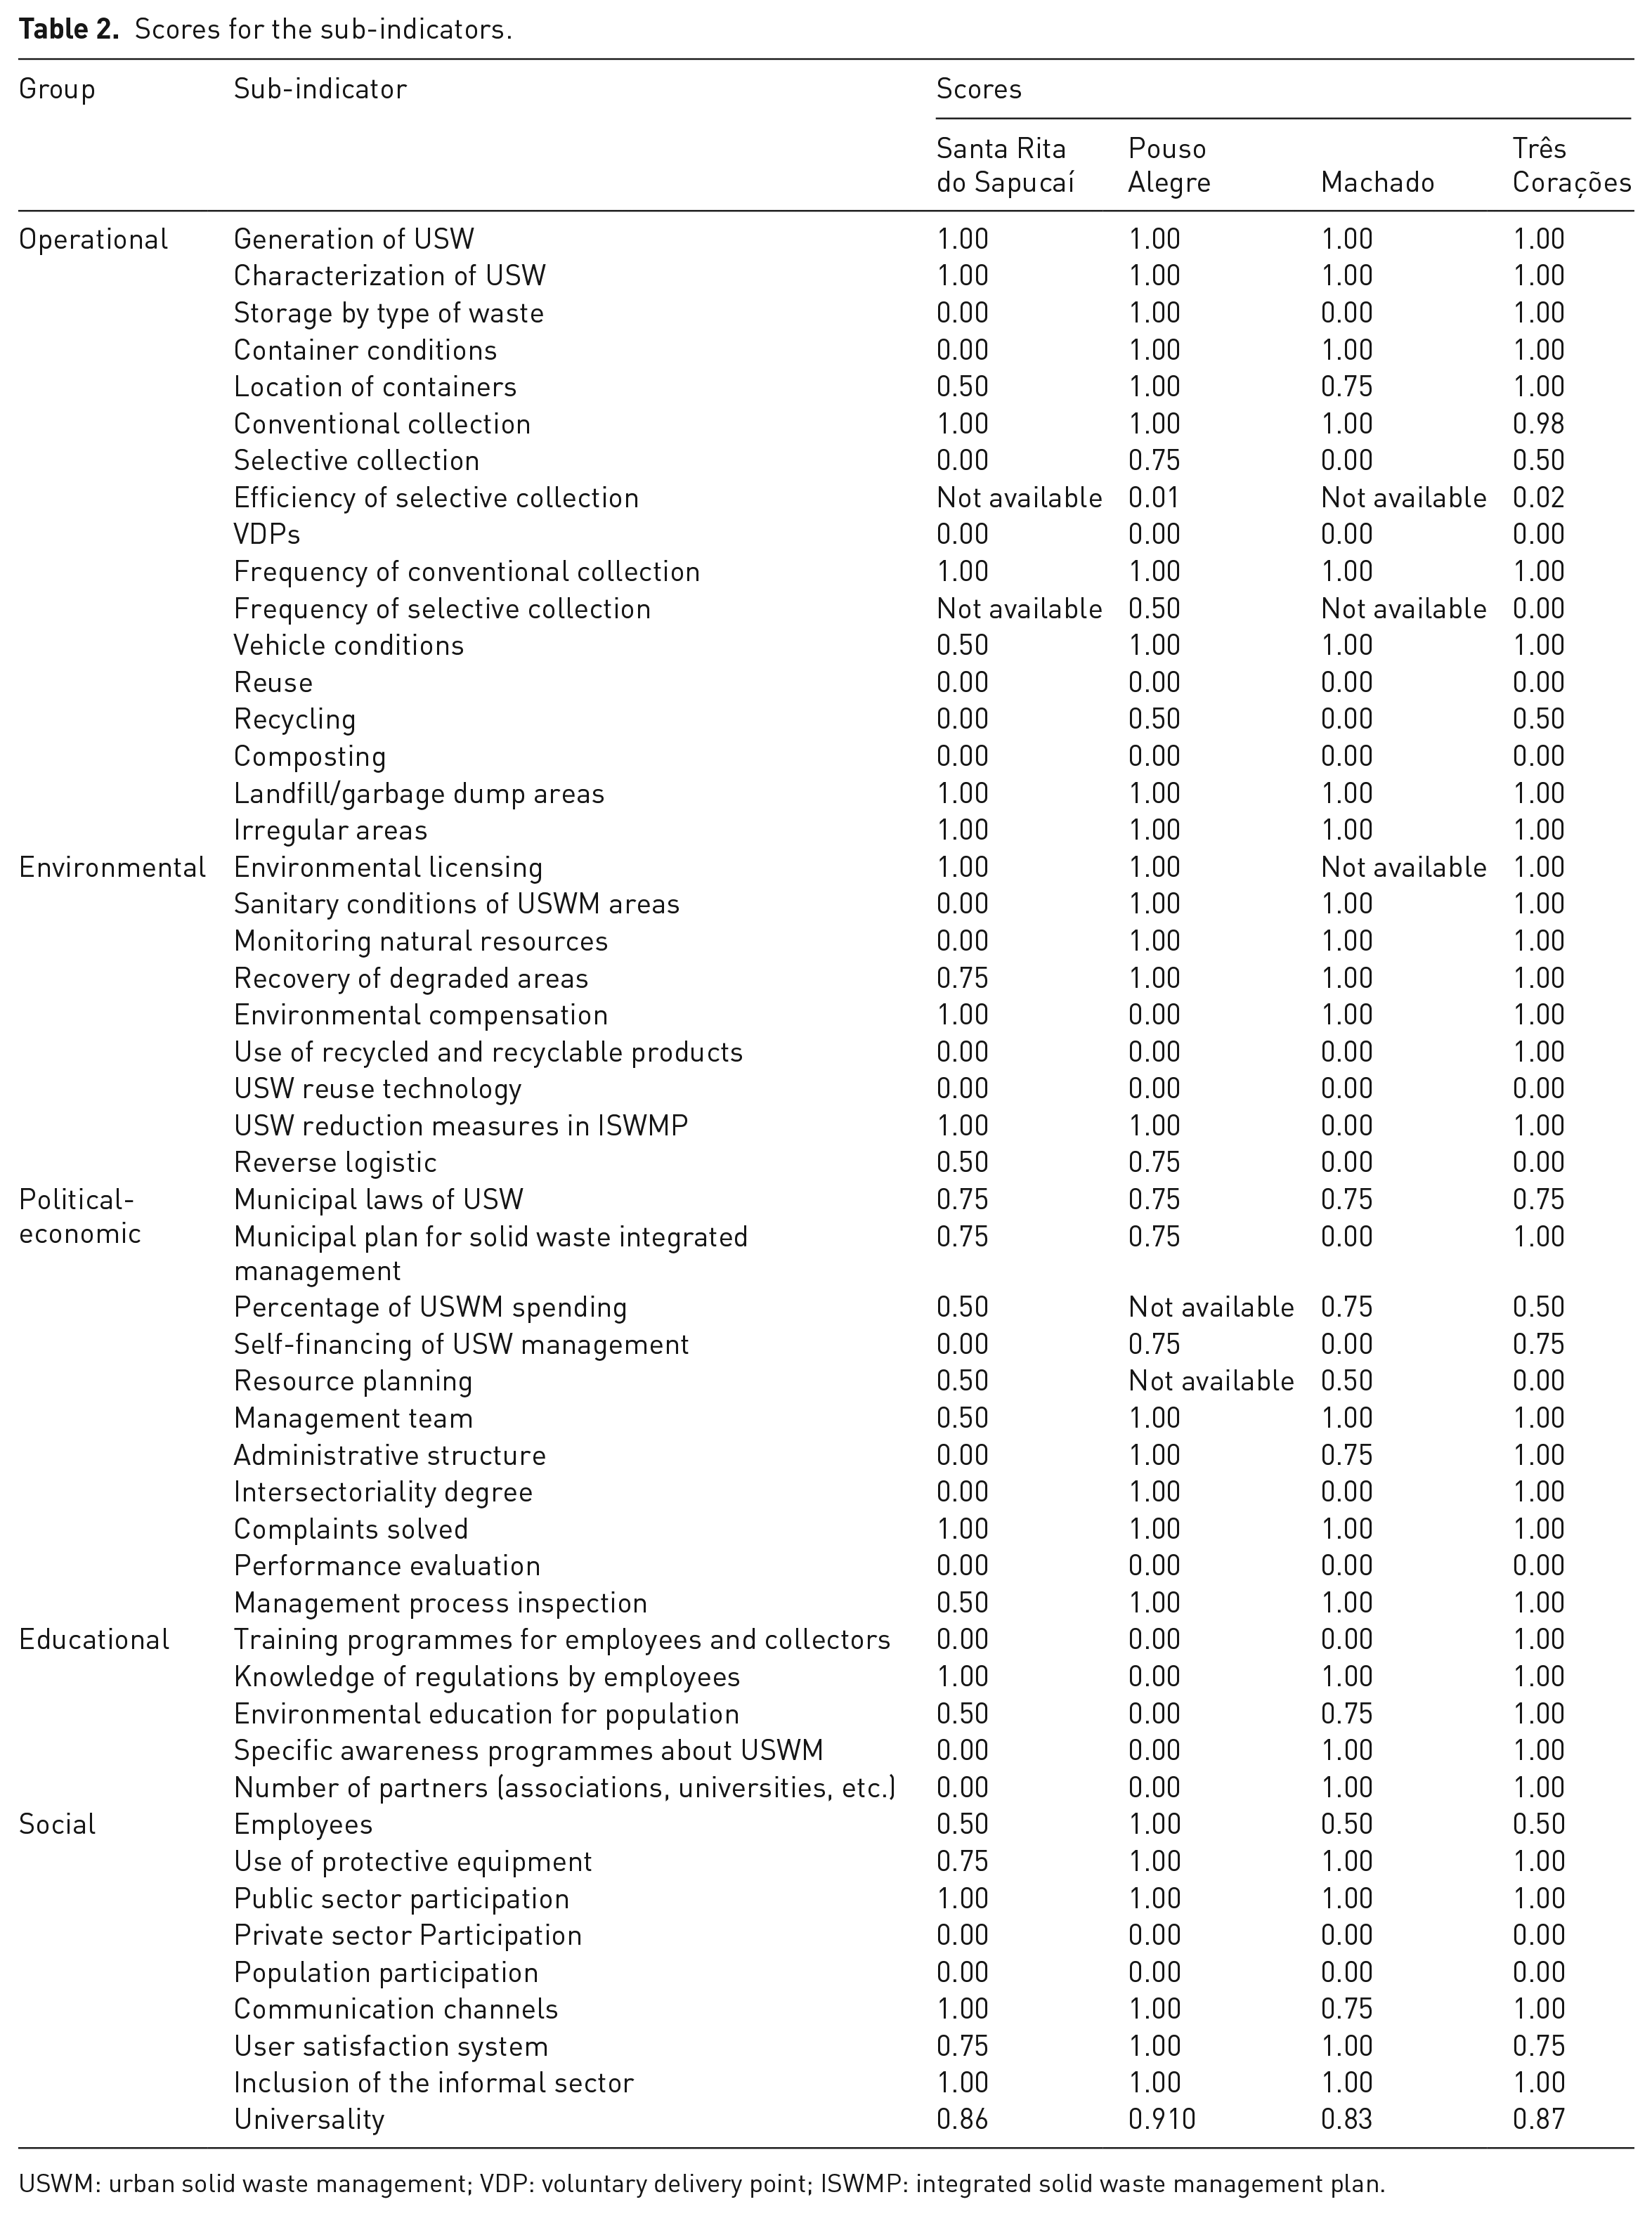
USWM: urban solid waste management; VDP: voluntary delivery point; ISWMP: integrated solid waste management plan.
The values for the indices (groups and global) are shown in Figure 3.
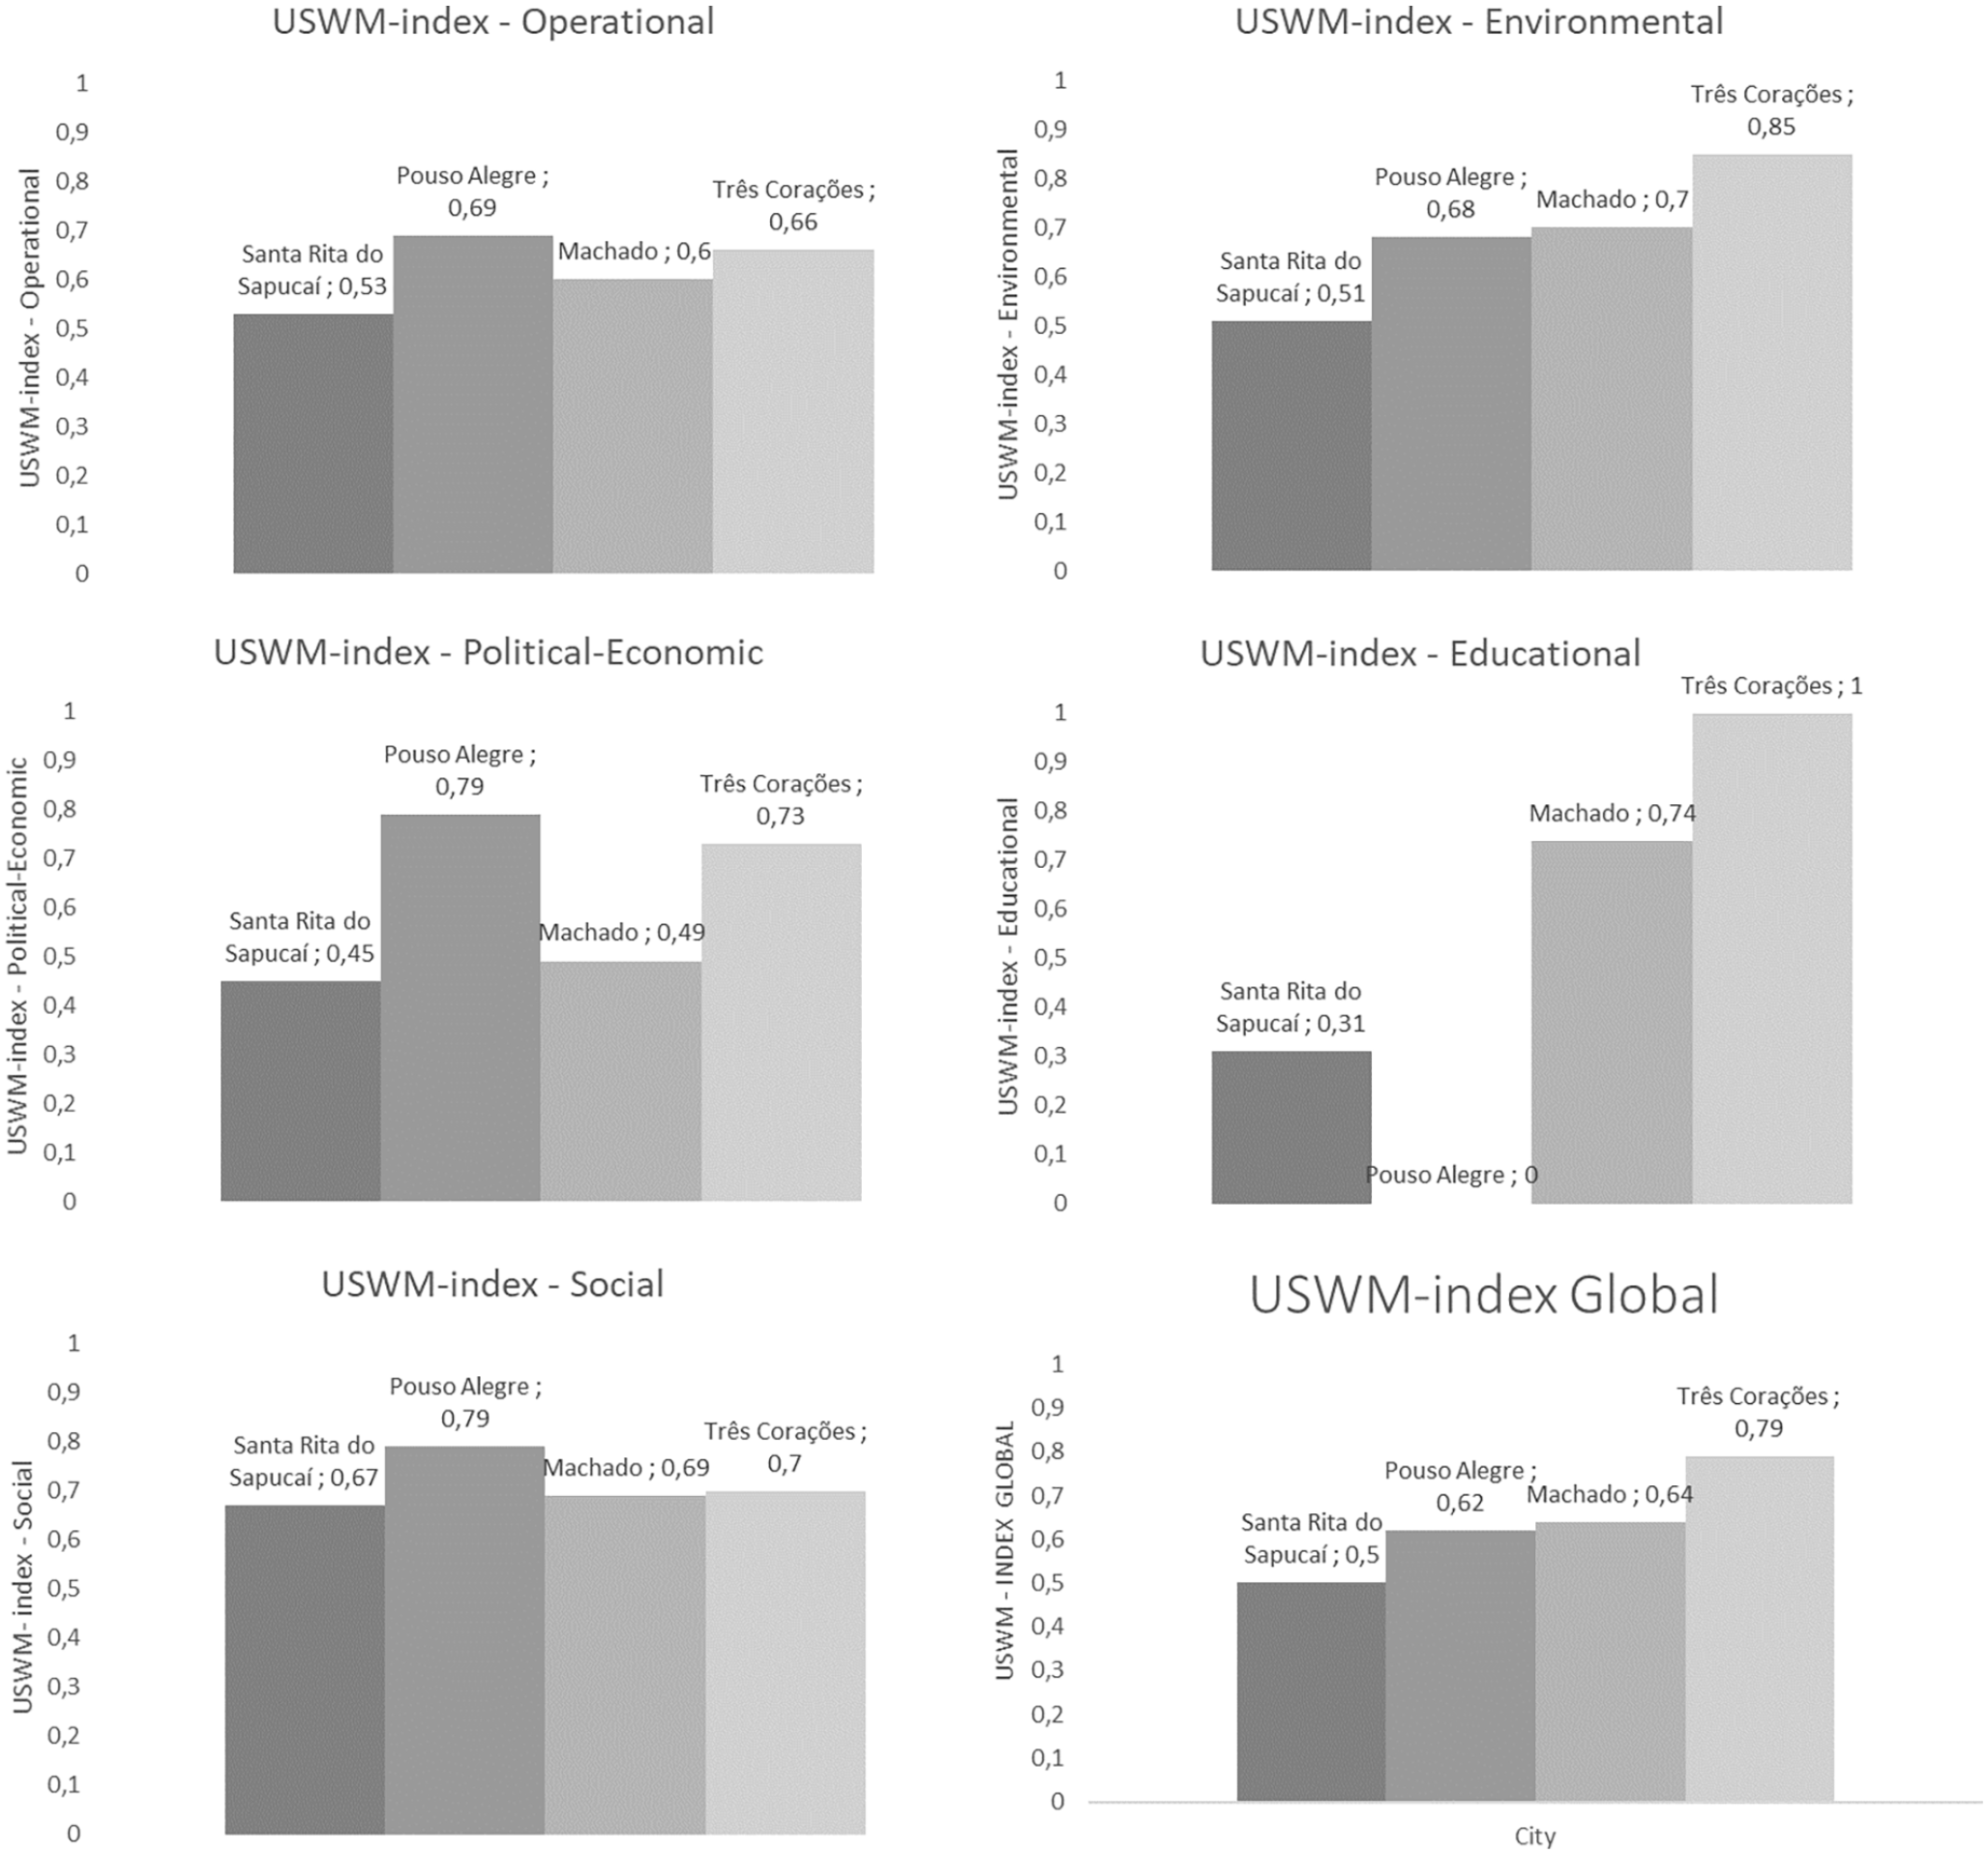
Results of the USWM-index.
The study on the cities showed that they do employ some procedures set forth by Brazilian legislation. The USWM practised by all of the cities were classified as average, according to the USWM-index. The cities have solid waste collection and disposal practices in place; however, they do not have CE initiatives for managing USW.
These USWM-index results are generally justified insofar as there is a consolidated programme for collecting USW using traditional methods. Nevertheless, better selective collection structuring and waste sorting are needed. Furthermore, these cities do not have initiatives in place to encourage reuse, repair or composting. According to Bui et al. (2022), many emerging countries face restrictions to promote the recycling and reuse of materials. These restrictions were noted in the cities studied. Regarding recycling initiatives, only Pouso Alegre and Três Corações had municipal recycling programmes; however, most of the waste that could be recycled is not recycled correctly. Consequently, the cities received low scores for indicators related to sustainable practices in the USWM-index for the environmental group.
Informal pickers are responsible for sending materials for recycling. Siman et al. (2020) state that these pickers play an essential role in CE, ensuring that materials are returned to production cycles. However, structural, financial and strategic improvements are needed in these cities to promote material recovery to the productive chain. Additionally, few recycling companies work with waste pickers in these cities, which is challenging. Even when materials are collected, there is no guarantee that they will be recycled. According to de Sousa Dutra et al. (2018), the fact that few companies work with waste pickers explains the low price paid for materials sold by these collectors.
The informal pickers in these cities are somewhat integrated with the public and private sectors. However, these workers are not provided with safety equipment for doing their jobs. Although the stakeholders involved with USWM say that they participate in the management systems, they do not fulfil the roles outlined by the NSWP. Municipal employees had low knowledge about waste management practices. The private sector does not perform its RL role for special waste (lamps, batteries, electronic waste, etc.). Furthermore, the citizens do not correctly separate their waste. Therefore, city administrations should promote more integration between citizens and the private and public sectors to guarantee sectoral agreements, reduce waste generation and increase the reuse of materials. According to Guarnieri et al. (2020), sectoral agreements are of fundamental importance to enable successful transitions to the CE.
These results show that the cities still need to adapt some goals established in the national policy on solid waste. Furthermore, the results from the USWM-index show that it is challenging to create circular waste management strategies. This study presents circular initiatives that can be applied to USWM in the studied cities to help transition from linear to circular cities. These initiatives have been suggested in CC plans in Circular Glasgow (United Kingdom), Circular Rotterdam (Netherlands), Circular Amsterdam (Netherlands), Circular Paris (France), Be Circular Brussels (Belgium), Circular Prague (Czech Republic) and other European cities. The measures suggested in this study follow the six basic principles established in the ReSOLVE framework (Regenerate, Share, Optimize, Loop, Virtualize and Exchange). Smol et al. (2020), discussed applying the six main ReSOLVE framework principles to waste management.
We suggest creating designated exchanging centres to exchange and share products. This initiative could reduce waste that would have otherwise been sent to landfills. Additionally, product sharing can reduce natural resource consumption and discourage purchasing unnecessary products. Product repair centres for home appliances, furniture and electronic equipment are also needed. It could increase product lifespans by keeping their loop speed low (Smol et al. 2020). Furthermore, new jobs and new businesses could be created and help provided to integrate informal workers into management systems. Therefore, city governments must create exchange centres and actions for repairing and sharing products.
Food waste must urgently be dealt with in the four studied cities. Creating municipal projects for joint actions among producers, distributors, sellers and citizens could significantly reduce the amount of food waste. Food waste reductions are related to changes in consumption habits, as Smol et al. (2020) explained. Therefore, we emphasize the need for creating educational programmes on waste prevention and focus them on food waste prevention. These measures are desperately needed in Pouso Alegre, which obtained zeros for all the sub-indicators related to environmental education. Regarding organic and green waste, they must be sent to compost to close the cycles of these materials. We highlight the need for creating compost plants in these four cities. Furthermore, encouraging composting at home via municipal actions is also needed because this can reduce logistical costs. Using a separate food waste collection bin, followed by biological treatments (home/centralized composting and anaerobic digestion), has been suggested by Tonini et al. (2020) as a possible solution for household food waste management.
Moreover, we suggest that the city governments encourage reducing plastic materials produced in their territories. It can be done through legislation encouraging substituting these materials for sustainable materials. Lastly, cities must create effective RL systems for special waste, like waste from electrical and electronic equipment and lamps. Recycling these materials depends on structures that do not exist in the region, and transport costs can make reverse processes unfeasible (Alves et al., 2021). Municipal consortiums are needed so that materials are not mistakenly sent to landfills or discarded into the environment.
We suggest that future studies conduct action research to aid in implementing the measures suggested in this article. Furthermore, the USWM-index can be adapted by inserting sub-indicators to assess other measures. Indices can be adapted according to the methodology given in Moraes et al. (2022).
Conclusions
This article proposed a tool for assessing USWM in Brazilian cities. It sought to introduce measures to promote CE principles in these cities. In total, 19 indicators and 51 sub-indicators were identified and divided into an Operational group, an Environmental group, an Educational group, a Political-economic group and a Social group. The evaluation tool was named the USWM-index.
The USWM-index was applied to Santa Rita do Sapucaí, Pouso Alegre, Machado and Três Corações cities. All cities presented with average classifications for their USWM. Despite initiatives that comply with NSWP requirements, these management systems are inefficient in promoting recycling, reuse, reducing or composting solid waste. It shows that these city governments do not employ circular principles in their waste management strategies.
Measures were proposed for implementation in these four cities. The main suggestions were creating places for exchanging and sharing products, creating centres for repairing products, preventing food waste, creating educational programmes on waste prevention, encouraging composting, reducing plastic material used and creating effective RL systems for special waste.
Footnotes
Acknowledgements
The authors would like to thank CAPES, CNPq and FAPEMIG, for their financial support to the projects involved in the development of the present study.
Declaration of conflicting interests
The authors declared no potential conflicts of interest with respect to the research, authorship, and/or publication of this article.
Funding
The authors received no financial support for the research, authorship, and/or publication of this article.