
Abstract
Solid waste management (SWM) represents an important issue for small islands. This research evaluates the municipal SWM system of the Pelagian archipelago, in Italy. The research aims to evaluate environmental and econoemic benefits of onsite treatment plants for the valorization of the organic fraction of municipal solid waste. The sizing of the anaerobic digestion (AD) and composting plant was developed, and the characteristics of the plant were used to conduct a cost analysis and an environmental life cycle assessment. The current waste management system (S0) has been compared with the new strategy proposed (S1). Results showed that S1 leads to save more than 250,000 € y−1 due to the avoidance of organic waste final disposal and shipping, determining a payback time of about 7 years. Environmental benefits include a lowering of CO2-eq emission of more than 1100 tonnes per year and a reduction of all the six environmental impacts analysed. The outcomes represent a novel contribution to the scientific literature since the research provides the first comparison of quantitative data about environmental and cost benefits of onsite AD plants in small islands. The research underlines that onsite waste treatment systems are viable options to improve SWM systems in isolated regions.
Keywords
Introduction
Solid waste management (SWM) in Small Island Developing States (SIDS) is challenging (Klöck and Nunn, 2019; Mohee et al., 2015). Building an incineration plant may be not a feasible option in terms of economic advantages but, at the same time, creating a landfill site may be impossible due to land scarcity, environmental standards or reduction of tourism. Moreover, shipping waste to the mainland may seem like the only feasible option, but this choice can also generate economic and environmental costs (Chen et al., 2005; Mohammadi et al., 2021). Tourism is another matter of concern on small islands because it is often the main economic activity (Eckelman et al., 2014) and it causes high variations in resident population (Wang et al., 2021). Therefore, cost and environmental analysis should be conducted to better evaluate feasibility in SWM strategies implementation.
Anaerobic digestion (AD) and composting seem to be the most appropriate technologies for managing municipal solid waste (MSW) in SIDS, due to the high amounts of organic fractions (OF) (Mohee et al., 2015). Although AD and composting plants have been implemented in various remote context (Holder et al., 2019), some studies highlighted their potential for islands (Mosler et al., 2006). For example, the energy potential from AD of organic biomass in Mauritius represents 20.8% of the total electricity generated (Bundhoo et al., 2016). Nevertheless, few studies properly investigated economic and environmental benefits. Joseph and Prasad (2020) conducted a study for eight SIDS exploring the feasibility of waste-to-energy (WtE) compared to landfill disposal with no energy recovery, analysing both environmental and economic impacts. However, AD and composting plants sizing were not included within the analysis and the possibility to ship the MSW to the mainland was not considered.
The focus of this research is the Pelagian archipelago, Italy. Pelagian islands include the islands of Lampedusa (20.2 km2), Linosa (5.4 km2) and the inhabited cliff of Lampione (0.036 km2). The archipelago is not included in the SIDS list, due to its belonging to the Italian State, but its remoteness, tourism vocation and limited availability of space make it a relevant spot where different SWM methods can be compared to support future strategies in similar contexts. International literature provides a few to no information about waste management in small Italian islands, which are facing the same challenges of Pelagian archipelago. Indeed, most of Italian small islands reveal low separate collection efficiency values when compared with the national average (ISPRA, 2021; Legambiente, 2020).
The Pelagian archipelago territory is particularly susceptible of SWM and energy supply issues. Currently, all waste produced on Lampedusa and Linosa is shipped to Sicily, mostly unsorted, where it is processed or disposed of. Two solutions can be suggested: onsite recycling of recyclable materials or reduce the stream of OF by implementing onsite solutions. However, small recycling firms operating on remote islands may have difficulties related both to supplying of recyclables materials and to demand, making local recycling a non-cost-effective solution (Eckelman et al., 2014). For this reason, the focus of the current research is related to the OF municipal solid waste (OFMSW), which can be employed locally by AD or composting plants. The hypothesis behind the research is that local treatment of OFMSW could introduce environmental and economic benefits compared to the current waste management system, also supporting the energy supply system, which, for Pelagian islands, is heavily dependent on fossil fuels (Bommarito et al., 2019).
The novelty of the research is the quantification of environmental and economic benefits of the introduction of onsite SWM alternative treatments in remote contexts. The study would answer two questions: ‘What are the environmental benefits of introducing an AD and composting in remote islands?’ and ‘Is onsite OFMSW treatment economically advantageous in Italy?’ The AD and composting plant were sized, and the estimation of the treatment volumes allowed estimating the operational and capital costs. In addition, an environmental life cycle assessment (LCA) was employed to evaluate the environmental impacts of the system compared to the current scenario. The study conducted can be useful to support local policies in the field of sustainable SWM. At the same time, it shows results that may apply to other context that share similar characteristics, to reveal potentials and promote similar investigations.
Methods
The methodological approach included the sizing of the AD and composting plants and the assessment of economic and environmental impacts. In particular, the research was divided into four main steps:
Data collection and analysis of the context. The assessment was focused on waste production and composition. Data related to 2018 on total waste production was used for the survey. To estimate the amount of MSW monthly produced, the average waste generation in 2014–2015 was collected (Table S1) and it was applied to 2018 total waste production (Table S2).
Plant sizing. AD plant has been sized relying on the OF produced in the municipality (household organic waste and commercial organic waste). The sizing of the AD plant resulted in the definition of the amount of biogas and digestate generated. This information was employed to evaluate the cogeneration and the composting plants.
Cost analysis. The economic analysis included the assessment of capital costs (CapEx) and operational costs (OpEx) of the proposed scenario. CapEx included the construction of the AD plant and the composting plant, whereas OpEx included plant’s operational costs, transportation and gate fees to the final disposal site.
Environmental LCA. It relies on material and energy consumption. Every process was examined to assess the environmental impacts. The proposed scenario (S1) and the current MSW management system (S0) were compared to highlight economic and environmental benefits of an on-site OFMSW treatment plant.
The methodological approaches are described in the following sections. The description of the study area is reported in Table S3.
Waste production
The production of urban waste in the municipality of Lampedusa and Linosa in 2018 was equal to 5723.24 t y−1 (CLL, 2019; ISPRA, 2018). Known the average subdivision of waste generation between the different months in the years 2014–2015 (Table S1), it was possible to apply it to the year 2018, which represent the reference year for the ongoing survey (Table S2). The MSW characterization (Figure 1) allows to estimate the production of organic waste during the year 2018 to about 2100 tonnes, with an average of 175 tonnes per month. Table S4 reports the production of different fractions of MSW in 2018.
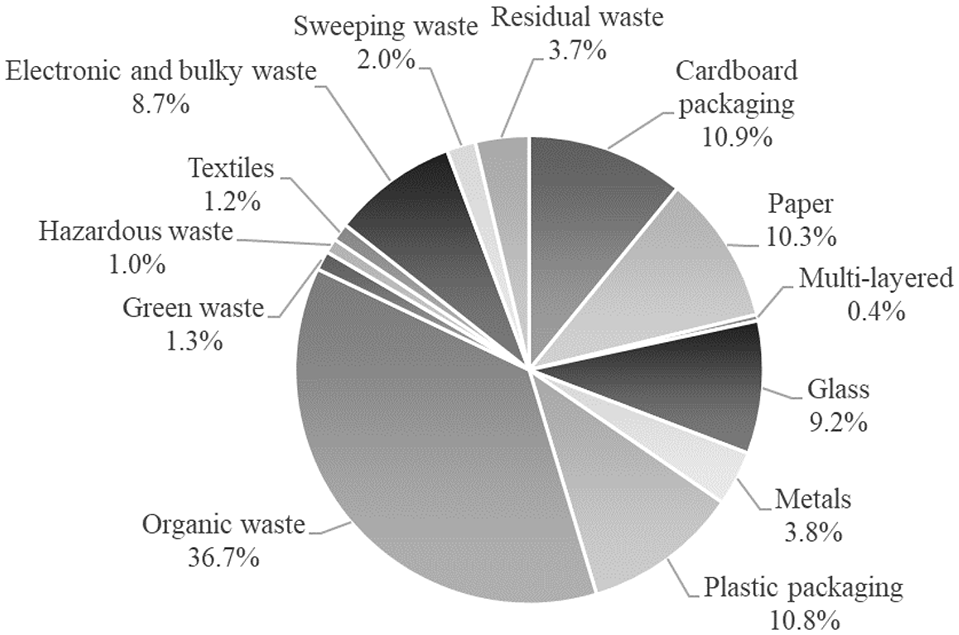
Urban waste fraction analysis – municipality of Lampedusa and Linosa – 2018 (CLL, 2019).
Furthermore, commercial realities on the island are responsible for the additional production of organic waste and wood waste related to fish processing and conservation (fish waste, pallets and wooden boxes). The described production amounts to about 300 tonnes per year of fish waste, according to data for the year 2009 (Attura et al., 2009) and 89.6 tonnes of wood waste (CLL, 2019). As no information regarding the production of waste at various time of the year was given, it was decided to consider it constant and, in the case of waste from fish processing, add it to the amount of OFMSW collected.
Scenario analysis
The baseline scenario considers the SWM system implemented on the island in 2018 (S0). This scenario was compared to a layout that allows the recovery of the OF according to the objectives indicated by the municipal administration: separate collection rate of 80% and OFMSW composting (CLL, 2019) (S1). Different scenarios (i.e., MSW incineration on the mainland) were not considered. The objective of the analysis is to focus the environmental and economic assessment on local opportunities (on-site treatment) for waste valorization. In addition, to avoid environmental impacts, emphasis was given to the reduction of transportation distances, treatment costs and emissions. Treatment processes after temporary storage at a municipal collection centre (MCC) were investigated, comparing the transportation to sanitary landfill (S0) with on-site processing.
Baseline scenario – S0
The SWM involves street containers for mixed collection, and a temporary storage at the MCC. The MSW is shipped to the Sicily Island. The MCC has an extension of about 13,800 m2 and it is located about 2.5 km far from the Lampedusa port. The unsorted waste is conveyed to a trailer used for MSW transfer to the mainland. Then the MSW is disposed of into the sanitary landfill. All organic waste is collected with residual dry waste.
Future scenario – S1
The system involves the separate collection of the OFMSW, and the wood waste. The separate collection rate is estimated to be equal to 80% for organic and green waste, and 90% for wood waste, in accordance with the objectives indicated by the municipal administration for a long-term scenario (CLL, 2019). The OF collected is headed for AD and composting treatments. Before entering the digester, it undergoes a pretreatment process aimed at removing inert materials and reducing material size. The pretreatment equipment consists of a bag opener, a magnetic separator, a disc sieve and a shredder. The AD allows generating biogas and digestate. The scenario considered the combustion of biogas for electric energy generation, and digestate composting after the addition of shredded green and wood waste as structuring materials. Composting material is used locally in the agricultural sector, for the maintenance of public green, and to restore soil natural conditions supporting reforestation actions.
Sizing of the treatment plant
Monthly collection of OFMSW presents a minimum in January (79.6 t) and a maximum in August (229.6 t), when tourism is above average (Table S5). Daily sorted OFMSW was estimated to range between 2.6 and 7.1 t d−1 and the production of fish waste equal to 0.8 t d−1. Figure 2 reports the process flow diagram of the OFMSW treatment plant that is considered to be implemented in S1.
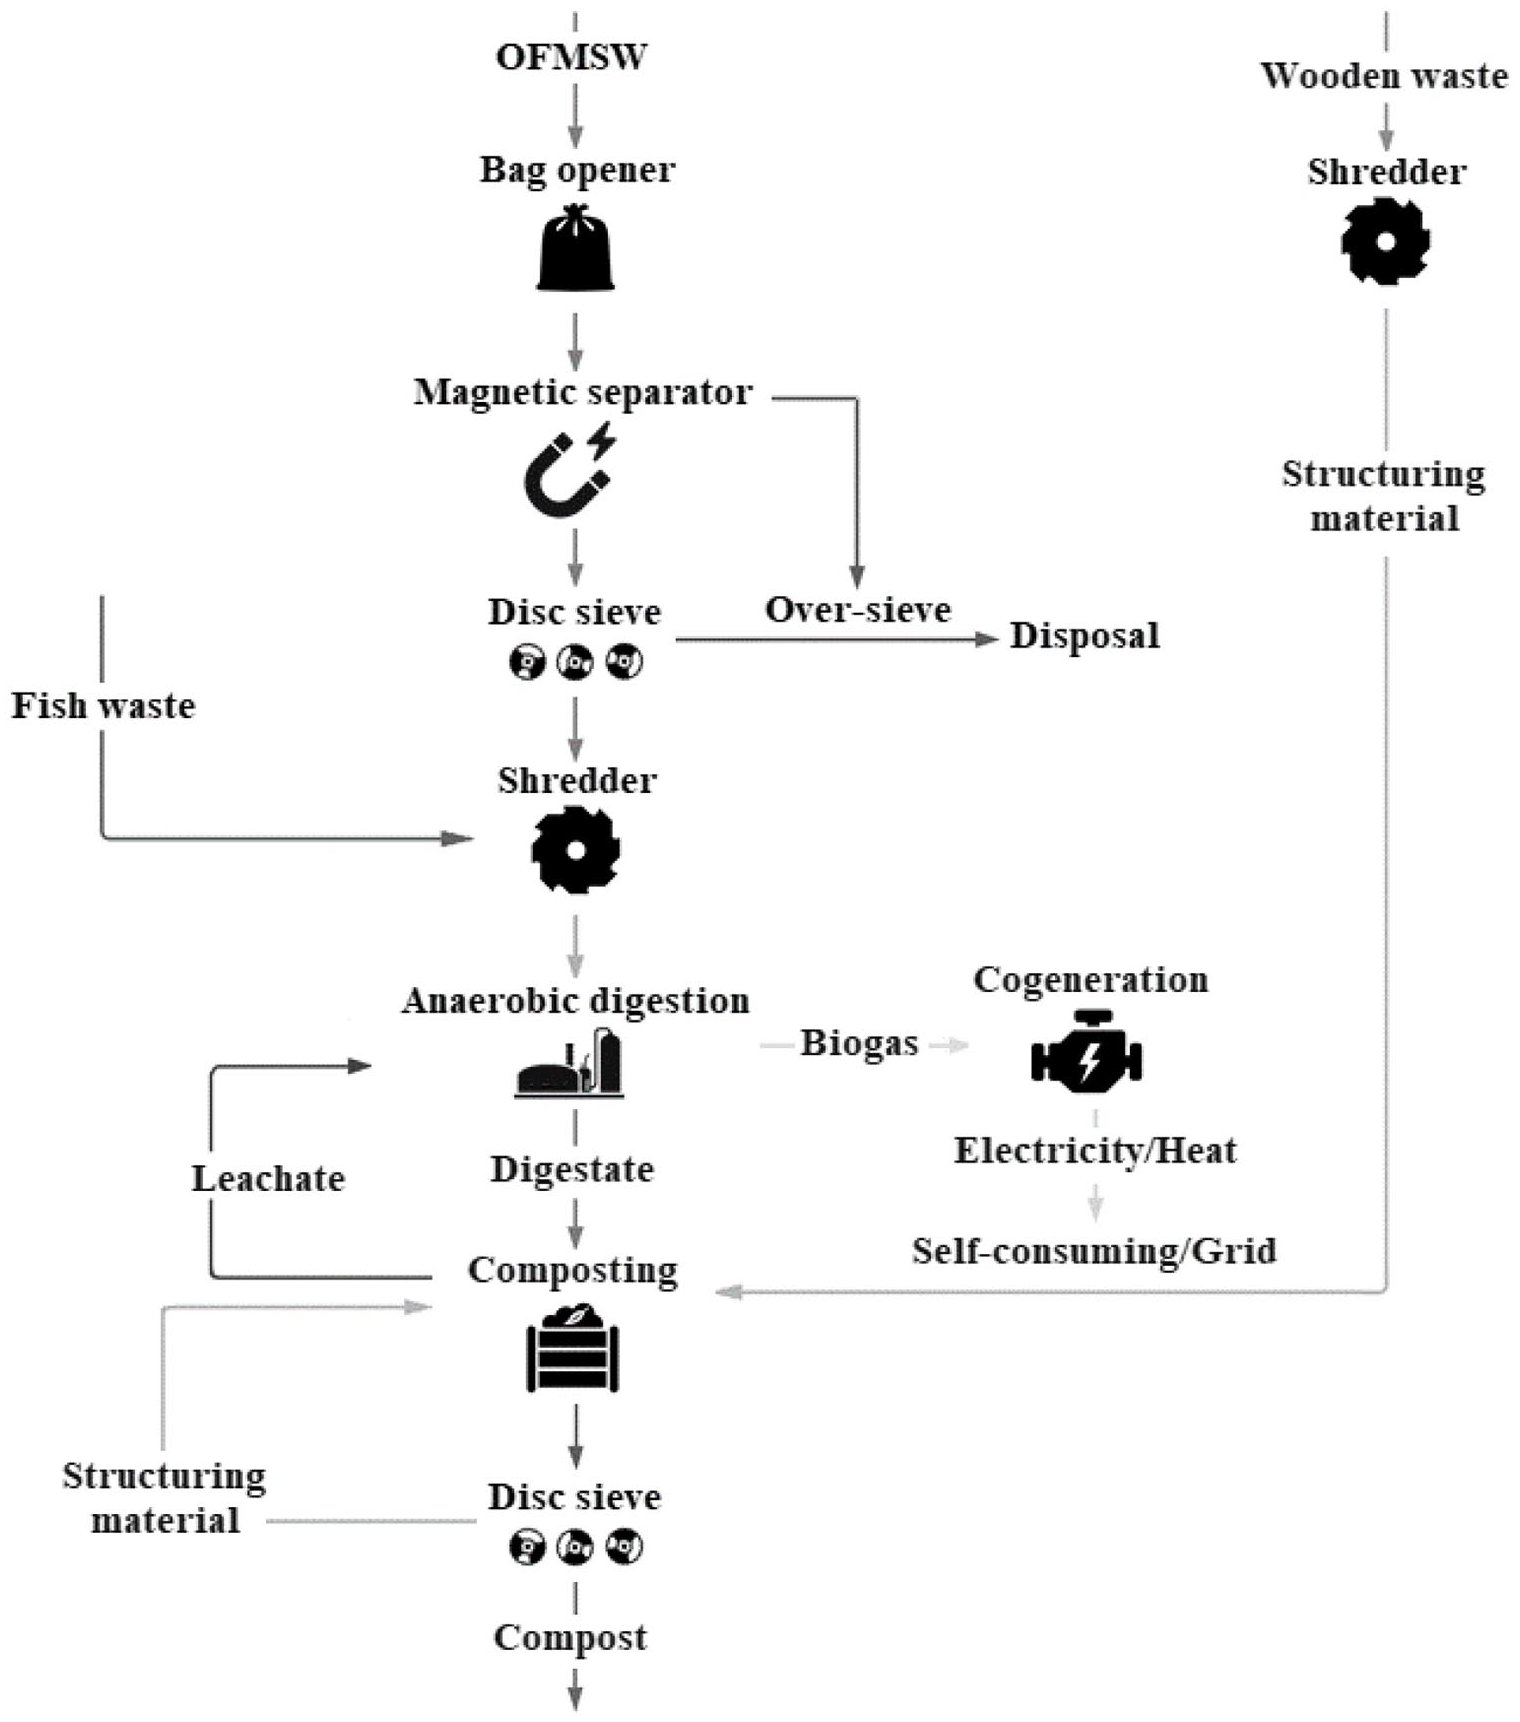
Organic fraction municipal solid waste (OFMSW) treatment flow diagram (S1 scenario).
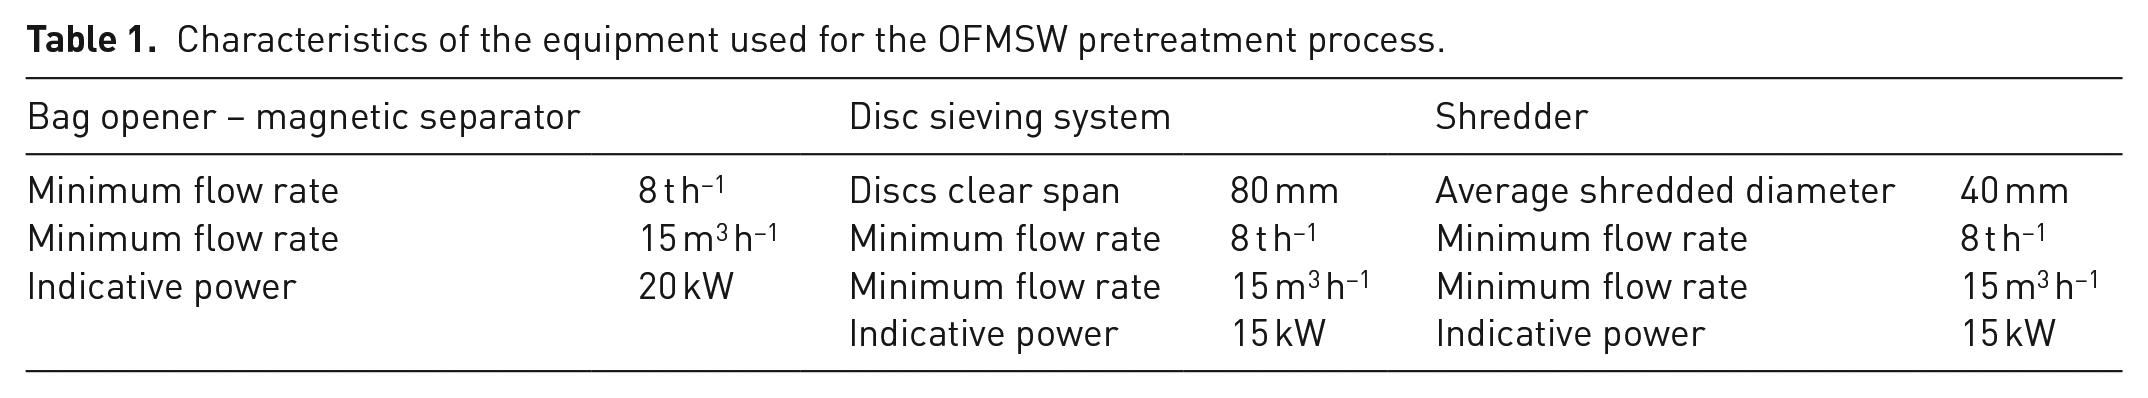
Table 1 shows the machineries necessary for pretreating the selected OFMSW. The choice of the minimum flow rate, and the indicative treatment power, is based on a pretreatment time needed for the input material. The pretreatment time was set to 3 hours to guarantee the maximum amount of waste inflow into the system during the summer period (15 m3 d−1). The pretreatment system determines the production of metallic rejects and an over-sieve fraction to be directed to final disposal, which is estimated to be 3% of the incoming material (ANPA, 2002). The waste stream leaving the pretreatment process varies between 4.4 and 10.7 m3 d−1, considering a density of the flow equal to about 750 kg m−3 (Zamri et al., 2021).
Characteristics of the equipment used for the OFMSW pretreatment process.
Sizing of the AD plant
Data employed for sizing the AD plant are related to the best operational conditions (APAT, 2005; Kothari et al., 2014; Zamri et al., 2021). The input material is characterized by a moisture content of 76% (Rocamora et al., 2020), a percentage of total solids (TS) of 24% and a ratio between total volatile solids (TVS) and TS of 85% (Campuzano and González-Martínez, 2016; Cerda et al., 2018; Dong et al., 2010). The process chosen is conducted in dry conditions in a plug-flow reactor (Kothari et al., 2014). The single-stage reactor is considered to be in a mesophilic regime. The volume of the reactor was calculated using equation (1) (APAT, 2005):

where V (m3) represents the volume of the digestor, TVS are expressed in kg d−1 and OLR is the volumetric organic load. The OLR applied to the reactor was set at 7 kgTVS m−3 d−1 (Kothari et al., 2014). The volume obtained was multiplied by a safety coefficient of 1.1 (APAT, 2005). The calculation was carried out considering the typical inflow rate per month (Table S5). It was assumed that the AD plant was divided into a main treatment line, active throughout the whole year, and an auxiliary line, active during the summer period (Table S6). The total volume employed for the analysis was chosen to contain the total amount of OFMSW inflow per month. Knowing the total volume, it was possible to calculate the monthly hydraulic retention time (HRT) through equation (2) (APAT, 2005):
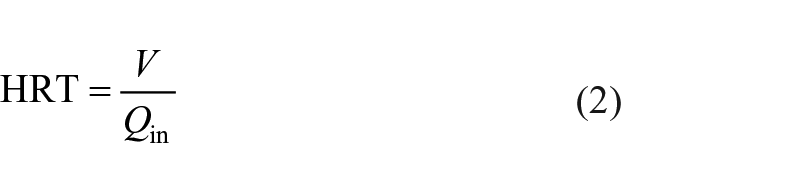
where Qin (m3 d−1) is the input flow in the bioreactor. The HRT value obtained was compared with the typical values of the chosen process: 17–30 days (APAT, 2005; Fongsatitkul et al., 2010; Zamri et al., 2021). The daily biogas production was calculated considering the specific gas production rate equal to 0.6 m3 kgTVS−1 (APAT, 2005; Zamri et al., 2021). Estimating the amount of biogas produced, it is possible to calculate the mass and volume of digestate leaving the AD process through equation (3) (APAT, 2005):
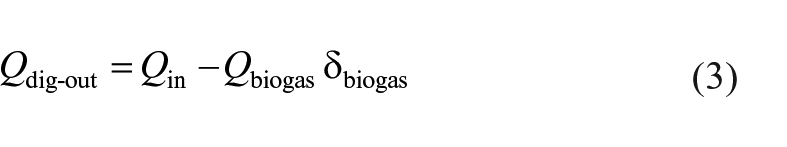
where Qdig-out (kg d−1) is the outflow of digestate from the reactor, Qin (kg d−1) is the OFMSW input flow, Qbiogas (m3 d−1) represents the daily biogas production and
Sizing of the composting plant
The type of plant chosen consists in turning piles, performed through a vehicle equipped with a mechanical shovel. The composting process involves two distinct periods: active composting (AC) and curing (C) (Sayara et al., 2020). After the C phase, a storage (S) period was added. For each phase, the area necessary for material management operations was sized. The stationing period of the material is equal to 30 days for the AC process, 32 days for C and 60 days for S (ANPA, 2002; APAT, 2005).
The green component of organic waste and wood waste produced on the island (Table S7) can be used as structuring material (SM) to lower the substrate moisture, and to fix C/N ratio (ANPA, 2002). The digested material was considered to have a solids content of about 20% (Chen et al., 2019). The optimal range to ensure a faster composting process is a TS value between 35% and 60% and a C/N of 20–30 (Lu and Xu, 2021). To obtain such an optimal characteristic, the SM must represent about 40% by weight compared to digestate (PAT, 2008). A shredder for the SM, defined by an average shredded diameter of 50 mm and an indicative power of 10 kW, is introduced in the process.
The total area covered by the piles was estimated by knowing the total volume of waste inflow into the composting phase, and by calculating the piles’ section and its length. For calculating the area (A) of the pile’s section, equation (4) was used, expressing the surface underlying a parabola with base B (m) and height H (m):

The considered values of B and H are: B = 5 m, H = 2 m for the AC phase; B = 5 m, H = 2 m during C; and B = 4 m, H = 2 m for the S of composted material (ANPA, 2002). The length of the pile for each composting phase was calculated dividing the total volume treated with the section’s area of the pile. The maximum pile length, function of the monthly OFMSW inflow (maximum volume), was considered. A volume contraction factor (VCF) equal to 0.7 for the AC and the C was employed to consider the biostabilization phase occurring in each treatment phase, which contribute to mass and volume reduction. The width of the free perimeter band around each pile, both along the sides and in the heads, was considered equal to 3 m to allow vehicle operations.
Between the finishing phase and the S phase, the material undergoes a sieving process aimed at refining the compost obtained and recovering the SM. The sieve features include a disc clear span of 35 mm and an indicative power of 7.5 kW. This operation leads to estimate the total area covered by the S phase, which is calculated by a VCF estimated to be equal to 0.9 (ANPA, 2002). These estimations allowed obtaining a composted material with density equal to 400 kg m−3 (ANPA, 2002) and a reduction in volume of 50% (Breitenbeck and Schellinger, 2004; Vuai, 2010).
Sizing of the cogeneration plant
The co-generator chosen for S1 is characterized by a power of 75 kW, to guarantee the operation of all the machinery necessary for the treatment of the OFMSW. The biogas consumption associated with the indicated power was estimated to 35 Nm3 h−1. This allowed to determine the number of daily operational hours, considering the specific biogas production. The amount of electricity generated was calculated considering a self-consumption of the AD plant estimated at 15% and using reference parameters that involves the use of the heat produced during biogas combustion for heating the digestors. The amount of electric energy produced by the system is also partially used to power the pretreatment and composting plant. To estimate the amount of electricity absorbed by the pretreatment and composting plants, a consumption of 300 kWh day−1 was deemed.
Economic analysis
The characteristics of the plant were used to implement a costs analysis. Capital expenditures (CapEx) data were mainly collected from the technological solutions available on the market. Operational expenditures (OpEx) data were collected from literature analysis (ANPA, 2002; di Dio et al., 2015), report of the local municipality (CLL, 2019; UTC, 2017) and the investigation of existing plants at national level. The economic analysis does not consider the collection phase (kerbside collection), focusing on the SWM after its temporary storage at the MCC. In addition, CapEx and OpEx of compactor trucks and labour costs are not considered within the analysis since they have been assumed equal for both scenarios considering that the S1 method would reduce the number of employees involved in the transportation of waste to the mainland, who could be employed in the local treatment system.
CapEx
CapEx are equal to zero for S0, due to the absence of capital investment. The expected costs for S1 include the construction of the AD and the composting plant. The expected costs for the pretreatment process covers the purchase of the equipment: bag opener, disc sieve, conveyor belt, magnetic separator and shredder. Typical CapEx of an AD plant (Italian market) were considered equal to €20,000 kW−1 installed. Finally, building the composting plant involves CapEx for the construction of the roof (€180 m−2) and for the purchase of the vehicle equipped with a mechanical shovel (€120,000). For the purpose of comparison between the two scenarios, CapEx for the construction of pretreatment, AD and composting plants of scenario S1 was divided for the plants’ lifespan, estimated at 20 years, and added to OpEx costs, exposed in € y−1.
OpEx
OpEx related to S0 includes the transfer of mixed waste from the MCC to the disposal site in Sicily. The route involves the transit of a truck from the MCC to the port of Lampedusa (2.5 km). The truck is then transferred to Porto Empedocle, Sicily. The distance between the port and the disposal site is 25 km. The cost for the round-trip transfer by ship is €754.5, which can be converted to about €33 t−1 if divided for the truck’s capacity: 22.8 tonnes, while the cost for final disposal into the sanitary landfill is equal to about €133 t−1. The unit cost for road transport was estimated at €0.5 km−1.
The analysis was completed including the share of commercial wood material and the waste from park maintenance. In particular, wooden packaging from the commercial sector can be sold. Therefore, they involve revenues, and their disposal can be profitable. The revenue provided is €3.80 t−1 (CLL, 2019). The distance between seaport and the recovery site of the commercial woody fraction was set at 16 km. Green waste is disposed of into the sanitary landfill. To estimate the number of trucks monthly filled by the OFMSW, reference was made to the maximum capacity that can be contained by the vehicle, equal to about 22.8 t.
Expected OpEx for S1 includes management and maintenance costs of the plants and the disposal to sanitary landfill of the over-sieved materials produced during the pretreatment process. Costs for landfilling are the same exposed for S0 whereas management and maintenance costs were estimated trough a literature review (ANPA, 2002). S1 foresees revenues generated from the sale of electricity and compost. The annual revenue from the sale of the surplus of electricity can be calculated by multiplying the amount of energy fed into the grid by the unitary all-inclusive tariff. This coefficient was set at €0.22 kWh−1 (di Dio et al., 2015). For compost valorization, an average price of about €10 t−1 was used.
Life cycle assessment
Goal and scope definition
Environmental LCA was conducted both for S0 and S1. The system boundaries involve, for S0, MSW storage at the MCC, transportation to the mainland of Sicily and disposal into the sanitary landfill located on the same mainland. For S1, system boundaries also involved plant constructions and operation, OFMSW treatment and application of the compost on the island of Lampedusa. The LCA does not consider the kerbside collection phase. The functional unit is related to the amount of waste generated in 1 year. Figure 3(a) highlights the system boundaries for the LCA and the waste flow (Figure 3(b)) related to S0 and S1.
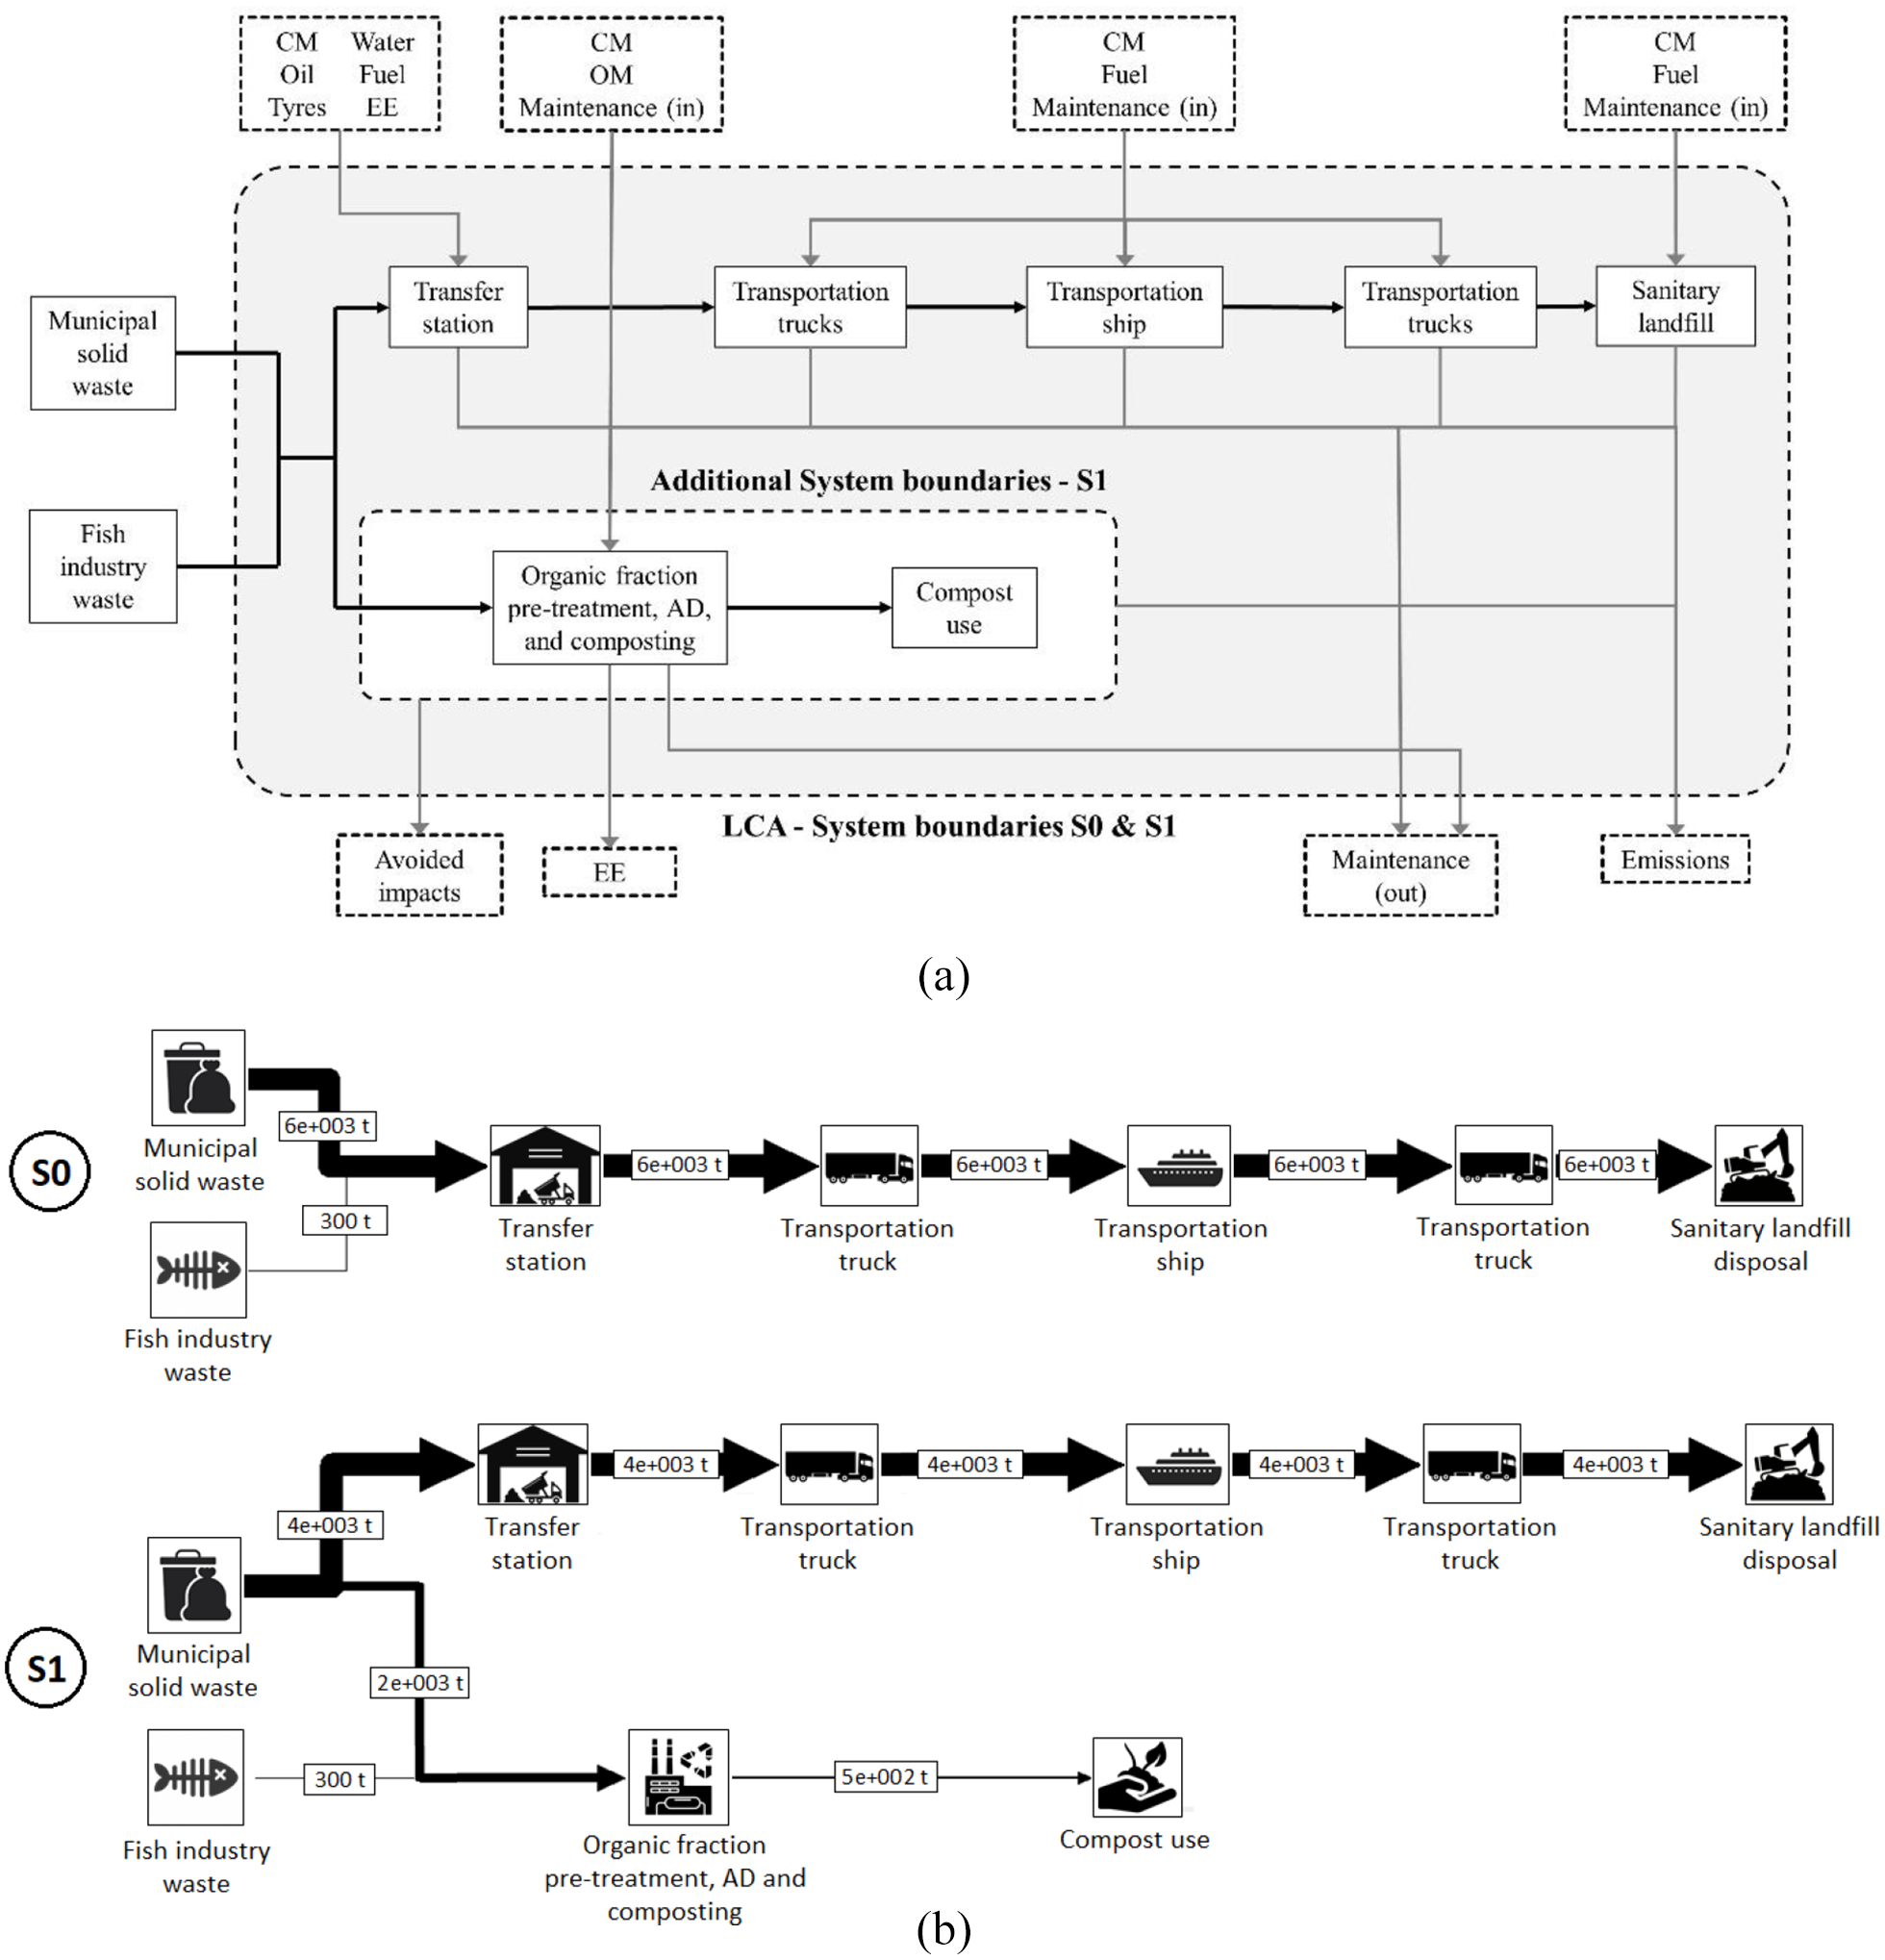
(a) LCA system boundaries and (b) S0 and S1 waste flows.
Geographical boundaries include the Pelagian archipelago and the mainland Sicily, Italy. The reference year for the analysis is 2018. The database from the WRATE v.4 software developed by Golder Associates was used, which use database of European technologies and infrastructures. Six environmental impacts indicators were evaluated: global warming potential (GWP) (kgCO2-eq), acidification potential (AP) (kgSO2-eq), eutrophication potential
Life cycle inventory
Primary and secondary data were considered. Primary data were collected from local reports and interviews to local stakeholders, and they refer to the amount of waste generated, waste characterization, the characteristics of the AD treatment plant and the main information related to the transportation trucks and ships. Secondary data were collected from the scientific literature, as well as from the WRATE v.4 database. In particular, due to the unavailability of primary data related to the construction and operation of the treatment plant and vehicles, the WRATE v.4 database was used. To properly model the management systems, the waste composition (Figure 1) refers to the MSW produced in the municipality. It was assumed that electricity is exclusively generated by local thermal plants, which use diesel.
For material and energy consumption during the processes, WRATE v.4 database was used. Inventory of the MCC storage process is set out in Table S8. Tables S9 and S10 contains the inventory for the truck transportation and shipping. Table S11 reports the inventory analysis of the OFMSW treatment plant. Sanitary landfill main characteristics are reported in Table S12, while Table S13 shows the main features of the various phases of the scenarios.
For S1, avoided impacts include the replace of chemical fertilizers that would be used on the island. The amount of compost that contributes to the avoidance of the calculated impact represents only the part of material that is used on agricultural land and for public green maintenance, estimated at 20% of the compost produced. The remaining 80% could also be very useful on the island because of the poorness of free uncultivated soils. However, this percentage was not considered in the LCA because it would not be used to replace chemical fertilizers. Table S14 shows the replacement rate of the compost produced in terms of bark chips, peat at mine, nitrogen, potassium and phosphorus.
Results interpretation
The interpretation of the results involves the comparison between the environmental indicators considered. This phase was conducted through the normalization method, which estimates the results into European person equivalent (EP). S0 and S1 were therefore compared considering all the environmental indicators to analyse which impact can be reduced (or increased) assuming the transition from the current SWM system (S0) to the future scenario (S1). Finally, in order to quantify the importance to introduce an AD plant to generate renewable energy on islands where Diesel engines are employed for electricity production, the source of energy generation with a 100% non-renewable energy production with fossil fuels was compared with the mainland electricity mix, which counts more than 30% of renewable energy. The scenarios with mainland electricity mix were indicated with S0* and S1* and was compared with the variation obtained from S0 to S1.
Results
Treatment plant attributes
AD and cogeneration plant
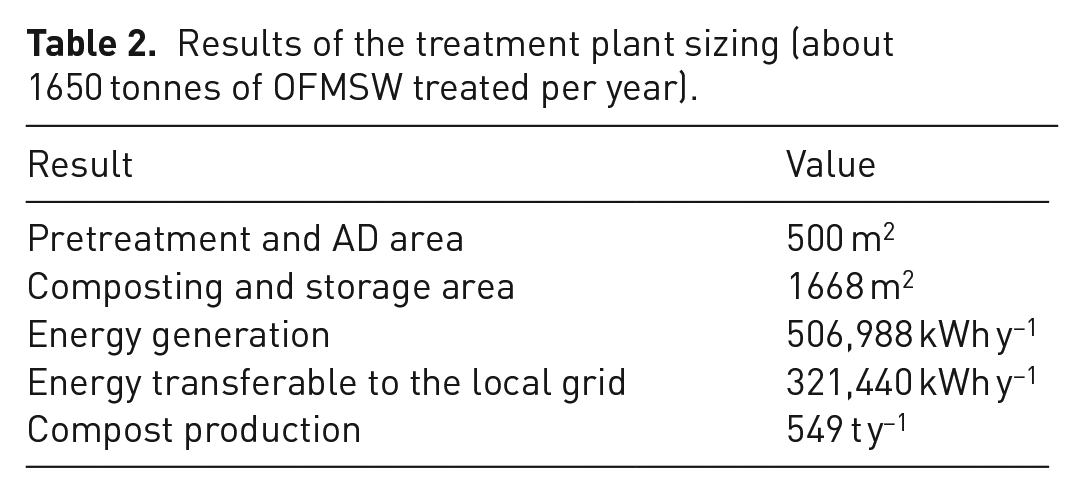
The sizing process of the AD plant led to define the volumes employed for the digestion phase, assuming the implementation of a main treatment line and an auxiliary line active only during the summer months (Table S6). Both reactors feature a volume of 150 m3, determining a total treatment volume of 300 m3 from June to September. The average value of the HRT was calculated to be 29 ± 4 days. Biogas production ranges from 406 to 980 m3 d−1. The operational time of the co-generator is equal to 6760 hours, guaranteeing the production of about 507 MWh y−1. The share allocated to self-consumption of the AD plant is equal to about 76 MWh y−1, while the energy used by the pre-treatment and composting plants is equal to about 110 MWh y−1. The amount of energy transferable to the electricity grid is therefore equal to about 321 MWh y−1. This amount of energy is enough to provide the energy demand of all the public and government buildings as well as of the water lifting system of the aqueduct (Fiorentino et al., 2018). The digestate flow ranges from 2827 kg d−1 (2.8 m3 d−1) to about 6831 kg d−1 (6.8 m3 d−1). Consequently, the mixture flow of digestate and SM varies between 3959 kg d−1 (5.1 m3 d−1) and 9564 kg d−1 (12.3 m3 d−1).
Composting plant
The volume of material that undergoes the AC phase ranges between 152 m3 in January and 368 m3 in August (Table S15). The C phase involves a treated volume that varies from 114 to 256 m3, and the S area receives a total maximum volume of 324 m3 in August. Compost production amounts to 549 t y−1, with an average of 46 t per month, determining a weight reduction to 30% of the initial weight entering the AD treatment. The areas required for the different stages of the composting process are respectively 607 m2 for AC, 453 m2 for the finishing phase and 608 m2 for S of the material. Table 2 summarizes the main results of the sizing procedure.
Results of the treatment plant sizing (about 1650 tonnes of OFMSW treated per year).
Cost analysis
S1 treatment plant requires an investment cost of about €2,262,000. Investments for the construction of pretreatment plant, AD plant and composting plant weight respectively 11%, 66% and 23% on total CapEx. In the pretreatment plant costs, the bag opener, the shredder and the disc sieve are the most expensive equipment (Table S16). AD plant costs are mainly determined by prefabricated components supply and reactor construction. These cost items represent 90% of total AD CapEx, which amounts to €1,500,000. The greater investments related to the composting plant refers to the construction of the roof (58%) and the purchase of the vehicle equipped with a mechanical shovel (23%). Total OpEx amount to €735,743 y−1 for S1 and include €60,000 y−1 for the running of the treatment plant for the OFMSW and €675,743 y−1 for the management and disposal of the unsorted dry waste.
Figure 4 reports the annual costs of the two scenarios analysed. The overall annual expense related to S1 is equal to €772,636 y−1. S0 determines an annual cost equal to €1,011,870 y−1. Therefore, S1 cause a yearly save of about 24%. Landfill disposal is the prevailing factor in terms of economic impact for both scenarios and its partial avoidance in S1 is the main source of costs reduction. The sale of electricity represents 30% of total savings, whereas the sale of compost is equal to 2% of total savings. The partial avoidance of ship transport generates a saving of almost €70,000 y−1, comparable to the sale of electricity. Considering the difference between OpEx for S1 and S0, and the earnings from the sale of electricity and compost, the payback time of the initial investment can be estimated to about 7 years.
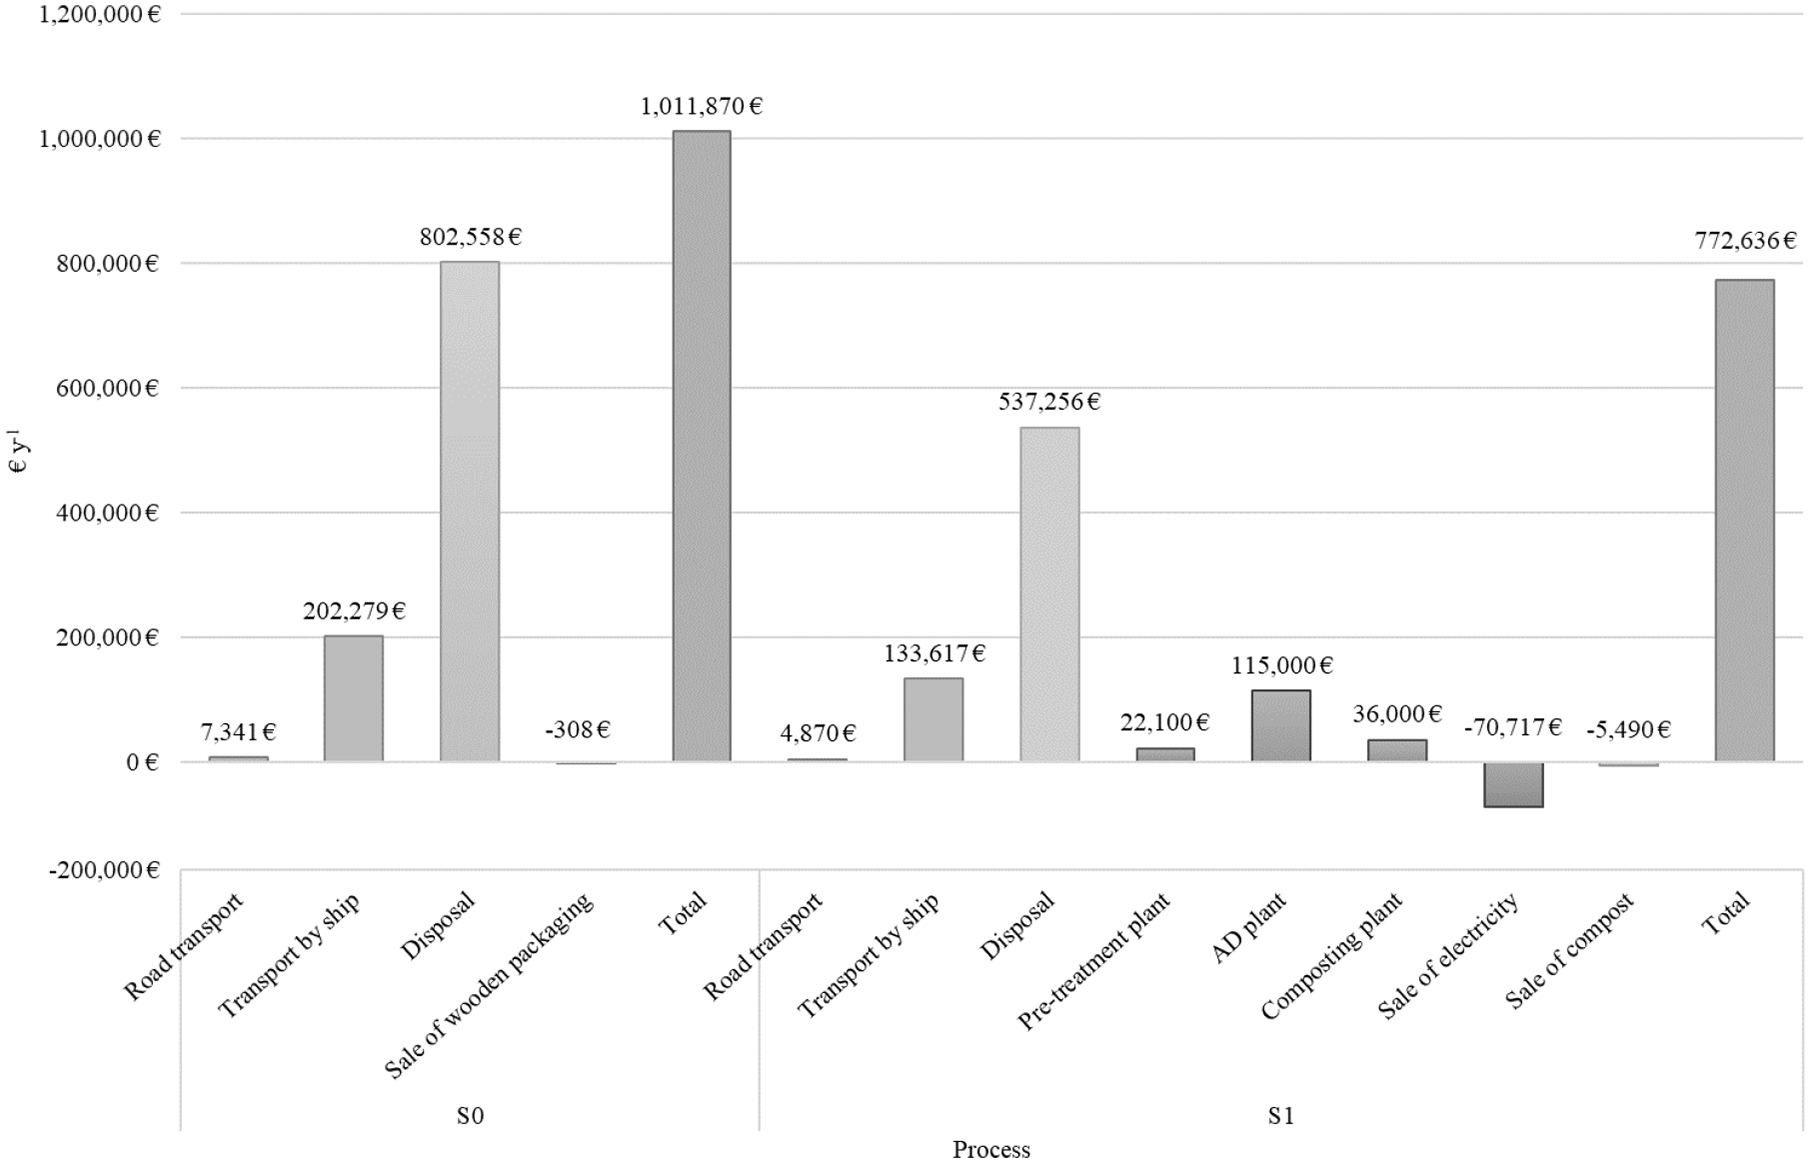
Cost analysis (yearly expenses). Comparison between scenario S0 and S1.
Environmental impacts assessment
Normalization
Figure 5 shows the normalization of the environmental impacts assessed for each indicator. Results are expressed in EP. Total impact of S0 can be quantified with 316 EP, whereas S1 is equal to 105 EP, leading to reducing the total impact of about 67%. GWP represents the most impactful indicator, contributing respectively for 68% and 122% of total impact for S0 and S1. AP and depletion of abiotic resources presents the most marked variations between S0 and S1, with a reduction of 172% and 255% respectively. The transition from S0 to S1 also generates a reduction of GWP equal to 40%. Also, eutrophication potential, FWAEP and HTP expressed a reduction.
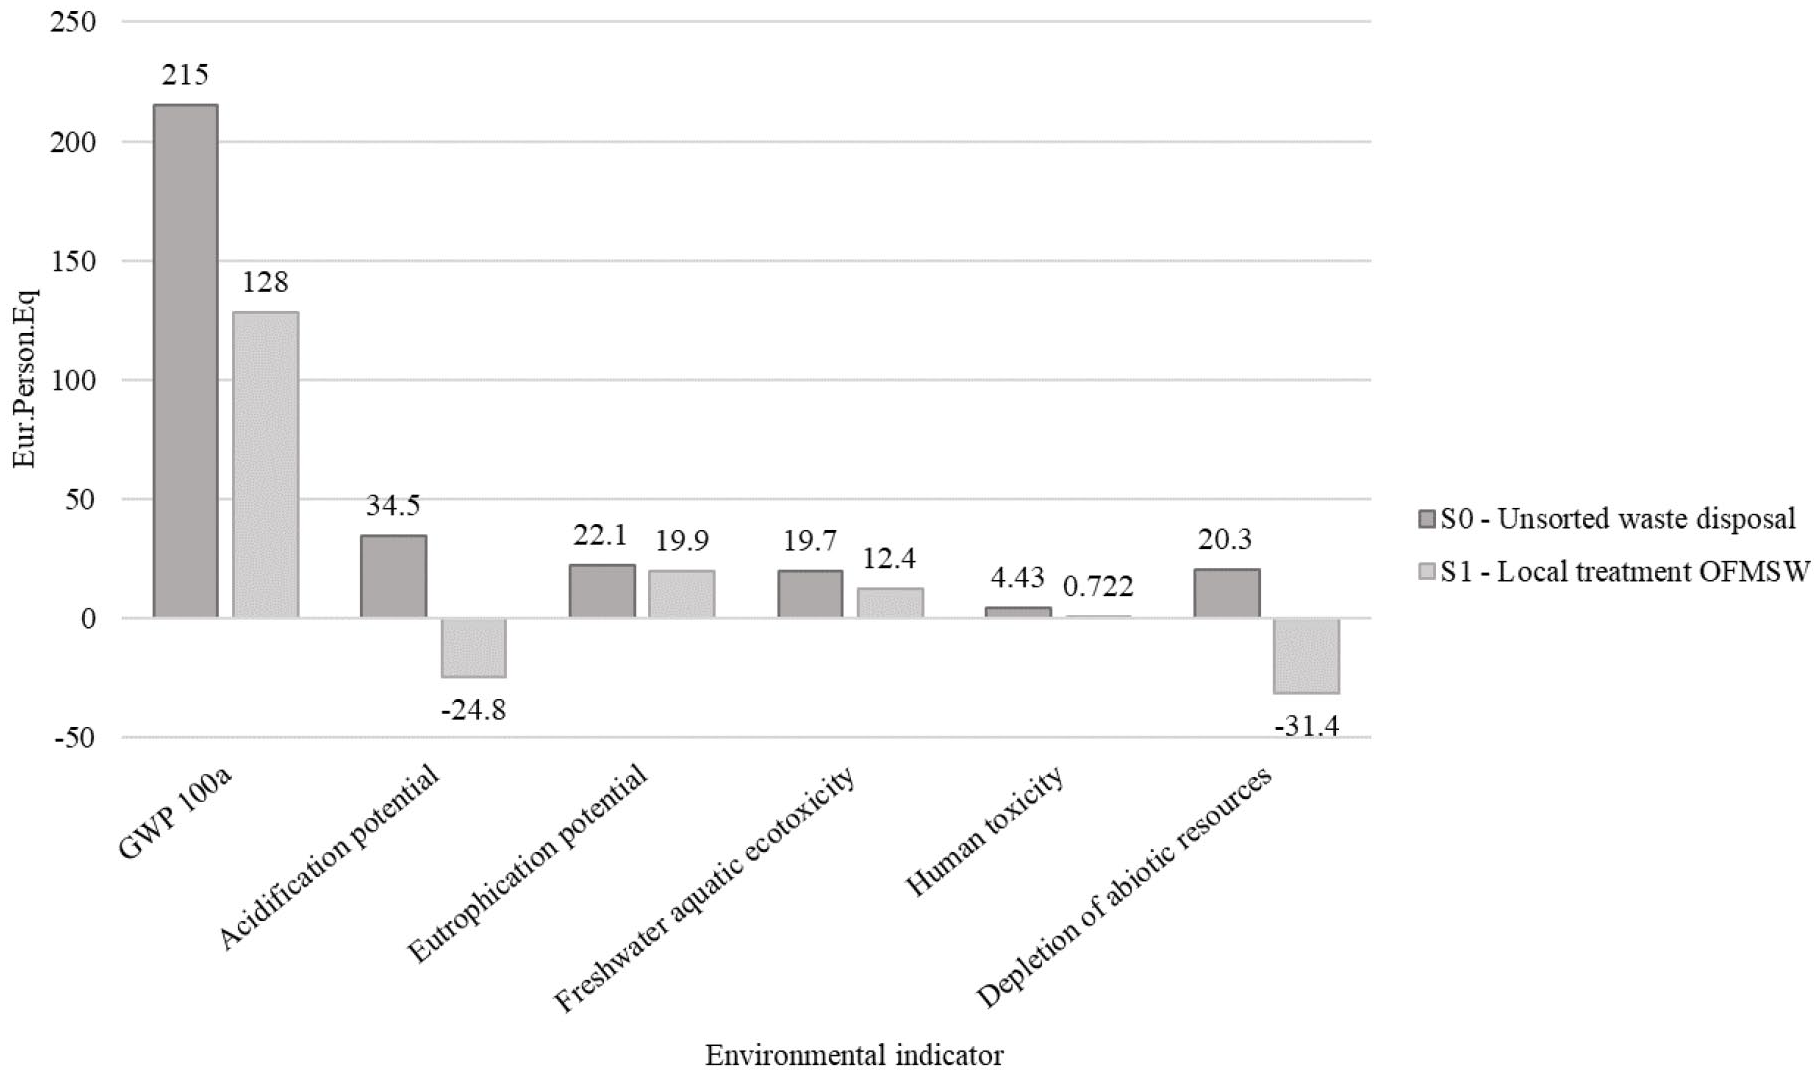
Environmental impact assessment. Comparison between S0 and S1 (normalization in EP).
Contribution analysis
In Figure 6, the contribution of the impact assessed trough the LCA is reported. S1 involves a lowering of CO2-eq emission of more than 1100 t y−1. Eutrophication potential, FWAEP and HTP impacts for S1 present a reduction of respectively 41
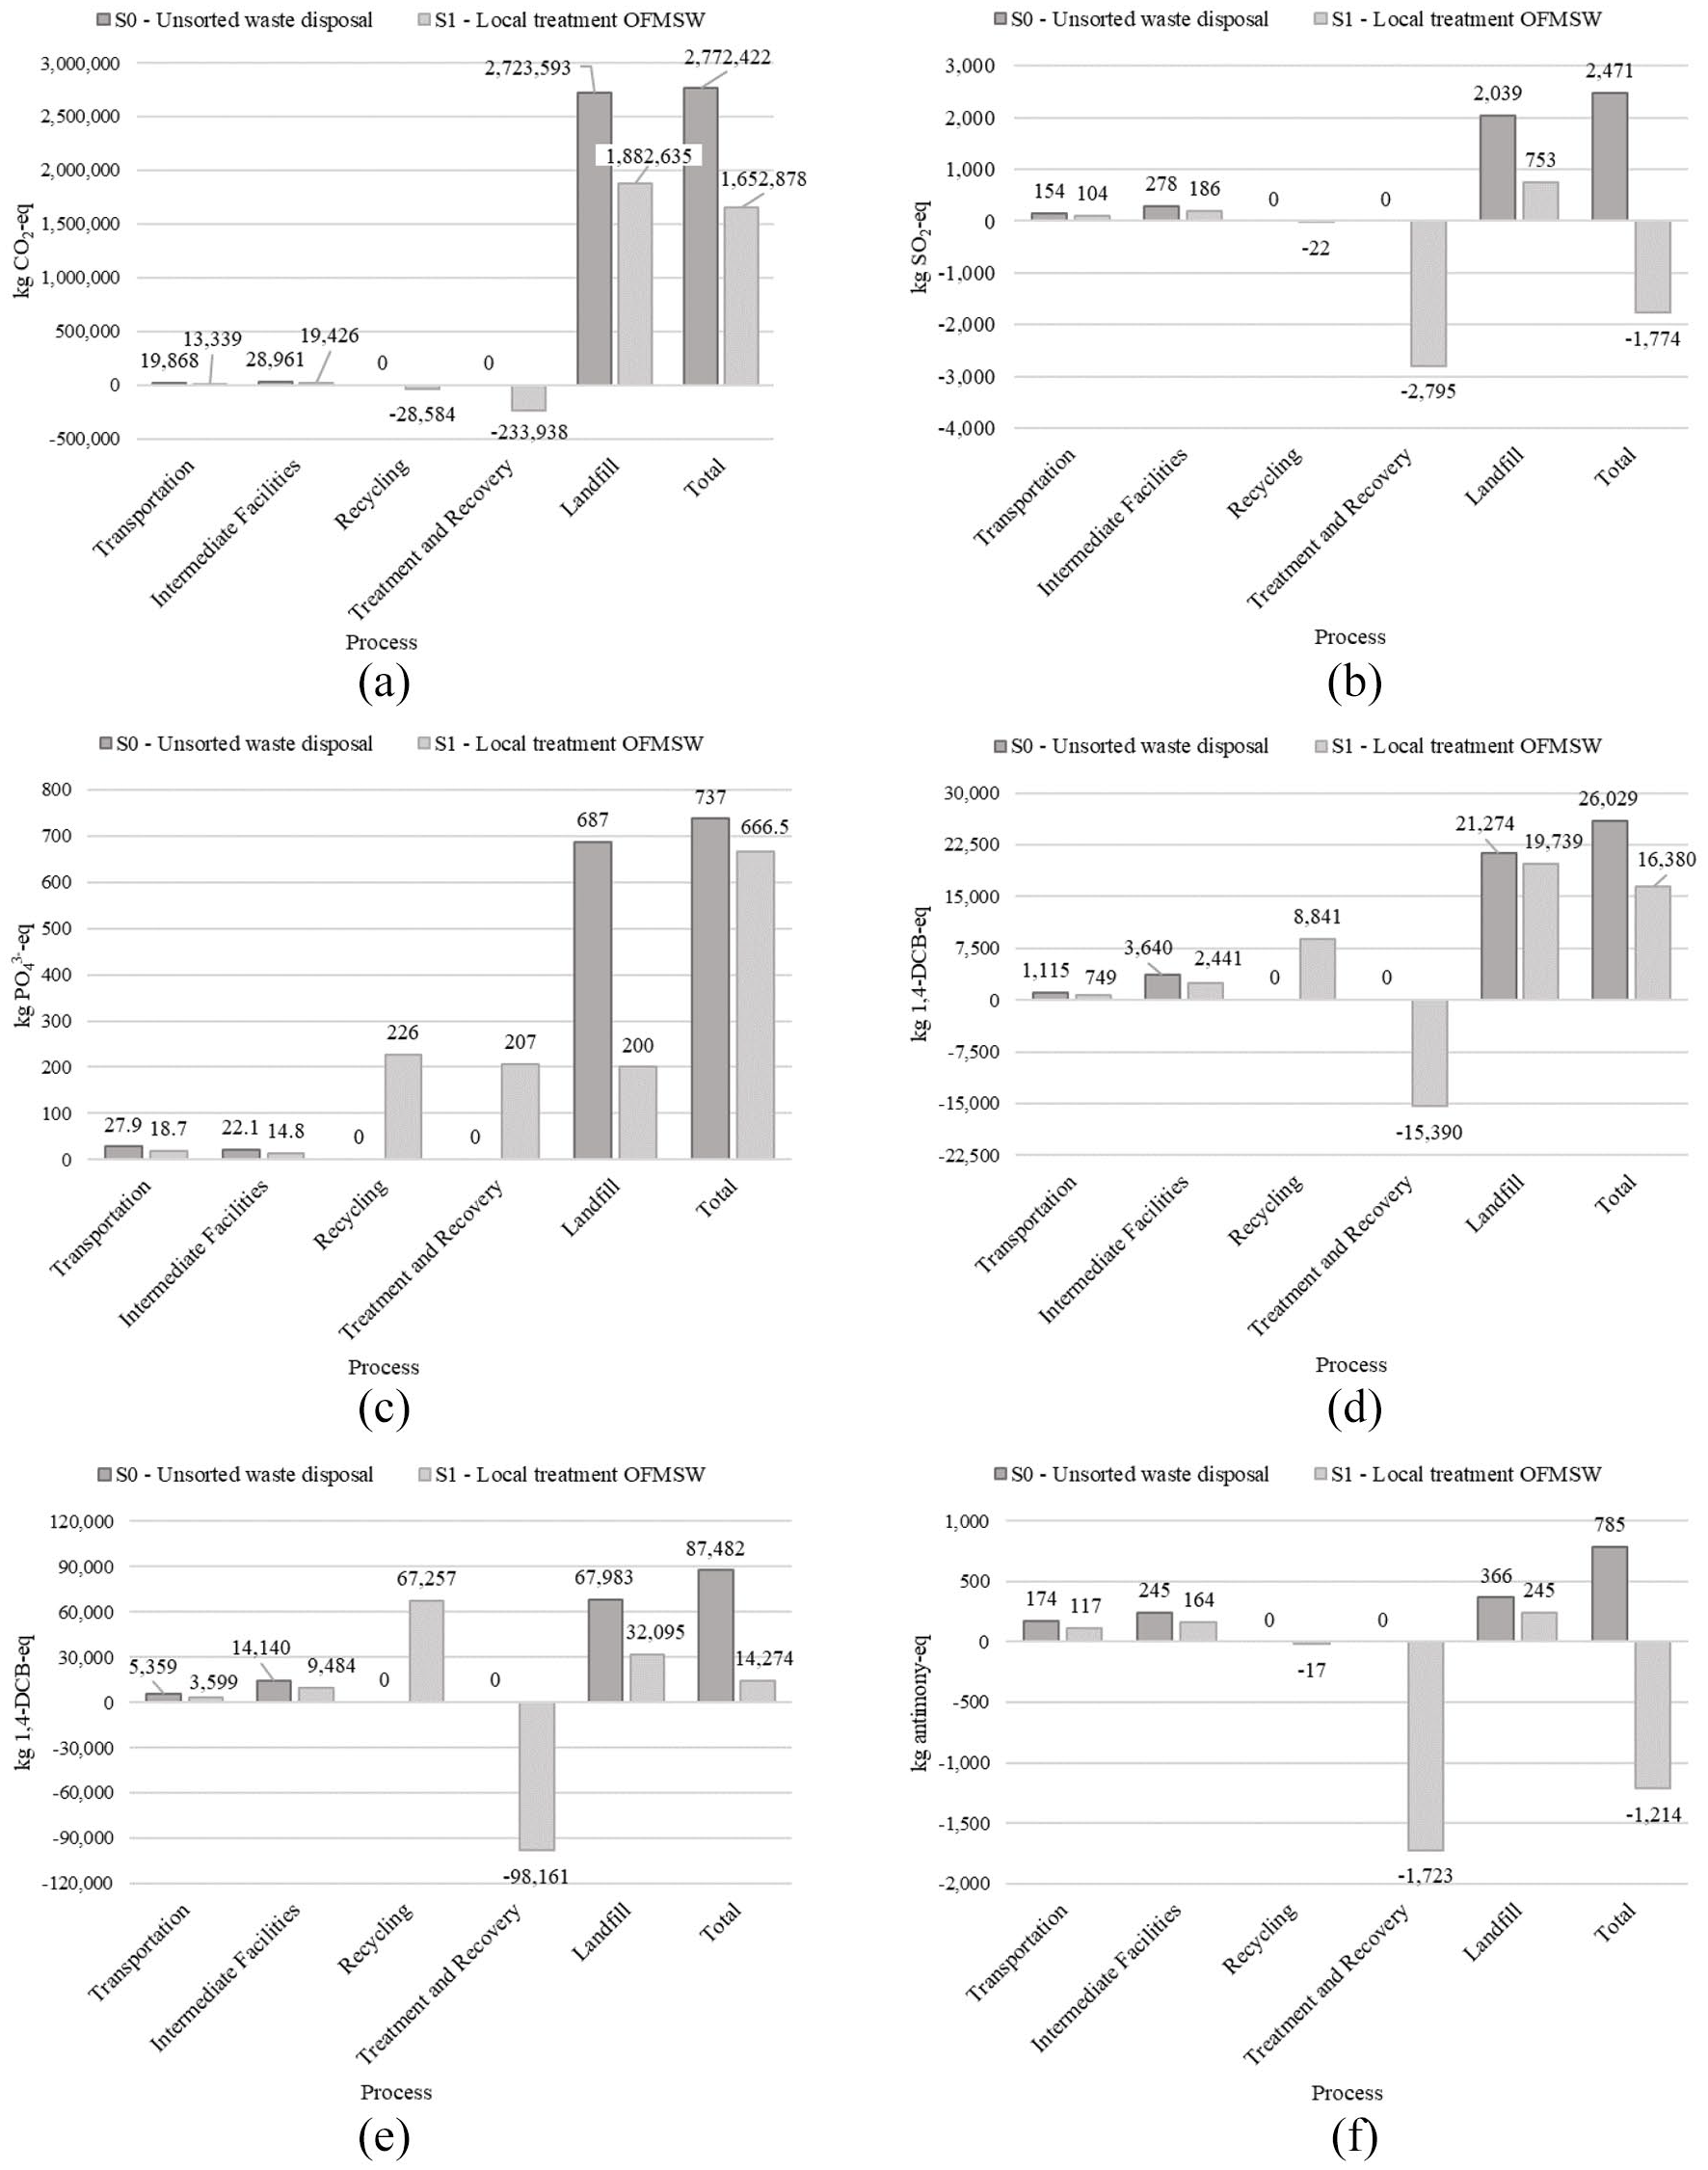
Environmental impact characterization: (a) GWP 100a, (b) AP, (c) eutrophication potential, (d) freshwater aquatic ecotoxicity, (e) human toxicity and (f) depletion of abiotic resources.
The avoidance of landfill disposal plays a fundamental role in lowering the environmental impact of S1 compared to S0. The most marked impact reductions from landfill avoidance are related to eutrophication potential, with a reduction of more than 70%, and AP, with a 63%. The production of renewable energy through cogeneration allows to avoid impacts related to AP and ARD. Considering only recycling, treatment, and recovery processes, AD, and composting increase eutrophication potential of about 433
Figure 7 shows an in-depth look on the transportation process that includes the transfer by truck from the MCC to the port of Lampedusa (1), the transfer by ship to Port Empedocle (2) and the transfer by truck from the port to the sanitary landfill (3). It has been chosen to show only the GWP since it is the most impactful. Transportation by ship weights for 62% of the total transportation process. GWP impact for S1 is 33% lower than S0 for each transportation phase, determining a total CO2-eq emission reduction of about 6528 kgCO2-eq y−1. It can be estimated that the fuel saved by the avoided transfer is equal to 28,000 L y−1.
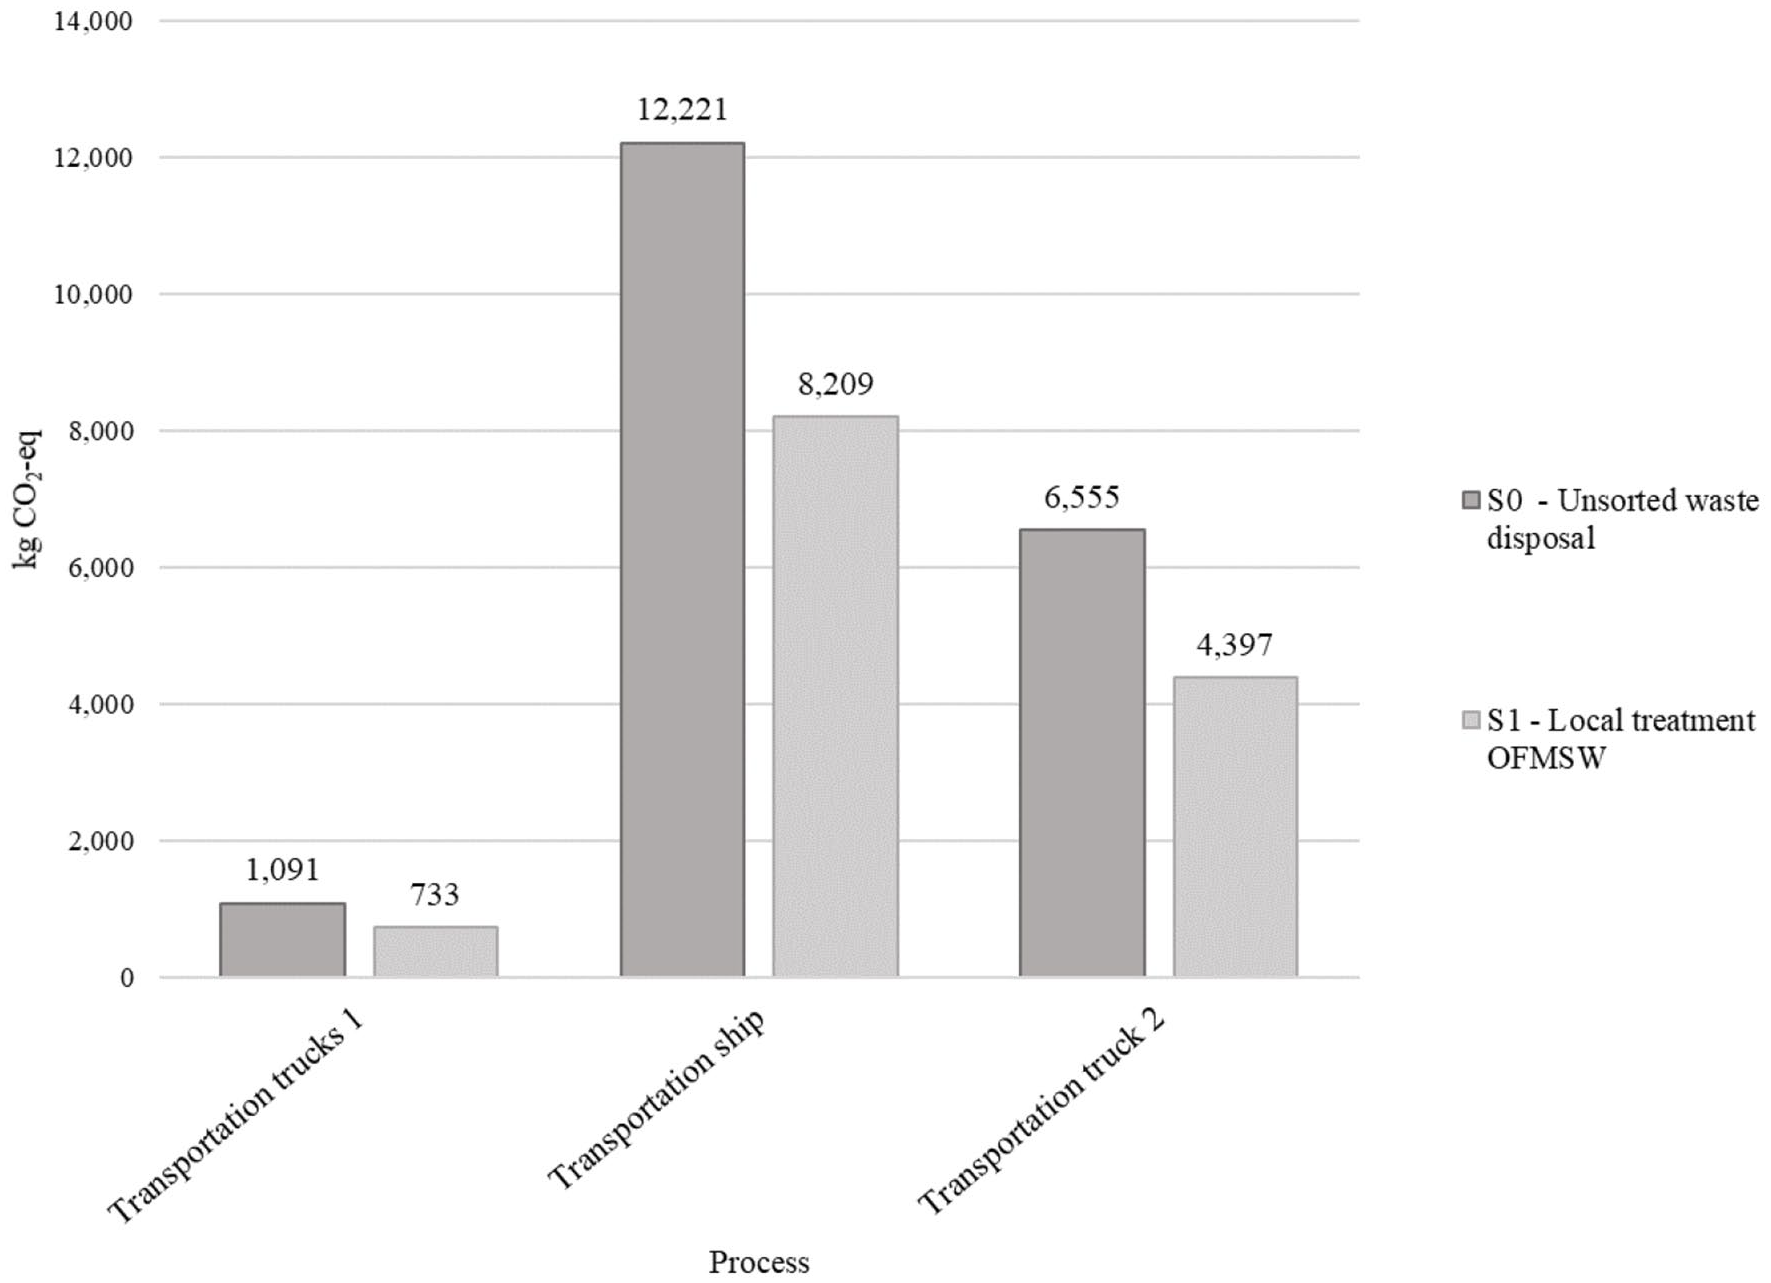
GWP 100a – transportation phases comparison.
Considerations about the electricity consumption
To underline the importance in introducing AD plants in small islands where diesel engines are used for electricity generation, it was chosen to evaluate the environmental impacts also considering the electricity mix employed at the mainland. Data from the software WRATE v.4 referred to electricity production in Italy in 2012 were used. Due to this modification, the scenarios considered were indicated with S0* and S1*. Figure S1 shows the results of the normalization analysis. Total impact of S0* can be quantified with 311 EP, whereas S1* is equal to 202 EP. The reduction (of about 35%) is thus less marked than the one determined from the transition from S0 to S1 (about 67%).
Table S17 shows the characterization of the impact assessed trough the environmental indicators comparing the impact variations for the transition from S0 to S1 to the same variation considering S0* and S1*. The change of the electricity mix used does not influence all the processes investigated. Only intermediate facilities, recycling, treatment and recovery processes involved the use or the production of electricity. In general, the transition from S0* to S1* produces less environmental benefits than the transition from S0 to S1, highlighting that the benefit of AD and composting are pronounced in remote islands where renewable energy is not employed (i.e., hydroelectric energy). Contrary to what happens for the transition from S0 to S1, moving from S0* to S1* does not generate environmental benefits for all the impact factor assessed. The LCA analysis highlighted that eutrophication potential, FWAEP and HTP for S1* present an increase of 10%, 3% and 17%, respectively, compared to S0*, determining a general growth of the three impacts. GWP, AP and depletion of abiotic resources still show a reduction.
Discussion
Research outcomes show how the waste management system investigated (S1) involves lower economic annual expenses and environmental impacts if compared to the current waste management system (S0). However, it is important to underline how the results refer to a virtuous scenario, which would involve a slow transition to be achieved (i.e. 10 years horizon).
The study carried out presents the following two main limitations that must be highlighted for future possible improvements: Kerbside separate collection, which was considered out of the scope of the research, may lead to collection costs that are up to four times higher than mixed MSW collection (Groot et al., 2014), determining less economic benefits; on the other hand, during the sizing processes, the values chosen for the characteristics of the substrate refers to typical literature data. A variation in the TS content or in the TVS ratio would determine a different biogas production. Considering the lower and the upper value of the most reported range, 20–40% for TS and 81–92% for TVS ratio (Dong et al., 2010; Rocamora et al., 2020), would allow to calculate the minimum and the maximum amount of producible biogas. Future analysis should consider such a variability.
Other studies to be conducted for improving data interpretation refer to sensitivity analysis. More emphasis should be given to the variation of certain parameters in order to better define results potential change. For example, transportation distances, landfill gas collection efficiency, construction materials or resource consumption for energy provision and maintenance can be factors that potentially affect the results. This can be the objective of future analysis. Although, the results clearly show that onsite treatment options are more sustainable in an economic and environmental point of view compared to offsite final disposal to sanitary landfills. Therefore, sensitivity analysis can provide better indication about which parameter mostly influence the results, however, research findings can be clearly enough to consider AD of OFMSW an attractive option to face the problem of MSW management on islands.
Another improvement that may complete the conducted analysis consists of a social acceptability study to access the public perception concerning island SWM issues and verify if people would support the introduction of separate waste collection systems. Separate collection with kerbside systems is mandatory to start operating AD plants. Unsorted or dirty feedstock inflow into the treatment plant can cause low treatment efficiency or the failure of the system. Therefore, population involvement is the first step to plan effective AD and composting plants, achieving positive results in terms of collection and treatment efficiency. For example, the implementation of OF selective collection combined with composting in São Tomé (Vaz et al., 2015) shows how the local population accepted the system, providing uncontaminated and well segregated biowaste to feed the treatment plant, resulting in an efficient AD treatment. Awareness campaigns aimed at achieving the expected separate collection standards should be organized in order to start planning appropriate AD treatment systems in remote areas; it represents another recommendation that decision makers should consider.
Finally, the research demonstrated that the amount of structuring raw material monthly needed by the composting process exceeds the amount of wooden and green waste produced. This would make it necessary to implement a stocking and recovery process from the mainland. However, the choices of the municipal administration are leading the islands towards a ‘plastic free’ future. These measures will determine the production of organic cellulosic waste that can be used as a SM during the composting process (Adhikari et al., 2008; Schaub and Leonard, 1996). Anyhow, the modularity of the AD plant investigated would allow the implementation of a pilot plant that would consist in the main treatment line active throughout the whole system and that can support an in-depth assessment of local technical needs.
As stated in other studies that analysed AD potential (Rao et al., 2010), AD has a huge capacity in terms of alleviating the heavy dependence on fossil fuels in remote contexts. However, many SIDS countries have poor national waste collection programmes and services that need to be optimized (Joseph and Prasad, 2020). For example, Tian et al. (2021) demonstrated that decentralized AD with cogeneration achieved higher environmental benefits when compared to centralized incineration with energy recovery, and that decentralized AD could also be more effective, in terms of environmental benefits, than centralized AD as waste transport negatively affects many environmental indicators. This result would support the implementation of AD plants in remote areas which are poorly connected to the mainland as also demonstrated in the current research. More efforts should be spent to improve SWM in SIDS to boost sustainable development. It is role of decision makers to start implement pilot actions to move towards a step-by-step transition.
Conclusions
The study assessed how AD and composting can introduce great economic and environmental benefits in the Pelagian archipelago. Economic benefits from the local treatment of OFMSW include savings of more than €250,000 y−1 mainly generated by the avoidance of OFMSW disposal, while cogeneration allows the production of 321 MWh y−1 of energy transferable to the electricity grid. Environmental benefits include a lowering of GWP of more than 1100 t CO2-eq y−1 and a reduction for all the environmental impact analysed. Eutrophication potential, FWAEP, HTP, AP and depletion of abiotic resources impacts for the SWM system proposed present an average reduction of 85% compared to values of the business-as-usual scenario. The avoidance of final disposal is the main cause of impact reduction.
It can be concluded that the local treatment of OFMSW with AD and composting can be an effective strategy to generate economic and environmental benefits and speed up the transition towards a circular economy. This investigation may serve as feasibility study for governments, policy makers and potential WtE investors. Small Italian islands, which are facing the same challenges of Pelagian archipelago, could surely benefit from this research. At the same time, SIDS all around the world interested in deal with waste management issues may benefits from this analysis. The methodological approach used can be replicated to assess the potential of local treatment of organic waste in remote contexts and support local policies in the field of sustainable waste management, contributing to a circular economy and sustainable future in developing island states.
Supplemental Material
sj-docx-1-wmr-10.1177_0734242X221126426 – Supplemental material for Organic waste valorization in remote islands: Analysis of economic and environmental benefits of onsite treatment options
Supplemental material, sj-docx-1-wmr-10.1177_0734242X221126426 for Organic waste valorization in remote islands: Analysis of economic and environmental benefits of onsite treatment options by Pietro Castellani, Navarro Ferronato, Marco Ragazzi and Vincenzo Torretta in Waste Management & Research
Footnotes
Appendix
Declaration of conflicting interests
The author(s) declared no potential conflicts of interest with respect to the research, authorship, and/or publication of this article.
Funding
The author(s) received no financial support for the research, authorship, and/or publication of this article.
Supplemental material
Supplemental material for this article is available online.
References
Supplementary Material
Please find the following supplemental material available below.
For Open Access articles published under a Creative Commons License, all supplemental material carries the same license as the article it is associated with.
For non-Open Access articles published, all supplemental material carries a non-exclusive license, and permission requests for re-use of supplemental material or any part of supplemental material shall be sent directly to the copyright owner as specified in the copyright notice associated with the article.