
Abstract
Improving eco-efficiency in the provision of municipal solid waste plays an important role for a sustainable economy. Eco-efficiency of municipal solid waste service providers (MSWSPs) has been generally assessed using the conventional data envelopment analysis (DEA) method. However, this approach is sensitive to data noise and has no statistical properties. To overcome these limitations, in this paper, we adopt the double-bootstrap DEA model to derive robust eco-efficiency scores. This nonparametric method allows conducting statistical inference to explore environmental factors affecting the eco-efficiency of MSWSPs. The empirical approach focused on a sample of 298 MSWSPs in Chile, a middle-income country whose policies for promoting waste recycling are incipient. The results indicated that based on the bias-corrected eco-efficiency scores, the potential saving in costs and unsorted waste could be up to 37.8% on average to generate the same level of output (recycled waste). The findings showed that dealing with data noise and uncertainly is of great importance when conducting benchmarking analysis. The region where the municipality is located, tourism, population density and waste per capita are environmental variables that significantly influenced eco-efficiency of Chilean MSWSPs. Several policy implications are discussed based on the findings of this study.
Keywords
Introduction
The Sustainable Development Goals defined by the United Nations (2015) involve making cities and human settlements inclusive, safe, resilient and sustainable (Goal 11) and ensuring sustainable consumption and production patterns (Goal 12). However, Kaza et al. (2018) estimated that the generation of municipal solid waste (MSW) will grow to 3.4 billion tons by 2050. At the same time, there is a shortage of funds available to the local entities, which is one of the main problems they face to improve the management of MSW (Gastaldi et al., 2020). In this context, efficiency improvement is a major goal for municipal solid waste service providers (MSWSPs) (Strck and Boda, 2022). Hence, many previous studies were produced in the literature evaluating the performance of the waste sector in the last years (e.g. Fan et al., 2020; Halkos and Petrou, 2019; Pérez-López et al., 2016; Romano et al., 2020).
Effective solid waste management supposes critical contribution to the circular economy which was defined by the European Commission ‘as a system where the values of products, materials and resources are maintained in the economy for as long as possible, and the generation of waste is minimized’ (European Commission, 2005). In this context, improving the eco-efficiency of MSW management is essential (Romano and Molinos-Senante, 2020; Sarra et al., 2020). Whereas efficiency assessment focuses on the economic performance of MSWSPs (Yang et al., 2018), eco-efficiency assessment embraces both economic and environmental variables in the performance evaluation (Llanquileo-Melgarejo and Molinos-Senante, 2021). Recently, performance of MSWSPs has been extended to evaluate their eco-efficiency considering both recyclable waste and unsorted waste (Sarra et al., 2019). A collection of these applications can be found in Sarra et al. (2017, 2019, 2020), Guerrini et al. (2017), Díaz-Villavicencio et al. (2017), Exposito and Velasco (2018), Romano and Molinos-Senante (2020), Llanquileo-Melgarejo et al. (2021), Delgado-Antequera et al. (2021) and Llanquileo-Melgarejo and Molinos-Senante (2021).
From a methodology perspective, the above literature employed data envelopment analysis (DEA) technique to evaluate the eco-efficiency of MSWSPs. In the solid waste sector, the DEA method is a very suitable method because it requires hardly any information from the decision makers (Sala-Garrido et al., 2022). In simple words, DEA employs linear programming to build an efficient frontier that envelops the whole data (Amaral et al., 2022), and therefore, it does not require any assumption about its functional form (Dyckhoff and Souren, 2022). The relative eco-efficiency is determined by making the comparison between that efficient frontier and each MSWSP under analysis. Moreover, several of the previous studies already cited have employed nonparametric tests such as Kruskal-Wallis test to detect how external environmental factors, not under the control of MSWSPs, influence their eco-efficiency estimations. Nonparametric tests are used because traditional DEA models suffer from several inherent shortcomings, such as sensitivity to sample variation and having no statistical properties, and therefore, regression analysis cannot be conducted to explore the determinants of previously eco-efficiency scores computed (Ananda, 2019). These drawbacks may lead to biased eco-efficiency estimates (Lacko and Hajduová, 2018).
To overcome the major problem of DEA method, which is its deterministic nature (Toma et al., 2017), several other studies employed partial frontier techniques such as order-m to assess the efficiency of solid waste sector (Fusco et al., 2019; Guerrini et al., 2017; Lavigne et al., 2019; Pérez-López et al., 2016; Rogge et al., 2017). This approach does not envelope all data, is less sensitive to outliers and allows the inclusion of environmental variables in the efficiency assessment. However, the choice of the value for ‘m’ is challenging because it influences the efficiency scores (Da Cruz and Marques 2014; Molinos-Senante and Sala-Garrido, 2019). As an alternative to this approach, Simar and Wilson (2007) proposed the double-bootstrap DEA procedure. This approach has two main advantages over traditional DEA models. The first one is that it incorporates noise and uncertainty in the efficiency analysis by deriving bias-corrected efficiency scores and their confidence intervals rather than point estimates (Ananda, 2014). The second advantage is that it allows the inclusion of environmental variables in the efficiency assessment and the test of their significance levels. It should be noted that the nonparametric tests employed by previous studies (Kruskall-Wallis test) do not allow to isolate variables affecting efficiency scores which limits the application of the results for decision making (Gómez et al., 2017). Given the positive features of the double-bootstrap DEA approach, it was used in the past to evaluate the economic efficiency of solid waste sector in developed economies such as in Spain and in Italy (Benito et al., 2014; Exposito and Velasco, 2018; Sarra et al., 2017). However, to the best of our knowledge, this methodological approach has not been employed to evaluate the eco-efficiency of MSWSPs neither in developed nor developing countries.
The main objectives of this study are threefold. First, provide more evidence of the eco-efficiency of MSW sector in a middle-income country such as Chile where policies for promoting MSW recycling are incipient, using robust benchmarking techniques. Second, estimate the eco-efficiency of solid waste sector in a middle-income country by taking into account variability in data, that is by estimating bias-corrected eco-efficiency and their confidence intervals rather than point estimates. Third, assess the statistically significant impact of several environmental variables on the eco-efficiency of MSW sector. In order to do this, we employed the double-bootstrap DEA approach where bias-corrected eco-efficiency scores are derived in the first stage and are regressed against a set of environmental variables in a second stage.
This study contributes to the current literature in the field of solid waste sector performance assessment by estimating for the first time the bias-corrected eco-efficiency scores and identifying environmental variables influencing the eco-efficiency scores by a double-bootstrap approach. To the best of our knowledge, there are no previous studies using statistical inference to explore and environmental factors affecting the eco-efficiency of MSWSPs.
Methodology
In this section we describe the methodology used to calculate the eco-efficiency of several municipalities that provide solid waste collection and recycling services in Chile. This technique also allows us to regress the eco-efficiency scores against a set of environmental variables to determine their impact on eco-efficiency. In particular, the approach employed is based on the two-stage double-bootstrap DEA method developed by Simar and Wilson (2007).
Outliers detection
Considering the deterministic nature of the DEA method (Ferreira and Marques, 2020), before estimating eco-efficiency scores of MSWSPs, potential outliers were detected. Outliers influence the eco-efficiency results because they act as peers of other units, and therefore, they should be removed from the sample evaluated (Cvetkoska et al., 2021). Several methodological approaches have been developed to detect outliers (De Witte and Marques, 2010). They include ‘peer count index’ (Charnes et al., 1985); order-m and order-α methods (Carvalho and Marques, 2014; Marques et al., 2014) and ‘super-efficiency’ (Andersen and Petersen, 1993). Considering the strengths and weaknesses of each methodological approach and the characteristics of the sample of MSWSPs evaluated, the ‘super-efficiency’ method was applied in this study to detect outliers. Considering this methodological approach, those MSWSPs whose generation of outputs and/or use of inputs is extremely large or small, respectively, are considered outliers and therefore, should be removed from the sample. According to Banker and Chang (2006), this procedure is as follows: efficiency (eco-efficiency in this study) scores are estimated excluding one unit and subsequently, the efficiency of the unit excluded is evaluated regarding those that are identified as efficient. This procedure is repeated by dropping one different unit each time, until all of them are once excluded. According to Gómez et al. (2017), MSWSPs whose eco-efficiency was larger than 2.5 were considered as outliers.
The DEA model employed to estimate ‘super eco-efficiency’ scores is as follows:
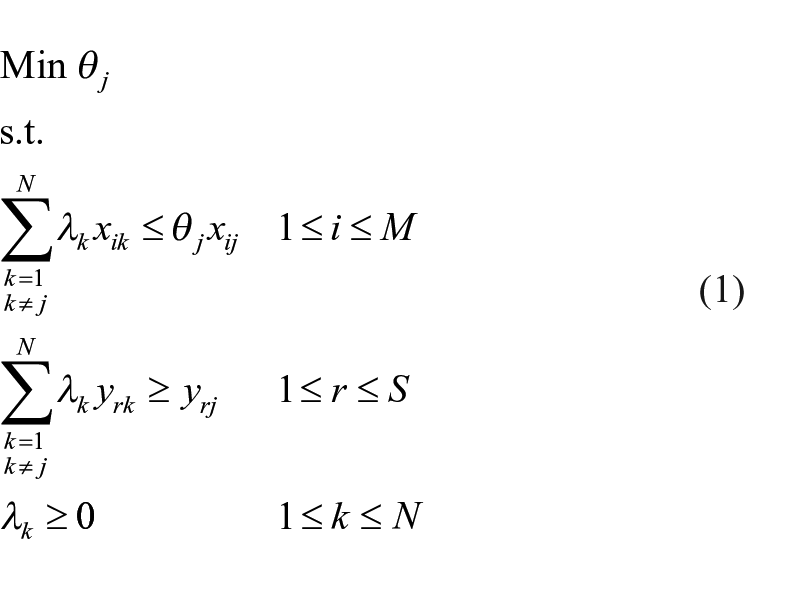
where
Eco-efficiency scores estimation
After detecting and removing outliers, the next stage in this study was the estimation of original eco-efficiency scores. In doing so, the DEA method was applied since it does not require specification of a particular functional form to describe the eco-efficient frontier (Dyckhoff and Souren, 2022). DEA models can take either an input or output orientation. In the framework of MSW management, previous studies (e.g. Guerrini et al., 2017; Llanquileo-Melgarejo et al., 2021; Sarra et al., 2020) employed an input orientation since municipalities (MSWSPs) cannot directly control the amount of solid waste produced. DEA models can also assume constant returns to scale (CRS) or variable returns to scale (VRS). CRS approach assumes that all units (MSWSPs) operate at an optimal scale (Amaral et al., 2022). By contrast, VRS approach introduces scale effects in the eco-efficiency evaluation and prevents inefficiencies due to the size of the units (Gómez et al., 2017). Considering the different size, in terms of operational costs and MSW generated, of the Chilean municipalities and following past studies (Llanquileo-Melgarejo et al., 2021), eco-efficiency scores were estimated assuming VRS technology.
Assuming input orientation and VRS technology, the DEA model employed to estimate eco-efficiency scores of MSWSPs is as follows:
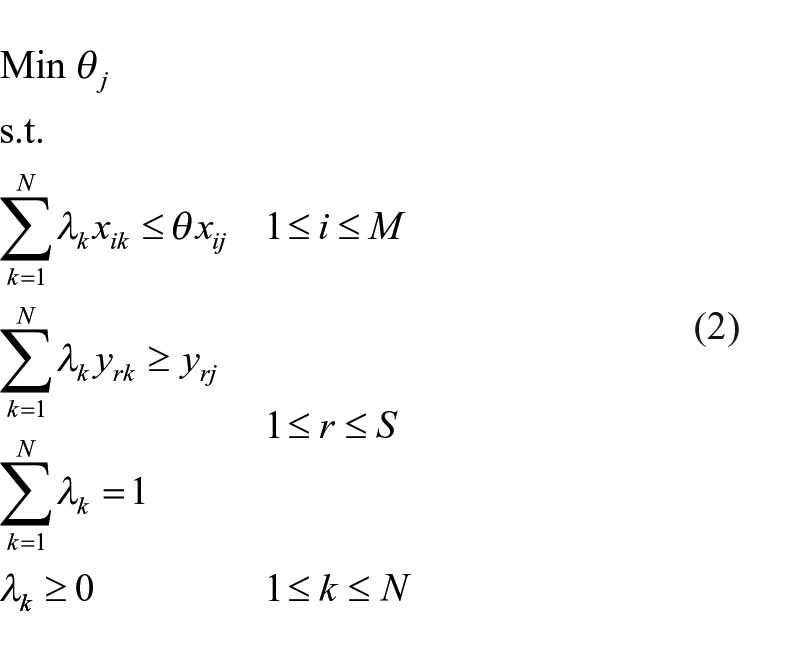
where
Identification of exogenous variables influencing eco-efficiency scores
The eco-efficiency scores obtained from the DEA model (2) do not include any noise so they might be biased (Ananda, 2014). To overcome this limitation, Simar and Wilson (2007) developed the bootstrap process to produce bias-corrected efficiency scores. These eco-efficiency scores were then used in the truncated regression. This procedure produces confidence intervals for the eco-efficiency scores rather than point eco-efficiency estimates, tests for significance levels and allows for statistical inference, dealing therefore with uncertainty and noise in data (Ananda, 2014; Da Cruz and Marques, 2014; Zhang et al., 2016). The Algorithm 2 of Simar and Wilson (2007) works as follows:
Step 1: Estimate the technical eco-efficiency scores,
Step 2: Regress the eco-efficiency scores from step 1 to a set of independent variables,
Step 3: For each unit of assessment Step 3.1: Produce the residual error Step 3.2: Derive Step 3.3: Create a pseudo dataset with inputs and outputs that has the following form: Step 3.4: Use this pseudo dataset and equation (2) to obtain the pseudo eco-efficiency scores
Step 4: Use the bootstrap estimator or the bias
Step 5: Regress
Step 6: Replicate steps (6.1 to 6.3) B2 times to get a pair of B2 bootstrap estimates Step 6.1: Derive the residual error Step 6.2: Derive Step 6.3: Using truncated regression regress
Step 7: Derive the
Case study description
After conducting the outlier detection described in section ‘Outliers detection’, our case study focuses on the solid waste collection and recycling services that are provided by 298 MSWSPs in Chile in 2018. These municipalities serve 79% of the total population (14,716,132 out of a total of 18,729,160 inhabitants). The collection, transport and final treatment or disposal of MSW in Chile is a local responsibility. However, these activities are usually outsourced to private companies. At national level, the most relevant Law for promoting MSW recycling in Chile was adopted in 2016 but its implementation started in mid-2020 (Valenzuela-Levi, 2021). Nevertheless, having a recycling system is not mandatory for local entities (Valenzuela-Levi, 2019).
The selection of the variables for the two-stage analysis conducted in this study was based on previous studies on the waste sector (e.g. Delgado-Antequera et al., 2021; Guerrini et al., 2017; Jacobsen et al., 2013; Simoes and Marques, 2012) and data availability. Two inputs were selected to assess eco-efficiency of MSWSPs. The first input was the total costs incurred by the MSWSPs to deliver collection and recycling services and was measured in Chilean pesos per year (CLP year−1). The second input was the amount of unsorted MSW measured in tons per year considering that the aim of the MSWSPs is to minimize the quantity of unsorted waste collected and maximize the recyclable one (Llanquileo-Melgarejo and Molinos-Senante, 2021; Llanquileo-Melgarejo et al., 2021). We used four recyclable products in our analysis, that is four outputs. These included the following: (i) the amount of paper and cardboard measured in tons per year; (ii) the amount of glass measured in tons per year, (iii) the amount of plastic expressed in tons per year and (iv) the amount of organic waste expressed in tons per year (Bosch et al., 2000; Exposito and Velasco, 2018; García-Sánchez, 2008). The data referred to the year 2018 and was collected from the National Waste Declaration System (SINADER).
As we are interested in assessing the impact of several environmental variables on eco-efficiency scores, the following variables were incorporated in the assessment: (i) population density defined as the ratio of the number of inhabitants per area where the MSWSP provides the service (Agovino et al., 2020; Guerrini et al., 2017; Halkos and Petrou, 2019; Romano et al., 2020). It is therefore measured in inhabitants per km2; (ii) a tourism index developed by the Division of Studies and Territory of the Undersecretariat of Tourism (Sernatur) which captures the level of tourism in the area. The values of this indicator vary from zero to one, with a value of one indicating that the area is highly touristic; (iii) amount of MSW generated per capita. This variable was derived as the ratio of total amount of waste and total number of inhabitants of each municipality and (iv) a categorical variable which captures the region in which the MSWSP operates. In Table 1, we report the descriptive statistics of the variables used in the sample.
Statistics of the variables for estimating eco-efficiency scores and its determinants.
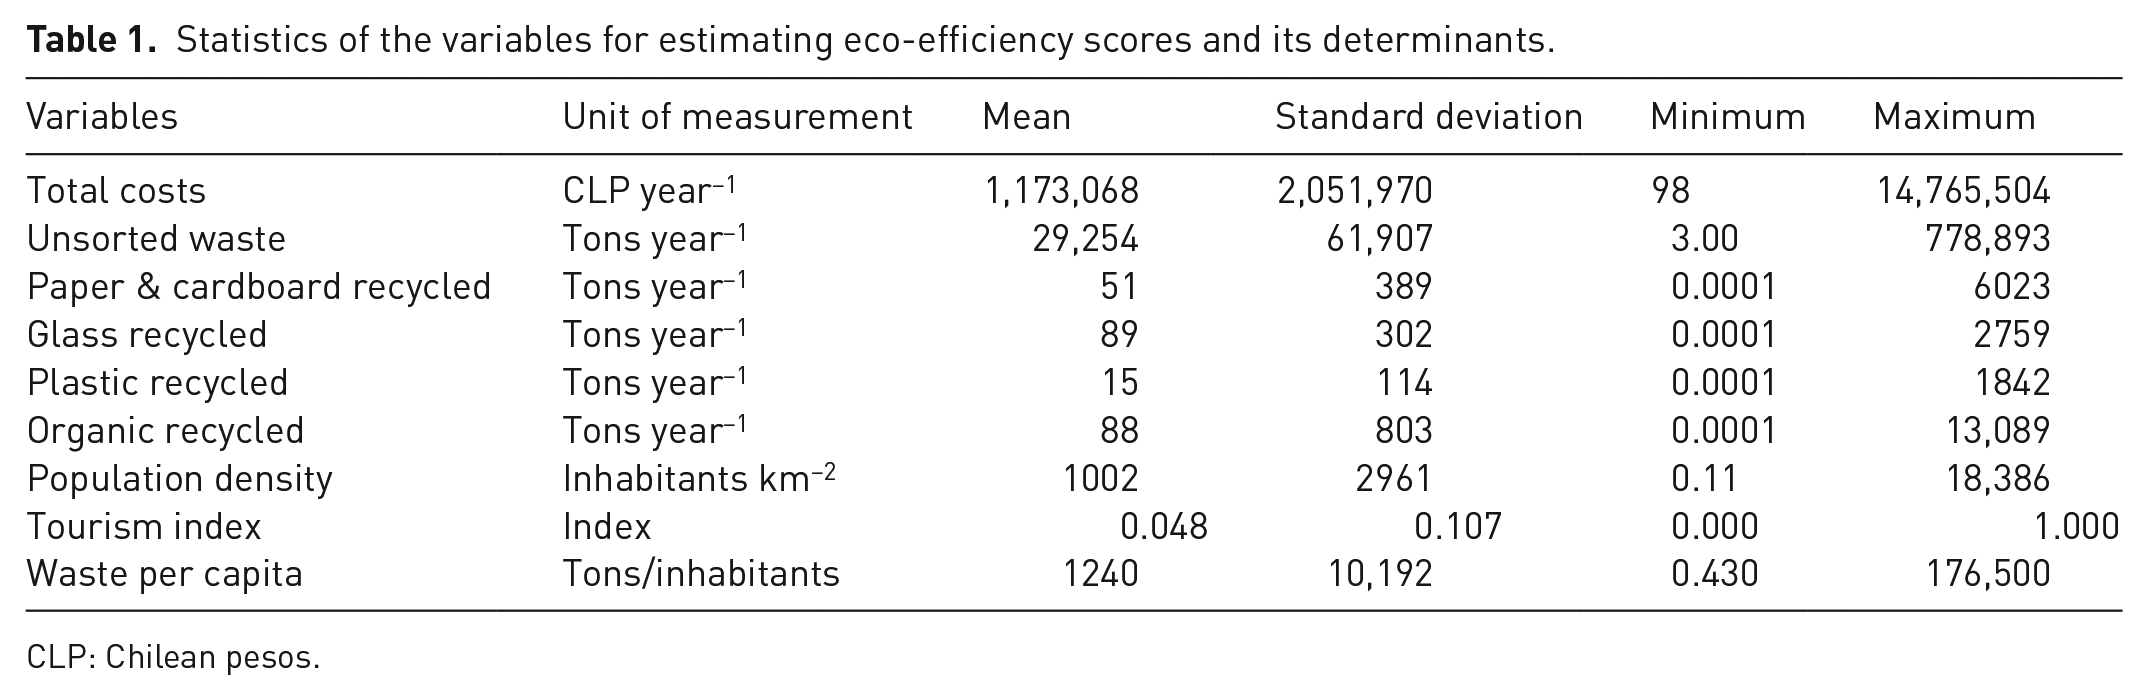
CLP: Chilean pesos.
Results and discussion
Table 2 reports a summary of the original and bias-corrected eco-efficiency scores after 2000 replicates (Simar and Wilson, 2007). It is concluded that the average initial eco-efficiency score of the 298 MSWSPs evaluated was at the level of 1.451. This means that on average the Chilean municipalities could reduce their costs and unsorted waste by 31% (1 − 1/1.451) to generate the same level of output. It was found that seven out of 298 MSWSPs (2.35%) reported an eco-efficiency score of 1.000 forming the best industry’s frontier. In other words, these seven MSWSPs were the only ones which were eco-efficient. All of them presented a large recycling rate which evidences the importance of differentiating unsorted waste and recycled waste in performance assessment. According to the results shown in Table 2, the worst performer in the waste sector needs to reduce inputs by 45% to catch up with the most efficient municipalities in the sample.
Summary statistics of original and bias-corrected eco-efficiency scores for Chilean MSWSPs.
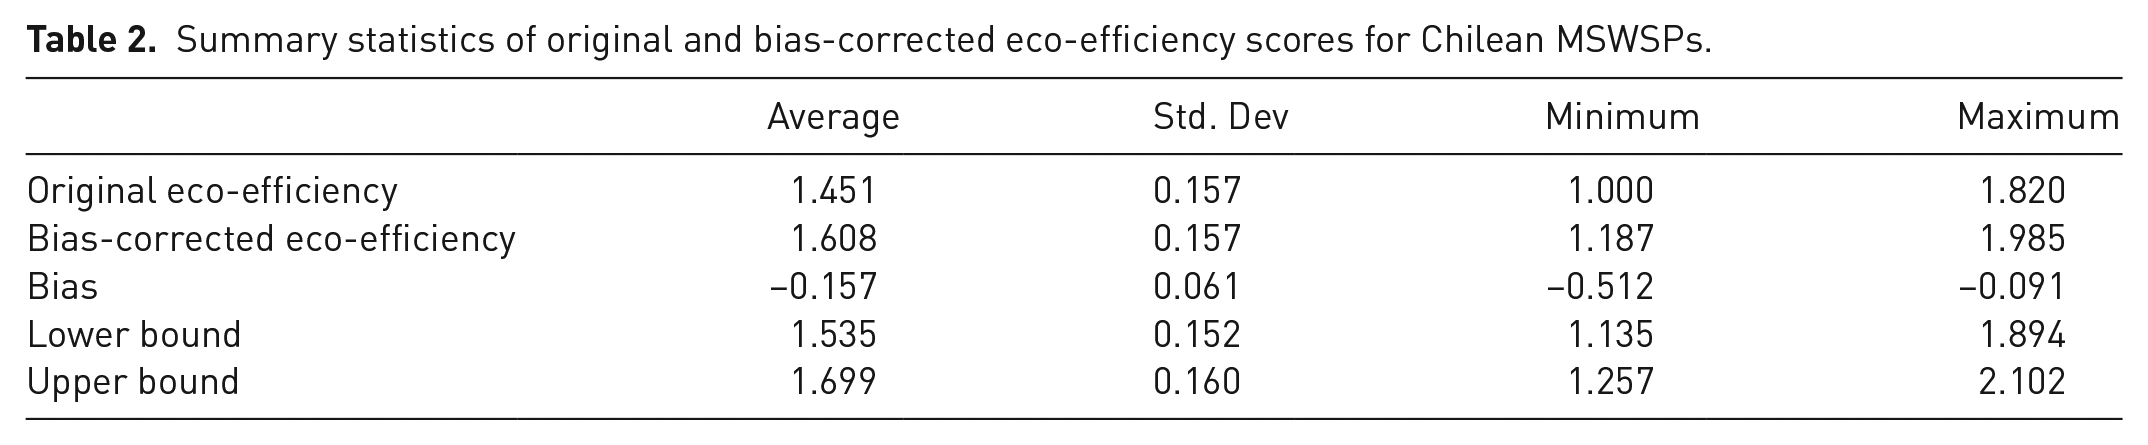
The average bias-corrected eco-efficiency (1.608) was found to be higher than the initial eco-efficiency. This means that the potential reduction in costs and unsorted waste was higher. In particular, on average the municipalities could reduce inputs by 37.8% to produce the same level of outputs. This finding suggests that substantial inefficiency in the Chilean solid waste sector exists. This is consistent with previous studies by Llanquileo-Melgarejo et al. (2021) and Llanquileo-Melgarejo and Molinos-Senante (2021) who reported an average eco-efficiency score of 0.54 when including unsorted waste in their estimation. The difference in the reported initial and bias-corrected efficiency scores is due to the lack of inclusion of noise and uncertainty in the data in the traditional DEA model (Ananda, 2014). The range in bias-corrected eco-efficiency scores varied from 1.187 to 1.985. This means that the most efficient MSWSP should reduce its inputs by 15.8% to keep the production of output constant. By contrast, the least efficient MSWSP should reduce its costs and unsorted waste by 49.6% to improve eco-efficiency. As expected from a theoretical perspective, the bias has a negative sign implying the worsening of eco-efficiency as expected. The lower and upper bounds refer to the corrected eco-efficiency scores. Thus, the 95% confidence intervals for the average MSWSP suggests that it could contract its input consumption between 34.9% and 41.1%. The potential savings in inputs for the least eco-efficient MSWSP could be between 47.2% and 52.4%, whereas for the best performer could be between 11.9% and 20.5%.
To facilitate the comparison between original and bias-corrected eco-efficiency scores, we focus the discussion on the results for the 20 best and 20 worst MSWSPs in the sample based on the original eco-efficiency scores. These are reported in Figures 1 and 2. The initial and bias-corrected eco-efficiency scores for all MSWSPs evaluated are shown as Supplemental Material. The results from Figure 1 indicate that the 20 Chilean best MSWSPs had an average original eco-efficiency score of 1.090 which means that they could reduce costs and unsorted waste by 7.9%. When looking at the bias-corrected eco-efficiency scores, it is concluded that this group of MSWSPs could reduce inputs by 24.6% to generate the same level of output. The difference between the original and bias-corrected eco-efficiency scores is attributed to the standard DEA model which does not incorporate any data variability in the eco-efficiency analysis (Molinos-Senante and Sala-Garrido, 2019). For instance, MSWSP 265 was ranked first based on its original eco-efficiency score as it reported an eco-efficiency of unity. However, the same MSWSP was ranked 20th based on its bias-corrected eco-efficiency score which was 1.512. This example evidences the role of data uncertainty and noise in eco-efficiency assessment which might have relevant consequences whether benchmarking results are used for regulation purposes.
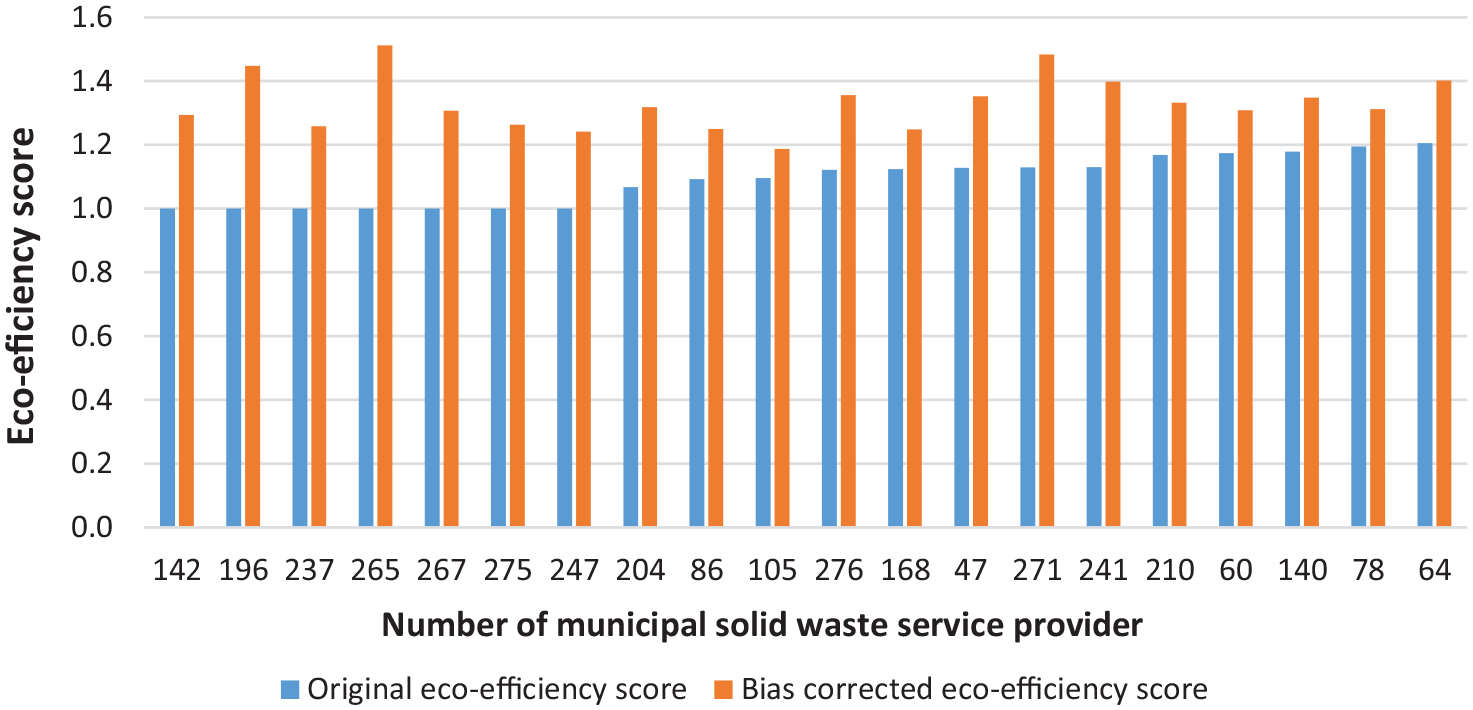
Ranking of best Chilean MSWSPs based on the original and bias-corrected eco-efficiency.
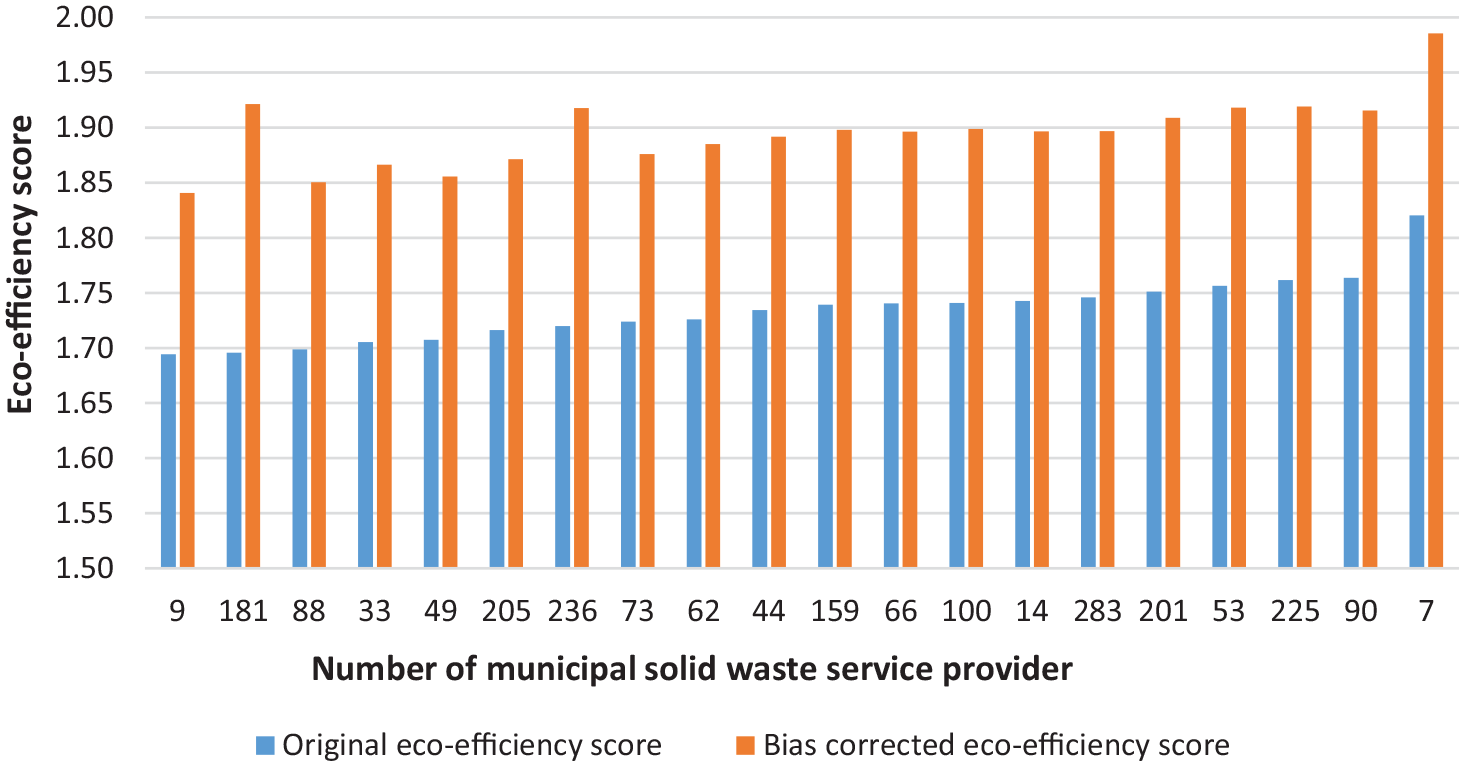
Ranking of worst Chilean MSWSPs based on the original and bias-corrected eco-efficiency.
The results from the 20 worst Chilean MSWSPs (Figure 2) indicate that the average original eco-efficiency for this group was 1.734. The potential savings in inputs among this group of municipalities could reach the level of 47.2% to generate the same level of output. As in the case of best performers, there is also variability in the ranking of MSWSPs based on the bias-corrected eco-efficiency scores. For instance, MSWSP 181 needed to reduce its inputs 41% to catch up with the most eco-efficient municipalities in the sector based on its original eco-efficiency score. However, after dealing with data noise and uncertainty the same MSWSP should reduce its inputs by 48% to be eco-efficient. Overall, the findings demonstrate the importance of using a robust method when deriving eco-efficiency scores for benchmarking purposes.
To further analyse the variability on eco-efficiency scores when potential data uncertainty is integrated in the assessment, Figures 3 and 4 display the lower and upper bounds for bias-corrected eco-efficiency scores for the 20 best and worst Chilean MSWSPs. The results indicate that the gap between lower and upper bound in eco-efficiency for the group of best MSWSPs varied (Figure 3). MSWSP 168 showed the smallest gap between the lower and upper bound of its bias-corrected eco-efficiency scores. This means that this municipality could reduce its input consumption between 16.3% and 24.1%. The biggest gap between the lower and upper eco-efficiency scores was reported by MSWSP 267 indicating that the potential input savings could be between 15.9% and 31.8%. By contrast, the gap between the upper and lower bound of worst MSWSPs’ in terms of eco-efficiency was more stable. On average, the worst municipalities should reduce costs and unsorted waste between 44.7% and 50%. Overall, the findings highlight that it is significant to deal with data variability when conducting benchmark analysis. Failure to do this, it could lead to incorrect ranking and inappropriate policy implications.
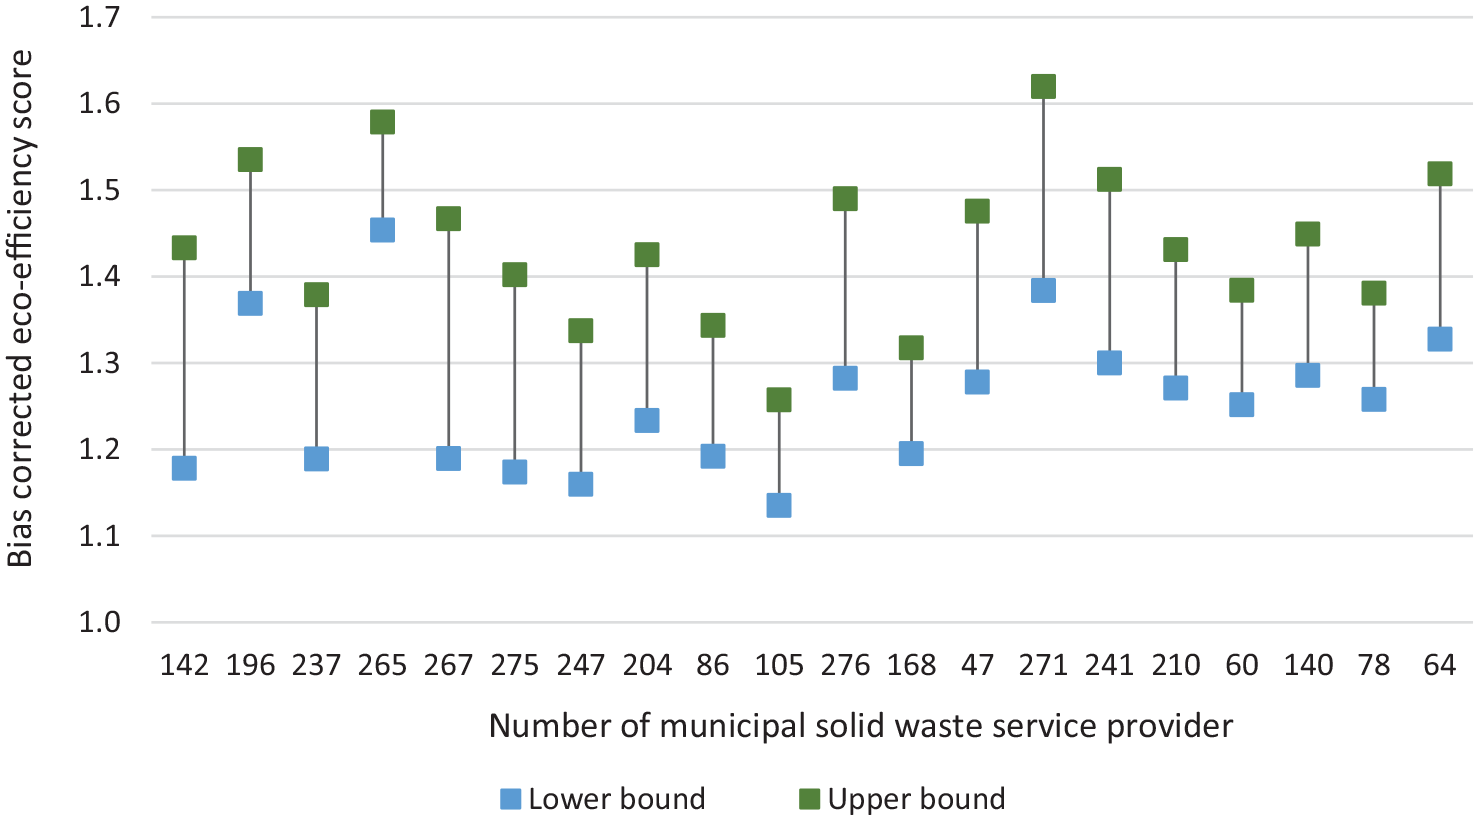
Lower and upper bounds of bias-corrected eco-efficiency scores for best Chilean MSWSPs.
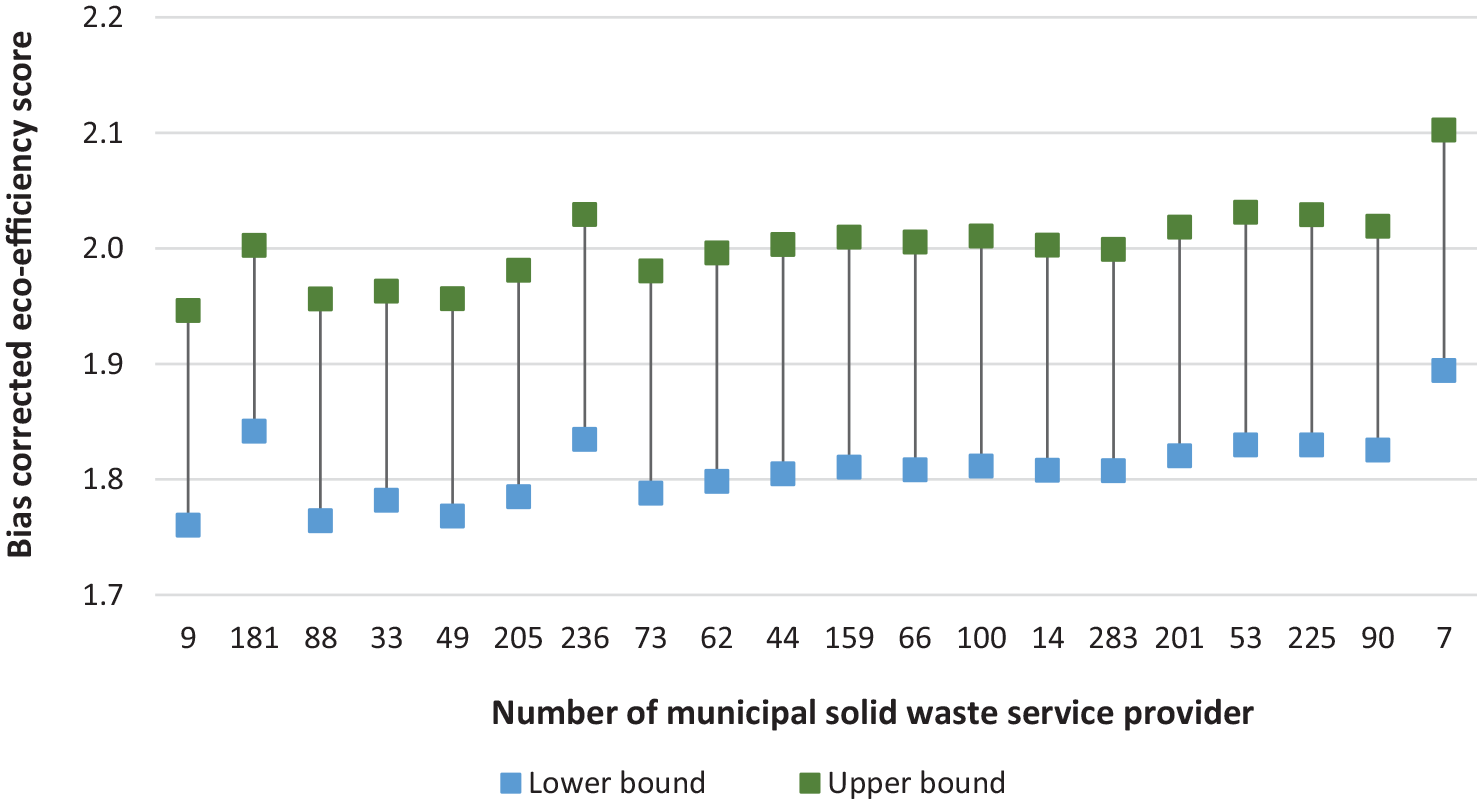
Lower and upper bounds of bias-corrected eco-efficiency for worst Chilean MSWSPs.
To get a better understanding on how bias-corrected eco-efficiency scores are distributed across MSWSPs we need to look into the results in Figure 5. It is found that the majority of municipalities showed an eco-efficiency between 1.41 and 1.80. In particular, 127 out of 298 municipalities (42.6%) should reduce inputs between 16.7% and 28.6%, whereas a significant number of municipalities (104 out of 298, 34.9%) should aim for further contraction in their inputs which could amount to up to 44%. There were 40 municipalities which could further reduce their input consumption up to 50% to generate the same level of output. These results demonstrate that the Chilean waste sector have notable room to improve its performance in terms of reducing operational costs and increasing recycling. This conclusion is consistent with past research (Valenzuela-Levi, 2021) who highlighted the extreme low separate collection rates in most of the Chilean municipalities involving a poor performance in municipal recycling.
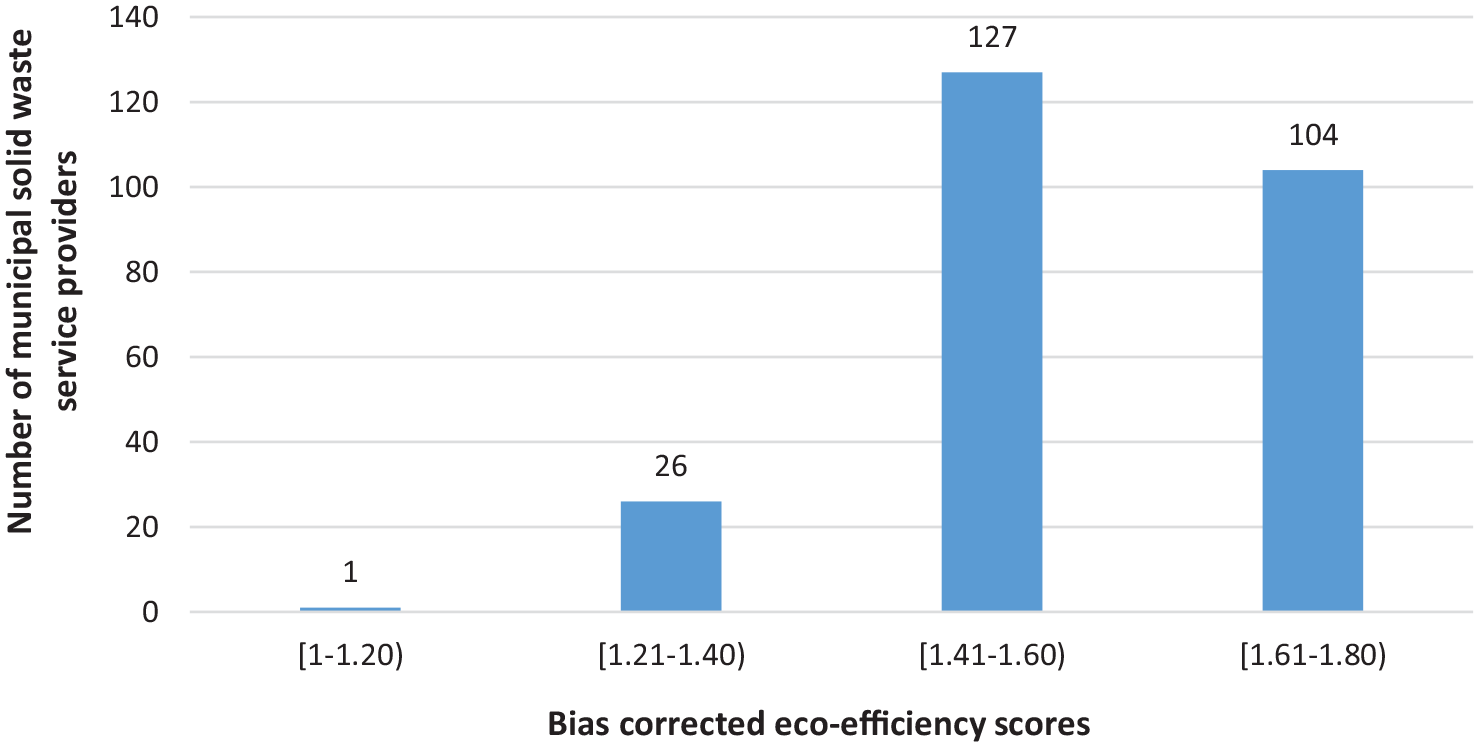
Histogram of bias-corrected eco-efficiency for the Chilean MSWSPs evaluated.
Focusing on the determinants of the eco-efficiency of the Chilean MSWSPs, we explored the influence of population density, tourism, MSW generated per capita and region of the municipality. Results are shown in Table 3. It should be noted that the dependent variable takes a value greater than one which means that a positive sign of the estimated coefficient implies higher inefficiency (lower eco-efficiency) whereas a negative sign suggests lower inefficiency (greater eco-efficiency) (Ananda, 2014). It is evidenced that all variables had a positive sign and were statistically significant from zero which means that they led to higher inefficiency.
Estimates of the truncated regression illustrating the influence of exogenous variables on eco-efficiency scores.
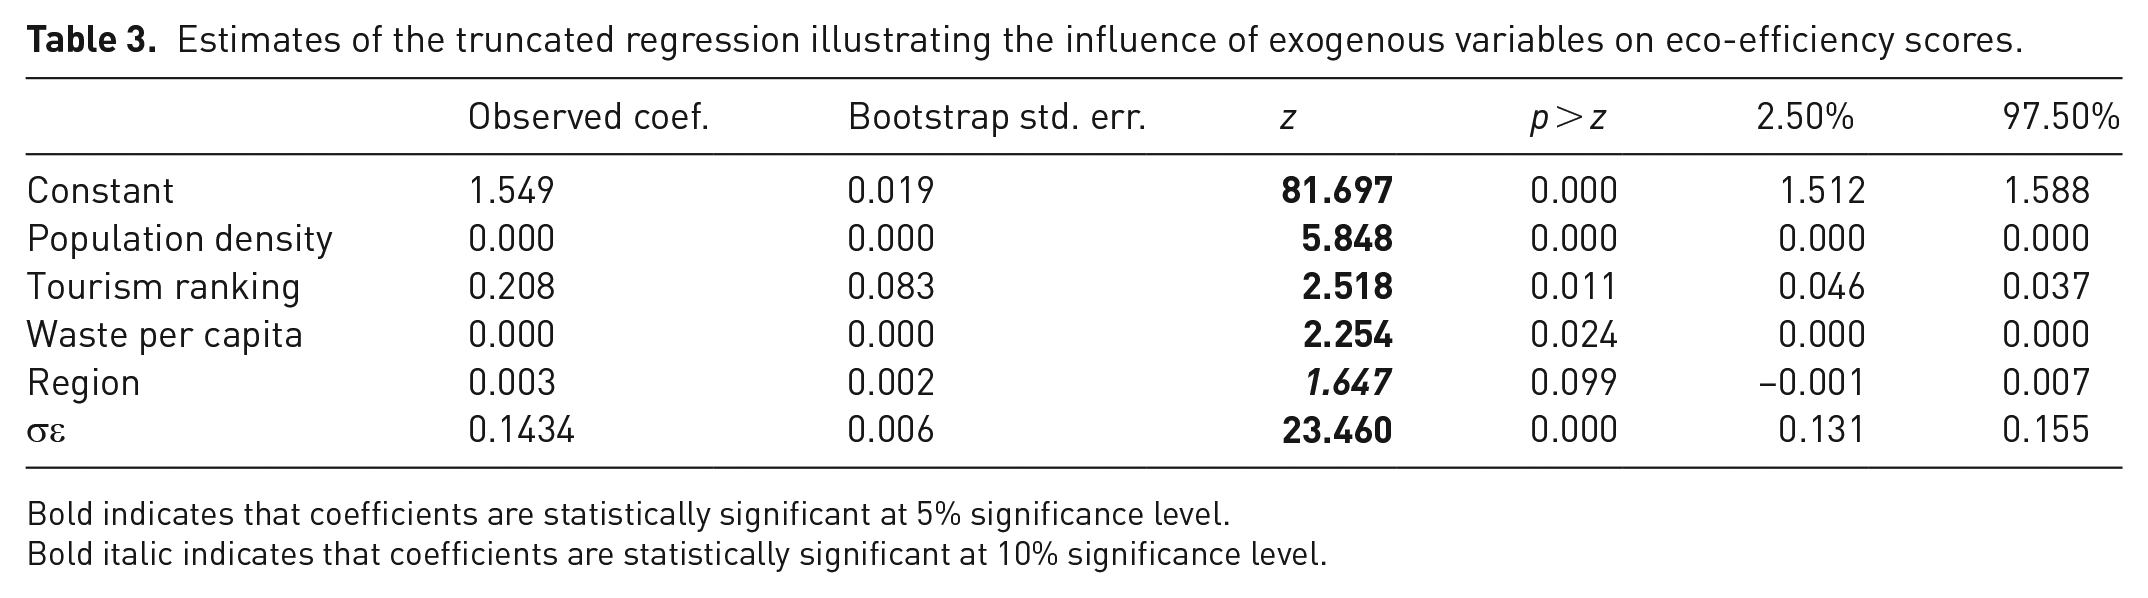
Bold indicates that coefficients are statistically significant at 5% significance level.
Bold italic indicates that coefficients are statistically significant at 10% significance level.
Based on the magnitude of the estimated coefficients (Table 3), tourism had the major impact on eco-efficiency followed by the region of municipality, population density and waste per capita. In particular, ceteris paribus, an increase in the tourism index by one unit could lead to an increase in inefficiency by 0.208 units. This finding suggests that the more touristic the area is, the higher the costs and inefficiency. Previous research (García-Sánchez, 2008; Guerrini et al., 2017; Llanquileo-Melgarejo and Molinos-Senante, 2021; Romano and Molinos-Senante, 2020) support this conclusion as they evidenced that increased tourism negatively influenced the eco-efficiency of municipalities. It has also been identified that the region of the municipality influences the eco-efficiency of the MSWSPs. The larger the region is, the higher the inefficiency might be. This could be attributed to the fact that large regions could consist of a high number of municipalities with many inhabitants which could discharge large amounts of waste. This could lead to higher waste costs and inefficiency. Moreover, large municipalities could be densely populated with large amounts of waste that need to be collected and recycled. This could negatively impact costs and efficiency.
Conclusions
As policies and initiatives to promote circular economy have been developed, the assessment of the eco-efficiency of the solid waste sector has attracted considerable attention by researchers and policy makers over time due to its importance from an economy and environmental perspective. Thus, a robust method is required that could help policy makers understand how eco-efficient the waste sector and what drives inefficiency. Previous studies carried out this assessment using traditional DEA techniques ignoring therefore, the data noise and uncertainty. To deal with this limitation, this study uses the double-bootstrap DEA method to derive bias-corrected eco-efficiency scores and quantify the influence of several environmental variables on municipalities’ eco-efficiency.
The results for the empirical application conducted for a large sample of Chilean MSWSPs can be summarized as follows. First, it was found that the MSW sector in Chile showed poor eco-efficiency. On average, municipalities should make notable efforts to reduce costs and unsorted waste to improve economic and environmental efficiency. Second, there were relevant differences between the original and bias-corrected eco-efficiency scores. It was found that on average municipalities should reduce input consumption by 31.0% to produce the same level of output based on the original eco-efficiency score whereas this figure increases up to 37.8% based on bias-corrected eco-efficiency. The findings demonstrate that dealing with data noise and uncertainly is of great importance when conducting benchmarking analysis. The majority of inefficient municipalities should aim for a reduction in costs and unsorted waste between 28.9% and 44.0%. These municipalities were characterized by high levels of density, tourism and waste consumption per capita. This was corroborated by our regression results who demonstrated the significant impact of these factors on inefficiency. In particular, regions with a high number of municipalities, high levels of density and tourism could generate large amounts of waste per capita which could put pressure on waste sector’s costs and therefore, on eco-efficiency.
From a policy perspective, the results of our study could be of great interest for the following reasons. First, we applied a robust methodology that deals with noise and uncertainty and derives robust eco-efficiency scores. This could be significant for policy makers when they want to compare units’ costs, design policies and adopt strategies to improve eco-efficiency. Moreover, policy makers can assess the level of inefficiency in the sector and most importantly the drivers of inefficiency and also identify best and worst performers. This information could support decision making process and lead to a better performance of the sector from an economic and environmental point of a view.
Supplemental Material
sj-docx-1-wmr-10.1177_0734242X221122514 – Supplemental material for Factors influencing eco-efficiency of municipal solid waste management in Chile: A double-bootstrap approach
Supplemental material, sj-docx-1-wmr-10.1177_0734242X221122514 for Factors influencing eco-efficiency of municipal solid waste management in Chile: A double-bootstrap approach by Maria Molinos-Senante, Alexandros Maziotis, Ramón Sala-Garrido and Manuel Mocholí-Arce in Waste Management & Research
Footnotes
Declaration of conflicting interests
The authors declared no potential conflicts of interest with respect to the research, authorship, and/or publication of this article.
Funding
The authors disclosed receipt of the following financial support for the research, authorship, and/or publication of this article: Maria Molinos-Senante would like to thank to Agencia Nacional de Investigación y Desarrollo (Chile) FONDECYT 1210077 for their financial support.
Supplemental material
Supplemental material for this article is available online.
References
Supplementary Material
Please find the following supplemental material available below.
For Open Access articles published under a Creative Commons License, all supplemental material carries the same license as the article it is associated with.
For non-Open Access articles published, all supplemental material carries a non-exclusive license, and permission requests for re-use of supplemental material or any part of supplemental material shall be sent directly to the copyright owner as specified in the copyright notice associated with the article.