
Abstract
Much heat is released in aerobic landfills, which leads to temperature change. Quantitative prediction of temperature change with time and space is essential for the safe aerobic operation of landfill. In this article, based on the theory of porous media seepage mechanics and heat transfer, a seepage–temperature coupling model considering aeration, recirculation and degradation was established, which included internal energy change, heat conduction, convection and heat transfer. Moreover, combined with the long-time on-site monitoring temperature data from Wuhan Jinkou Landfill, the model’s reliability was preliminarily verified. Sensitivity analysis was carried out for aeration intensity, aeration temperature, recirculation intensity and recirculation temperature. Among the four factors, recirculation intensity influences the peak temperature most with a decrease of 20.11%. Compared with Borglin’s and Hao’s models, it is found that waste should not be assumed as a cell for temperature prediction. By comparing the results of Non-linear Ascent Stage model, Linear Ascent Stage model and Absent Ascent Stage model, it showed that the temperature difference of the three models decreases with the increase of operation time. In addition, the time point of peak temperature, t0, affects the temperature distribution. The above results provide a reference for predicting the spatial and temporal distribution of temperature and regulations for long-term aerobic landfill operations.
Keywords
Introduction
In the process of aerobic operation, the quantitative prediction of temperature in landfill with time and space is of great significance for the long-term safe operation and regulation.
The temperature change of an aerobic bioreactor landfill can be simulated and predicted by the continuity equation. The simulation study of temperature began with the heat generation model related to biodynamic reactions proposed by El-Fadelet al. (1996). Later, McDougall (2007) proposed a hydro-bio-mechanical model to study the temperature distribution in the landfill. Hanson et al. (2008) fitted an exponential growth-decline function model to predict heat production by combining the on-site measured temperature data of four landfills in 4–8 years, and this model could be widely used to predict heat production of landfills in various climatic conditions. Lin et al. (2008) considered several variables including temperature to develop a multi-component modelling system to simulate oxygen consumption in waste composting process, which is of great significance in temperature prediction. Based on the exponential growth-decline function model proposed by Hanson et al. (2008), Emmi et al. (2016) calculated the functional relationship between surface temperature and depth and thermal characteristics (namely thermal diffusivity and heat capacity), and then took it as the boundary condition of the model to calculate the thermal load distribution diagram. Megalla et al. (2016) established a one-dimensional transient heat transfer model considering convection and radiation, with which explored the factors affecting the temperature distribution at the top of the landfill through simulation. Instead of studying the whole landfill, Hao et al. (2017) took a waste cell as the research object, and they put forward a mathematical model to describe the heat generation, accumulation and dissipation within the landfill over time. In Hao’s model, a series of degradation and chemical reactions was considered, and the waste cell temperature did not change with space. Based on the coupled hydro-bio-mechanical model proposed by Reddy et al. (2018), combined with the heat transfer model proposed by Hanson et al. (2013), Kumar et al. (2021) put forward a coupled thermo-hydro-bio-mechanical model to predict the long-term temperature distribution of an aerobic reactor landfill.
During the operation process of the aerobic system, aeration, recirculation and aerobic degradation all influence the temperature change of the landfill. However, the previous temperature simulations have the following problems: (1) the influence of leachate recirculation on the temperature of landfill lacks quantitative description and (2) the heat released by aerobic degradation is generally described by the heat release rate equation, but the applicability of this equation in the assessment of landfill temperature diffusion has not been demonstrated. In view of the above-mentioned problems, in order to further analyse the influence of these factors on the temperature distribution, the following work was carried out in this article: (1) a seepage–temperature coupling model for the aerobic operation was established, which was composed of internal energy term, heat conduction term, convection term and internal heat source term; (2) the reliability of the model was verified by comparing the on-site measured temperature data of Wuhan Jinkou Landfill, and the sensitivity analysis was carried out on this basis; (3) the effects of different types of heat release rate models on temperature predictions were compared and analysed; (4) the influence of the peak time point of the oxygen consumption rate model on the temperature distribution was analysed. The simulation results obtained in this article have helped us understand the relative importance of the factors affecting the temperature change in an aerobic garbage operation. The conclusions are of great significance and value for the safe and efficient operation of aerobic bioreactor landfills.
Seepage–temperature coupling model in aerobic operation
Gas transport
The gas transport model describes the change of gas pressure, density and total gas production with time. The model in this article is based on the coupling dynamic model of landfill gas migration under the condition of heat release established by Liu (2009). In order to facilitate the simulation of oxygen migration process in waste, the following assumptions are made: (1) waste medium is homogeneous; (2) only convection is considered, and dispersion is ignored; and (3) only the flow of oxygen is considered in the calculation. The equation is as follows:
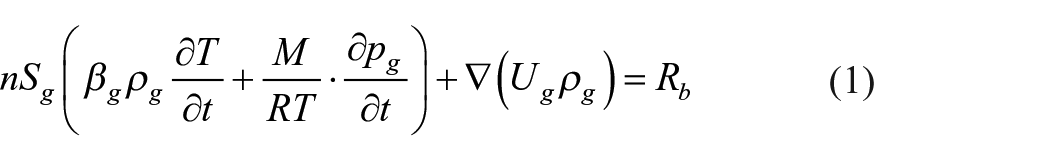
where
Darcy’s law is often used to describe the convective motion, ignoring the influence of gravity:
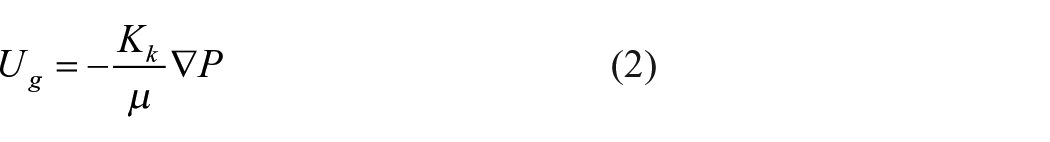
where
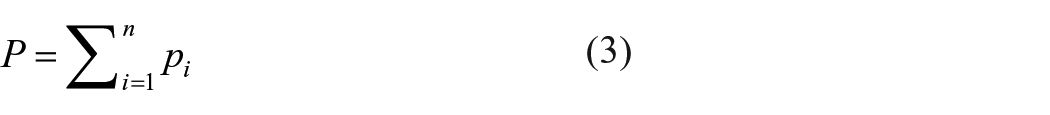
The pressure of each component can be calculated from the state equation of ideal gas, as follows:
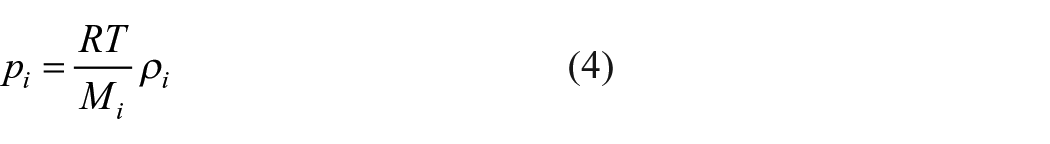
where
Heat generation and transfer
Energy conservation equation
The energy conservation equation can be used to describe the change of temperature distribution. Liu (2009) established the coupling dynamics model of landfill gas migration under the condition of heat release, and Omar and Rohani (2017) proposed the energy conservation equation. In this article, based on the coupling equation proposed by Liu and the expression of aeration and recirculation in Omar’s energy conservation equation, the coupled equation of seepage and temperature in the process of aerobic operation is established under the following assumptions: the studied waste is isotropic as a continuous medium; there is an internal heat source evenly distributed in the reactor; the changes of temperature and pressure in the whole operation period of the landfill can be ignored; the deformation of garbage skeleton and water infiltration are not considered and the gas dispersion effect is ignored. Therefore, the seepage and temperature coupling equation adopted in this article during aerobic operation is composed of internal energy change term, conduction term, convection term and source and sink term:
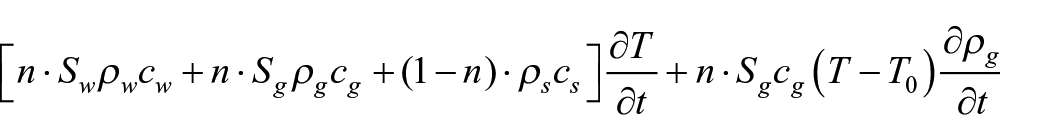

where
In the process of aerobic operation, aeration and recirculation affect the heat source, and the expression can be written as:

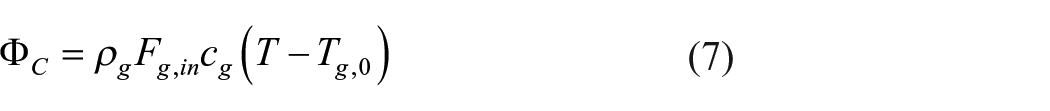
where
Heat release rate
The heat release rate is a crucial variable to describe the energy source of organic matter degradation and an essential part of the source and sink term of the conservation equation. The change of heat release rate caused by aerobic degradation is mainly represented by oxygen consumption of aerobic biomass. The oxygen consumption is presented mainly in two forms: (1) empirical formula (Lanini et al. (2001); Hanson et al. (2008); Hanson et al. (2013);Megalla et al. (2016)) and (2) oxygen consumption rate based on oxygen concentration consumption: theoretical formula (Hao et al., 2017; Kallel et al., 2003) and empirical formula (Borglin et al., 2004; Liang et al., 2020; Slezak et al. 2015).
As mentioned earlier, the heat release rate is important in temperature prediction. Lanini et al. (2001) demonstrated that aerobic heat production is an integral part of the total heat production and then proposed a representative empirical formula for studying the direction of aerobic degradation heat production. Hanson et al. (2008) fitted an exponential growth–decline function model to predict heat production based on the numerical finite element method, this model was later improved by Hanson et al. (2013). Megalla et al. (2016) proposed that the oxygen content in the gas phase of the garbage body could be used to calculate the heat generation of surface garbage aerobic degradation. Manjunatha et al. (2020) combined the landfill degradation and transport model and the physical composition of municipal solid waste to quantitatively characterize the heat production from the degradation of carbohydrates, protein and fat. In their article, estimates of heat and temperature rise caused by anaerobic degradation were made for some landfills in India.
The critical factor in heat release rate term is oxygen consumption rate. Kallel et al. (2003) calculated cumulative oxygen consumption using first-order dynamics equations. Hao et al. (2017) established a full derivative model to describe the changes of heat generation, consumption and release in landfills with time, predict the temperature of landfills and understand the relative importance of factors affecting heat generation and accumulation. Borglin et al. (2004) used the results of a respiration test to fit the logarithmic expression to describe the oxygen consumption rate. Hao et al. (2017) used nitrogen flow rate in landfill gas to calculate oxygen consumption rate; Liang et al. (2020) proposed an improved two-stage oxygen consumption rate model based on Borglin’s model considering the actual situation of microbial degradation.
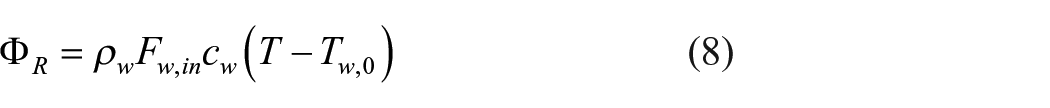
In this article, the heat release rate is expressed as a function of the oxygen consumption rate. The expression of the oxygen consumption rate term is based on the empirical formula proposed by Liang et al. (2020). The Non-Linear Ascent Stage (NAS) model is expressed as follows:
where
Simulation of landfill temperature distribution during typical aerobic operation
In this article, COMSOL Multiphysics software was used for simulation. The model is coupled with the fluid flow and heat transfer model under the earth science module. The 720 days measured temperature data of Wuhan Jinkou Landfill were picked, and the reliability and applicability of the model established in this article were verified by comparison with that data. Then, the temperature distribution in a landfill with time and space was explored. On this basis, the effects of aeration conditions, recirculation conditions and heat release rate on the temperature distribution in landfill were simulated.
The simulation model is shown in Figure 1. The landfill site is a rectangular area with a depth of 40 m and a width of 80 m. This area is divided into three small areas: zone I is the landfill area, where waste is disposed, with a width of 60 m, zone II is the clay covering with a thickness of 3 m and zone III is the surrounding area with a width of 20 m. There are 10 boundaries in the model, and the specific distribution is shown in Figure 1. The boundary conditions are divided into temperature and pressure boundaries, shown in Figure 1. Table 1 provides simulation parameters and values.
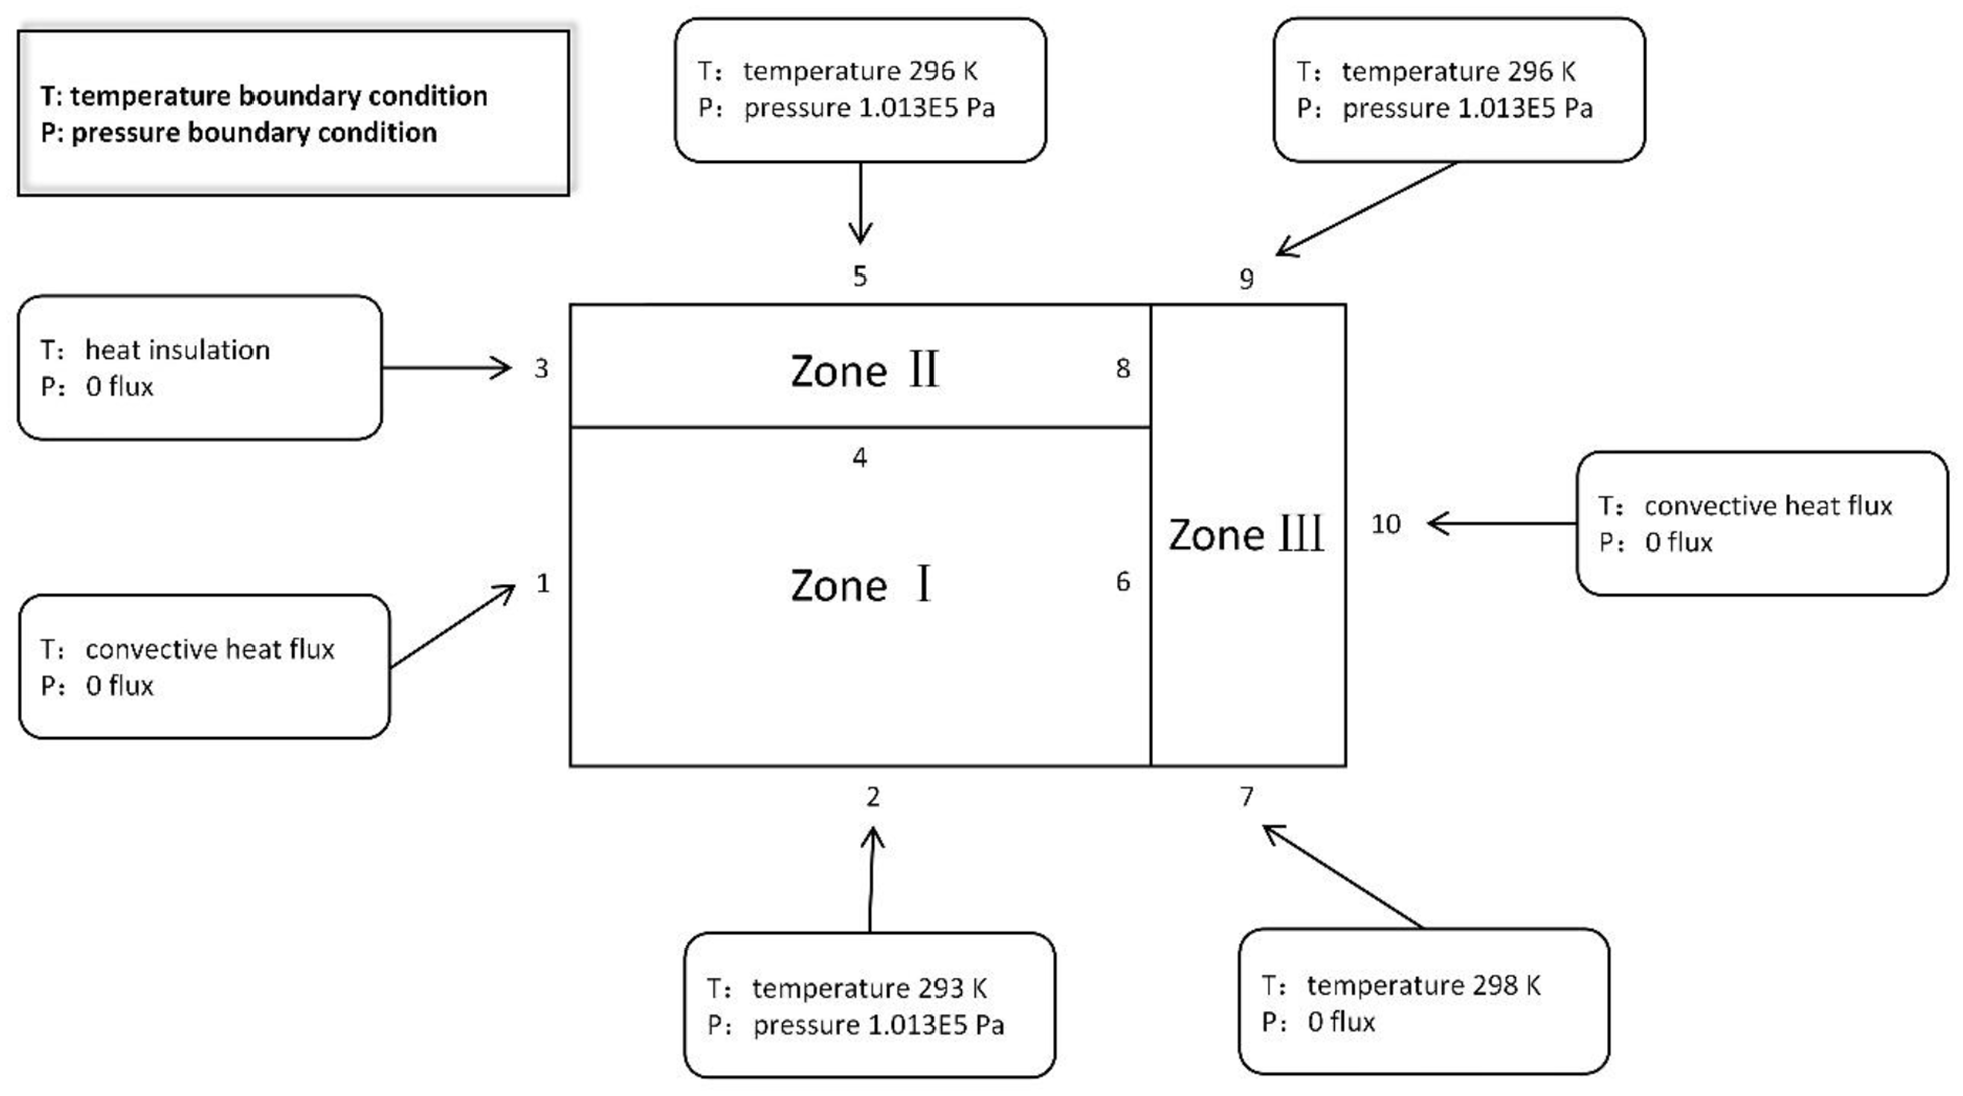
Introduction to the model.
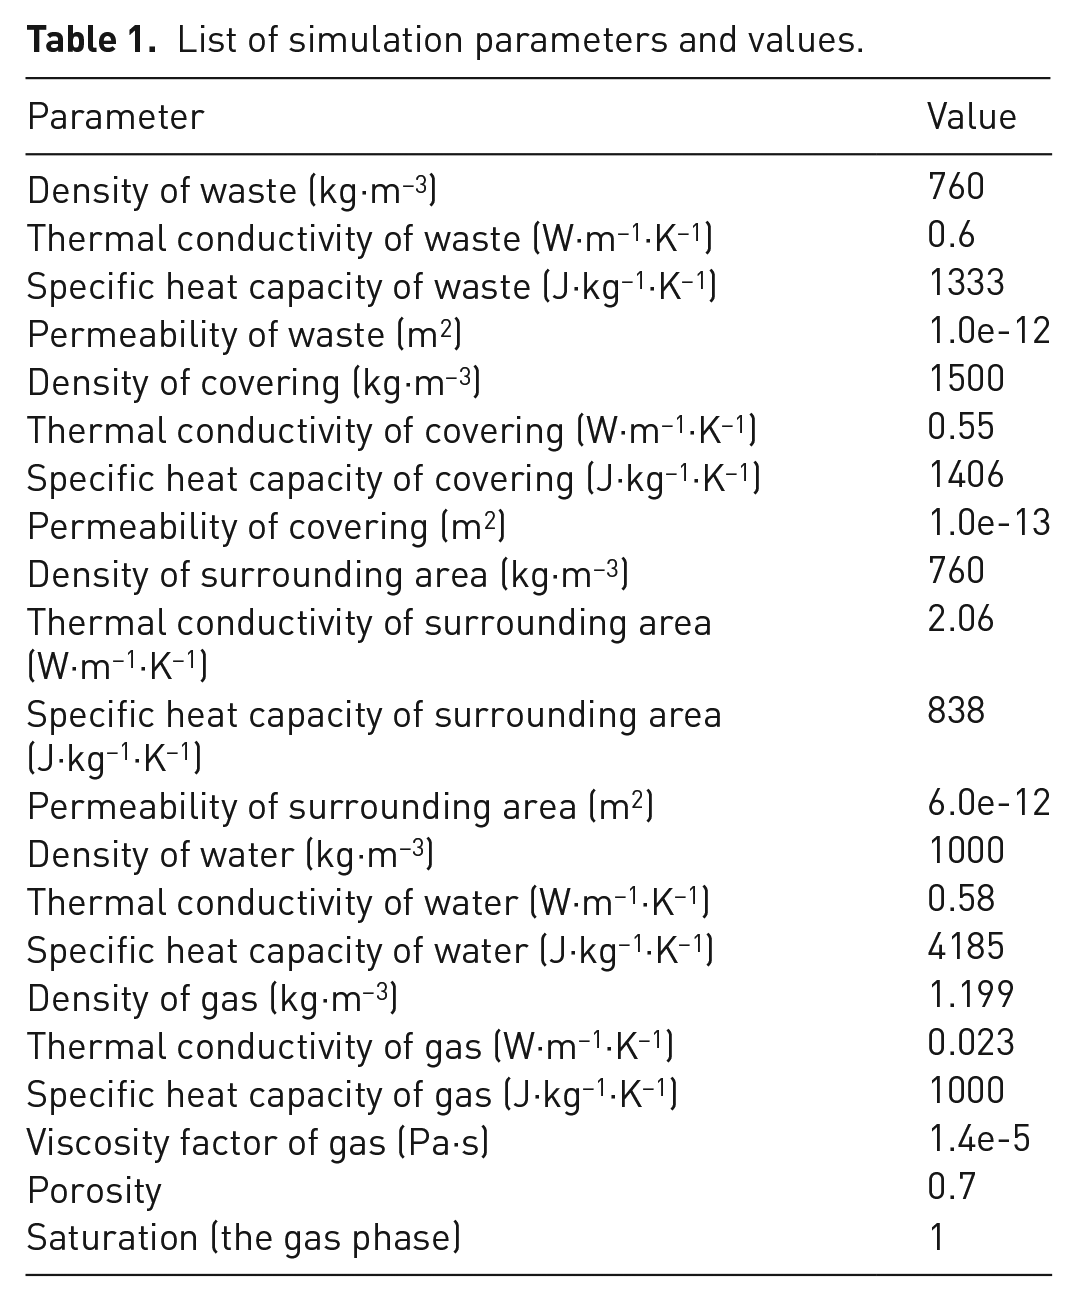
List of simulation parameters and values.
This simulation has four variables: aeration intensity, aeration temperature, recirculation intensity and recirculation temperature. The aeration intensity increased from 1.7E-6 m·s−1 to 6.8E-6 m·s−1, and the recirculation intensity similarly increased from 8.185E-9 m·s−1 to 2.046E-8 m·s−1. The temperature changed from 15°C to 30°C with 5°C as the step length. In the initial scheme, the aeration intensity is 6.8E-6 m·s−1, the aeration temperature is 25°C, the recirculation intensity is 8.185E-9 m·s−1 and the recirculation temperature is 20°C. It should be noted that the initial values of temperature are estimated considering the local annual average temperature, and the initial values of intensity are obtained on site or calculated from the field data. Considering the loss in actual engineering, the actual aeration intensity inside the landfill will be smaller than that obtained at the blower, so the simulation range of aeration intensity is smaller than the initial value. The local average annual temperature is 20°C, so the initial temperature of recirculation is 20°C. According to engineering experience, the blower will heat up the injected gas, so the initial temperature of gas injection is 25°C.
Result and discussion
Effect of heat release from waste degradation on temperature
The temperature distribution in landfills depends on the degradation of waste and the release and transfer of heat. As shown in Figure 2(a), heat from aerobic degradation makes landfill temperature rise; however, since the heat release rate begins to decline after the peak, and considering the release of heat to the atmosphere, the peak of temperature in the landfill shows a trend of gradual reduction in the following four time points (6, 12, 18 and 24 months). In the landfill, the temperature near the depth of 20 m (the middle of the landfill) is the highest, and the variation range is the largest within the same time interval. The temperature at the top and bottom of the landfill is controlled by the upper and lower temperature boundary conditions, respectively.
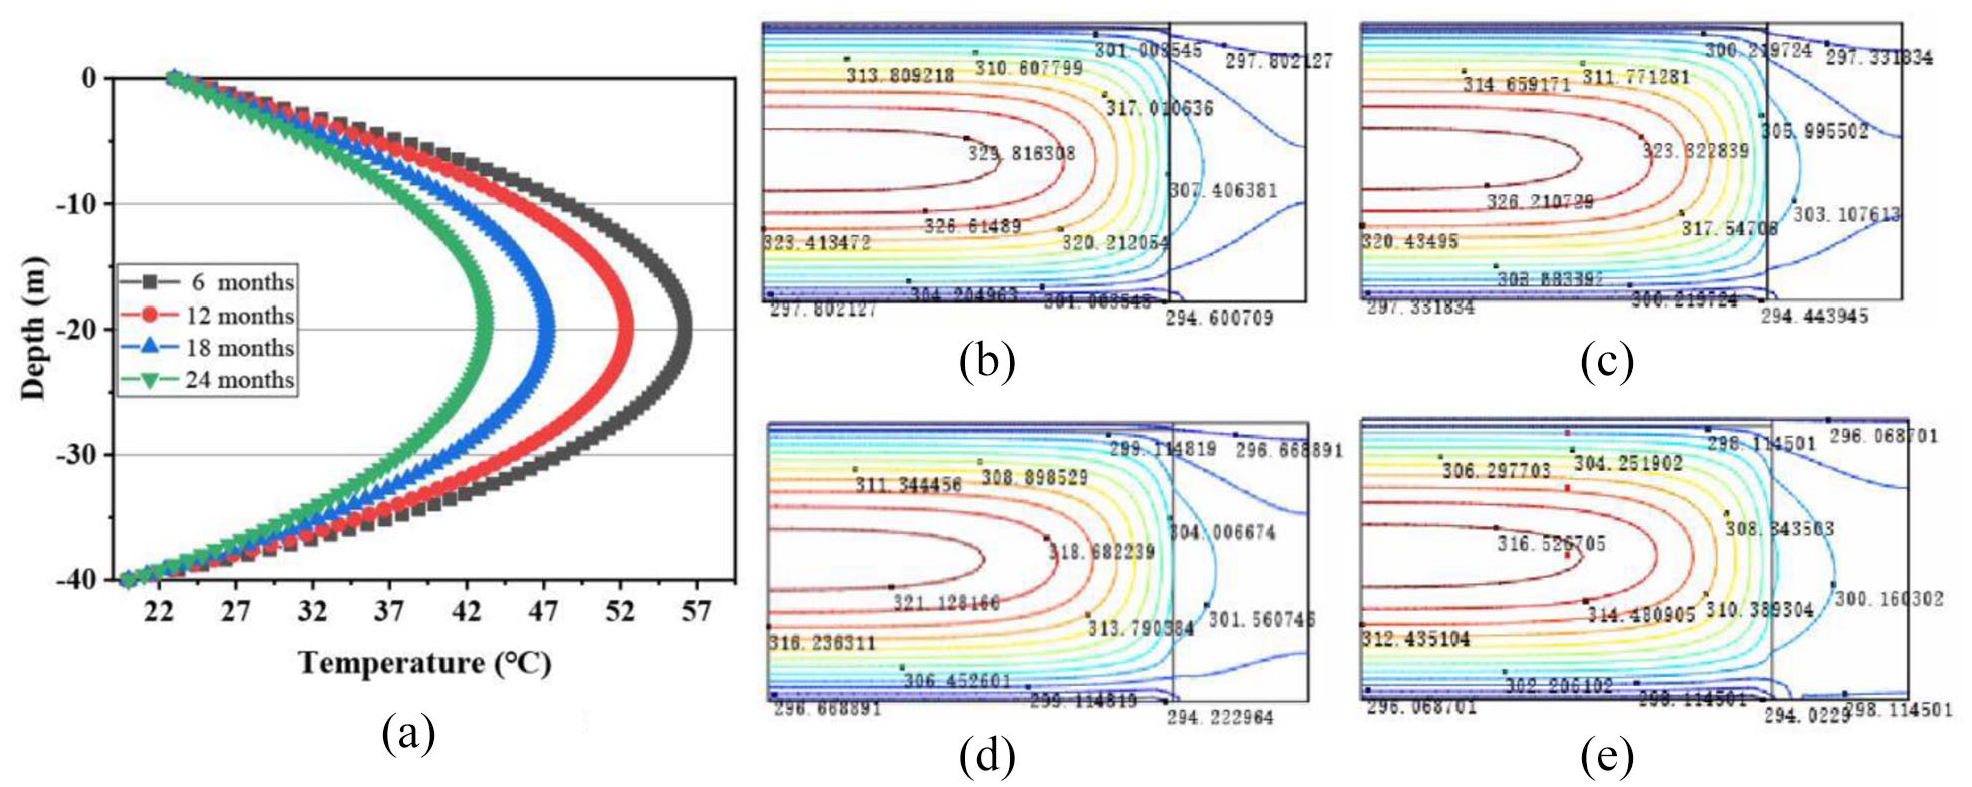
Temperature distribution with depth and time: (a) Depth and temperature, (b) 6 months, (c) 12 months (d) 18 months and (e) 24 months.
Figure 2(b) to (e) show the temperature contour distribution maps of the landfill. The longitudinal profile data at x = 30 m were selected, and it can be discovered that the heat transfer capacity is strong in the horizontal direction of the surrounding area, indicating that the temperature diffusion to the surrounding area is apparent.
Effect of aeration–recirculation–degradation on temperature distribution
Aeration and recirculation affect the temperature distribution in aerobic degradation landfills. In this model, four conditions including heat source term with only aerobic degradation, heat source term + aeration, heat source term + recirculation and heat source term + aeration + recirculation were, respectively, considered for simulation. Parameters and values are shown in Table 1, and the coordinate of temperature monitoring point in COMSOL was (30 m, −20 m), the data from which shows us the temperature distribution in the landfilling area (zone I). In order to verify the reliability of the simulation scheme, 720 days on-site measured temperature data of Wuhan Jinkou Landfill were selected for comparison.
According to Figure 3, the temperature curves reach their peaks of 71.4°C on the 285th day (only aerobic degradation reaction), 69.7°C on the 260th day (degradation and aeration), 55.2°C on the 213th day (degradation and recirculation) and 54.7°C on the 213th day (degradation, aeration and recirculation). Compared with the peak temperature that only considers aerobic degradation reaction, the peak temperatures reduced by 2.38, 22.69 and 23.39%, respectively. The temperature curve considering aeration, recirculation and degradation fitted the field data well and verified the model’s applicability. According to the above curves, recirculation greatly influences the temperature distribution, whereas aeration has a minor influence. Recirculation can effectively advance the arrival time of the peak temperature and significantly can reduce the peak temperature. After the temperature curve reaches its peak, the temperature gradually decreases with time, which is related to the degradation of organic matter in the landfill. With the progress of the aerobic reaction, the organic matter gradually decreases, and the heat production also decreases until finally approaching the environmental temperature.
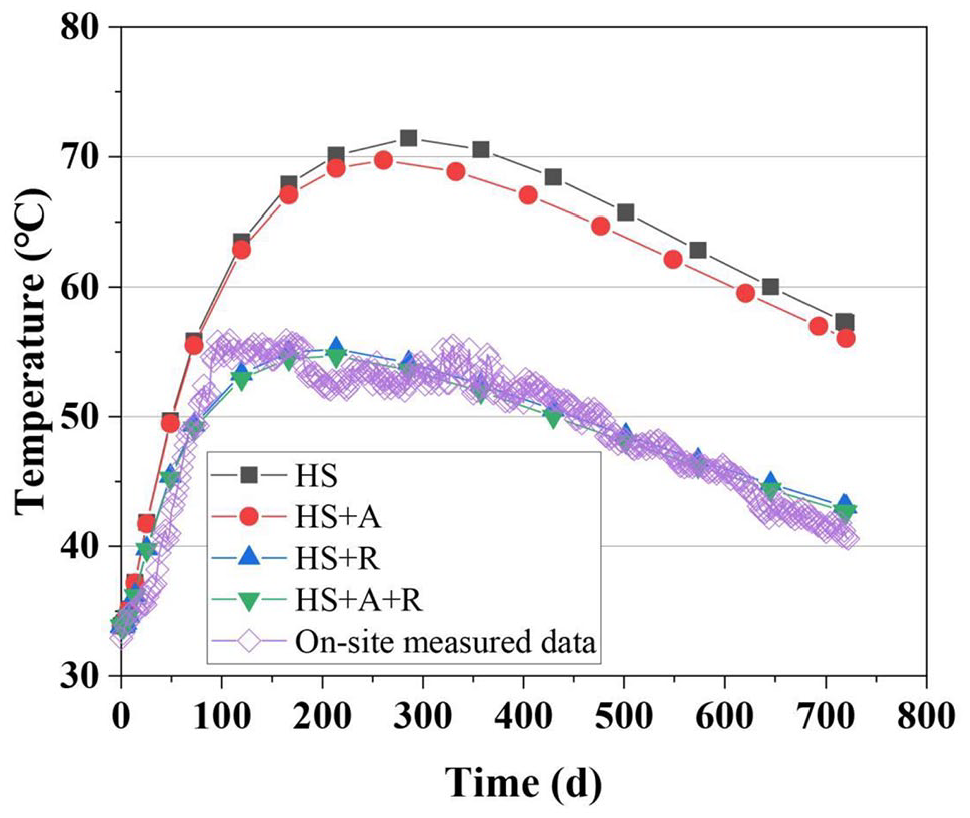
Effects of heat source (HS), aeration (A) and recirculation (R) on temperature.
After the model’s applicability was verified, the influence of aeration intensity, aeration temperature, recirculation intensity and recirculation temperature on the temperature distribution in the landfill was studied, and aeration and recirculation were carried out continuously for 24 hours.
Effect of aeration intensity on temperature distribution
As shown in Figure 4(a), aeration intensity curves are approximately parallel to each other and reach their temperature peaks at a relatively close time (the 213th day), but a slight advance of peak time with the increase of aeration intensity can be discovered. The peak temperature of the low-aeration intensity curve is 54.7°C, and that of the high-aeration intensity curve (gas flow rate is four times of the low one) is 53.2°C, and the decrease is only 2.74%. It can be considered that the aeration intensity has little influence on the temperature distribution of landfill.
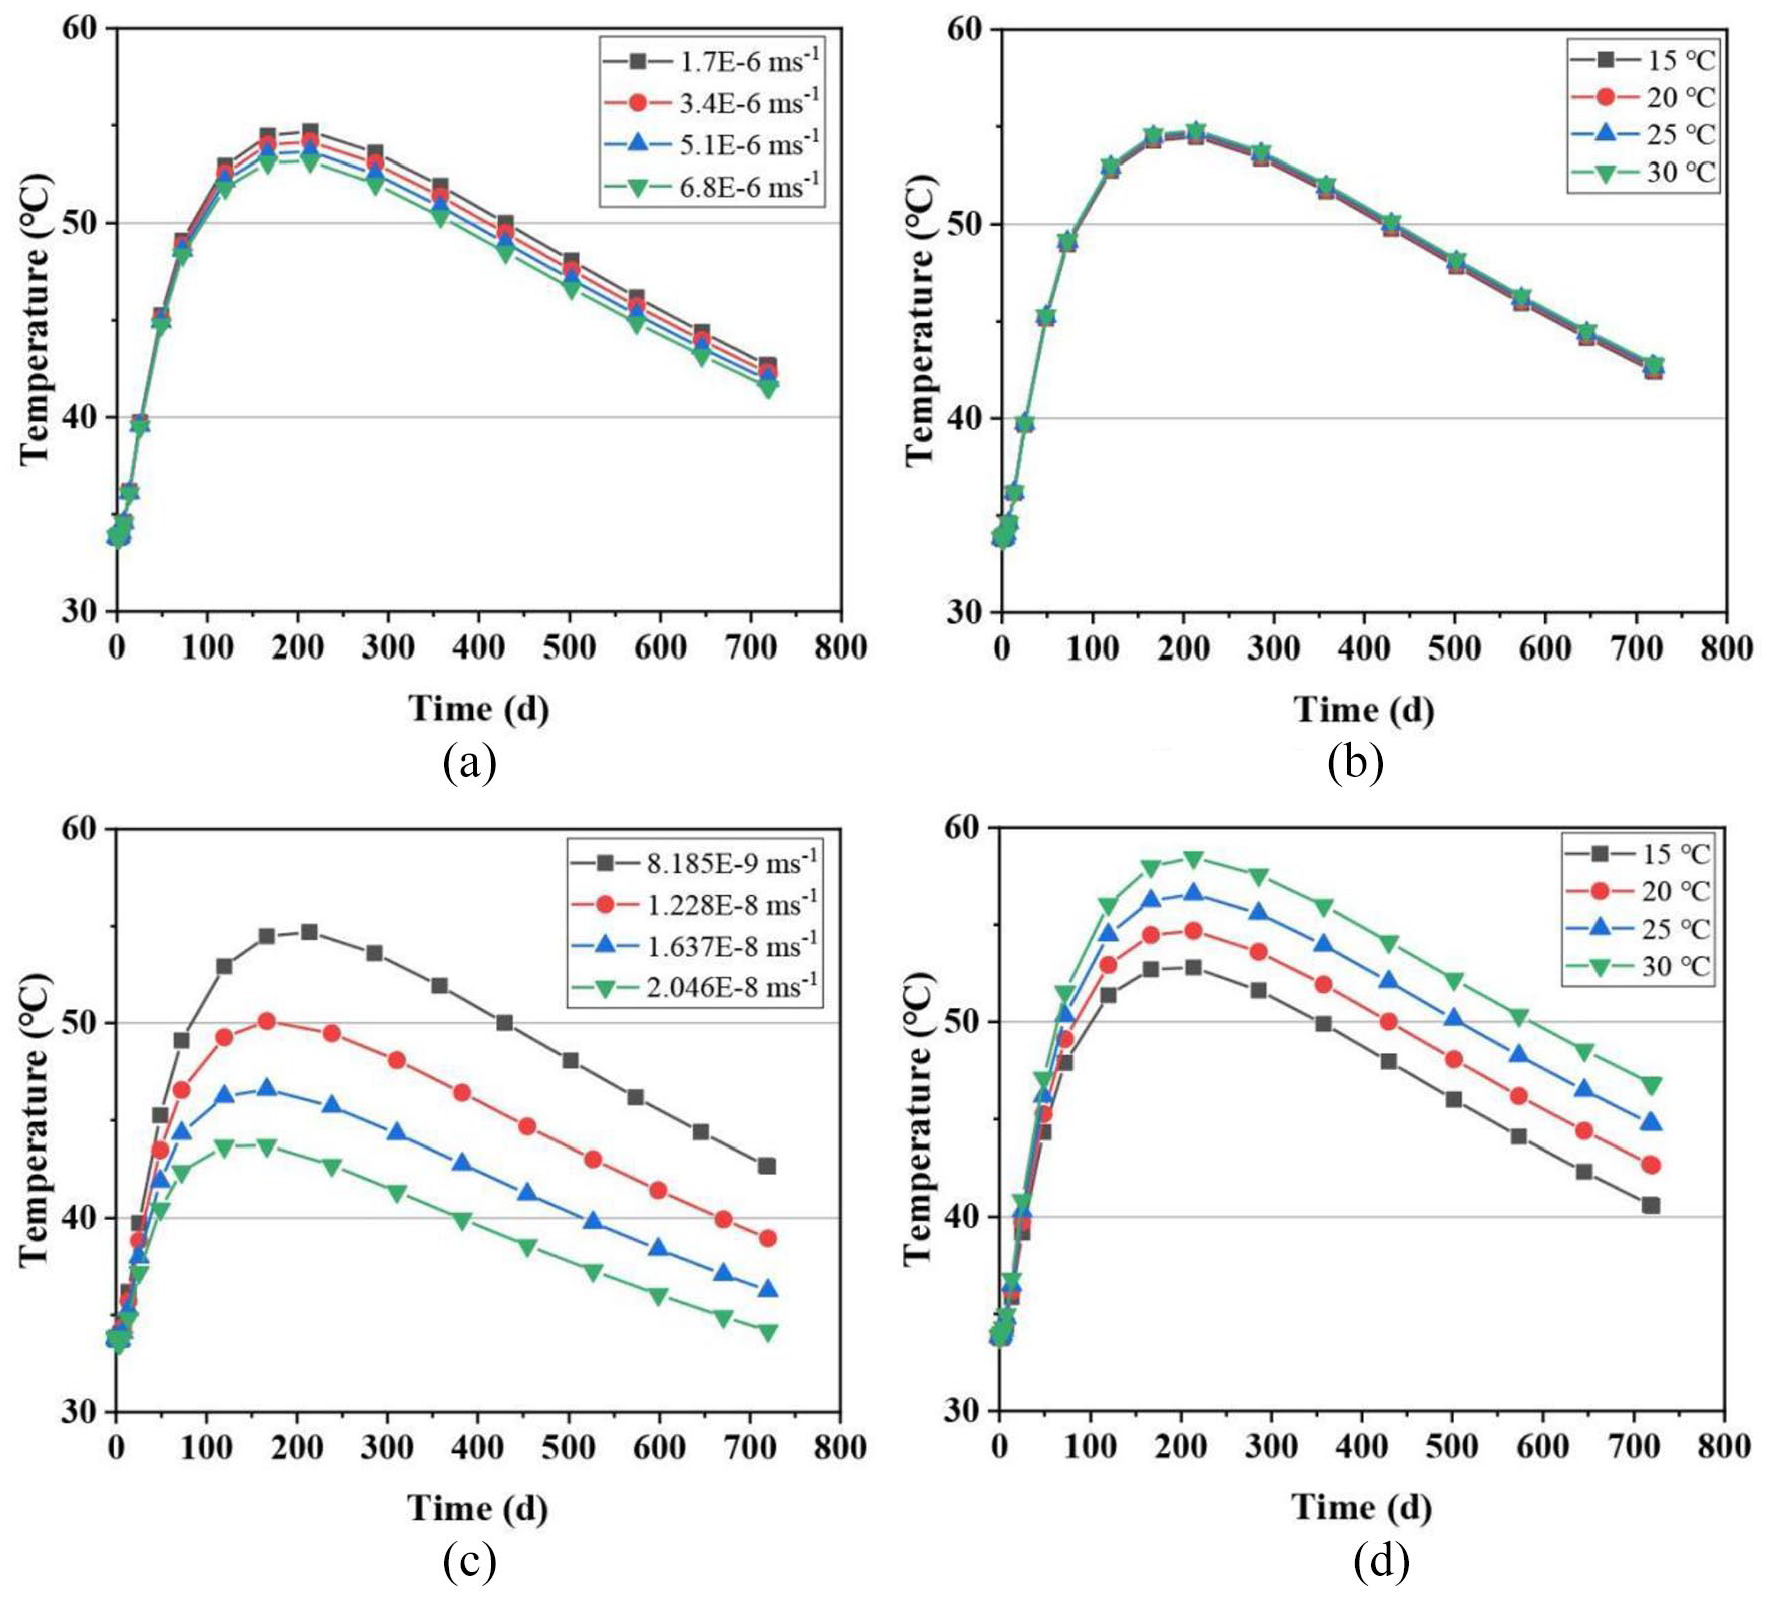
Effects of four factors on temperature distribution: (a) aeration intensity, (b) aeration temperature, (c) recirculation intensity and (d) recirculation temperature.
Effect of aeration temperature on temperature distribution
It can be seen from Figure 4(b) that the difference between the four curves is very small, indicating that the aeration temperature has little influence on the temperature distribution of landfill. The all four curves reach their peak temperature on the 213th day. The peak temperature is 54.8°C at the aeration temperature of 30°C and that is 54.4°C at the aeration temperature of 15°C, with a decrease of only 0.73%. It is concluded that aeration temperature has little effect on the temperature distribution of the landfill.
Effect of recirculation intensity on temperature distribution
The influence of recirculation intensity on the temperature distribution is shown in Figure 4(c). Under the same conditions of other factors, the temperature gradually decreases after reaching the peak, and with the increase of recirculation intensity, the arrival time of the peak temperature point appears earlier. When the recirculation rate is the lowest, the peak temperature appears near the 213th day. When the recirculation rate is low, the peak temperature appears near the 166th day. When the rate is high, the peak temperature point appears in the period of 119–166th day, the timing is difficult to determine from the graph; however, it is significantly closer to the 166th day. When the rate is maximum, the peak temperature point appears in the period of 119–166th day. The peak temperature of the minimum recirculation intensity is 54.7°C, and that of the maximum recirculation intensity is 43.7°C, which decreases by 20.11%.
Effect of recirculation temperature on temperature distribution
The influence of recirculation temperature on the temperature distribution is shown in Figure 4(d). The recirculation temperature has a specific effect on the arrival time of the peak temperature in the landfill, but it is not particularly significant. As for the value of peak temperature, recirculation temperature affects more. When the recirculation temperature is the highest (30°C), the peak temperature reaches 58.5°C on the 213th day. When the temperature is the lowest (15°C), the peak temperature reaches 52.8°C in the period from day 166 to day 213, which decreases by 9.74%. With the decrease of recirculation temperature, a slight advance in time can be observed, so it can be concluded that the initial temperature of recirculation does have a certain influence on the temperature distribution of landfill.
Model applicability analysis
In order to further analyse the reliability of the existing models for predicting the temperature distribution of aerobic landfill, the present model, the changed oxygen consumption rate term of the present model (using Borglin’s oxygen consumption rate equation) and the Hao’s model (only considering the aerobic degradation term, gas convection term and liquid term) were compared (Borglin et al., 2004; Hao et al., 2017). The results show that the simulation predictions of the model adopted in this article are closer to the on-site measured data of Wuhan Jinkou Landfill.
By substituting the model in this article, the model in combination with the oxygen consumption rate equation of Borglin and the model in the literature of Hao et al. (2017) into the simulation, respectively, the temperature distribution of the monitoring point coordinate (30 m, −20 m) can be obtained as shown in Figure 5.
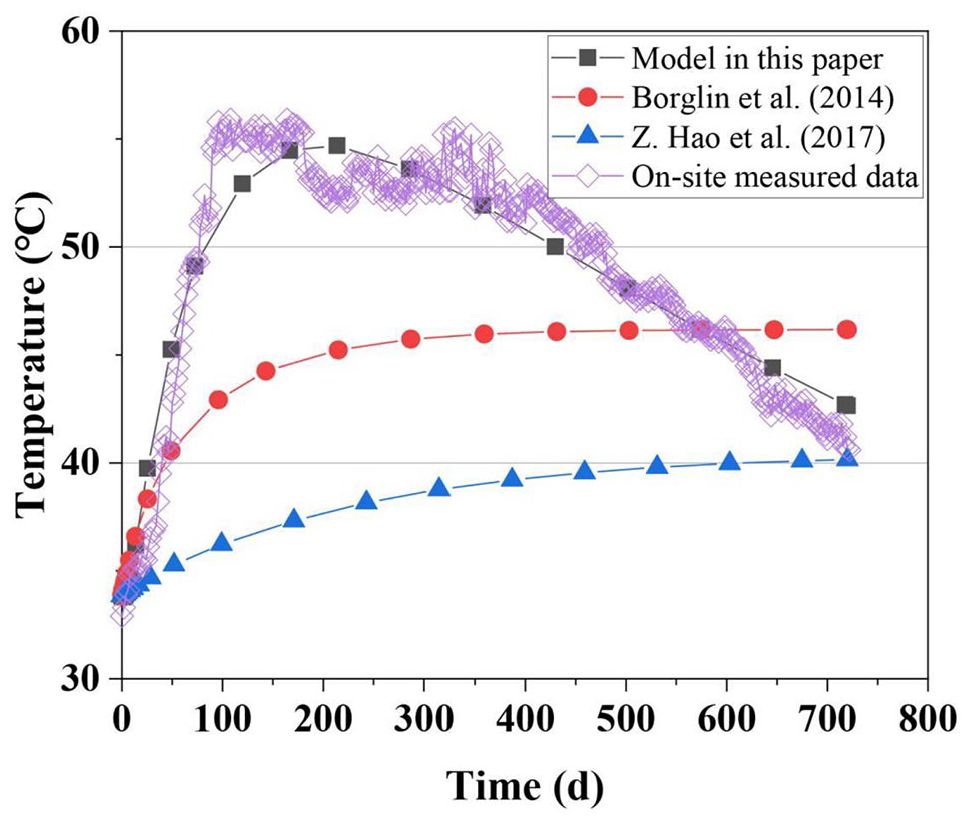
Model applicability analysis.
Hao’s model is used to predict the temperature distribution, and the result shows a big difference with the on-site measured data. For research on temperature distribution of large landfills, the model established in this article is more suitable than the time-varying model of garbage cell temperature proposed by Hao et al. (2017). Because the heat dissipation caused by heat conduction should be considered, that is, the variation of temperature with space should be considered and cannot just consider the heat change of a garbage cell for a temperature prediction that is closer to the reality.
Comparison analysis of oxygen consumption rate models
The internal heat source term of the temperature continuity equation is the key to accurately predicting the temperature change of landfill, and the internal heat source term is based on the oxygen consumption rate model related to heat generation from biodegradation. In order to investigate the influence of oxygen consumption rate model on temperature distribution, Linear Ascent Stage (LAS) model and Absent Ascent Stage (AAS) model were proposed based on NAS model:


According to Figure 6(a), there is an obvious gap among the curves obtained by NAS, AAS and LAS models. The gap is evident before 300 days, but that becomes small after 300 days, and the maximum difference of the prediction of peak temperature is only 3.09%. It is preliminarily believed that LAS and AAS models can be used for temperature simulation.
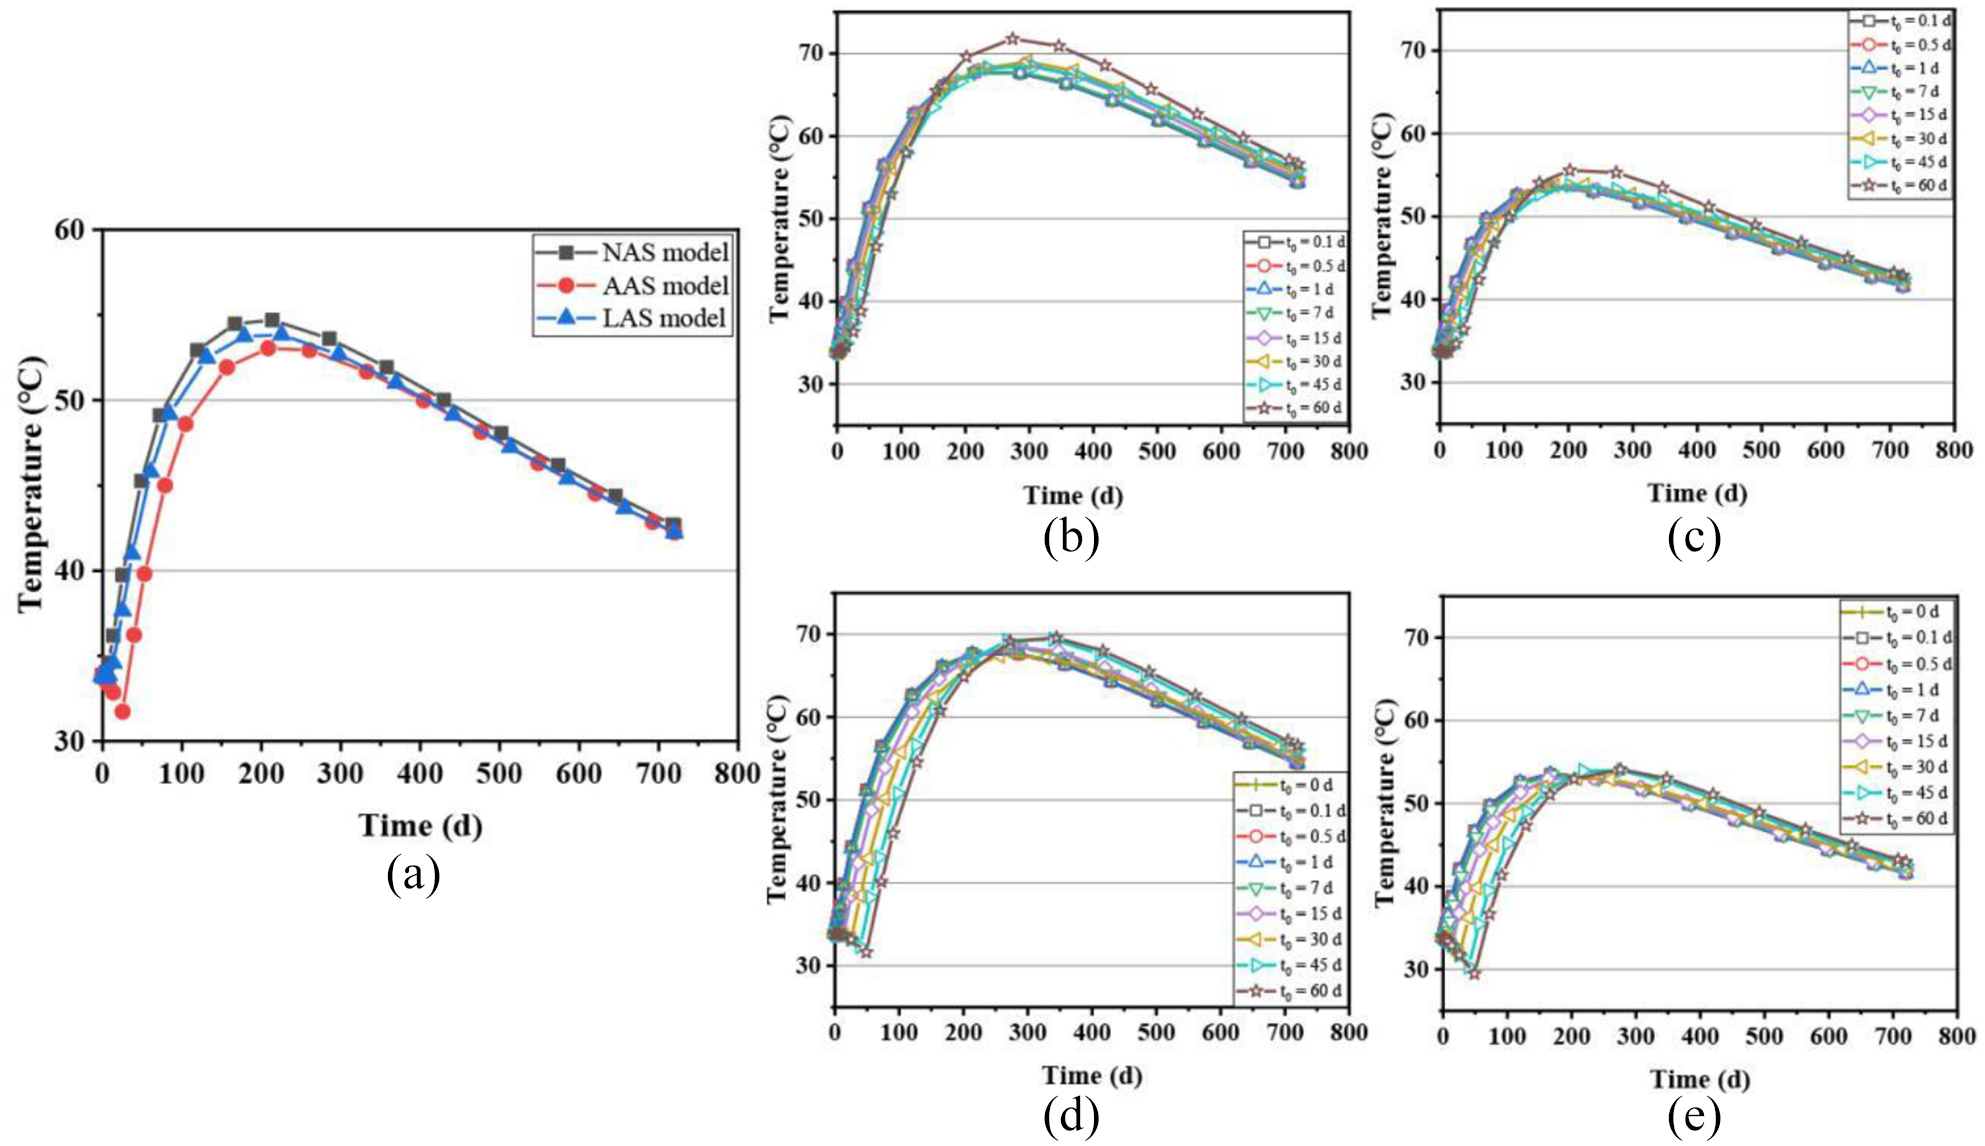
Effect of NAS, AAS and LAS models on temperature distribution: (a) Three models comparison, (b) LAS + no recirculation, (c) LAS + recirculation, (d) AAS + no recirculation and (e) AAS + recirculation.
On this basis, the effects of parameter t0 in LAS and AAS on the temperature distribution were explored. In the existing studies on oxygen consumption rate, the oxygen consumption rate curve is obtained by sampling at different time and fitting data points, so the time point t0 when the oxygen consumption rate reaches its peak is inaccurate.
LAS oxygen consumption rate model was used to simulate the influence of two conditions, no recirculation and recirculation, on temperature distribution at different t0, and the results are shown Figure 6(b) and (c). The recirculation condition can significantly advance the arrival of peak temperature and positively affect the decrease of peak temperature. With the advance of t0, the peak temperature shows a decreasing trend, and the peak arrival time also appears earlier. Before t0 = 45 days, the differences among curves are relatively small; the curves at t0 = 45 days and t0 = 60 days show obvious differences from others.
AAS oxygen consumption rate model was used to simulate the influence of no recirculation and recirculation conditions on temperature distribution at different t0, and the results are shown in Figure 6(d) and (e), respectively. Due to the lack of the first stage in oxygen consumption rate, temperature will drop before t0. The temperature drop in the absence of recirculation is less than that in the presence of recirculation. It can be discovered that recirculation has a significant influence on the peak temperature. In the AAS simulation, there is little curve difference before t0 = 45 days, but it becomes relatively large after t0 = 45 days. With the advance of t0, the peak temperature shows a decreasing trend, and the peak arrival time also appears earlier.
Discussion
Comparing the influence of aeration and recirculation on temperature, it can be found that recirculation has a more significant impact on temperature, which significantly affects the peak temperature and has an impact on the arrival time of peak temperature. In contrast, aeration has a small impact on temperature, which is similar to the conclusion proposed by Omar and Rohani (2017). This phenomenon is mainly influenced by the specific heat capacity. The specific heat capacity of liquid is much larger than that of gas, since the specific heat capacity of water is 3256 times that of gas. Compared to the same volume of gas, it takes more heat for water to increase by 1°C. With the increase of recirculation intensity, the peak temperature decreases from 54.7°C to 43.7°C, with a decrease of 20.11%. The recirculation temperature is closely related to the temperature change of waste. When the recirculation temperature difference is 15°C, the peak temperature decrease can reach 9.74%. However, the influence of aeration intensity and aeration temperature on the peak temperature is relatively small, and the decrease of the peak temperature is only 2.74 and 0.73%, respectively. Therefore, when setting the operating conditions of an aerobic bioreactor, the influence of recirculation temperature to the internal of a landfill at different seasons should be considered.
There is a large gap between the calculated results of Hao’s model and the on-site measured data. It shows that while studying the temperature distribution in a landfill, the temperature change in space gives a more realistic prediction of the results than that of the temperature change within a waste cell.
Both the NAS and Borglin’s oxygen consumption rate models were adopted for the simulation. It is found that the calculated results of NAS model were closer to the on-site measured data of Wuhan Jinkou Landfill than that of Borglin’s model, indicating that the oxygen consumption rate model is a two-stage model that rises first and then falls instead of the starting point being at the peak. The calculated results in this article also verified the feasibility of the two-stage model.
Based on the NAS model adopted in this article, the LAS and the AAS models were derived. In these models, the oxygen consumption rate reaches the same peak at different t0 (in the original model t0 = 30 days), and then decreases. When compared with the AAS model, the calculation results of LAS model are closer to that of NAS model. At the same time, it is found that the difference of temperature curve before t0 = 45 days is not particularly large, but after t0 = 45 days, there is a significant difference such that the t0 affects the term of heat release rate to some extent.
Conclusion
The seepage–temperature coupling model considering the effect of aeration, recirculation and degradation reaction was established in this article, and it was compared with Borglin’s model and Hao’s model. The two-stage NAS model in this article is better than Borglin’s index model for landfill temperature assessment. At the same time, Hao’s model considers the landfill as a cell body and does not consider the change of temperature with space, so it is not suitable for predicting the temperature change during the long-term operation of an aerobic landfill.
The results of sensitivity analysis in this article show that recirculation has the most significant effect on temperature, whereas aeration has a small effect on temperature. Among the four factors of aeration intensity, aeration temperature, recirculation intensity and recirculation temperature, the recirculation intensity of leachate has the most significant effect on the peak temperature, with a decrease of 20.11%. When the recirculation temperature difference in leachate is 15°C, the peak temperature decreases by 9.74%. However, the influence of aeration intensity and aeration temperature on the peak temperature of the landfill is relatively small, and the peak temperature decreases by only 2.74 and 0.73%. Meanwhile, recirculation can effectively advance the peak temperature arrival time by around 30%, whereas aeration has no significant effect on the peak temperature arrival time.
In view of the oxygen consumption rate of the NAS model adopted in this article, the LAS simplified model and the AAS simplified model were proposed. The results of three models show a decrease in the differences among results, and little influence on the temperature rising period. For the two simplified models, the results of the LAS simplified model are in better agreement than those of the AAS simplified model, which indicates that the two-stage oxygen consumption rate model should be considered for higher accuracy in temperature prediction.
The existing oxygen consumption rate model is composed of scattered data points fitting, which leads to inaccurate segmented trends and peak time points. The simulation results show that peak time t0 may have an impact on landfill temperature prediction accuracy. Therefore, it is of great significance to find out the trend of oxygen consumption rate model for accurate prediction of landfill temperature, operation and regulation.
Footnotes
Declaration of conflicting interests
The authors declared no potential conflicts of interest with respect to the research, authorship, and/or publication of this article.
Funding
The authors disclosed receipt of the following financial support for the research, authorship, and/or publication of this article: This work was supported by the Foundation for Innovative Research Groups of Hubei Province (2019CFA012), the National Natural Science Foundation of China (41977254), the Natural Science Foundation of Hubei Province for Distinguished Young Scholar (2021CFA096) and the Open Research Fund of State Key Laboratory of Geomechanics and Geotechnical Engineering, Institute of Rock and Soil Mechanics, Chinese Academy of Science (Z018007).