
Abstract
This study contributes to estimate the total waste generated at global level. A few studies have provided an efficient and comprehensive global estimate. However, data reporting is globally inconsistent due to varying interpretation of terminology, lacking standardised categories and varying methodologies used to observe and measure waste amounts. This study employs regression analysis and material flow analysis approaches to ensure a cross-comparability of waste generation data. The result implies that total global waste arisings are around 20 billion tonnes in 2017. This corresponds to 2.63 tonnes of total waste per capita (cap) per year. The total global waste generated is expected to grow to 46 billion tonnes by 2050 under a business-as-usual scenario. Municipal solid waste (MSW) is a much smaller amount, ranging from 2.3 to 3.1 billion tonnes (average of 2.7 billion tonnes) in 2019. This figure reflects an increase of between 30% and 50% in MSW generated during the last 15 years (2004–2019). MSW generated is expected to grow to 2.89–4.54 billion tonnes by 2050, depending on which assumptions are used. This represents a 26%–45% increase compared to 2019. The overall assessment in this study reveals that almost one-third of the total MSW generated is not collected, and most of what is collected is not treated accordingly to current ideas of sound management. Moreover, almost 42% of MSW goes to open dumping or uncontrolled burning. The finding provides valuable insight for policymakers to design and assess circular economy policy instruments towards achieving sustainable development goals.
Keywords
Introduction
Population growth and development combined with scarce land resources in urban areas have posed problems for decision-makers to handle ever-increasing volumes of waste generated. A detailed and comprehensive accounting of waste generation, treatment and disposal forms the quantitative basis for the design and assessment of circular economy (CE) policy instruments. Whereas the lack of agreement on a common use of CE definition among academics, policymakers and practitioners is well-documented (Kirchherr et al., 2017), the need of quantitative indicators for assessing the ‘circularity’ of national economies, material cycles, supply chains and product life cycles is essential to facilitate its implementation (Ellen MacArthur Foundation, 2015). Although there is no specific definition or theory underlying it, the CE drives waste management towards better integration with resource management and incorporates waste management techniques into each and every supply chain (Mavropoulos and Nilsen, 2020).
Estimation of global waste generation is crucial to recognising the magnitude and complexities of solid waste management. Estimates – such as the amount of plastic pollution; efficiencies in the collection of waste; and lack of treatment and disposal capacity – are also important evidence that must be accurate in order to implement appropriate policy strategies to mitigate pollution and damage caused when waste interacts adversely with humans or the environment. Recently, Maalouf et al. (2020a) estimated the newly waste infrastructure projects delivered capacity worldwide between 2014 and 2019, which showed to be higher in the developed world. Therefore, the predominant disparity between the significant changes in municipal solid waste (MSW) generation and actual MSW infrastructure delivery contribute to a continual increase in uncontrolled waste disposal.
Waste generation has been examined and documented at various regional levels. Evidence shows that waste generation in high-income counties account for 34% of the world’s waste generated while low-income countries account for only 5% of global waste (Kaza et al., 2018). The decoupling of economic development from waste generation was investigated by some researchers (Anupam, 2012; Mazzanti, 2008; Mazzanti et al., 2012; Mazzanti and Zoboli, 2008, 2009; Magazzino et al., 2020; Nicolli et al., 2012), usually with an European scope and/or an emphasis on MSW (excluding industrial waste). Some studies analysed the causal relationship between per capita gross domestic product (GDP) and MSW generation in some countries. Soytas et al. (2007) and Lee et al. (2016) showed that there is no causality between GDP and MSW generation in the United States. However, Minelgaitė and Liobikienė (2019) study covering all Europe (excluding Luxembourg) revealed that the level of MSW generation depends significantly on economic development. Some prior research examined how the supply chain influences waste generation using input-output (I-O) tables (Jensen et al., 2013; C. Lee et al., 2012). However, these studies do not differentiate between the various types of waste, the economic waste generation sectors, and the products and services contributing to waste generation. Moreover, the above studies used waste data compiled for particular countries or a set of developed economies such as the European Union (EU) without considering a trade-linked inventory; thus, one cannot relate consumption to waste produced abroad (Tisserant et al., 2017). As for developing economies, estimating waste generation is challenging due to neglecting waste generation in places that lack formal collection system; waste leakages to the environment before collection; and waste collected by the informal sector (e.g. street collection). For instance, a commonly adopted approach in developing countries is to measure waste based on a combination of the weight of waste on collection vehicles entering landfill or disposal sites and the weight of waste formally collected for recycling (Kawai and Tasaki, 2016). Tisserant et al. (2017) conclude that at global level, a comprehensive and consistent accounting of waste generation and management is still lacking.
Assessing and reporting on MSW generation worldwide remain a persistent problem. Five major reports (D-Waste, 2013; Gasquet, 2009; Kaza et al., 2018; Verisk Maplecroft, 2019; Wilson et al., 2015) using different data sets and approaches, and reacting to diverse stakeholders’ interests in a number of institutional landscapes have assessed MSW generation at a global level within the period 2006–2018 as illustrated in Table 1. A comparison among these reports showed that all of them reported the MSW generated within this period to be on the order of 2 billion tonnes per year. The reported value is problematic because the world population increased by almost 1 billion person (equivalent to 15% increase) and the GDP per capita (cap) increased by 30% between 2006 and 2018 (Table 1). The world GDP is expressed in purchasing power parity (PPP) constant 2011 international dollars and the data are taken from World Development Indicators database. The results reflect a persistent variability in estimating global MSW arisings among different reporting schemes, which necessitate consistent accounting procedures to ensure accurate quantification of waste generated. The aforementioned reports are based on the literature and national reports; thus, suffering from three main problems: (1) these reports do not consider unregistered waste quantities that are not usually included in the reporting systems, especially in the developing world, with the most characteristic example of waste that is openly burned as a residential practice in rural areas, (2) there is a significant difference in waste definitions that makes the reported numbers not comparable and (3) they do not take into consideration waste related to trade and export. Trade waste is the waste that is produced during the processing of products and services for the supply of exports but is processed in the country where the production takes place. Therefore, a global assessment of solid waste generation at the world level is lacking (Tisserant et al., 2017). Attempting to solve this is a governance issue and is crucial if Sustainable Development Goals (SDGs) reporting is to ensure proper quantification of waste generated.
Five major reports on global MSW generation assessment.
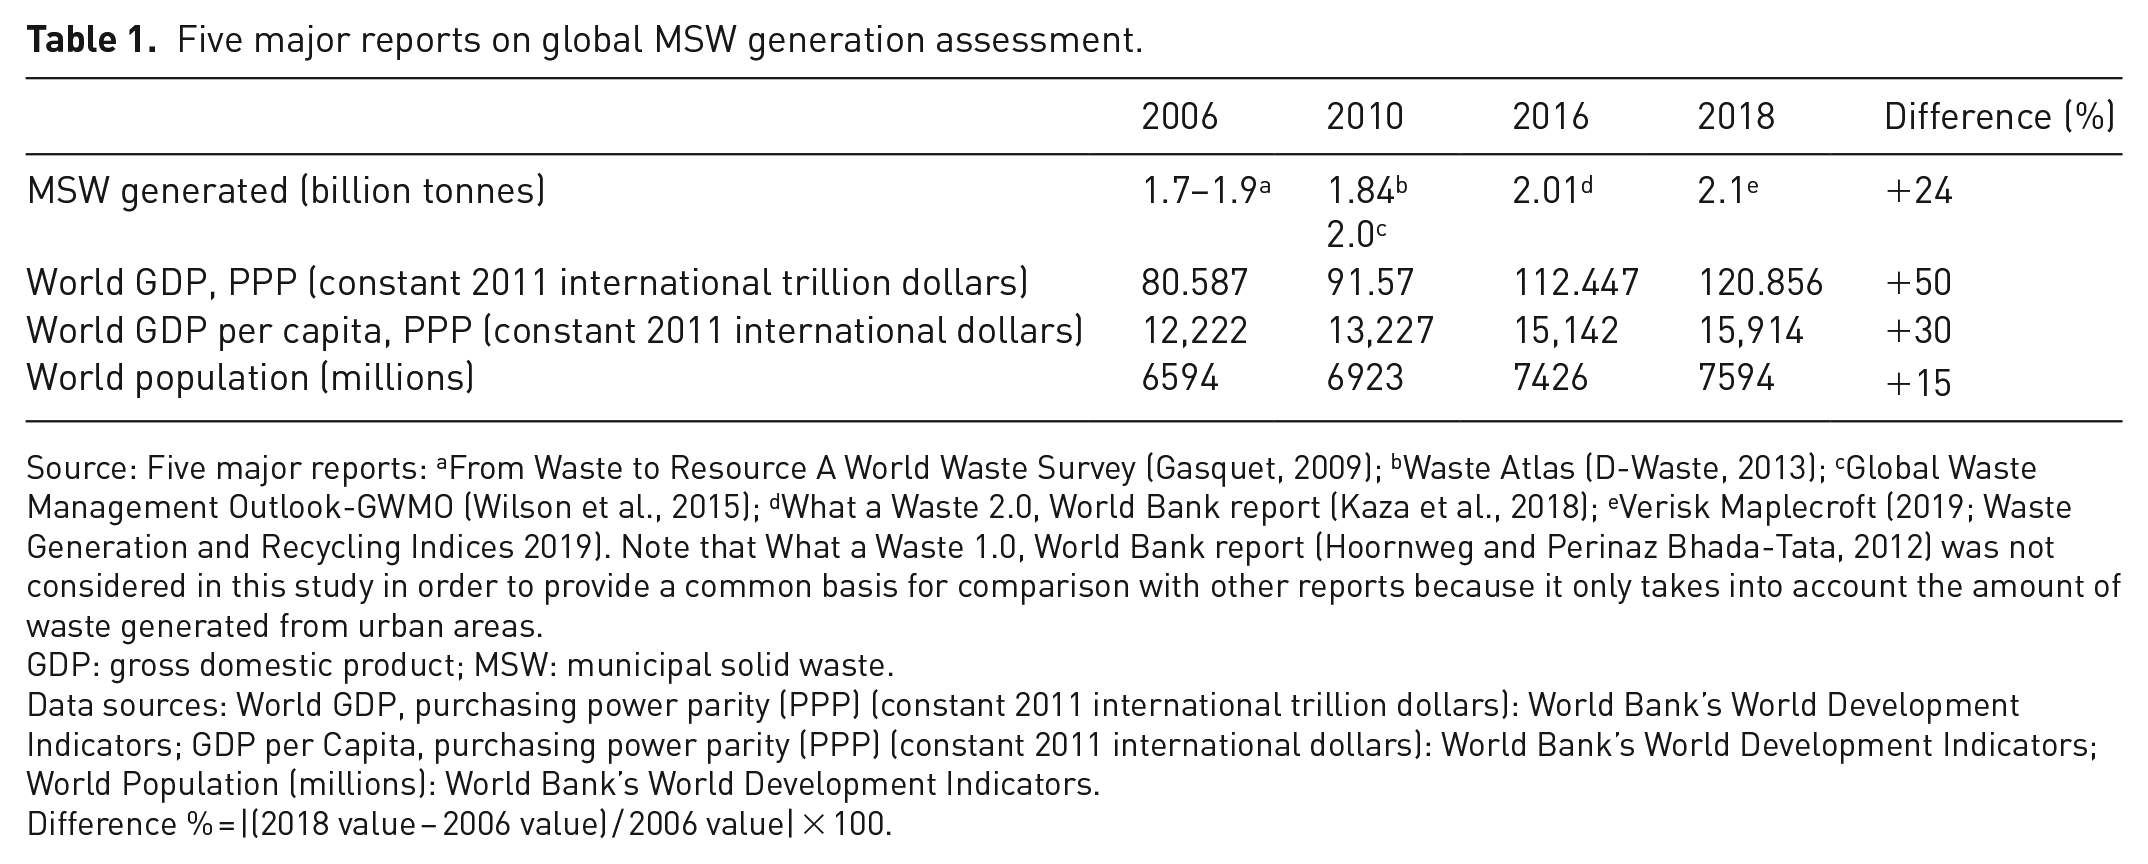
Source: Five major reports: aFrom Waste to Resource A World Waste Survey (Gasquet, 2009); bWaste Atlas (D-Waste, 2013); cGlobal Waste Management Outlook-GWMO (Wilson et al., 2015); dWhat a Waste 2.0, World Bank report (Kaza et al., 2018); eVerisk Maplecroft (2019; Waste Generation and Recycling Indices 2019). Note that What a Waste 1.0, World Bank report (Hoornweg and Perinaz Bhada-Tata, 2012) was not considered in this study in order to provide a common basis for comparison with other reports because it only takes into account the amount of waste generated from urban areas.
GDP: gross domestic product; MSW: municipal solid waste.
Data sources: World GDP, purchasing power parity (PPP) (constant 2011 international trillion dollars): World Bank’s World Development Indicators; GDP per Capita, purchasing power parity (PPP) (constant 2011 international dollars): World Bank’s World Development Indicators; World Population (millions): World Bank’s World Development Indicators.
Difference % = |(2018 value − 2006 value) / 2006 value| × 100.
It has long been a challenge to compile high-quality waste data. In this context, the 2015 edition of the Global Waste Management Outlook (GWMO) (Wilson et al., 2015) identified the major areas of concern, namely, (1) the lack of standard definitions and classifications, (2) the absence of measurement and of standard methodologies for measurements, (3) the lack of standard reporting systems and (4) the scope of what should be considered waste data and information (Wilson et al., 2015). In addition, the presence of unregistered waste quantities that usually are not included in the reporting systems, especially in developing economies, is another usual problem that results in significant underestimations of the waste generated. In relation to waste definitions, for instance in developing economies, MSW is generally defined as the waste generated in municipalities. Most of the MSW generated in developing economies is non-separated at source, and thus may be hazardous or non-hazardous (Karak et al., 2012). Other challenges in measuring waste generated are the exclusion of waste that is not managed/collected by the municipality or produced in rural areas, as well as variations in waste generation by activity and with time and from transient populations. For example, previous studies such as the World Bank’s (WaW 1.0) report (Hoornweg and Perinaz Bhada-Tata, 2012) only reported the amount of waste generated in urban areas. This can be of particular importance considering that MSW generation in rural areas is estimated to be half that of an aggregate urban rate (Karak et al., 2012; Kaza et al., 2018). Therefore, neglecting waste generated from rural areas can result with an underestimation of the total waste generated at the national or global level.
The estimates available are various, not verified or accurate, and are often relatively dated. Consequently, it has been difficult to convert waste data into accurate waste statistics. In this context, assessing global MSW arisings has attracted considerable attention in several recent studies. An approach based on material flow analysis (MFA) (Tisserant et al., 2017) calculated the annual global MSW generation rate, using the multiregional I-O EXIOBASE global database (Stadler et al., 2018), reported a value of about 3.2 billion tonnes MSW in 2007. A study on open burning (Wiedinmyer et al., 2014) estimated the global MSW waste generation to be around 2.4 billion tonnes in 2010. The latter has adopted country waste estimates from WaW 1.0 report (Hoornweg and Perinaz Bhada-Tata, 2012), which estimated total world MSW generation of 1.3 billion tonnes. Another study by Christian et al. (2010) gives an estimate of 2 billion tonnes of global MSW generated in 2010. Despite the growing need for reliable waste statistics at global level, there remain major conceptual and methodological challenges. The lack of globally harmonised definitions, concepts and methodologies contributes to non-comparability of data and overlap of concepts. The key guideline manuals on environmental statistics, such as the Framework for the Development of Environmental Statistics (FDES) (United Nations and Statistical Division, 2017) and the System of Environmental-Economic Accounting (SEEA), offer only general instructions and leave a great deal of space for various methods and interpretations. Recently, the SDGs 11.6.1 (United Nations, 2019) seek to fill this gap and standardise definitions in effort to making data points comparable. Nevertheless, institutions setting up statistics can contribute to over- or under-estimation of the quantity of waste and/or of particular waste streams or fractions for political or businesses purposes.
The MFA has become widely applied methods to provide a system-oriented view of interconnected processes and flows supporting strategic- and priority-oriented decisions and to designing management measures (Allesch and Brunner, 2017). These methods have been ultimately adopted to support waste management decision-making. The MFA concept is gaining weight as an alternative approach to quantify the total waste generated worldwide instead of officially reported quantities or literature data. In fact, data on waste generated in most cases are extrapolated from variety of sources such as macro-economic data, statistical and/or other surveys (e.g. websites and reports). This is particularly important with the presence of unregistered waste quantities that usually are not included in waste reporting systems, especially in developing economies, and the inconsistent use of waste definitions that makes reported numbers and waste data not comparable. Therefore, MFA is an effort gaining weight as an alternative approach to increase the efficacy and usefulness of building knowledge from large data sources and surveys.
Besides that, the main reason for calculating waste using the mass-balance systems (MBS) approach is that input data on natural resources, products and emissions are generally of a higher quality compared to data on reported waste generation, which are provided by national institutions using different waste definitions, classifications and accounting schemes.
The economy-wide material flow accounting (ew-MFA) was applied into official statistical reporting by national and international organisations, including the Organisation for Economic Co-operation and Development (OECD, 2015, 2019) reporting on green growth and material productivity, the World Resources Institute (Matthews et al., 2000) and reports by the International Resource Panel of the United Nations Environment Programme (UNEP, 2011, 2016, 2019). Increasing awareness to environmental economic interrelations and the usefulness of ew-MFA indicators are exemplified by several efforts that have been implemented for assessing global materials flows and their outcomes related to solid waste using mass-balanced approach. For example, the OECD (2013) reported that about 20% of the materials extracted worldwide end up as waste (20%), and other recent studies (Haas et al., 2016; Krausmann et al., 2018) considered that the total wastes arising are 22.5% of the resources extracted.
In current practice, ew-MFA databases cover the mass-balanced indicators of domestic extraction of primary materials (e.g. biomass, metals, non-metallic minerals and fossil fuels), international trade (imports and exports), in-use stocks, as well as resulting wastes and emissions and all derived indicators (Wiedenhofer et al., 2019). Just a few studies have attempted to include a mass-balanced image of national economies’ input and output flows (Krausmann et al., 2018); the influential studies reported by the World Resources Institute (Matthews et al., 2000) are significant exceptions. On the contrary, several international data sets with global coverage have compiled data on extraction of materials. Recently, a global harmonised data set for 1900–2017 (including forecasting until 2050) has been jointly compiled by Krausmann et al. (2018) research team.
To fulfil the gap, this study intends to provide a global accounting of waste generation and management patterns. Ultimately, this study aims to guide both academics and policymakers to develop strategies for global waste management to achieve SDGs and a CE. Unlike previous studies, we employ two methodologies based on regression analysis (RA) and MFA to ensure a cross-comparability of waste generation data. Despite that these two approaches have been previously employed and served different purpose; these two methods should be complementary. Therefore, relative to former research, it provides more efficient and comprehensive global estimates. It also provides a forecasting of global waste generation for the year 2050. Finally, this study examines the global status of MSW management.
Materials and methods
In an effort to quantify the gap between the previous efforts and provide a more accurate estimation of global waste generation, two approaches are considered in this study to achieve the research objectives: (1) RA and (2) MFA. It is worth noting that in this study, the term ‘total waste’ refers to waste generated from different waste streams such as MSW, construction and demolition (C&D) waste and industrial waste, etc. ‘Municipal solid waste’ is used to refer to this type of waste. The forecasting method used was based on the type of data, type of waste stream studied and waste accounting method.
RA
In their review on modelling waste generation approaches, Beigl et al. (2008) concluded that the type of waste streams to be analysed is the primary criteria for modelling method selection. In most situations, the most beneficial modelling methods for evaluating the relationship between the degree of affluence or the economic development and the generation of total MSW are the correlation and regression analyses. However, a more detailed study of the relationship between economic development (e.g. GDP) and waste generation has found that there are different patterns in the relationship such as population growth that was found to have a greater impact than GDP (Rimaitytė et al., 2012).
The RA approach was used in this study to estimate global MSW generated. This approach assumes that the growth of MSW generation is affected primarily by two factors: (1) the GDP growth whereby a well-documented relationship between economic growth and MSW generation per capita is reported in the literature (Beigl et al., 2008; Chung, 2010; Minelgaitė and Liobikienė, 2019; Rimaitytė et al., 2012). At a country level, the growing and advancement in economy, measured by the GDP per capita, is also reflected by an increase in its per capita waste generation rates (Kaza et al., 2018). Given the well-documented relationship between GDP cap−1 and MSW generation per capita, it is assumed that a similar relationship should be valid on a global scale using the world’s GDP per cap. This provides a starting point for calculations that assess the world’s waste generation per capita in accordance with available data sets that correlate GDP per cap or Gross National Income (GNI) with waste generation. (2) The Population growth, whereby at a country level, the rise of population contributes to an increase in the amount of total waste produced. Based on the outcomes of the previous Step (1), the total waste generated per capita is multiplied by the population data that are much accurate and have a first assessment of the world’s waste generated per year.
However, it is important to notice that using the world’s GDP cap−1 (or the GNI cap−1) in a trendline function involves some uncertainties and risks. First, the correlation between GDP cap−1 and waste generation is not a concrete one, as many research papers have demonstrated (Wilson et al., 2012). Second, there is a hidden assumption that as the world’s GDP cap−1 is growing, the waste generation worldwide will follow the trendline that comes out from countries’ data. The problems here are that (1) the countries’ data on waste generation are also very problematic in many cases and (2) the correlation in countries with GDP cap−1 less than US$20,000 is weaker than the correlation in high-income ones (Kawai and Tasaki, 2016). However, it is assumed that applying this methodology will provide a rough estimation or an order of magnitude of the waste generation worldwide. Future work will focus on further elaborating and refining this assumption to provide a solution to the problem of time series and a way to forecast future waste generation based on population and GDP per capita forecasts.
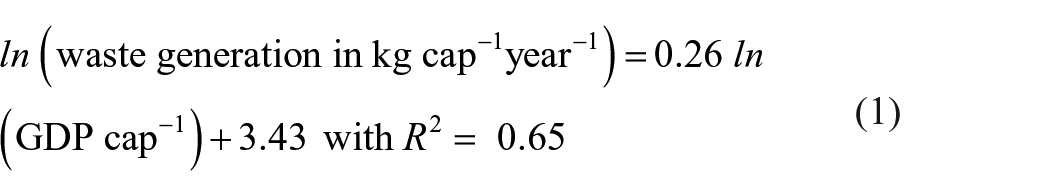
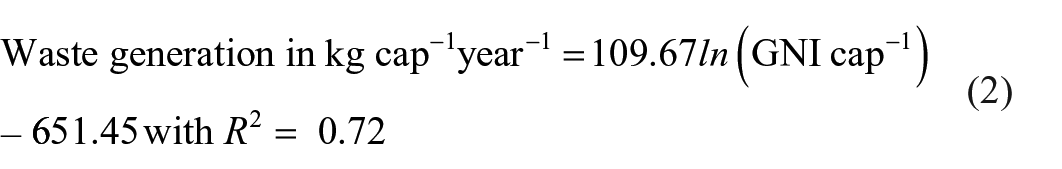
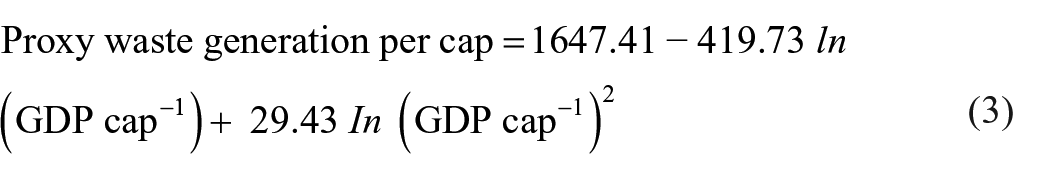
The three regression models expressed in equations (1)–(3), which reflect the relationship between the economic development (e.g. GDP per cap) and waste generation, adopted in this study were retrieved from the (1) ‘Waste Atlas’ (D-Waste, 2013) with data corrected after the authors, the (2) ‘GWMO 1’ (Wilson et al., 2015) and the (3) ‘What a Waste 2.0 - World Bank’ (Kaza et al., 2018) reports, respectively. The world GDP and GNI per cap were retrieved from the World Bank database (World Bank, 2021), whereas the global population figures were extracted from the United Nations’ World Population Prospects (United Nations Department of Economic and Social Affairs Population Dynamics, (UNDESA), 2019).
The Waste Atlas model uses the World Bank’s World Development Indicator’s GDP per capita (current US$) (model derived by the authors). It was developed using country-level waste generation data from 159 countries and is expressed in equation (1)
The GWMO model uses the World Bank’s World Development Indicator’s GNI per capita (constant 2010 US$). It was developed using country-level waste generation data from 82 countries and is expressed in equation (2)
The What a Waste 2.0 (World Bank) model uses the World Bank’s World Development Indicator’s GDP per capita, PPP (constant 2011 international dollars). It was developed using country-level waste generation data from about 215 countries and is expressed in equation (3)
It is important to highlight that the aim of this study is not to make an accurate estimation of the MSW generated but rather to outline a methodology that provides more consistent results in a relevant time scale.
MFA
The MFA approach, which links the resources extracted with the total waste arisings, was adopted in this study to estimate total global waste generated. According to (OECD, 2013) and other studies (Haas et al., 2016; Krausmann et al., 2018), between 20% and 22.5% of the materials extracted worldwide ends up as waste. In an attempt to link the global material extraction (known as Domestic Extraction – DE) with the total waste arisings, an average of 21% of resources extracted worldwide was assumed in this study to estimate the total global waste arisings. The global harmonised data set for 1900–2017 (including forecasting until 2050) has been used as it was compiled by Krausmann et al. (2018) research team. This data set is in consistence with MFA database provided by UNEP (UNEP, International Resource Panel, 2021) that is subject to regular updating and reporting by UNEP. The approach of Krausmann et al. (2018) build on previous work that has focused on global materials extraction by considering for the first time in a more systemic and consistent way the in-use stocks of materials, net additions to stock and output flows under a single framework. Therefore, these data have been used to estimate the relative quantities of global waste arisings as disaggregated by four major categories: biomass, metal ores, fossil energy carriers and non-metallic minerals.
Following that it was assumed that MSW is 11% of the total wastes arising based on data (Eurostat, 2016) from developed countries (e.g. EU and OECD) but they are a rather higher percentage to developing countries, sometimes going up to 15% when there is a lack of mining activities. Hence, more efforts are needed in this context towards the assessment of actual MSW arising based on the total waste arising with data compiled from different regions.
Accordingly, two different scenarios for MSW as a percentage of total waste arisings: (1) ‘MFA (11%)’ lowest production and (2) ‘MFA (15%)’ highest production were considered for this approach based on the resources extracted for the years 2004, 2009, 2014 and 2019.
Results and discussion
Total waste generated
A complete discussion of the total waste arising requires the consideration of the entire life cycle of materials and products. These include mining and quarrying wastes (extraction); agricultural and forestry wastes; industry wastes (materials, parts and product manufacturing); C&D waste; commerce and institutions (C&I) waste (distribution and services); consumption (households) and MSW (Wilson et al., 2015). In the Russian Federation for instance, MSW contributed to only about 0.8% of total amount of waste generated in 2019 while the mining and extraction of fuel and energy minerals constituted the largest contributor (93.6%) to the total amount of waste generated (Maalouf et al., 2021).
Based on the MFA, the total waste generated worldwide estimated in this study is displayed in Figure 1(a) whereas the main waste material composition worldwide is presented in Figure 1(b). The total waste arisings worldwide are estimated in this study to be around 19.8 billion tonnes in 2017 (Figure 1(a)). This corresponds to 2.63 tonnes of total waste per capita per year.
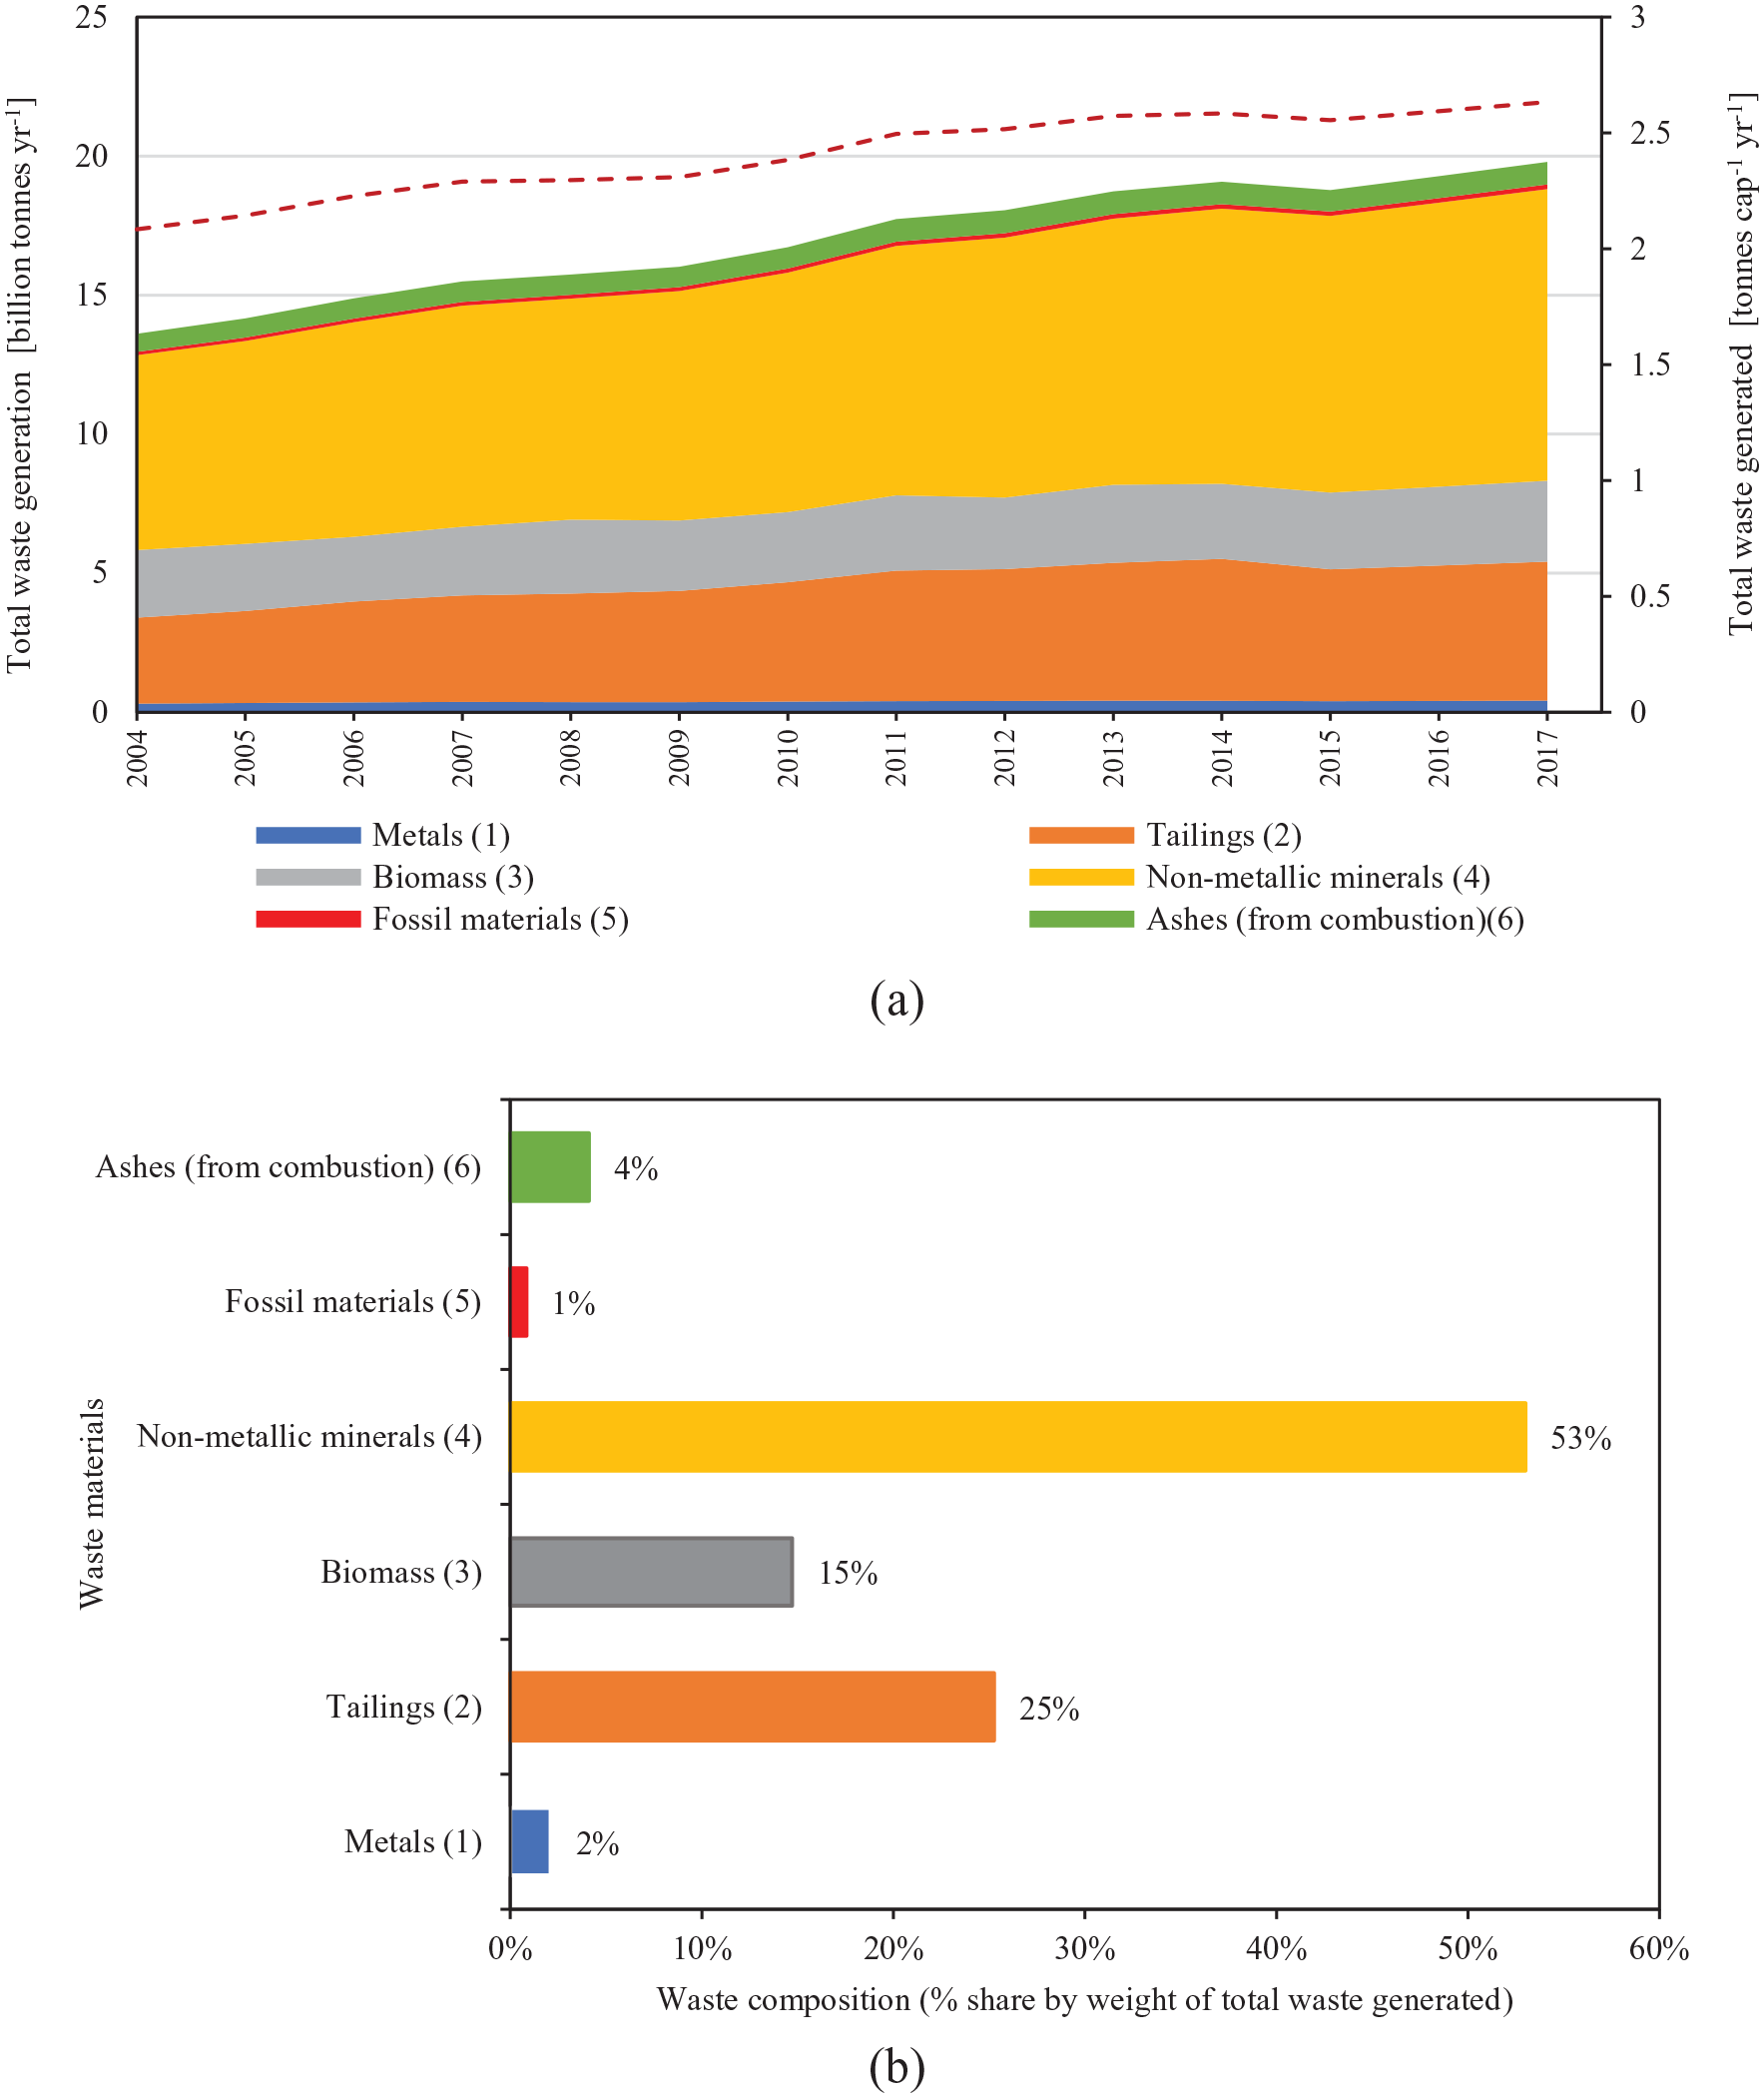
Total waste generation and composition at the global level. (a) Total waste generated worldwide. It shows the total global waste generated in billion tonnes year−1 from 2004 to 2017 by main waste material groups (left-axis) and in tonnes cap−1 year−1 (right-axis). In principle, it is possible to attempt to extrapolate from the global material extraction (DE) data, to estimate the total worldwide waste arisings. Such extrapolation was facilitated by the availability of DE data from Krausmann et al. (2018) for the period 2004–2015 and from UNEP, International Resource Panel (2021) for the period 2016–2017. (b) Main waste material composition worldwide. Based on composition of end of life and processing waste in the material and product life cycle.
Figure 1(b) suggests that the three major waste material groups: non-metallic minerals (e.g. cement and concrete, bricks, primary sand and gravel, down-cycled secondary construction minerals, flat glass and container glass) represent around 53% of the total waste generated, tailings (from ore processing) around 25% and biomass (e.g. solid wood and construction timber, paper and paperboard) around 15%, predominate. These sources are interesting, as they represent the best measure available of those residues which have been estimated from the composition of end of life and processing waste in the material and product life cycle.
Projected total waste generation
Using the same methodology, it is forecasted that by 2030, the world is expected to generate 28 billion tonnes of total waste annually and by 2050 the total waste generated is expected to grow to 46 billion tonnes. At the capita level, waste generation is expected to reach around 4.71 tonnes cap−1 year−1 in 2050 (Figure 2).
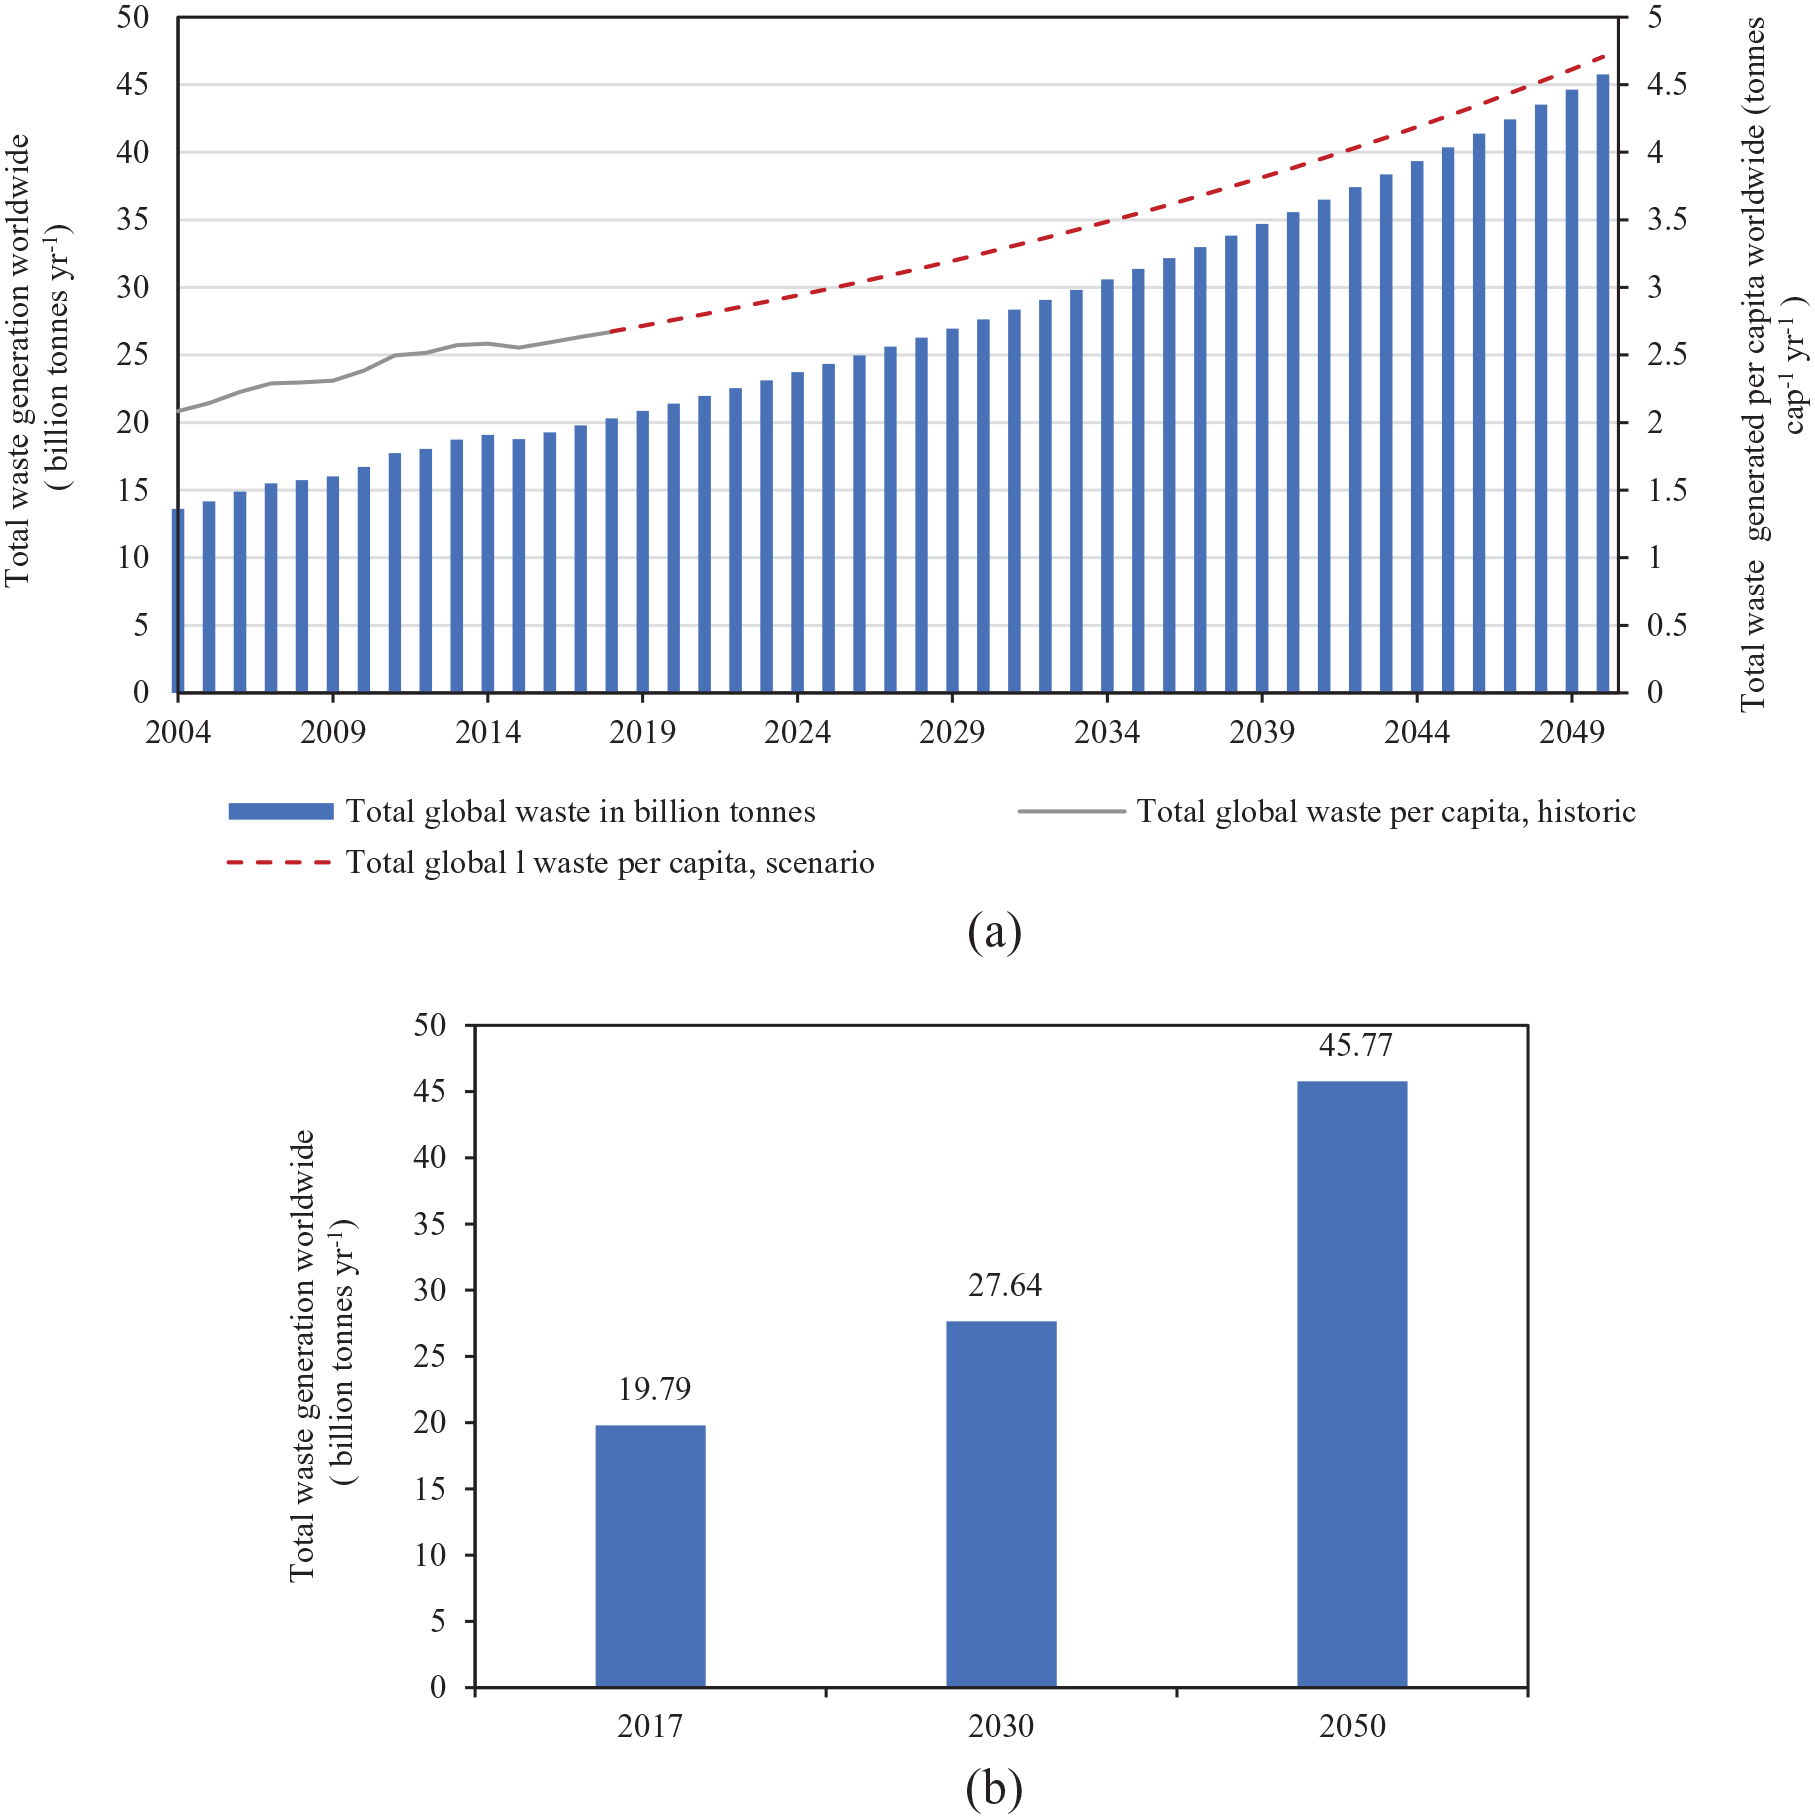
Projected total waste generated worldwide. (a) Total waste generation worldwide from 2004 to 2050. (b) Projected total waste generation worldwide from 2017 to 2050.
Total MSW generated
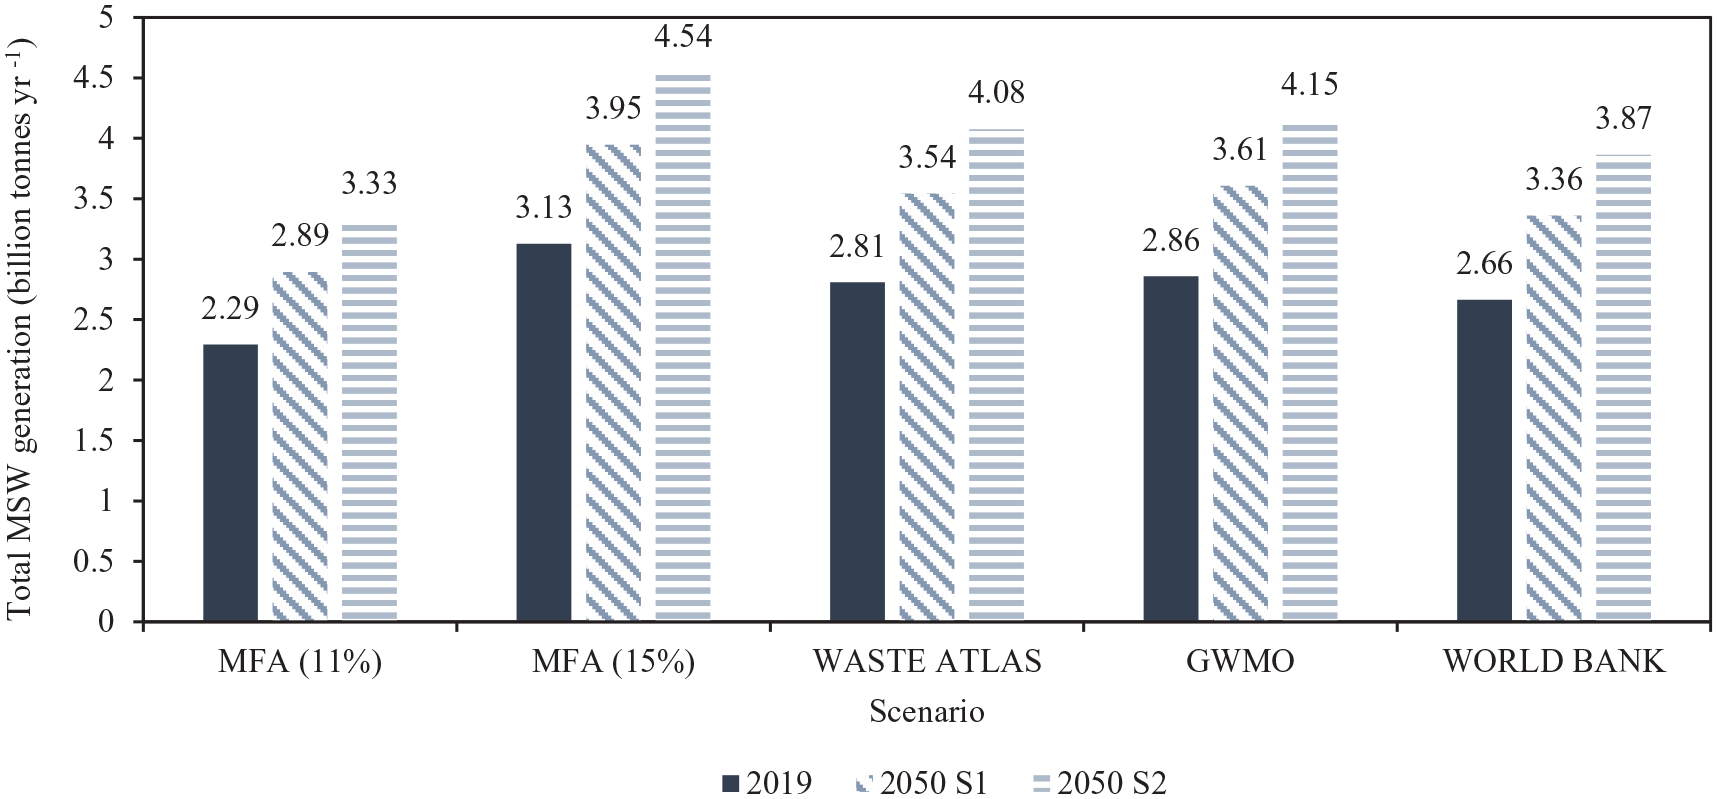
Figure 3 shows the range of MSW generated within the period 2004–2019 based on the two approaches described above. The two scenarios ‘MFA (15%)’ and ‘MFA (11%)’ are based on the MFA approach whereas the three other scenarios ‘WASTE ATLAS’, ‘GWMO’ and ‘WORLD BANK’ are based on the RA approach.
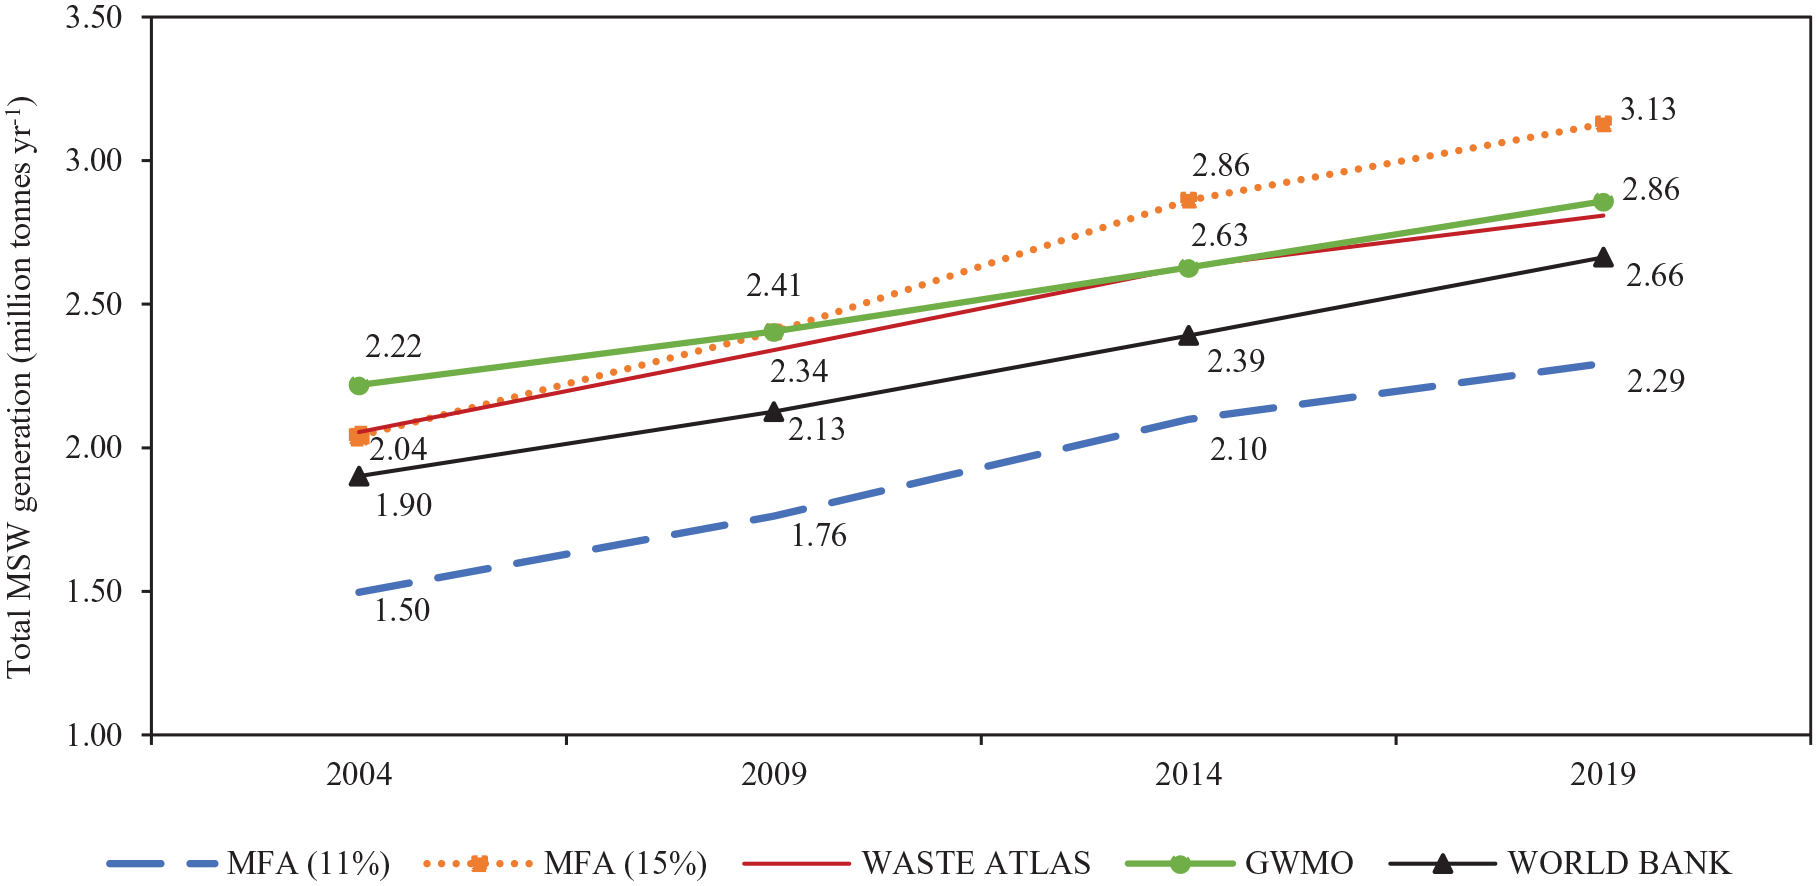
Range of MSW generation for the period 2004–2019.
Overall, all models followed the same general trend of predicting increased MSW generation within 2004–2019. WASTE ATLAS, GWMO and WORLD BANK prediction models fell between MFA (15%) (highest prediction) and MFA (11%) (lowest prediction) results. Moreover, the Waste Atlas and GWMO models provide very close predictions.
Five estimates of MSW waste generation are presented in Figure 3 and were used to approximate worldwide estimation. According to the two approaches ‘MFA (11%)’ and ‘MFA (15%)’, the total MSW generated worldwide in 2019 is between 2.29 and 3.13 billion tonnes, depending on the calculation method (Figure 3). This figure reflects an increase of between 30% and 50% in MSW generated during the last 15 years (2004–2019). These values compare reasonably well with other estimates provided by the assessment of the aforementioned studies (Table 1). The application of the three regression formulas (adopted from the Waste Atlas, GWMO and World Bank) to estimate the total waste generated worldwide provided similar results that differ almost 7% for 2004 and 2% for 2019. It is important to highlight that the calculated amount of waste generated (using the regression formulas) was higher than the amounts reported by official statistics (core estimate in the source reports: Waste Atlas, GWMO and WaW 2.0, which are presented in Table 1) due to the so-called ‘unregistered waste’ that comes as an outcome from the mass balances, but it is not included in any statistics (e.g. waste streams recovered by informal recyclers, waste streams driven to dumpsites and non-declared solid waste from small or big industrial activities).
Assuming that the waste generated is in the middle of the above range, in 2019 2.7 billion tonnes of MSW were generated. This means that the leakages from uncontrolled disposal, open burning in dumpsites and households, and marine litter are much higher than what is usually estimated, as it will be later detailed in section ‘Global status of MSW management’.
Table 2 demonstrates data for the last 15 years between 2004 and 2019. This table suggests that total MSW generation in 2004 is between 1.50 and 2.22 billion tonnes and the waste generated in 2019 is between 2.29 and 3.13 billion tonnes, equivalent to 28.83%–53.43% increase in MSW generated within this period, depending on the model. A comparison of these findings with other basic world parameters (such as the world GDP, the world GDP per cap, the total population and the urban population worldwide) for which there are more certainties regarding their estimation shows that the world GDP increased by 70%, the world population by almost 20% and the urban population by 36%.
Comparison of the findings on MSW generation with major world parameters.
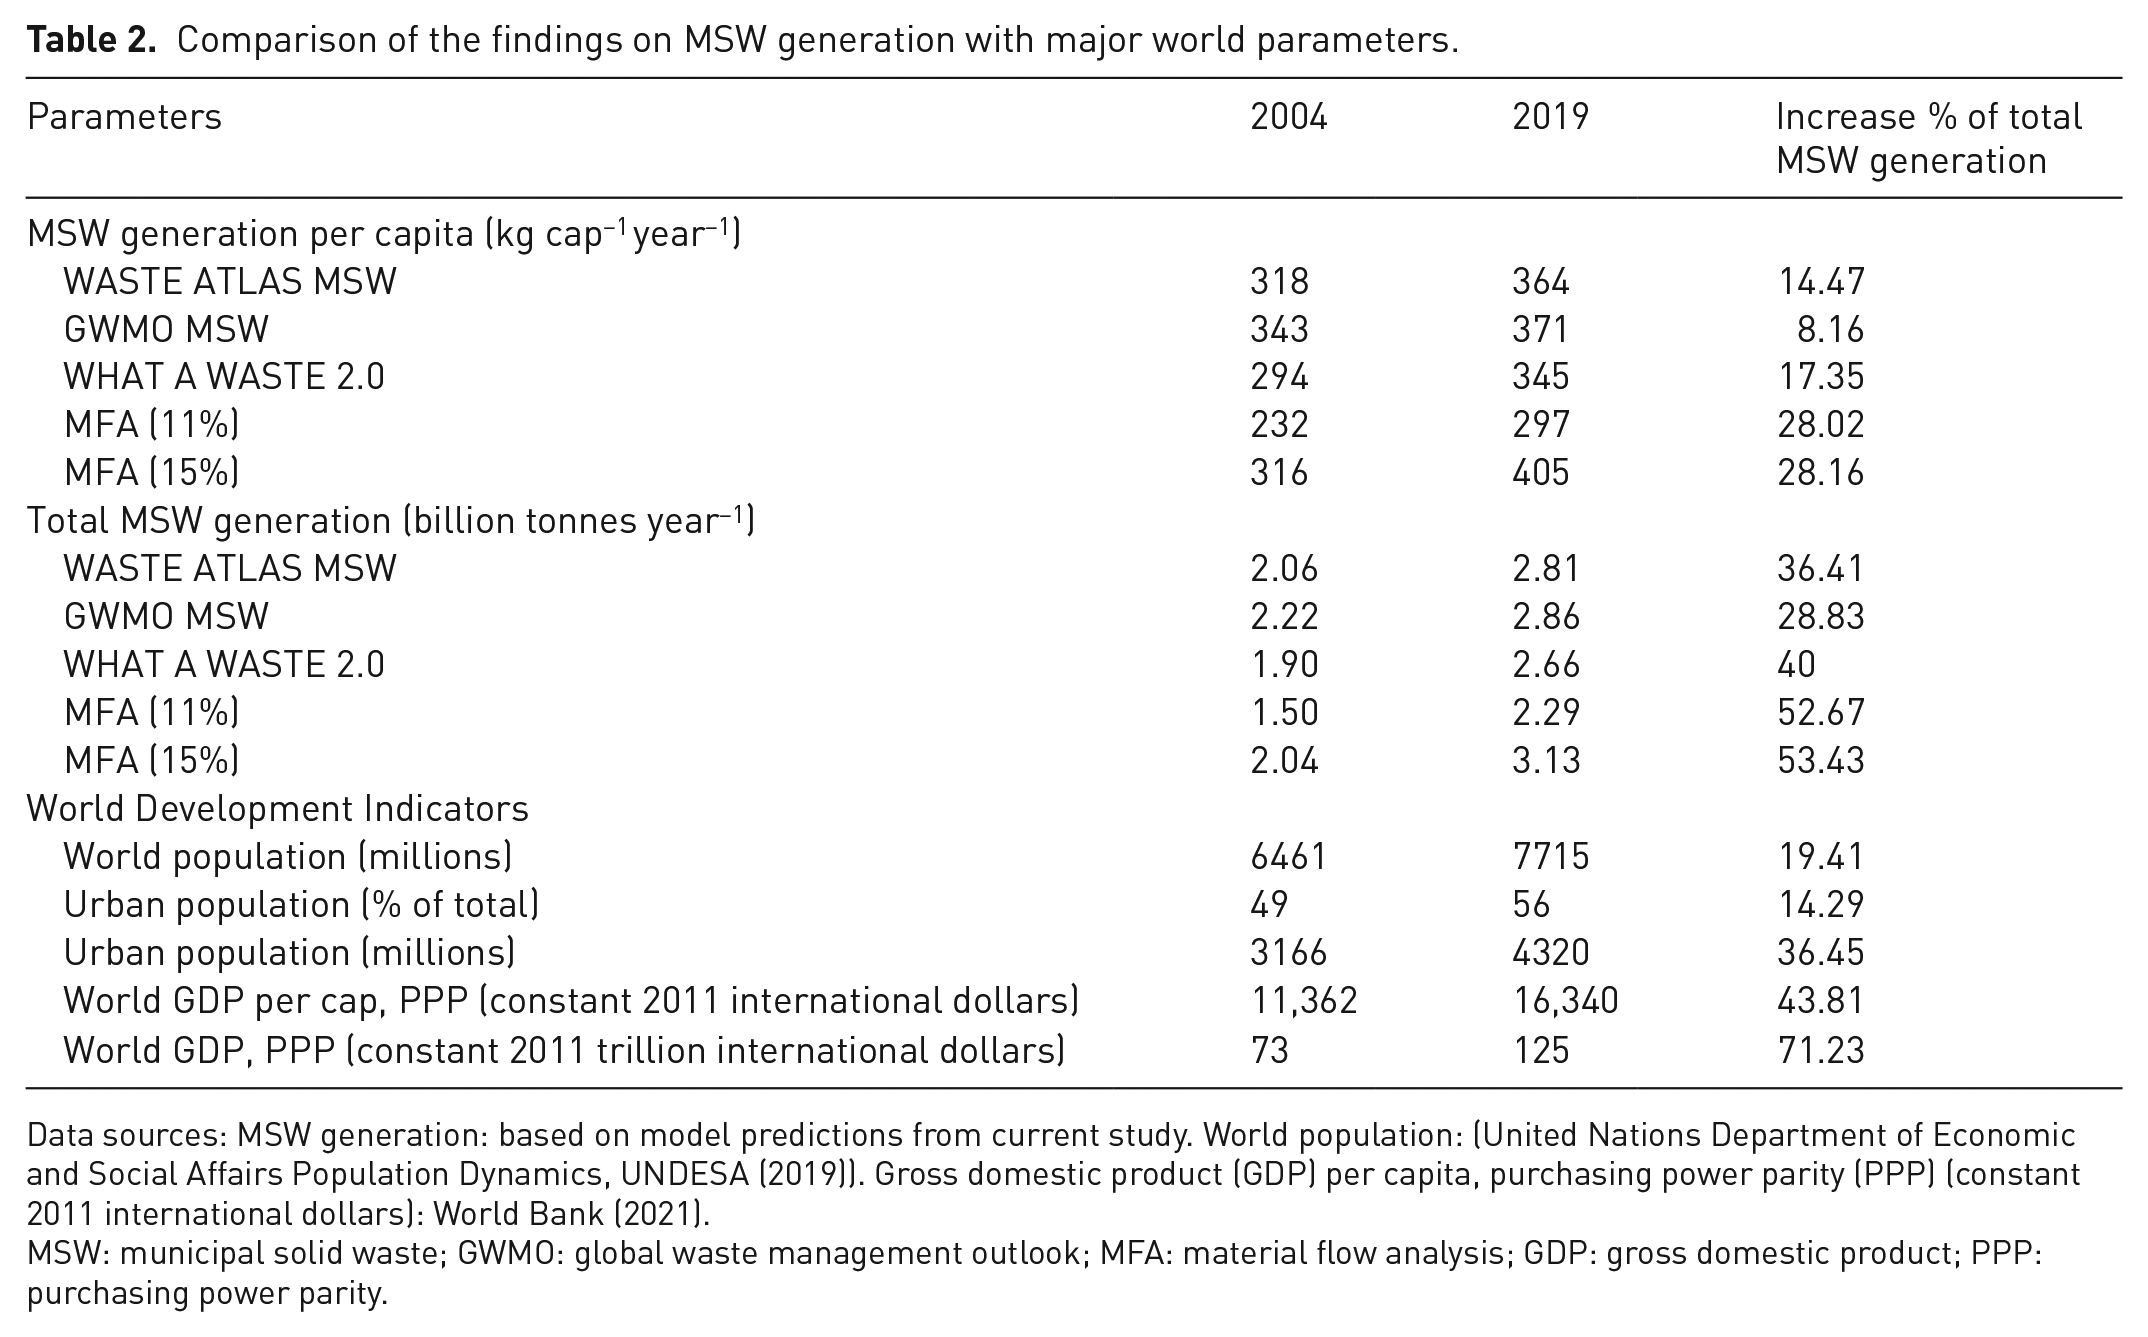
Data sources: MSW generation: based on model predictions from current study. World population: (United Nations Department of Economic and Social Affairs Population Dynamics, UNDESA (2019)). Gross domestic product (GDP) per capita, purchasing power parity (PPP) (constant 2011 international dollars): World Bank (2021).
MSW: municipal solid waste; GWMO: global waste management outlook; MFA: material flow analysis; GDP: gross domestic product; PPP: purchasing power parity.
Projected MSW generation
To develop projections for MSW generation, baseline data for the year 2019 were adjusted for 2050. Two scenarios were considered in this study for adjusting MSW generation rates from the base year (2019) to 2050. The first scenario S1 2050 assumes the same MSW generation per capita as in 2019. The per capita waste generation rate for 2019 was multiplied by the projected population level for 2050. The second scenario S2 2050 assumes that the MSW generation per capita rate for 2019 has increased by 15%. The adjusted per capita waste generation rate for 2019 was then multiplied by the projected population level for 2050.
As shown in Figure 4, MSW generated is expected to increase from 2.89 to 4.54 billion tonnes by 2050, depending on which assumptions are used. This prediction is based on two scenarios of what might happen under a set of assumptions, rather than a forecast of what is likely to happen. It is worth noting that any projection beyond 2050 becomes very speculative. This represents a 26%–45% increase compared to 2019. The differences in assumptions and associated results are well-illustrated in Figure 4.
Projected MSW generation (2019–2050).
Global status of MSW management
The following assessment of the global status of MSW management is based on the quantities of waste assessed above, 2.7 billion tonnes for the year 2019 (i.e. average of five scenarios illustrated in Figure 4), as shown in Figure 5. This assessment of waste flows was based on the analysis regarding the additional waste management infrastructure that was delivered between 2016 and 2019 (Maalouf et al., 2020a), the data set of the latest World Bank report (Kaza et al., 2018) and the findings regarding open burning from Wiedinmyer et al. (2014) study. Figures on uncollected waste, dumpsites and open burning were adjusted based on the assessed quantity of MSW for 2019.
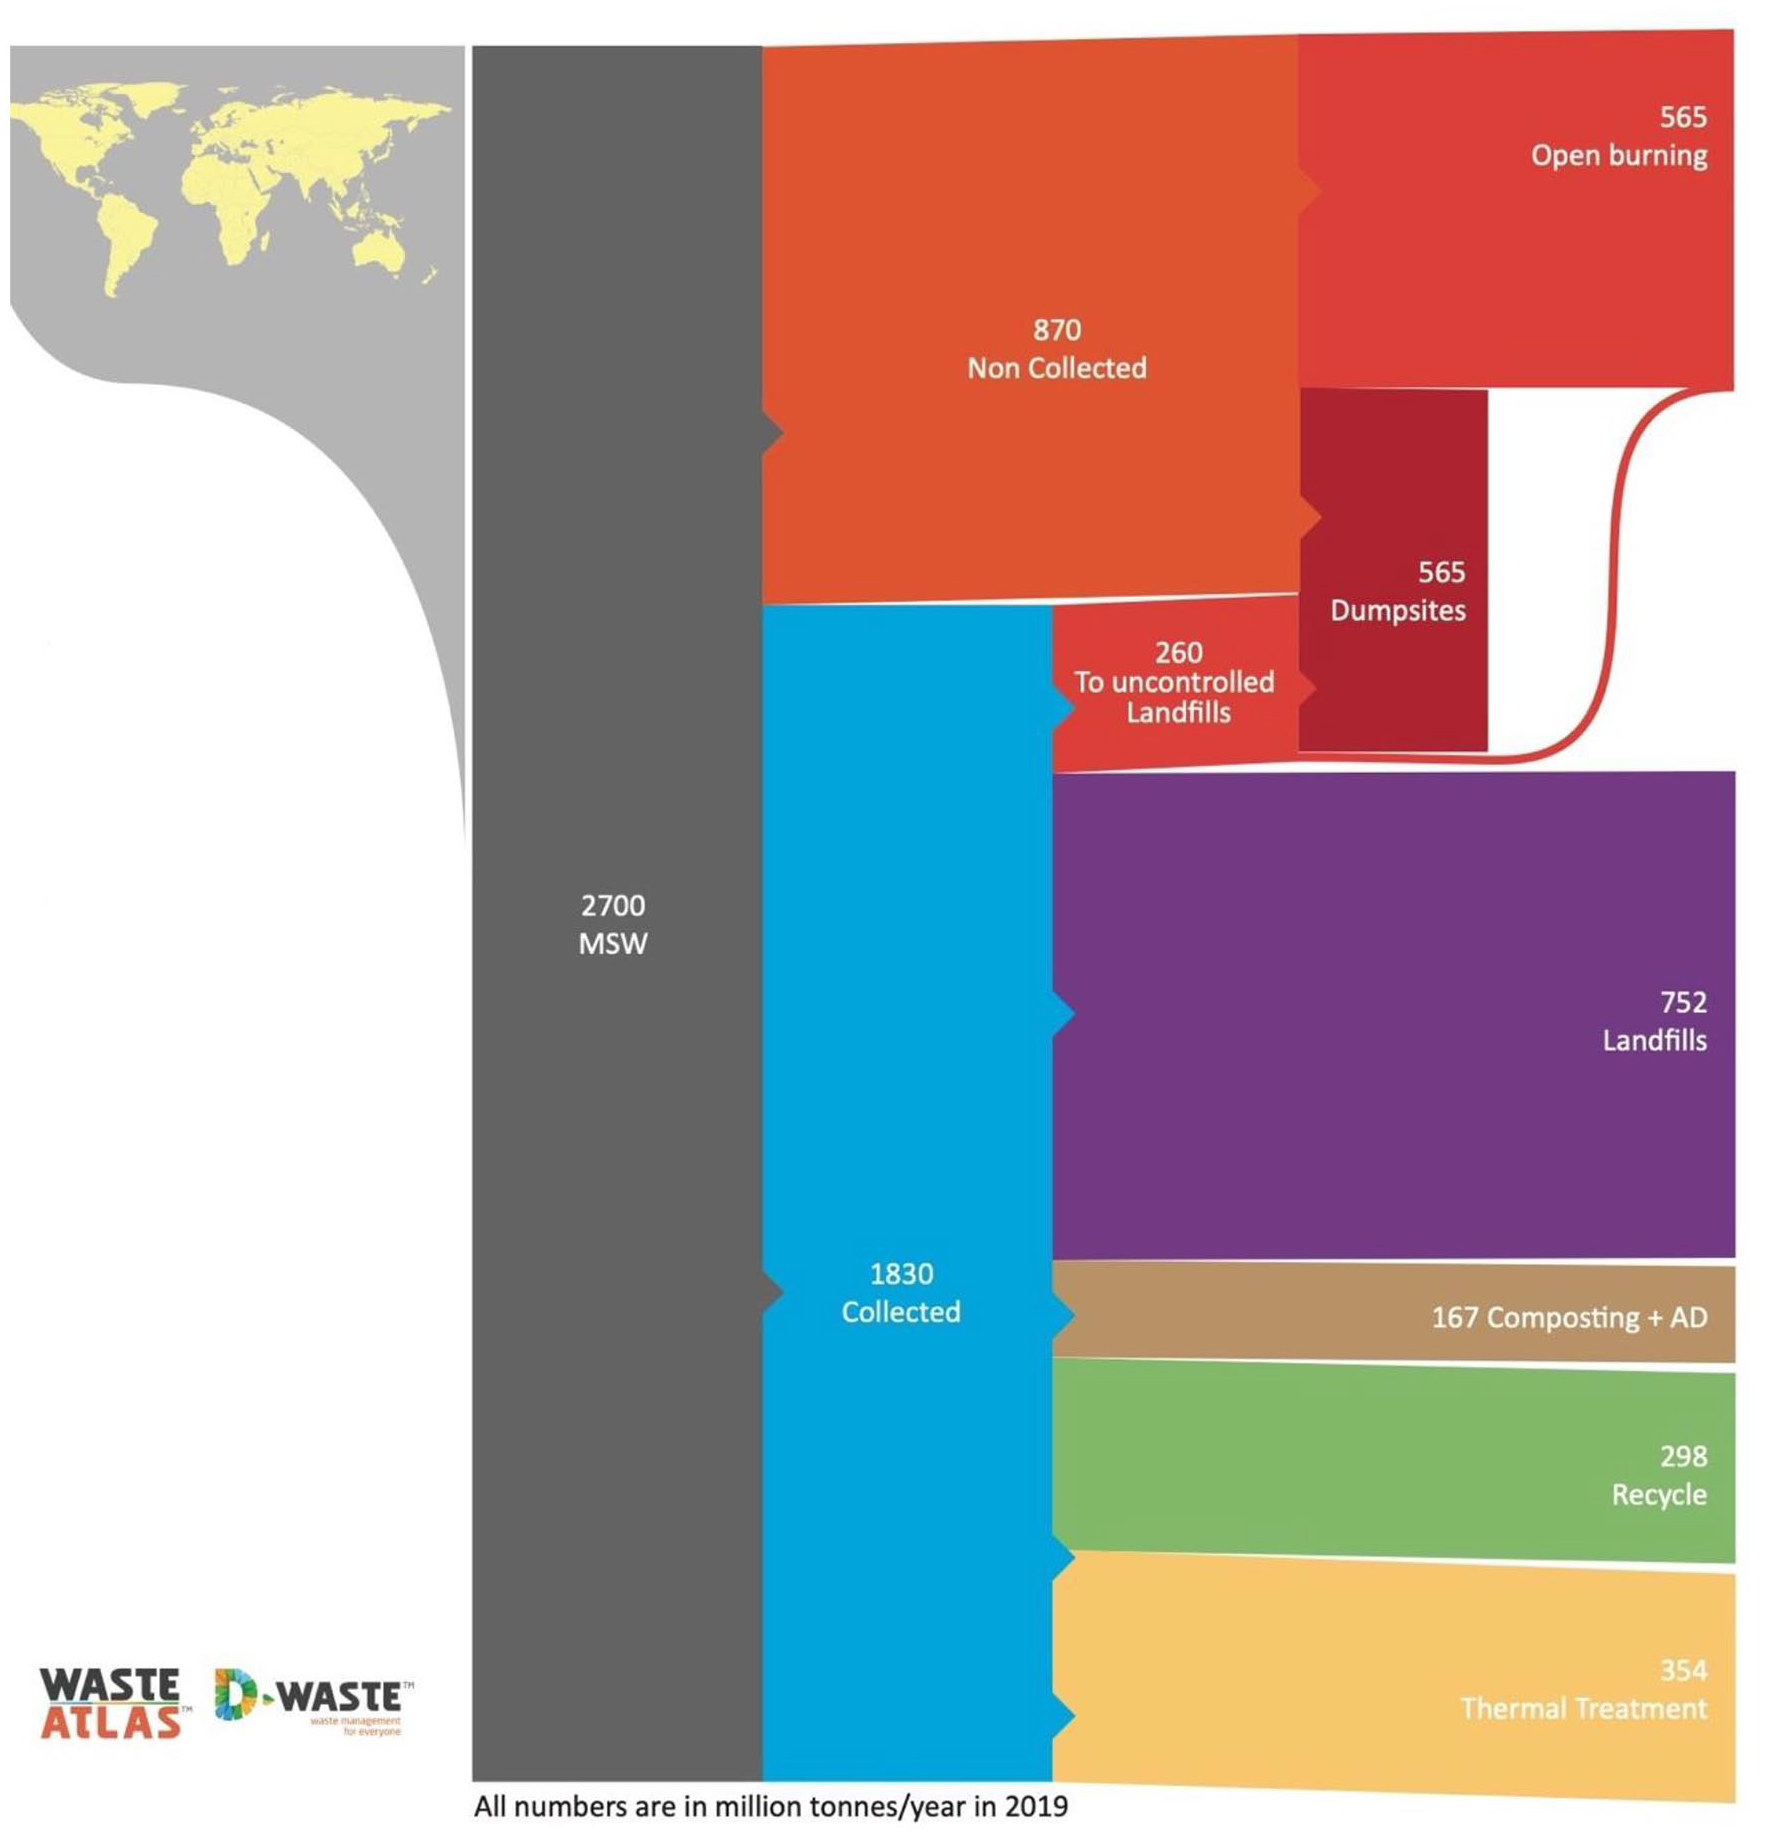
Worldwide Waste Management practices for the year 2019.
Table 3 shows the global MSW management practices in 2019. Comparing to other reports (see Table 1), our analysis shows that uncollected waste is almost one-third of the total MSW generated in 2019 (or 870 million tonnes in 2019). Similarly, a recently published study in South Africa (Rodseth et al., 2020) showed that 29% (3.67 million tonnes year−1) of MSW generated is uncollected. However, this finding is alarming as it is 370 million tonnes more than the amount assessed by the World Bank in 2016 (Kaza et al., 2018). According to the World Bank (Kaza et al., 2018), there are substantial differences in collection coverage. National average percentages are ranging from 96% in high-income countries till less than 40% in low-income ones. However, these percentages do not take into consideration the amounts of MSW that is openly burned by residents, mainly in rural and low-income areas. Therefore, uncollected MSW, disposal in uncontrolled dumpsites and open burning are very common practices that are much higher in reality than usually considered.
Assessment of MSW management practices in 2019.
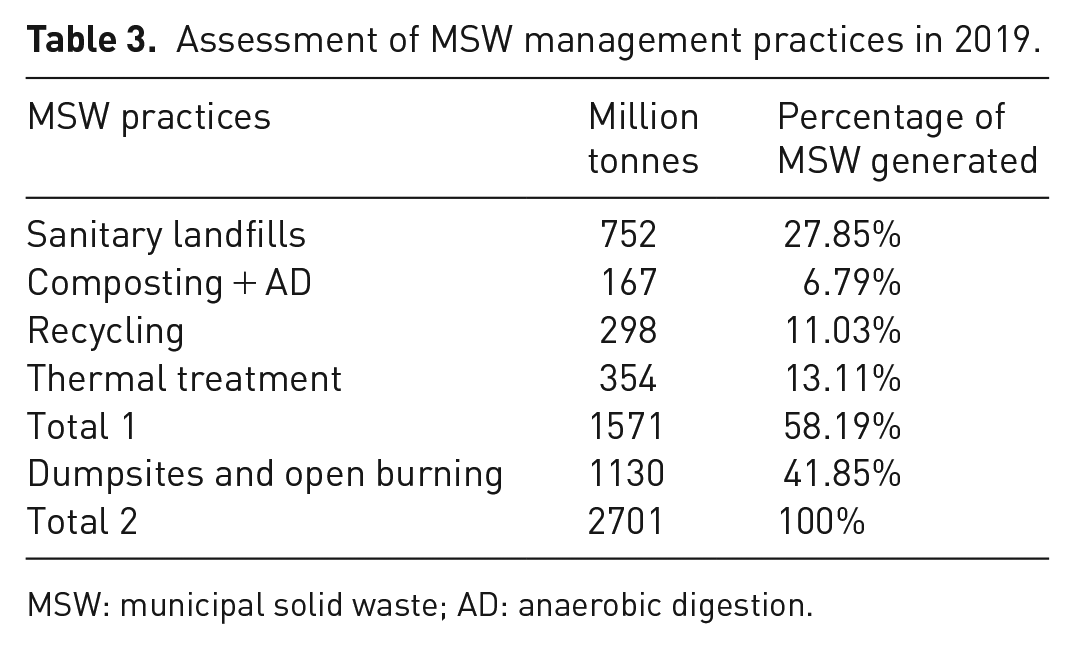
MSW: municipal solid waste; AD: anaerobic digestion.
Moreover, this study shows that at global level only 58% of MSW generated is managed through various alternative waste treatment technologies (e.g. sanitary landfills) whereas almost 42% of all MSW generated goes to uncontrolled dumpsites or is openly burned (Table 3). According to the World Bank report (Kaza et al., 2018), South Asia leads the way with 75% uncontrolled disposal, followed by Sub-Saharan Africa (69%) and Middle East and North Africa (MENA) region (52.7%). International Solid Waste Association (ISWA; Mavropoulos, 2015) has assessed that dumpsites receive roughly 40% of the world’s waste and they serve about 3.5–4 billion people. The 50 biggest dumpsites affect the daily lives of 64 million people, a population the size of France. As urbanisation and population growth will continue, it is expected that at least several hundreds of millions more people will be served by dumpsites, mainly in the developing world. Uncontrolled disposal creates serious health and environmental impacts. In 2010, it was found that only in India, Indonesia and Philippines almost 8.7 million people were at high risk of exposure to industrial and hazardous waste pollutants, mainly lead and hexavalent chromium, from 373 dumpsites (Chatham-Stephens et al., 2013). A recent report (Tearfund et al., 2019) found that annually the global deaths related to improper solid waste management are between 0.4–1 million. It has been estimated that uncontrolled waste burning in dumpsites and households results in 270,000 premature adult deaths per year (Kodros et al., 2016). The ISWA has reported 750 deaths related directly to poor waste management in dumpsites and relevant incidents with important health impacts, in less than 1 year (Mavropoulos et al., 2016). Several reports have also reviewed evidence, specifically on dumpsites, such as Mavropoulos (2015) and (ISWA, 2016) in an effort to raise the public profile of the considerable risks that these facilities poise to human health, both of which have built on an earlier study by D-Waste (2013) that identified and catalogued the world’s 50 largest dumpsites. Moreover, in their systematic review of over 3000 papers from 22 countries evaluating the evidence for health effects from land disposal, Maalouf et al. (2020b) explicitly show the unreasonable potential for damage to human health and safety, alerting us of the need to shut down and mitigate danger urgently at dumpsites, avoiding harm to some of the poorest inhabitants in the world.
Interestingly, what Table 3 does not tell us about two things. First, how much waste is collected by the informal sector. Second, neither the waste that is going to uncontrolled dumpsites and open burning is collected or uncollected: if collected waste is going to these uncontrolled processes, then uncontrolled dumpsites and open burning become part of the formal waste management system. In that case, the general assumption that increasing collection serves to reduce uncontrolled disposal would not be correct and an ambition to reduce these treatment approaches would require a very different set of actions.
Conclusion
Data reporting is globally inconsistent due to varying interpretation of terminology, lacking standardised categories and varying methodologies used to observe and measure waste amounts. This study aims to estimate global waste generation to achieve SDGs. This study employs two approaches to estimate global waste generated. The first approach considering the RA contains the driving factors of economic growth, while the second approach considering the MFA comprises the global material extraction.
Total global waste arisings are estimated in this study to be around 20 billion tonnes (calculated: 19.8 billion tonnes) in 2017. This corresponds to 2.63 tonnes of total waste per capita per year. The total global waste arisings are expected to increase to 46 billion tonnes by 2050. MSW is a much smaller amount, and it ranged between 2.29 and 3.13 billion tonnes, depending on the calculation method. This figure reflects an increase of between 30% and 50% in MSW generated during the last 15 years (2004–2019). MSW generated is expected increase to 2.89–4.54 billion tonnes by 2050, depending on which assumptions are used. This represents a 26%–45% increase compared to 2019.
According to the estimation processes adopted in this study, almost one-third of the total MSW generated is not collected, and most of what is collected is not treated accordingly to current ideas of sound management. Almost 42% of MSW goes to uncontrolled dumpsites, it is openly burned or leaks into the natural environment with associated health, safety, climate and environmental impacts. As a result, the necessity for a CE and waste reduction measures is increasingly critical to city survival. The primary drivers for CE application in cities include urbanisation, ecological degradation, environmental accountability, consumer behaviour and technology breakthroughs. The finding provides valuable insight for policymakers to design and assess CE policy instruments towards achieving SDGs.
Footnotes
Acknowledgements
The authors are grateful to the United Nations Environment Programme (UNEP) and the International Solid Waste Association (ISWA) and the international donor community who funded the original research for the ‘Global Waste Management Outlook 2’. The views expressed here are those of the authors alone.
Declaration of conflicting interests
The author(s) declared no potential conflicts of interest with respect to the research, authorship and/or publication of this article.
Funding
The author(s) received no financial support for the research, authorship and/or publication of this article.