
Abstract
The design of efficient municipal solid waste (MSW) pre-collection networks can contribute to the global efficiency and sustainability of the reverse logistic chain of MSW in modern cities. With this aim, in this paper a comprehensive methodology that involves making decisions in several stages, from waste fraction classification to the final optimization of waste bins’ location, was applied in two real cases of the city of Bahía Blanca, Argentina. This city, does not have much available data about waste generation and, therefore, an important fieldwork had to be performed for applying this methodology, involving estimating population density per block and waste generation rate per inhabitant, identifying the location of commercial and institutional buildings and also estimating its generation rate, as well as performing a characterization of the MSW from similar studies in the literature and surveys performed to make decisions. The modelling of the urban characteristics was performed in a geographic information system. In the bins’ location problem, a mixed-integer optimization model was applied, seeking to minimize the investment costs, given the maximum area available and the capacity of the bins. Different scenarios were analysed, considering different collection frequencies and the maximum distance to be travelled by the user.
Keywords
Introduction
The economic development, which is usually associated with the enhancement of the consumer society, implies an increasing amount of municipal solid waste (MSW) generation in cities. When there are not adequate policies for MSW integrated management and infrastructure, it can provoke serious environmental, economic and health problems for the population (Zafra Mejía, 2009). Moreover, the increment in the amount of waste that is produced by societies has caused great stress to the current municipal governments, which are in general responsible for the collection of waste and its correct dispoition, having to invest increasingly larger amounts of resources to deal with this issue (Hoornweg and Bhada-Tata, 2012).
The reverse logistic chain of MSW involves several phases: generation; disposition; collection; treatment; or final disposition. Among these phases, designing pre-collection efficient networks is critical for enhancing sustainability of the whole chain (Pires et al., 2019). To contribute to solving this problem, in this work a comprehensive methodology for the design of a pre-collection network for differentiated waste is applied in real scenarios of the city of Bahía Blanca. This involves making decisions in several stages, the form in which waste fractions are to be classified, the generation rate estimation of dwellings and commercial buildings, storage level selection, types of bin selection, and optimization of collection points’ location.
In 2004, National Law No. 25916 (National Congress of the Republic of Argentina, 2004) was passed, which seeks to promote the recovery of MSW. Since the enactment of this law, different provincial and municipal initiatives were started in Argentina to meet the proposed objectives (Cavallin et al., 2016). Thus, municipalities began to improve their processes according to the particular initial conditions of their MSW system (Instituto Nacional de Tecnología Industrial, 2014). This enabled the implementation of different initiatives that have achieved some concrete progress, such as in the province of Buenos Aires (to which Bahía Blanca belongs) – more than 85% of the municipalities have an adequate disposal of MSW. Regarding the MSW treatment (recycling, recovery, reuse, etc.), it is recorded that, on average, 37% of the Argentinian population has access to them considering the whole country, and in the province of Buenos Aires this rate reaches 76% (Dirección Nacional de Gestión Integral de Residuos, 2016).
Regarding Bahía Blanca, since the enactment of National Law No. 25916, numerous activities and initiatives have been developed, such as: eradication of municipal open-air dumps; construction of a sanitary landfill; installation of a recyclable MSW acoustic separation plant; installation of clean points (recyclable differentiated MSW containers); and various programmes that promote source separation and recovery of MSW. Relevant MSW recovery plans that have been successfully incorporated by the citizens are the “Ecocanje” programme (through which cardboard and plastic waste carried by citizens are exchanged for fertile land and fertilizers), an electronic waste collection program and the ReCreo programme (about recyclable MSW collection at schools).
The recovery programmes register a great response from the population, where, for example, the ReCreo programme has recovered more than 66,700 kg of waste until now (Smurfit Kappa Argentina, 2019), and each Ecocanje event, which are performed monthly, summons around 4500 people, and in the last year these events have collected more than 1,400,000 kg of recyclable waste (Municipality of Bahía Blanca, 2019). On the other hand, there are groups that mobilize “against climate change” and place special emphasis on the city’s waste management. Likewise, within the university environment, a comprehensive management plan for university waste has been implemented for six years, which has recorded more than 45,000 tons of recyclable waste recovered since its inception (Universidad Nacional del Sur, 2019). In turn, new university and tertiary major programmes which are related to environmental sciences have been created, all of them having a large number of students enrolled. These facts support the idea that the citizens of Bahía Blanca, not only support the current proposed sustainable plans, but also, are interested in the development of more extensive and sustainable plans. In this sense, the implementation of a collection system that allows source classification in different containers, which is addressed in this paper, is presented as an alternative to this demand of the city’s citizens. In addition, the proposed system has been successfully implemented in other Argentine cities (e.g. Buenos Aires City, Rosario and Córdoba), in which citizen’s customs and idiosyncrasies are similar to those of Bahía Blanca.
This paper is structured as follows. The second section describes the application of the methodology. This starts with the recognition of the study areas in the sub-section “Definition and description of the study areas”. Then in the third section, a detailed description of the application of each stage of the methodology, including the tools that were used and the mathematical model for determining the bins’ location, is presented. In the fourth section, the main conclusions and suggestions for future lines of work are outlined.
Materials and methods
Different authors have addressed the issue of locating waste disposal points in urban areas (Purkayastha et al., 2015). The majority of them have focused on the proposal of optimization tools for locating waste bins. We found different authors that have applied exact approaches (Rossit et al., 2017; Coutinho-Rodrigues et al., 2012 ), and heuristic approaches (Boskovic and Jovicic, 2015; Ghianni et al., 2012; Toutouh et al., 2019). However, few of these authors have proposed comprehensive methodologies for locating disposal points that involve the different stages of designing this network. Among them, Gallardo et al. (2008, 2015) presented a complete methodology that aims at sequencing this process in several stages. These are the following: selecting the number of fractions in which the waste is going to be classified; selecting the “storage level” which relates to choosing the form in which waste will be collected, for example, a door-to-door system or a kerbside collection; locating MSW disposal points; estimating the accumulated waste in each collection point; and selecting the number and type of bins that are going to be placed in each disposal point.
In this paper we aim to apply the methodology based on Gallardo et al. (2008, 2015) in two real cases of the area of Bahía Blanca. However, some stages were modified. For example, we performed the location of MSW disposal points along with the final bin selection within an optimization model based on mathematical programming. We also identified among potential places for locating bins some particular spots in the city that have special characteristics that make them more suitable for locating bins with a minimal interference in the everyday life of the citizens.
Definition and description of the study areas
The methodology was applied in two neighbourhoods of Bahía Blanca, Argentina. Currently, in this city there is a door-to-door waste collection, with a frequency of six times a week. In total, approximately 131,000 tons are collected per year (Municipality of Bahía Blanca, 2017). In 2018, the activity of waste collection, sweeping and cleaning meant a cost of 576,000,000$ ARG (around 15,700,000 US$) representing 12% of the municipal budget and so far in 2019, expenses are recorded for 737,948,232$ ARG (around 16,400,00 US$) (Municipality of Bahía Blanca, 2018). Most of the waste is taken to the landfill, without any classification or processing, which is a common practice in developing countries (Boskovic et al., 2016). The landfill, due to its intensive use and the semiarid climate of the area that hinders waste biodegradation, is almost at the limit of its capacity (Rossit et al., 2017). In addition, the operation of the landfill of Bahía Blanca represents the most expensive contract managed by the municipality. This is about 411 million Argentinian pesos (over 9,000,000 US$) according to the new contract signed in 2018, in which the municipality commits itself to paying 12.53 US$ per ton of waste that is accumulated at the landfill (Municipality of Bahía Blanca, 2018). Furthermore, the problem of clandestine open-air garbage dumps must be added. Only a small percentage of the collected waste is sent to a treatment plant for selection and recovery of resources. The waste sent there comes from seven “clean points” (i.e. special areas near busy places in which classified bins are disposed) and the so-called “Cestos Duales” programme (“dual bins”). However, these are small scale programmes that are used by a minor number of environmentally friendly citizens and mainly for educational purposes.
Although there have been some trials to implement a large-scale programme to classify waste in the city in the last years (Municipality of Bahía Blanca, 2018), they have not been successful. This might have been because of a lack of the authorities’ political determination but also because they maintained the door-to-door system. This suggests that the citizen has a different collection schedule for each fraction of waste: in certain days of the week the humid fraction is collected and the rest of the days the dry fraction is collected instead. In addition, these projects have not taken into account the separation of waste at source and differentiated collection, as well as the reduction of collection points (door-to-door) by locating bins (Bonomo et al., 2012). To this we can add that there are few studies that have been done on the quantity and quality of waste generated, both in the city and in other parts of the country, so the correct implementation of any of these initiatives has been hindered. Scenarios of two different neighbourhoods of Bahía Blanca were considered. One so-called “Barrio Universitario” (hereafter “university neighborhood”), with approximately 12,400 inhabitants, which is characterized mainly as a residential neighborhood, and the other, the downtown of the city with about 9600 inhabitants and a large number of shops, business and apartment buildings. Both zones count with all services (such as electricity and gas) and, in average, the population living there has a medium socio-economic level which impacts in the garbage composition. The higher the socio-economic level, the higher the generation per capita and lower the percentage of organic waste (Ojeda-Benítez et al., 2008; Orccosupa Rivera, 2002).
Application of a methodology to locate classified waste
This sub-section explains the methodology to define the bins’ location, involving not only a major fieldwork but also the consultation of several different papers in the literature and technical reports by different organizations performed in similar cities. An optimization model is also applied in order to select the proper location of classified bins according to the population distribution.
Waste fractions selection
The MSW can be classified according to their origin (domiciliary, commercial, institutional and swept), their composition (humid, dry, organic, inert, glass, paper, metal, etc.) or their degree of danger (toxic, infectious, radioactive, corrosive, flammable, etc.). For this study, we used the classification according to its composition, particularly, in its humid and dry fractions as has been performed in similar studies (Burnley et al., 2007; ECO Consultorías e Ingeniería SAC, 2013; Garduño-Palomino et al., 2012; Herrán Symonds, 2019; Génivar et al., 2007). Using only two fractions favours the gradual adaptation of the population to the new system and to form the habit of separating waste at source. The humid fraction is composed of the organic waste (mainly food remains), nappies, textiles, wood, rubber, leather and cork, and other similar types of garbage. The main characteristic is that their destination is final disposition in the landfill. In contrast, the dry fraction is composed of metal, glass, paper and cardboard, and plastic. From this waste fraction, several resources can be recovered after a proper selection and treatment. On the other hand, batteries, hazardous waste, construction materials, pathogenic residues, waste from street sweeping and pruning remains constitute a third fraction of waste that is not considered in this study since, despite being urban solid waste, according to the city’s regulations they should not be handled by the standard collection systems but by special collection services.
Generation rate estimation
One of the main obstacles that had to be overcome was the lack of official information on the characteristics of the MSW generated in this area. As regards the generation of MSW, a restaurant is not the same as a shop that sells office and bookstore supplies. This type of information is very important for determining the bins’ location. That is why we continued to obtain the data on our own, through thorough fieldwork, by means of observations, inspections, estimations and references found in the literature. Roughly speaking, urban waste can be considered to be generated by two main sources: from dwellings; and from commercial and institutional establishments.
In this work, the waste from dwellings was estimated according to the population density. This approach was chosen since the only data available were for the waste generation rate per capita. In fact, De Luca and Giorgi (2015) estimated the average waste generation rate per capita in Argentinian cities to be about 200,000 to 500,000 inhabitants to 1.015 kg per day in the year 2010. The city of Bahía Blanca, with 301,572 inhabitants (National Institute of Statistics and Census of Argentina, 2010) belongs to this population range. Moreover, according to the technical report made by a local research institute (PLAPIQUI UNS-CONICET, 2013), in terms of seven years an inhabitant of Bahía Blanca went from generating 550 gr of MSW/day to 715 gr. With this information, we proceeded to estimate the projected per capita generation value for 2019 at 0.93 kg/inhabitant/day (this value is in line with surveys performed by practitioners).
In order to georeference the number of inhabitants per block, data on the population density in terms of inhabitants per hectare were obtained from the National Argentinian Census, 2010. These data were then multiplied by each block’s area and distributed according to the number of apartment buildings in each block’s side.
On the other hand, to characterize the proportions of dry and humid waste contained in the MSW of Bahía Blanca, we reviewed about 20 MSW quality studies conducted in different Argentine cities: Autonomous City of Buenos Aires; Buenos Aires Metropolitan Area; Escobar; Pilar; General Rodríguez; General Pico; Santa Rosa; Eduardo Castex; Ingeniero Luiggi; Metropolitan Area of Mendoza; Malargüe; General Alvear; Rio Hondo; San Martín de los Andes; Junín de los Andes; Humahuaca; Tilcara; Bariloche; Comodoro Rivadavia; Salta capital; Trenque Lauquen; and Unquillo. From these studies, the average percentage composition in weight of each waste fraction in the total generation was observed (CEAMSE, Government of Buenos Aires City, 2015; De Luca and Giorgi, 2015; Pettigiani et al., 2013). The reviewed studies contemplated a detailed classification in several categories (see Table 1). However, for this work it is necessary to identify only the two main waste fractions – humid and dry – since the objective of this study is to install bins for these two fractions. Then, the humid fraction in weight is the result of the sum of the waste streams “disposable diapers and dressings”, “food waste”, “textiles”, “wood”, “rubber, leather and cork”, “miscellaneous” and “others”, while the dry fraction in weight results from adding “paper and cardboard”, “plastic”, “glass” and “metals”. This results in 63.67% humid MSW and 36.33% dry MSW.
Calculation of the volume of waste generated by current, per inhabitant, per day.
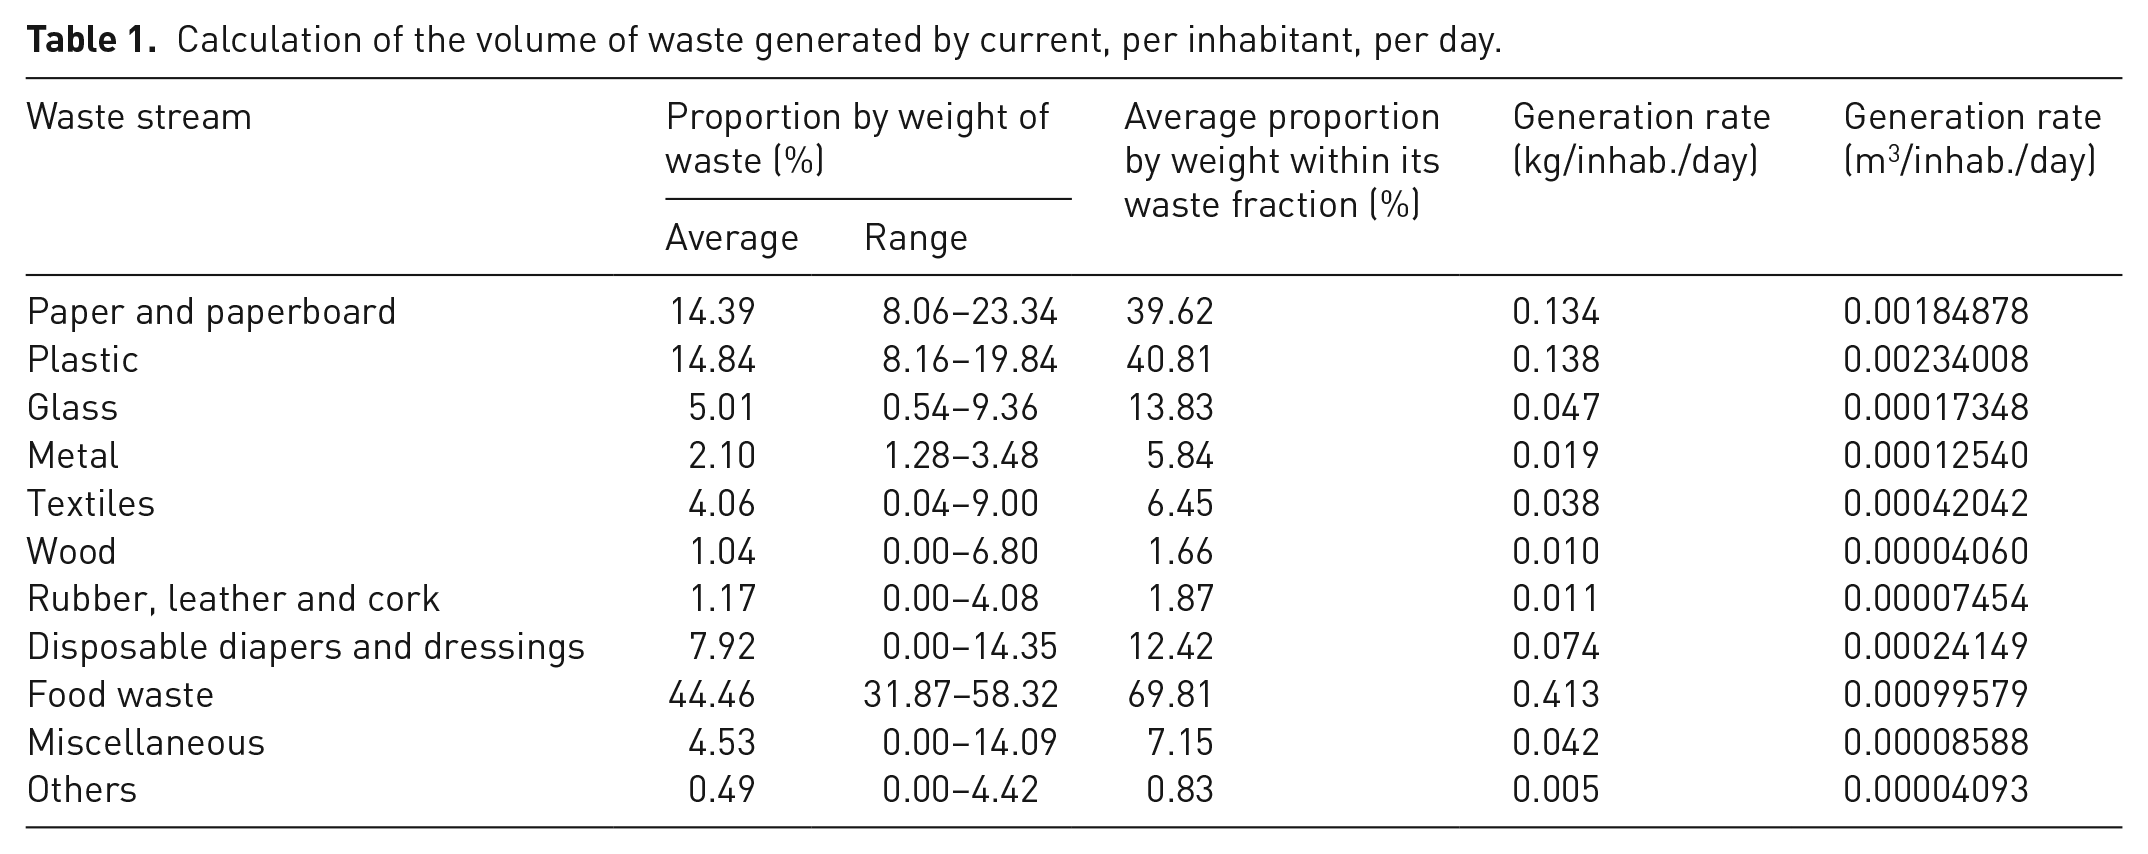
Additionally, it is necessary to describe the generation of MSW in terms of volume and not only by weight because the bins express their capacity in volume. For this purpose, the densities of different waste streams found in four studies were taken as reference (Borja Gutiérrez and Tigua Choez, 2015; Pettigiani et al., 2013; Soto Fuster, 2014; Tchobanoglous et al., 1998). The results are shown in Table 1. In Table 1 we present: the average in proportion by weight of each waste stream and its variation range to measure the dispersion among the revised studies; the proportion by weight of each stream within its waste fraction (for example, the stream Metal is 5% of the dry waste fraction); and finally the generation rate in weight and volume units, respectively.
With these data a range of densities was built and then, a mean value for each waste fraction was estimated to be 0.001899663 and 0.004487749 m3 per inhabitant per day for humid and dry fraction, respectively.
Related to waste generated from commercial and institutional establishments, the fieldwork consisted in identifying the location of shops and service locations, as well as large housing buildings. In the first neighbourhood, 600 establishments were identified through visual inspection; however, when performing a deeper analysis, it was concluded that some of these should be excluded from the generation rate estimation since they produced more than 15 kg per day and therefore, according to the local regulations they must hire a special collection service different from the standard collection system. Fieldwork visits were also performed at establishments for which the information was ambiguous. As a result, 576 businesses and institutions were identified and georeferenced while in the second neighbourhood 1602 establishments were identified. Then, it was possible to characterize the generators grouped in the study area, linking the collected data with data from the National Institute of Statistics and Census of Argentina (2010) and with the population density per block. Accordingly, the MSW generation rate could be accurately described.
Estimating the volume of humid and dry waste generated by each establishment by type of shop (or institution) per day was also a difficult procedure. Both the quantity and the composition of the waste depend on the type of activity that takes place in that establishment. Given the lack of official information, the daily generation rate per establishment was calculated as an average of the generation rates in other countries for each category listed. In the same way, the results of the studies were averaged to obtain the percentage by weight of humid and dry fractions (Bouffard, 2015; Town Hall of Mollet del Vallès, 2018). This is shown in Table 2.
Quality and average amount of waste generated by different types of shops and institutions.
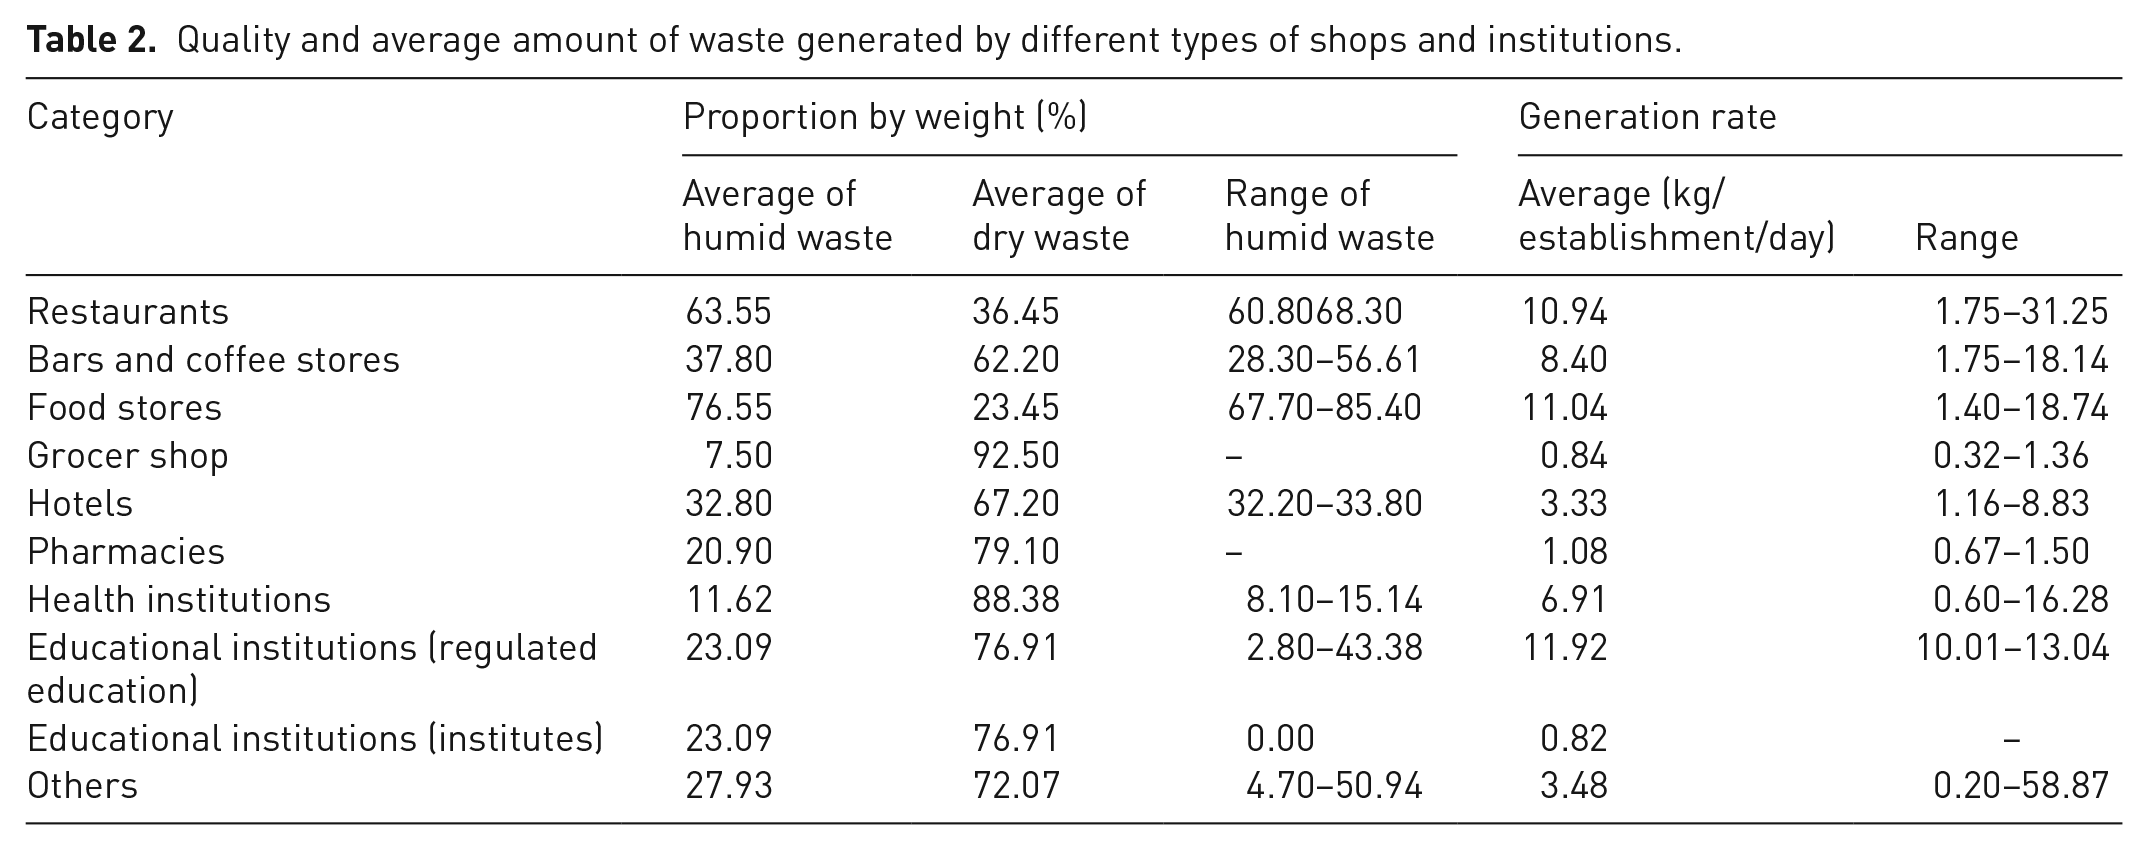
As well as shown in Table 1, the range amplitude reinforces the need for local updated studies. In the cases where there is no range, this is because only one datum was available.
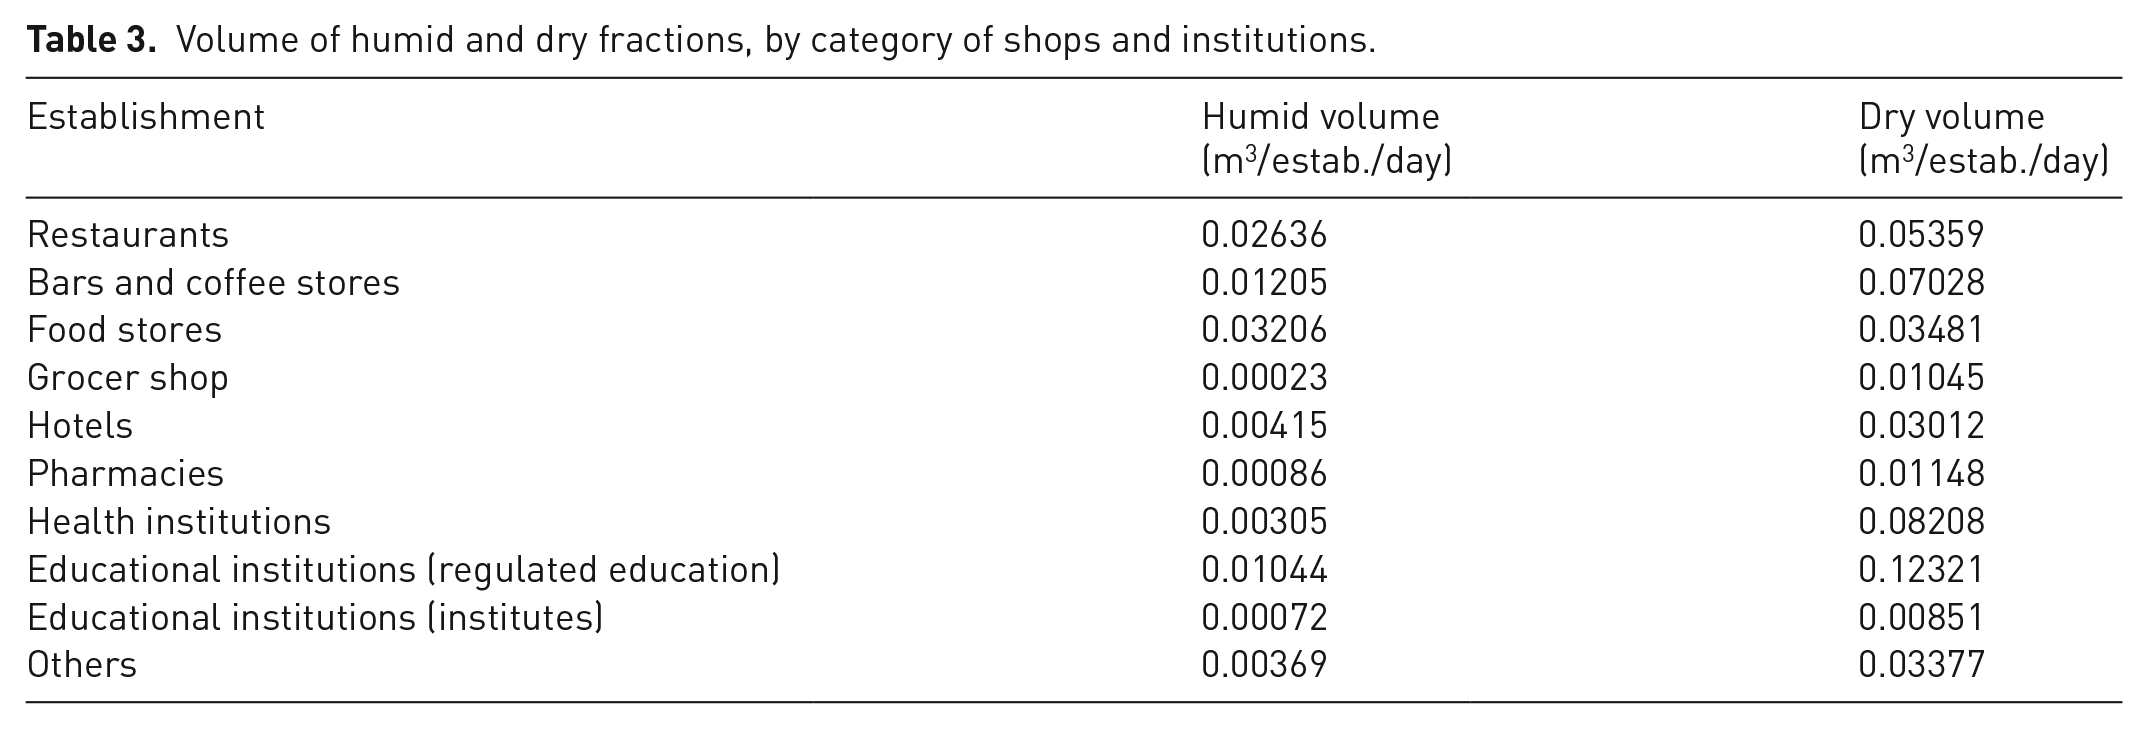
Subsequently, in order to determine the daily generation by type of establishment in terms of humid and dry volume, it was necessary to decompose the humid and dry flows in the currents that make them up. However, since most of the studies analysed on the composition of waste generated by stores and businesses in general, without differentiating by categories, the average of 15 studies was taken and, analogously to dwellings’ generation shown in Table 1, the weight of each waste stream within its waste fraction (humid or dry) was calculated. Then, for each category of commerce or institution, the weight of each stream was multiplied by the daily kilograms produced by the establishment and by the percentage represented by humid or dry for that category, as the case may be. Thus, an estimate of the composition of the residues of each establishment category in kilograms per day was obtained, as is shown in Table 3.
Volume of humid and dry fractions, by category of shops and institutions.
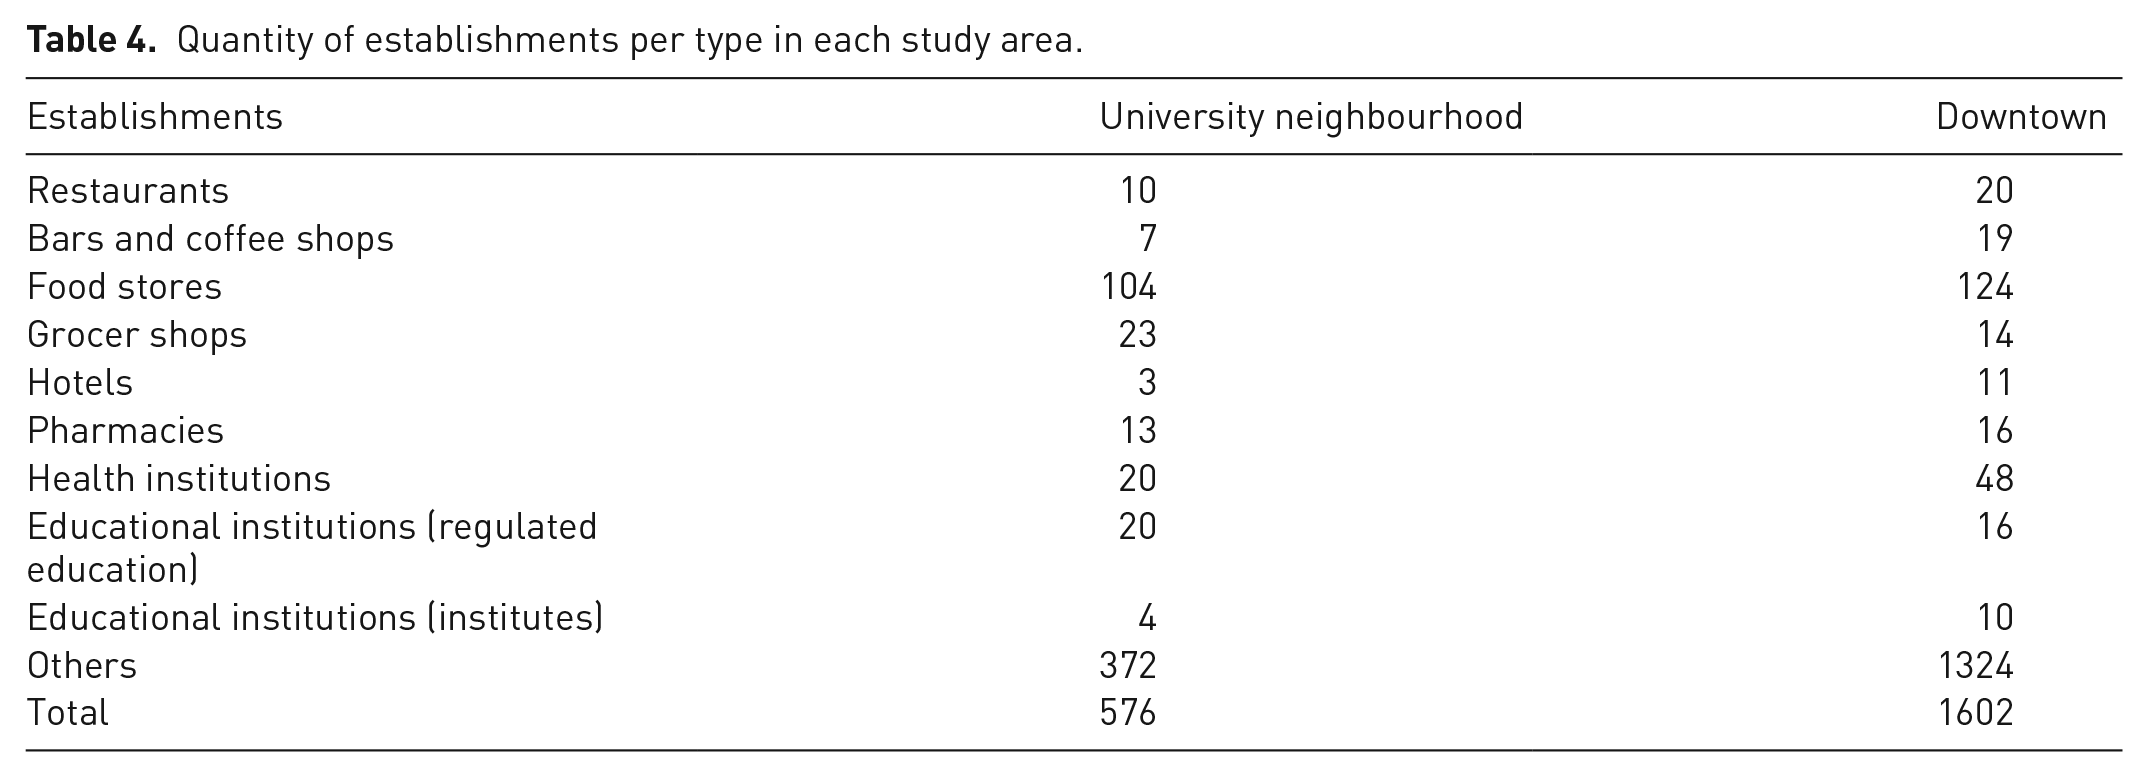
To survey the institutions and shops in the study areas, Street View, a Google Maps tool, was used. As a result, the establishments were accounted for as shown in Table 4.
Quantity of establishments per type in each study area.
To gather the information, geographical positioning tools were used. As a geographic information system (GIS), the open source software Quantum GIS (QGIS) was used to obtain and analyse geographically referenced information. Maps of the city of OpenStreetMap (OSM, open source) were imported to QGIS to localize the different disposal and generation points. The Street View tool of Google Maps was used for surveying the coordinates of buildings, shops and institutions, since it allows to tour the streets of the city with 360° panoramic views.
Collection frequency selection
Collection frequencies directly affect the capacity of bins required at each enabled point since the waste generated between one collection and the next will be accumulated. This is why collection frequencies directly affect project costs in two ways: bins installation; and operational costs. On the one hand, the lower the collection frequencies the larger the costs of installing bins (since the installed capacity should be higher), and on the other hand, the lower the frequency of collection the lower the operational costs.
Humid waste, due to its composition, produces unpleasant odours for the environment that worsen with the passing of hours. For this reason, it was defined that the collection of humid waste was daily. If the current collection frequency is respected for the areas under study, which take place from Sunday to Friday from 10:00 p.m. to 5:00 a.m., the maximum time in which this type of waste will accumulate is two days. In the case of dry waste, which remain uncollected longer (Fehr et al., 2000), two scenarios with lower frequencies were considered. For one of them, the collection frequency was defined as three times a week, so that the maximum number of days between one collection and the next is three days (scenario F3). For the other scenario, it was defined as four times a week, with two being the maximum number of days between one collection and another (scenario F4).
Bins’ selection
Another aspect to analyse is the type of bin to be used, since the market offer of them is very varied. Nevertheless, these varieties can be classified into two large groups depending on the material they are made of (plastic or metal). In turn, according to the loading system in the compactor truck, they can be classified in bins for rear loading or for lateral loading. The second type tend to be larger than the first one (3.2 or 2.4 m3 compared to 1.1 m3) and therefore occupy more surface in the road or street. For the present study, bins for back loading were chosen because the company that is in charge of collection in the city, has compactor trucks of this type and it is expected to be able to adapt them for bin collection. Consequently, the bins that will be analysed are CTB 1100 and “rear loading bin”. The occupied spaces are 1.38 ×1.00 m2 and 1.00 × 1.00 m2, respectively. The volume and prices (in Argentinian pesos retrieved in November 2018) are 1,1 and 1 m3, and AR$30,000 and AR$31,460, respectively. The bins are expected to have a useful life of ten years.
Optimizing bins’ location
To solve the optimization problem, we used a mathematical model of mixed-integer programming based on the capacitated facility location problem (CFLP). For this case study, the proposed formulation was based on the works of Rossit et al. (2017) and Herrán Symonds (2019). This model consists in optimizing the location of waste disposal points, by minimizing the investment costs, given the maximum area available to install the bins and their capacities.
The waste disposal points are points where the differentiated bins will be installed so that the population near them can dispose of their waste in those places. In this way, the collection is optimized since the compactor truck must travel lesser number of points within the same route. Logically, the more bins distributed in the previously defined area, the greater the capacity of the system and the lower the frequency of collection, thus reducing collection costs. However, the costs of investment in bins increase significantly.
The model determines the optimal location of bins in disposal sites, and as well it assigns users to the different points considering that there is a maximum distance that users are willing to walk to get rid of their waste. Among the possible disposal points, which through the mathematical model should be decided whether they are enabled or not, there are “ideal” points for locating bins, which are places that, after some fieldwork, are thought to be conveniently located in the neighbourhood and which are suitable for installing bins with a minimal investment. Conversely, the “standard” disposal points do not share these favourable characteristics and require a larger investment to be enabled.
The sets that are used in the mathematical formulation are the following. A set I of generators
Sets
Parameters
Binary
Variables
Integer
Variables
Then the mathematical formulation is described in equations (1)–(8).
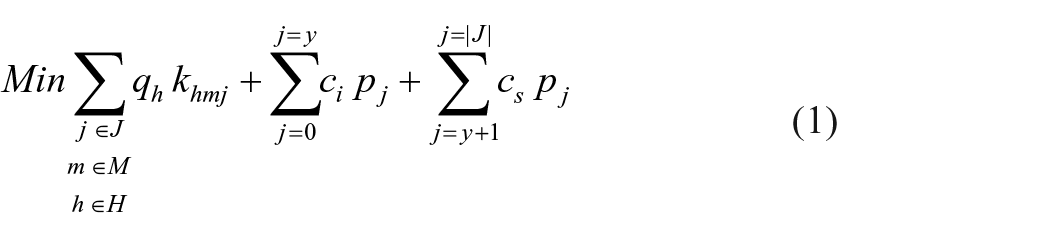
Subject to:


Equation (1) aims to minimize the instalment costs of the different types of bins, added to the costs of qualification and conditioning of the non-ideal disposal points. Equation (2) specifies that each user point must be assigned to only one disposal point. Although, as will be seen later, the user points are composed of several users, these are grouped because otherwise the number of variables grows significantly making it difficult to solve the problem. In equation (3) it can be seen that the area occupied by the bins at a point j must be less than or equal to the maximum available space. This available area
As aforementioned, the presented model in equations (1)–(8) is a variation of the CFLP, which is known to be a non-deterministic polynomial-time-hardness problem (Cornuéjols et al., 1991), being a really time-consuming optimization problem for real-world instances as the ones addressed in this work. In order to make the optimization problem tractable and, therefore, to be solved by commercial software, some simplifications were performed. Generators (both for businesses and institutions, and for housing) are grouped into user points as has been performed in similar studies (see, e.g. Coutinho-Rodrigues et al., 2012; Tralhão et al., 2010). The coordinates of these points were taken in the middle of each pair of opposite blocks, on one of them, nucleating the generators of both. After grouping the generators, for the university neighbourhood 169 user points were obtained. As for the microcentre, these were 191 points. In this way, a form was drawn up that summarizes, for each user point, the number of inhabitants, businesses and institutions that are grouped, as well as the daily volumes of humid and dry waste associated with each point. This last information is obtained from the sum-product of the number of inhabitants and businesses according to classification, per capita volume or per establishment, humid or dry as appropriate.
The mathematical model takes into account the cost of enabling an initial disposal point j. The identified ideal disposal points in the university neighbourhood are 17 and in the downtown are 19. These were identified as places where the location of bins is more convenient since they do not interfere with the traffic flow, do not remove parking places, or do not hinder the circulation of pedestrians. Although it is intended that the bins are as close as possible to the user, in general citizens prefer that bins are not located in front of their home or business, constituting what is known as a semi-obnoxious facility (Coutinho-Rodrigues et al., 2012). This makes the identification of ideal points another advantage.
In this way, for example for the university neighbourhood, we consider a set of possible bin location points (set J in the mathematical model) formed by the set of ideal waste disposal points and by a set of 169 candidate points that coincide with the coordinates of the user points.
In addition to the frequency variation of dry waste collection, scenarios with different maximum threshold walking distance for users to the disposal point to which they are assigned were considered. In line with other similar works (Coutinho-Rodrigues et al., 2010; Coutinho-Rodrigues et al., 2012), two possible maximum distances were considered: 250 m; and 200 m. Using larger distances can make the use of the system too uncomfortable for users. Moreover, if the distance exceeds what they are willing to move, it is likely that their collaboration will be lost and that the waste bags will be thrown out of the bins (Di Felice, 2014) . Therefore, four possible scenarios for each neighborhood were defined: collection frequency of dry waste of three times per week and a maximum walking distance of 200 m (F3-MD200) and 250 m (F3-MD250); and a collection frequency of dry waste of four times per week and distances of 200 m (F4-MD200) and 250 m (F4-MD250).
In the case of standard disposal points, it will be taken that the cost of enabling them is 100% of the cost of the CTB 1100 bin, and in the case of the ideal points, 50% of this amount. That is, $30,000 and $15,000, respectively. These costs include the corresponding signage to prevent vehicles from parking in place while the bins are being cleaned and the costs incurred to adapt the site.
Results and discussion
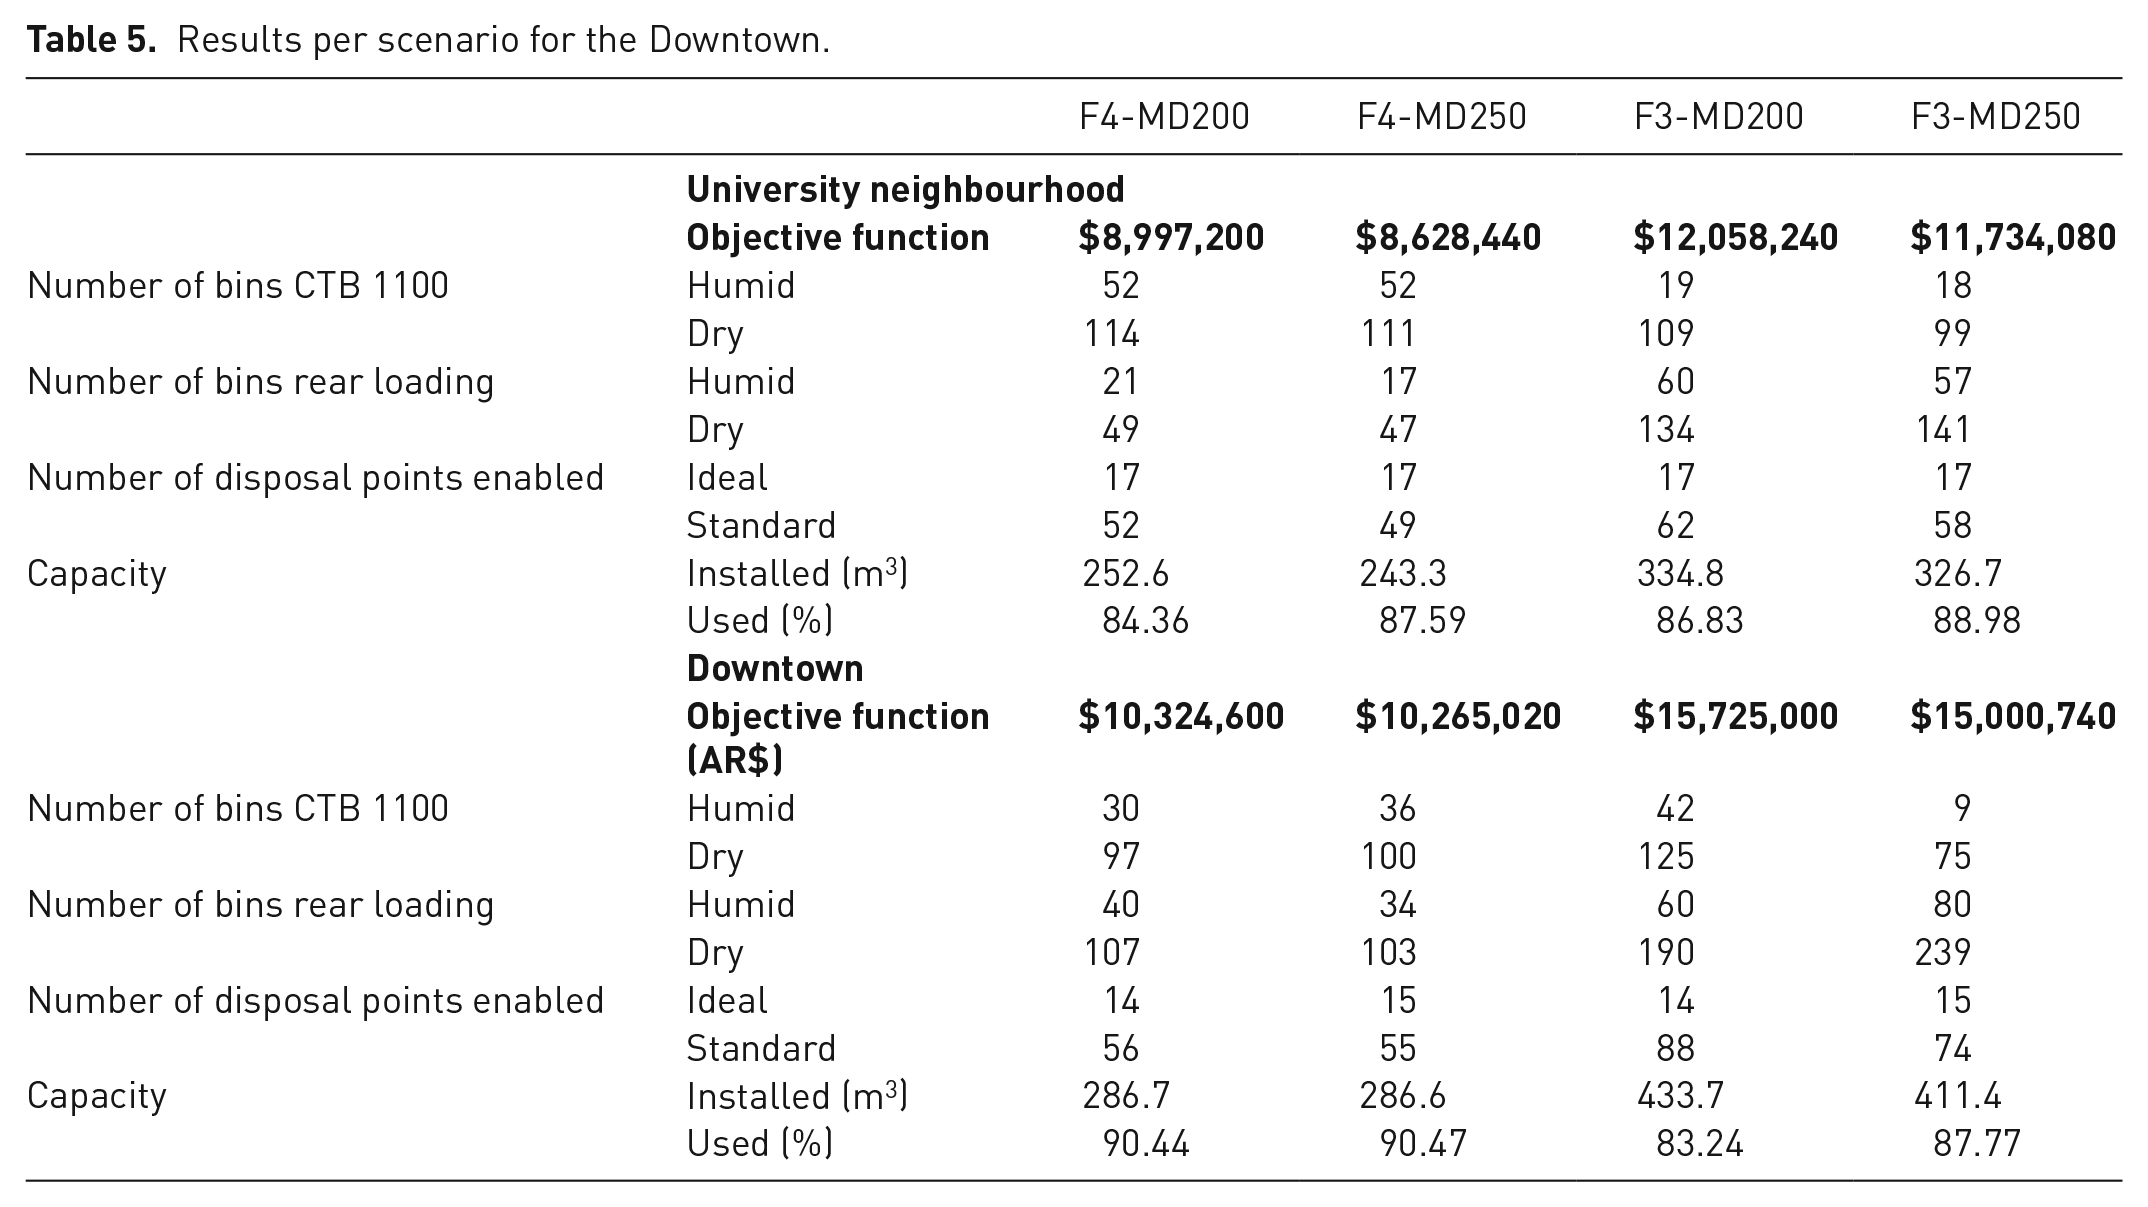
The bin location problem was solved with CPLEX in a personal computer with a processor Intel® Core™ i5-4440 CPU @3.10 GHz and 8.00 GB of RAM memory. In all the scenarios, the CPLEX relative gap was smaller than 10% for a time limit of 46,800 seconds. In Table 5, the results for each scenario are summarized to facilitate the comparison between them.
Results per scenario for the Downtown.
Discussion of results of bins’ location
As expected, in both study areas, the scenario with the lowest costs is the one in which the frequency of collection of the dry fraction is four times a week while the maximum distance to travel by users is 250 m. This is logical given that a higher frequency of collection implies a reduction in the required capacity in bins, and therefore fewer bins to be installed. It can also be noted if the scenarios F4-MD200 and F4-MD250 are compared with F3-MD200 and F3-MD250, respectively. In addition, a significant reduction in the number of disposal points to be enabled is achieved because users can move a greater distance to dispose of their waste, which is in line with the results obtained by Di Felice (2014).
Figures 1 and 2 present the geographical disposition of the scenario F4-MD250 in which the location, quantity and types of resulting bins are depicted for the university neighbourhood and downtown, respectively. The blue and pink circles represent the CTB 1100 bins for the humid and dry fraction respectively, while the green and orange circles represent the rear loading bins for humid and dry waste, respectively. Within each circle the number of bins of each type is shown.
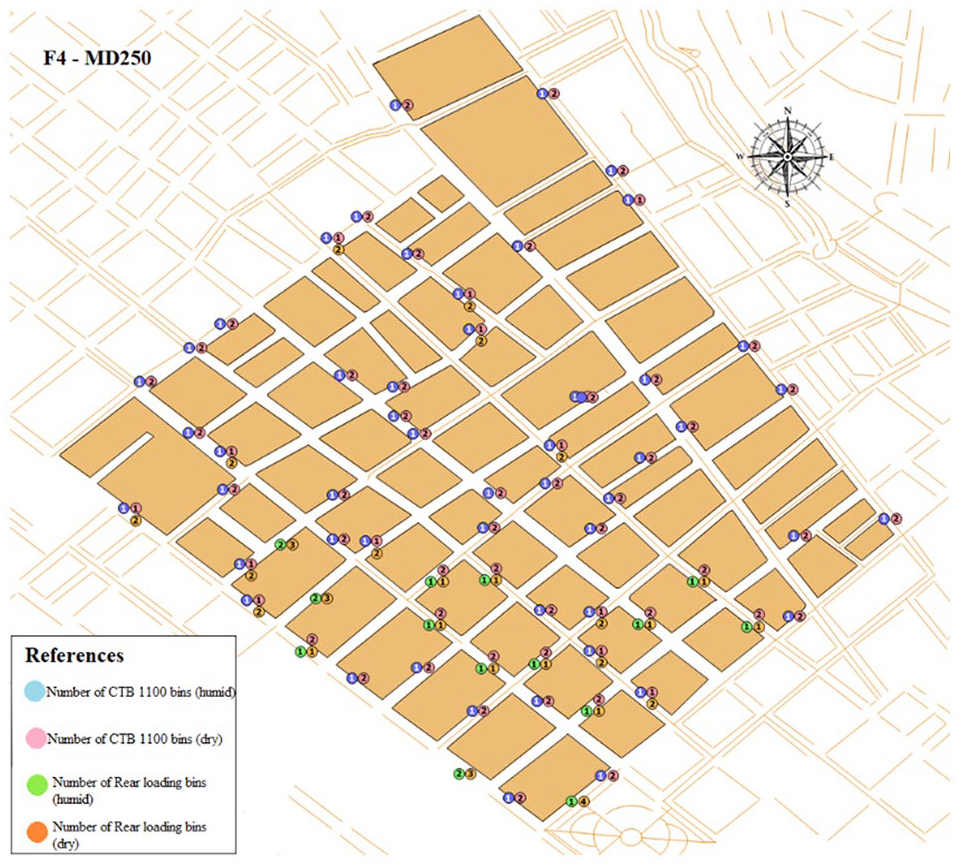
Geographical distribution of bins by type for the area under study in scenario F4-MD250 in the university neighbourhood.
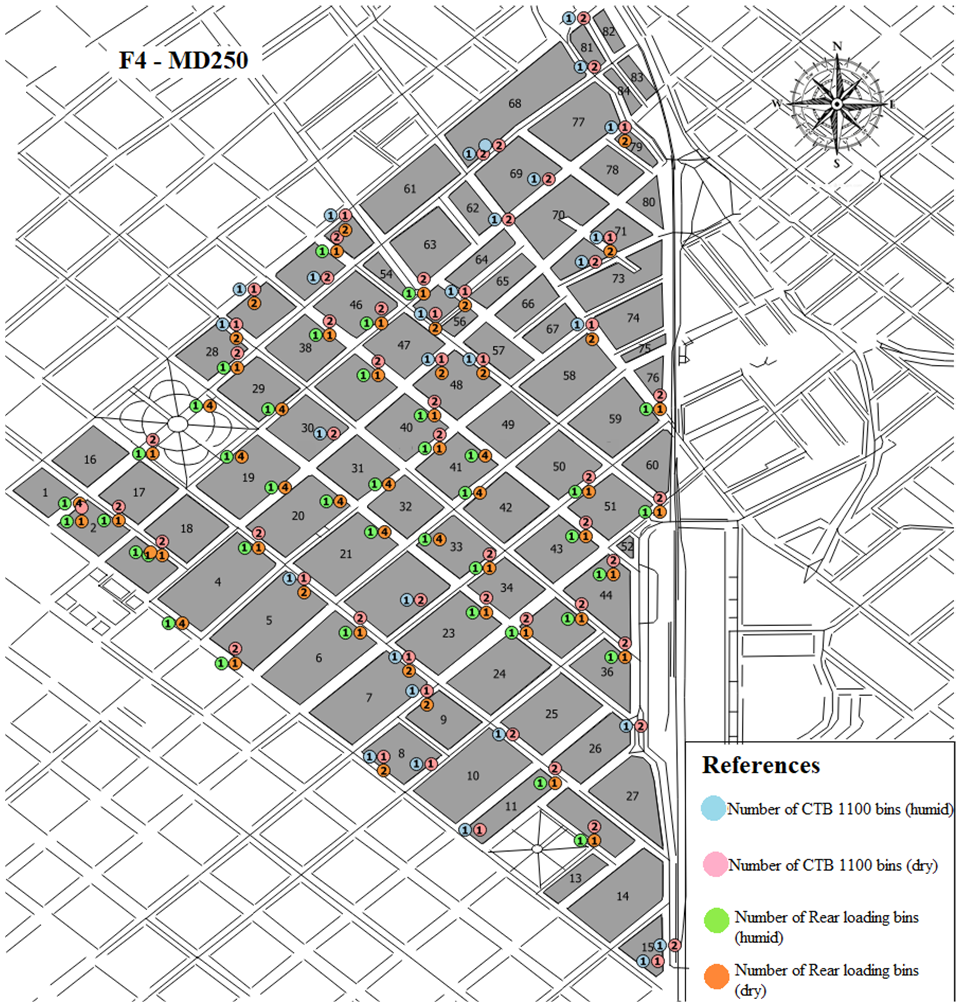
Geographical distribution of bins by type for the area under study in scenario F4-MD250 in the microcentre.
It should be considered that the decision of bins distribution can be also conditioned by the collection stage. Contrary to what happens with installation costs, collection costs increase with the frequency of collection, but in many cases, these costs are reduced by decreasing the number of disposal points enabled. Therefore, although it can be said that scenario F4-MD250 is the alternative that presents the lowest costs, it cannot be assured that this is the best option because other factors must also be considered.
Additionally, in the university neighbourhood, there is a greater demand for bins towards the city centre (south-west direction) where the concentration of shops and population is higher. In turn, in both neighbourhoods, especially in the scenarios in which the collection frequency is three times per week, where the accumulated volume of recyclables is higher, a higher quantity of 1 m3 bins is required because with them a better use of the available space is achieved.
Table 5 shows the cost comparison of the different alternatives under study. Although in Table 5 a comparison between the current door-to-door collection system (that is performed daily) and the alternatives proposed in this paper is not performed, a recent study estimates that the amount of required resources used by the new system would be smaller (Cavallin, 2019). For example, according to this research, the number of employees required to perform collection would be reduced, mainly because the current system needs three employees per truck while in the container-based system only one or two employees are needed. Moreover, there is no need to increase the fleet of trucks since the current number would be enough for operating a container-based system. Additionally, the cost that the municipality has to pay for sending waste to the landfill would decrease since less material would be deposited there as well as the incomes from the sale of recovered materials would increase. Therefore, the operating costs of the differentiated container-based system would be lower than the current system, which would allow for amortizing the initial investment which migrates from the system.
It is important to consider that the obtained results assume that the population will classify their whole waste in dry and humid fractions. Since, actually only a few people perform this activity this could be considered an idealistic situation. However, it should be considered that the proposed model can be easily adapted to more pessimistic scenarios in which citizens do not classify their entire amount of waste. This can be performed by modifying the parameters of the model that represent the classified percentage of wet and dry waste fractions. Through this process, different scenarios can be analysed. For example, during the initial stage of the implementation of a container-based system, less ideal waste classification recovery parameters can be used with the expectation that the source classification will become the norm over time.
Conclusions
The present study consisted in the determination of the location of MSW differentiated bins in two neighbourhoods of the city of Bahía Blanca, Argentina. This city is eager to find a path of sustainability in its MSW system in order to reduce the amount of waste that it is disposed of in the landfill since the semi-arid weather of the city does not facilitate natural biodegradation. Therefore, migrating from the current door-to-door collection of unclassified waste to a source separated collection through the usage of waste bins is a valid strategy for addressing this problem.
For achieving this, a comprehensive methodology was proposed in this work, involving from generation waste rate estimation to selection of bins’ geographical distribution. To do this, much data had to be gathered and estimated since there were no reliable sources available. This included, for example, the population density per block, the generation of MSW per inhabitant, and by type of shop and institution, as well as the characterization of said MSW. For gathering this information, an extensive literature search and surveys by experts in the subject were performed. Therefore, future research in similar cities can benefit from these data and use them as a starting point. Then, the work also addressed the bins’ location problem with a mixed-integer linear programming model for the location of facilities with capacity constraints, seeking the minimization of investment costs, given the maximum area available and the capacity of the bins. Among the potential disposal points, some ideal points were identified during the fieldwork, which have favourable conditions for installing bins without interfering in the every-day-life of the citizens. Different scenarios were analysed, considering diverse collection frequencies and the maximum distance to be travelled by users. With regard to the results obtained, as expected, the higher the frequency of collection the smaller the required investment in bins (since the installed capacity in the disposal points is smaller). Also, the costs decrease the greater the maximum distance to be travelled by the user because in general this implies the enabling of fewer disposal points.
The main lines for future work correspond to extending this methodology to the other neighbourhoods of Bahía Blanca, starting from other medium or high socio-economic levels in the first stage, since these neighbourhoods generate the largest proportion of recyclable waste and, therefore, the impact of the application of source classified waste collection can be larger. Then, in a second stage, the problem of designing collection routes under this new system shall be addressed. Another research line is to improve the quality of the input information. For, example, a characterization study that considers the specific composition and generation rate of the analysed area could be performed in order to refine the quality of the input to the model and, therefore, obtain more accurate results that can explain, for example, the different composition of the waste according to socio-economic differences. Extending the model to include fuzzy parameters of waste classification is another future research line. This would allow consideration of a certain margin of tolerance in the amount of waste that is source classified, this being an important element to handle the migration from an unclassified door-to-door system to a container-based system.
Footnotes
Acknowledgements
The authors thank the company Bahía Ambiental SAPEM and its personnel for their priceless opinions that contributed to improving this work.
Declaration of conflicting interests
The authors declared no potential conflicts of interest with respect to the research, authorship, and/or publication of this article.
Funding
The authors disclosed receipt of the following financial support for the research, authorship, and/or publication of this article: This work was financially supported by the research project VT38-UNS11222 of the “Secretaría de Políticas Universitarias” of the Argentinian Government.