
Abstract
In the increasingly pressing context of improving recycling, optical technologies present a broad potential to support the adequate sorting of plastics. Nevertheless, the commercially available solutions (for example, employing near-infrared spectroscopy) generally focus on identifying mono-materials of a few selected types which currently have a market-interest as secondary materials. Current progress in photonic sciences together with advanced data analysis, such as artificial intelligence, enable bridging practical challenges previously not feasible, for example in terms of classifying more complex materials. In the present paper, the different techniques are initially reviewed based on their main characteristics. Then, based on academic literature, their suitability for monitoring the composition of multi-materials, such as different types of multi-layered packaging and fibre-reinforced polymer composites as well as black plastics used in the motor vehicle industry, is discussed. Finally, some commercial systems with applications in those sectors are also presented. This review mainly focuses on the materials identification step (taking place after waste collection and before sorting and reprocessing) but in outlook, further insights on sorting are given as well as future prospects which can contribute to increasing the circularity of the plastic composites’ value chains.
Keywords
Introduction
In line with the different circular economy initiatives around the world, there is an increasing pressure for improving the plastic end-of-life (EoL) phase, especially towards increasing recycling and reducing depletion of our resources as well as leakage in land or marine environments. Since pure plastic fractions are generally needed to perform most recycling processes which are currently available at a commercial scale, more and more innovations are emerging in the field of plastic sorting (Nüßler et al., 2016; van Engelshoven et al., 2019). Currently, such sorting is often performed automatically by coupling different identification and separation technologies based on size and density, as well as optical and magnetic properties (to remove ferrous packaging) with manipulation carried out via air jets, magnetic separators or mechanical pistons (Neidel and Jakobsen, 2013). Nowadays, the recycling rate of plastics is only approximately 31% in Europe and it is mainly limited to rigid packaging such as polyethylene terephthalate (PET) bottles or other pure polypropylene (PP) or polyethylene (PE) containers (First-Ever Europe-Wide Strategy on Plastics, 2018). In the case of plastics from end-of-life vehicles (ELV), they are usually shredded as mixed light fractions together with other different materials such as foams and textiles. Furthermore, polymer recycling – on a global scale – suffers from insufficient waste collection, where existing sorting and recycling technologies focus mainly on the separation and recovery of mono-materials, that is, those containing a single type of material (Ragaert et al., 2017). Recycling of plastic composites, however, is still a topic of research and development (R&D) (see e.g., Oliveux et al. (2015) for fibre-reinforced plastics and Horodytska et al. (2018) for multi-layered structures) rather than an industrial standard. Another challenge is related to the sorting of black plastics during recycling (Rozenstein et al., 2017).
Manual sorting along with the previously mentioned automatic approaches are not suitable for complex plastic-based materials such as multi-layered packaging or fibre-reinforced composites. Furthermore, in the absence of an industrial approach for their recycling, these materials are generally incinerated with energy recovery or landfilled at EoL. This is especially true for plastics from motor vehicle shredder residues.
Nevertheless, for novel recycling methods such as selective polymers’ dissolution, multi-layered films or composites do not represent any problem, since this method can extract each polymer and fibre fraction subsequently using different solvents (Kaiser et al., 2018; Knappich et al., 2017, 2019). Once separately recovered from the multi-material and multi-layer packaging, each type of plastic can be reprocessed separately.
In view of the appearance of such emerging recycling solutions, there is a need to develop finer identification techniques for multi-material waste plastics (i.e., containing several types of materials as composites, blends, multilayers, etc.). Identification will enable a proper sorting of such composites from recyclable mono-materials packaging streams that can enter existing recycling processes. In the case of packaging, after a more sophisticated calibration not only focused on the few mono-materials currently recovered, the hyperspectral imaging in the near-infrared region (NIR-HSI) already implemented in modern packaging waste sorting facilities, can represent a valuable tool for improving the in-line monitoring of the incoming packaging. However, a number of complementary technologies are required in order to obtain a full fingerprint of all organic (e.g., polymer matrix, coating or paper) and inorganic (e.g., fibres, fillers or metals) materials involved.
In this context, the present paper focuses on the progress in the existing optical technologies. Indeed, they present a broad versatility and current progress in photonic sciences allows core devices to bridge practical challenges previously not feasible. Also, their coupling with advanced data analysis such as artificial intelligence has a high potential to reach new applications. The different techniques are initially reviewed based on academic literature discussing their suitability for different multi-layered packaging and fibre-reinforced/black plastics used in the motor vehicle industry. The suitability of each technique for in-line/on-line/at-line monitoring applications is discussed. In-line and on-line analyses allow a continuous and automatic process control whereas at-line and off-line ones are characterized by a manual sampling, sample preparation, measurement and results evaluation. For in-line monitoring, the sensor directly measures the process stream while for on-line monitoring, the sample to be analysed is taken automatically without stopping the process and optionally returned to the process stream. This is followed by the presentation of some commercial systems with applications in their related sectors. We mainly focus on the material identification phase but also give insights on how these techniques can support sorting of post-consumer plastic composites in an industrial environment as well as future prospects which can contribute to increasing the circularity of plastic composites’ value chains.
Current photonic techniques applied for monitoring of plastics
Current technologies for the characterization and analysis of plastics are mainly based on optical spectroscopies. Although these techniques utilize different physical phenomena, they can be grouped in two general categories: molecular spectroscopies; and atomic/elemental spectroscopies. Next, for each, we will briefly describe the main characteristics and most representative techniques, as well as their basic instrumentation and suitability for the characterization of plastics, including those reinforced with glass and carbon fibres, as well as multi-layered plastic films.
Molecular spectroscopies
Molecular spectroscopies provide information related to the molecular identity of the samples, as well as their molecular conformation and/or structure, that is, the spectral signature of almost any kind of materials, allowing their reliable identification/characterization. These techniques are generally non-destructive, contactless and most of them use low-energy excitation sources. Next, the main characteristics of the most important techniques in this category will be described: Raman spectroscopy (RS), Fourier-transform infrared spectroscopy (FTIR); near-infrared spectroscopy (NIRS); and terahertz spectroscopy (THz).
FTIR
FTIR background
The FTIR is a vibrational spectroscopy working in the mid-infrared region (MIR), allowing fast collection of high-resolution spectra over a wide spectral range (4000–400 cm-1) where most molecules vibrate by absorbing infrared radiation (IR) at specific wavelengths, providing the spectral “fingerprint” of the sample under study (Smith, 2011). Because of the nature of the IR absorption phenomena, FTIR spectroscopy is more sensitive to the functional groups than to the molecular bonds. In addition, FTIR spectra are strongly influenced by the surrounding environment, including the temperature, causing alterations in the baseline and the full width at half maximum of the absorption bands.
FTIR instrumentation, sampling and data analysis
The basic setup of a FTIR spectrometer consists of an IR source (SiC), an interferometer, a sample holder and an IR detector (DTGS for room temperature applications or MCT, cooled by dinitrogen, for a higher sensitivity). Besides the conventional FTIR spectrometers, it is also possible to find commercially available FTIR microscopes to conduct spectroscopic measurements on micrometric areas.
The FTIR measurements can be performed by means of the following configurations: (a) transmission; (b) diffuse reflectance infrared Fourier-transform; and (c) attenuated total reflectance (ATR). Transmission and diffuse reflectance measurements require a cell or window transparent to IR (made from, i.e., potassium bromide, zinc selenide, potassium chloride, magnesium fluoride, cyclododecatrienes, etc.). While some of these compounds are hygroscopic, a moisture free environment is needed, which can be addressed by a purge system. In ATR measurements, the sample is placed in contact with a crystal window (i.e., germanium (Ge) or diamond), allowing the interaction of IR, going through multiple internal reflections in the crystal with the sample due to the evanescent wave effect (Khoshhesab, 2014).
FTIR industrial applications
Due to the above-described characteristics, most FTIR spectrometers have been, for many years, confined to the laboratory environment. However, recent advances in the technology of spectroscopic systems have made possible commercially available, portable and robust handheld systems for in-situ industrial applications (Higgins, 2014).
FTIR applications in analysis of plastics
Showing their main spectral features around 1800–700 cm-1 and 3200–2700 cm-1, these two regions can be used for the characterization and analysis of plastics (see Figure 1). In these regions, plastics absorb bands ascribed to stretching and bending vibrations of C-H (aromatic and aliphatic), C=O, C-O, N-H and C=C bonds.
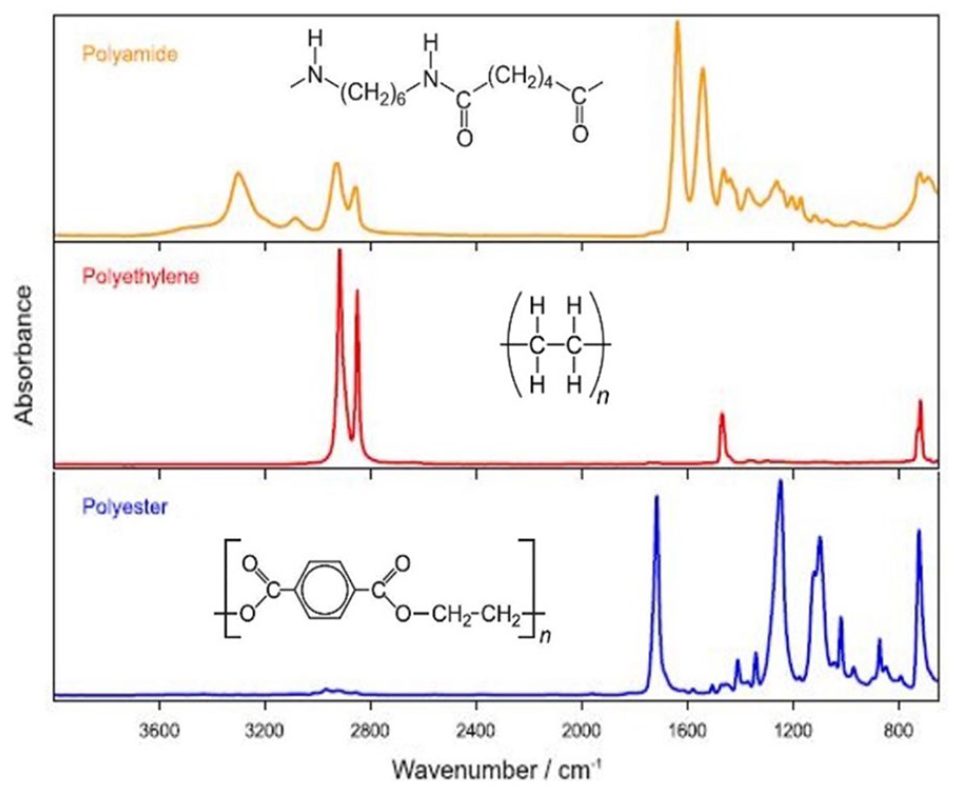
Fourier-transform infrared spectroscopy spectra collected from different polymers. Below 2000 cm-1, information related to the rings and carbonyl groups can be obtained. Information related to the carbon–hydrogen groups can be found above 2700 cm-1.
According to the state-of-the-art of the technique, spectroscopy in the MIR region has been used for the characterization of a great diversity of plastics, including those commonly used in the motor vehicle industry such as those filled with carbon black and/or reinforced with carbon or glass fibres, hereafter referred to as black plastics (Chércoles Asensio et al., 2009; Ferreira et al., 2018; Jung et al., 2018; Kassouf et al., 2014; Rozenstein et al., 2017; Stark and Matuana, 2007).
Spectroscopy in the MIR range can be considered as one of the reference techniques for the analysis and characterization of polymers. Among the most common polymers used in packaging, we can find PET, polyamide, polylactic acid, high-density polyethylene (HDPE), polyvinyl chloride (PVC), low-density polyethylene (LDPE), PP and polystyrene, which have specific spectra allowing their easy identification and/or discrimination (Jung et al., 2018; Kassouf et al., 2014). Since the MIR region is beyond the visible range, coloured and black plastics do not pose a problem for the analysis, as opposed to NIR and Raman spectroscopies (as discussed later). Thus, this technique provides a spectroscopic solution for the analysis of this particular kind of plastics (Robertson, 2015) as well as composites reinforced with glass or carbon fibres (Becker et al., 2017; Higgins, 2014). Regarding the use of MIR spectroscopy for multi-layered packaging films, there are several papers and reports dealing with these types of materials. However, most of the studies deal with laboratory samples using FTIR-microscopes (Gaston et al., 2016; Häsänen, 2016; Kelchtermans et al., 2016; Kellner et al., 1986).
Mid-infrared hyperspectral imaging (MIR-HSI)
MIR-HSI background
The MIR-HSI systems, similar to other HSI devices working in the IR region, provide a chemical imaging based on the molecular information of the sample in this region. Nevertheless, there are differences in their setup. It should also be taken into account that, when using spectral imaging technologies in the MIR region, spectra will contain artefacts and possibly cannot be interpreted or analysed as conventional laboratory FTIR spectra. In this case, multivariate approaches for data analysis should be considered (Becker et al., 2017; Zachmann et al., 1995; Zoidis and Tomita, 2000).
MIR-HSI instrumentation, sampling and data analysis
A basic HSI system includes: a sensor (usually an indium antimonide-based camera for the MIR range); a broadband illumination source; a spectrometer, which separates the backscattered/transmitted light in its different wavelengths; and, when required, a conveyor belt, synchronized with the recording frame’s rate of the sensor for scanning the sample. A hyperspectral system provides a hypercube as output: a group of data ordered in three dimensions, two spatial (a plane XY) and one spectral (λ, wavelength), as depicted in Figure 2.
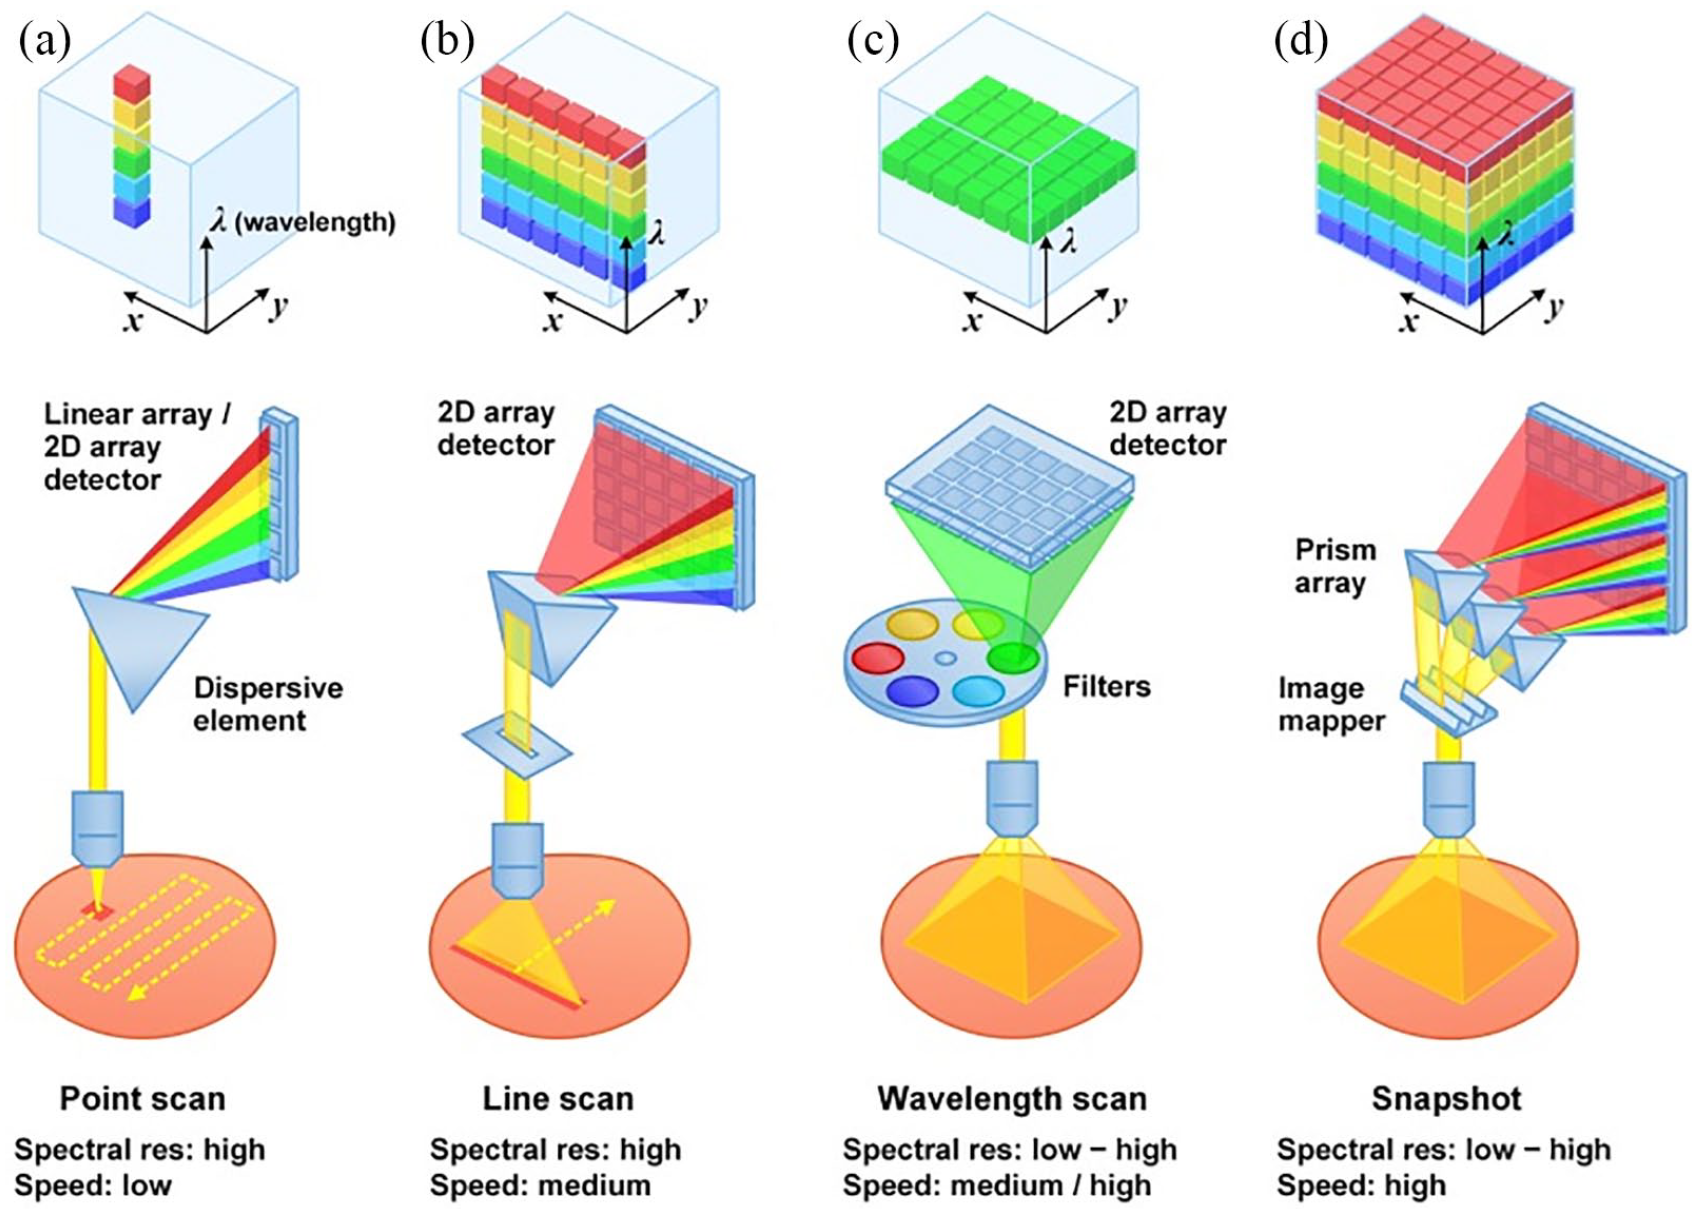
Most common configurations of hyperspectral devices: (a) point scan; (b) line scan (pushbroom); (c) wavelength scan; and (d) snapshot.
Four basic modes for HSI measurements can be performed depending on the application. Their descriptions can be found in the following references: Amigo et al. (2013), Wang et al. (2017), and Wu and Sun (2013). Next, we will briefly describe the main characteristics:
(a) Point scan: a point is imaged on the sample and a single spectrum for each point or pixel is recorded each time (e.g., sample stage moves slowly in x and y directions).
(b) Line scan or pushbroom: a narrow spatial line of the sample surface is imaged at a time and split spectrally before reaching the two-dimensional (2D) sensor array of the camera. One dimension is used for spectral separation and the other for imaging in the line spatial direction. The second spatial dimension is obtained by moving the sample over the fixed camera. The result can be seen as a 2D-image where each pixel in the image contains one full spectrum. This modality is the best choice for in-line applications, where the sample can be conveyed by a belt or roll-to-roll for example, or where the scanning head can be automated.
(c) Wavelength scan: it is also possible to acquire 2D-images at multiple wavelength bands over time by using monochromators, filter wheels, or electronic tuneable filters. Nevertheless, the light throughput is usually low and a prolonged collection time is required because only one wavelength band is collected at a time.
(d) Snapshot: the hypercube is recorded in a single step (snapshot). In this modality, for each wavelength band a 2D-image is collected and multiple “snapshots” are performed to create the hypercube (optimal for static samples).
The pushbroom method is the most used in current hyperspectral systems for laboratory and industrial applications as it gives a good trade-off between spectral resolution and collection time.
MIR-HSI applications in the analysis of plastics
Recently, new hyperspectral cameras have been released in the market for different applications. In particular, cameras working in the MIR region (approximately 3500–2400 cm-1) have received great attention by recycling facilities. Unlike conventional cameras working in the visible (Vis)-NIR region, which are not suitable for the analysis and identification of black plastics, MIR-HSI cameras overcome the challenge of strong absorption of carbon black in the Vis-NIR radiation present in these plastics, allowing their analysis without any complication (Inno-spec, 2018; Specim, 2019; Steinert, 2019).
Raman Spectroscopy (RS)
RS background
The RS is a molecular technique based on the inelastic scattering of light (Raman effect). When photons interact with a sample, most of them are elastically scattered (Rayleigh photons) and a small portion are inelastically scattered (Raman photons) (Jayasooriya and Jenkins, 2002). Raman scattering produces scattered components with substantially modified optical frequencies and wavelengths. Those shifts provide information about the molecular identity and structure of samples in the MIR region (Ferraro et al., 2003).
Unlike FTIR, RS is more sensitive to the molecular structure (electronic bonds) than functional groups. In this sense, RS and FTIR have been treated as complementary techniques.
RS instrumentation, sampling and data analysis
A basic Raman system for macroscopic measurements includes: a coherent and monochromatic light as excitation source (visible or NIR laser); a band-stop filter, better known as holographic notch filter, to reject the laser light scattered from the sample (which is not part of the Raman signal); and a charge-coupled device or complementary metal oxide semiconductor-detector. Excitation light can be directed towards the sample and the backscattered light collected through conventional optical elements (i.e., lenses, mirrors, etc.) or by means of optical fibres (Bumbrah and Sharma, 2016) and focused on the detector. Since the Raman effect is very weak, collection of Raman photons is an important issue partially solved by the use of highly sensitive and intensified detectors and highly optimized optics (with antireflection coatings). Another common configuration, including an interferometer in the setup, is known as a Fourier transform– Raman spectrometer. In this case a Michelson interferometer, a laser source at 1064 nm (i.e., Nd:YAG fundamental radiation) and an indium gallium arsenide (InGaAs) or Ge detector are commonly used. It works in a similar manner to any FTIR spectrometer (Chase, 1986) with the same limitations due to water absorption.
Raman systems enable the incorporation of microscopes and are able to record spectral images quickly (e.g., minutes), with a high-spatial and spectral resolution.
RS industrial applications
Due to the possibility of using optical fibres, RS is a good candidate for industrial monitoring applications in the food, bio-medical/pharmaceutical, mining, and polymer industries (Esmonde-White et al., 2017; Everall and King, 1999; Knop and Kleinebudde, 2013).
Furthermore, nowadays, it is also possible to find portable Raman systems, as well as handheld systems for in-situ measurement but with lower spectral resolution compared to the laboratory’s systems (Bruker, 2012; Rigaku, 2017).
RS applications in the analysis of plastics
The RS has been proven to be an adequate reference technique for the characterization of polymeric materials (Everall and King, 1999; Tsuchida et al., 2009) and for a combination of them found in packaging plastics. Since RS is a highly sensitive detection, slight changes in the molecular structure can be clearly distinguished in the Raman spectrum. Polymers such as PP, PS, PA, PE, acrylonitrile butadiene styrene (ABS), PET, polycarbonate (PC), PVC, polyurethane (PU), polyvinylidene chloride and others, have been successfully characterized by RS.
Some research papers have been published showing the potential of confocal Raman in micro-spectroscopy for the characterization of multi-layered films with high reliability (Gaston et al., 2018; Xue, 1997). Although the technique has succeeded in a laboratory applications environment, it can hardly be implemented for in-line industrial applications as the radiation penetration is not guaranteed to reach inner layers.
Contrary to FTIR spectroscopy, RS is not suitable for the analysis and characterization of black plastics, since Vis-NIR light is highly absorbed by the black carbon commonly present in black plastics. Nevertheless, some attempts have been made in this direction, involving the use of powerful data analysis techniques, such as neural networks (Roh et al., 2017).
NIRS and NIR-HSI
NIRS background
In the NIR region (750–2500 nm), absorption spectra are composed by overtones, and the combination and overlapping of wide bands unlike the fundamental modes of molecules in the MIR region. The intensity of the NIR signal is ten to a thousand times weaker than signals in the MIR region (Pasquini, 2003). All these limitations are compensated by its high specificity. NIRS relies on the fact that N−H, O−H and C−H bonds, strongly absorb radiation at these wavelengths, turning it into an optimal tool for the study of organic compounds. Furthermore, the use of multivariable methods for spectra/data analysis, has made it possible to exploit the full potential of the technique for identification, discrimination, classification and quantification purposes (Geladi and Dåbakk, 1995; Geladi et al., 2004).
NIRS instrumentation, sampling and data analysis
The NIR instrumentation is quite simple and has a broad range of applications. The basic setup for NIR measurements consists of: (a) a broadband excitation source, which is usually a halogen light (with a tungsten filament); (b) a spectrometer; and (c) a semiconductor photodetector, generally made of an alloy of InGaAs. Optical fibre probes can be adapted to the NIR spectrometers for remote sensing. Nevertheless, such probes should have a low oxygen–hydrogen content, in order to avoid the fibre contribution in the collected spectra (Agelet and Hurburgh, 2010). Prior to NIR measurements, a calibration should be performed, consisting in subtracting the lamp contribution (bright signal) and the electronic noise coming from the detector (dark signal).
The NIR spectrometers can work in transmittance and/or reflectance mode depending on the type of sample to be analysed. Figure 3 shows both configurations.
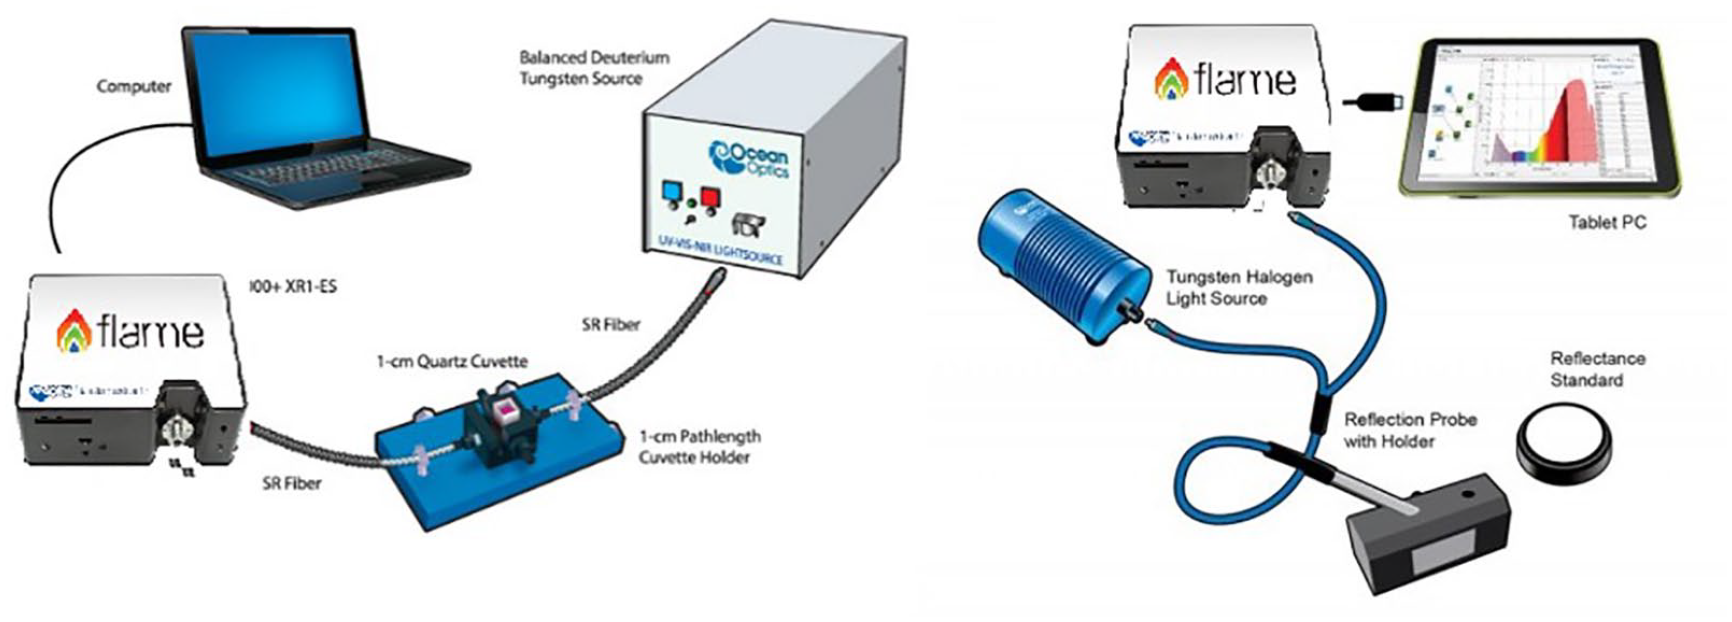
Experimental configurations for near infrared region spectrometers. (Left) transmittance and (right) diffuse reflectance.
Since NIRS emerged as a powerful tool for the analysis and characterization of materials, chemometrics (i.e., mathematical and statistical analysis used to retrieve the chemical information of a sample) became the standard approach for the analysis of NIR spectra. Because of the wide overlapping bands explained before, advanced mathematical and statistical methods are required to reveal the data structure of spectra. Methods such as principal component analysis (PCA), partial least squares (PLS), partial least squares discriminant analysis (PLS-DA) (Killner et al., 2011), support vector machine (SVM) (Pierna et al., 2004), multivariate curve resolution (Câmara et al., 2017), etc., have been successfully applied in spectral data analysis. Also, more advanced artificial intelligence techniques are now used (e.g., artificial neural networks (ANN)) (Allouche et al., 2015) in order to improve the capabilities of NIRS in terms of resolution, penetration depth, etc.
NIRS industrial applications
The use of optical fibres and conventional halogen illumination combined with the specific information of -CH and -OH functional groups in the range of 900–1700 nm makes NIRS a suitable analytical tool for the food, polymers and pharmaceutical industries and for the monitoring of waste recycling (Huang et al., 2008; Jamrógiewicz, 2012; Osborne, 2000; Porep et al., 2015; Qu et al., 2015; Rani et al., 2019; Yan and Siesler, 2018; Zhao and Chen, 2015). Handheld NIR spectrometers as described for Raman and FTIR, provide high flexibility for in-situ measurement under industrial environments (Figure 4).
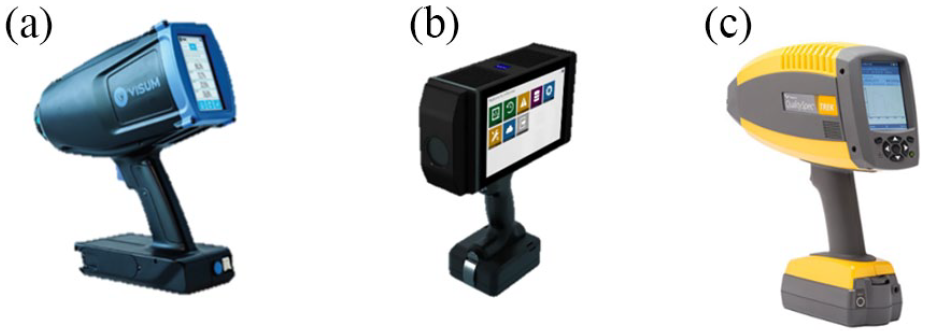
Example of handheld near infrared region spectrometers: (a) VISUM Palm by IRIS Technology group; (b) AURA by Zeiss; and (c) ASD QualitySpec®Trek by Malvern Panalytical.
NIRS applications for the analysis of plastics
Studies conducted on plastic materials using NIRS, show the feasibility to identify most common plastics such as PP, PE, PS, PET, PU, PA, PC, poly(L-lactic acid), polyhydroxyalkanoate, poly(butyl acrylate), etc. (Eisenreich and Rohe, 2000).
Among the diversity of applications in NIRS, the recycling of plastics has received great attention not only from the scientific and industrial communities but also from the government legislations of many countries around the world (unpri.org, 2019). Therefore, NIR-based technologies have been increasingly developed for plastic sorting.
Particularly, NIR-HSI has been widely used for in-line monitoring applications, due to the capability to provide information regarding the composition and its spatial distribution (Gundupalli et al., 2017). These characteristics have boosted its use in the solid waste recycling industry.
NIR-HSI background
Current technologies for the monitoring and sorting of solid plastic waste in the NIR region use hyperspectral cameras. As for MIR-HSI, a hyperspectral cube is used to identify the chemical composition and distribution of a sample. Several publications and technological developments have been published using NIR-HSI for sorting of plastics (Aikawa and Shiratama, 1996; Ghasemzadeh-Barvarz et al., 2014; Gundupalli et al., 2017; Inada et al., 2003; Masoumi et al., 2012; Ulrici et al., 2013; Vázquez-Guardado et al., 2015; Vegas et al., 2015; Zheng et al., 2018).
Since hyperspectral images contain a huge quantity of spectral information, they should be analysed using advanced multivariable methods. Multivariable methods applied to data analysis allow the elucidation of the data structure and the most significant correlations among variables but also enable the calibration of classification and/or quantification models. For more information regarding multivariable methods, the reader can consult the following references: Câmara et al. (2017), Geladi and Dåbakk (1995), Geladi et al. (2004), Mitsutake et al. (2018), Ozaki et al. (2007), and Vogt and Tacke (2001). HSI requires a significant computing capacity, which can represent a challenge for in-line monitoring of fast industrial processes. The potential of data processing and storage in the cloud is being investigated, for example, tapping into improved information and communications technology resources such as taking fifth generation broadband into account (5G Solutions for European Citizens, EU funded project, n.d.).
NIR-HSI industrial applications
Most of the industrial applications of NIR-HSI are related to the agro-food industries. These industries have taken advantage of the chemical imaging capabilities of NIR-HSI, as well as the versatility of its instrumentation to be implemented in the production lines as a monitoring tool for the safety and quality assessment of agro-food products (Badaró et al., 2020; Dale et al., 2013; Fox and Manley, 2014; Serranti et al., 2013; Yuan et al., 2020). Nevertheless, the pharmaceutical sector, minerals, plastics’ recycling and plastic converting industries, have found in the NIR-HSI a valuable monitoring technology (Bonifazi et al., 2020; Bøtker et al., 2020; Dalm et al., 2015; Moroni and Mei, 2020; Schropp et al., 2013; Stiefenhöfer, 2020; Wu et al., 2020).
NIR-HSI applications on plastic analysis
In recent years, HSI technology has gained traction for in-line monitoring applications. The ability of HSI to provide spatial and spectral information in “real-time” and the fact that plastics provide specific signatures in the NIR band region (900–1700 nm) explains why modern plastic sorters include NIR-HSI cameras in their core technology.
The NIR-HSI has also shown good results for the inspection of printed multi-layered-films in laboratory scale. However, the detection and/or identification of the different layers is limited by the penetration depth of NIR radiation as well as the absorbance coefficient and thickness of the polymers.
Use of machine learning for improving data processing
Given the presence of noise and some stochastic effects in the NIR and NIR-HSI data, some machine learning algorithms have the potential for providing an advantage with respect to traditional chemometric models, for given polymers (e.g., multi-layered films when the single polymers’ spectra blend together). For example, Gruber et al. (2019) applied different statistical and machine learning techniques to build classification models for black plastic waste using fluorescence imaging data; Hollstein et al. (2015) reviewed the applicability of different machine learning techniques (SVM (Cortes and Vapnik, 1995)), ANN in comparison to typical chemometric approaches such as PLS-DA; and Zhu et al. (2019) applied an “extreme learning machine” to HSI for impurities detection in polymer blends.
Gruber et al. (2019) considered the recycling of black plastic particles after cryogenic grinding, for example from the motor vehicle or electronics industries. Different algorithms were applied to fluorescence imaging data for classifying the black plastics waste: linear discriminant analysis (LDA) (Bishop, 2006); k-nearest neighbour classification (Cover and Hart, 1967) which uses a distance metric to identify similar cases (i.e., if k = 10, the algorithm tries to identify the 10 cases which are “closest to” or most similar to a given case); SVMs ; ensemble models with decision trees (ENSEMBLE) (Breiman et al., 1984); and convolutional neural networks (CNNs) (Huang et al., 2006). The CNNs in particular attempt to increase the overall classification accuracy by taking into account the shape of the plastic particles. After data acquisition, the polymer particles in the hypercubes were separated from the substrate by a threshold value based on their NIR reflectivity at 870 nm. Subsequently, the wavelength range of the hypercubes of the polymer particles was cut to 103 spectral channels between 501 nm and 664 nm. In one experiment, the data from 41 industrially relevant plastic mixtures with a maximum of three classes were used for model training and testing. From these, about 400 particles, each consisting of 14 plastics from 12 plastic classes were further examined. An attempt was made to train an overall model for the classification of all 12 plastics. Also, experiments were conducted to find the optimal “hyperparameter” settings for the algorithms. The results for this are shown in Figure 5, where it can be seen that CNN and ENSEMBLE gave the best results, whereas LDA and SVM were the worst performers.
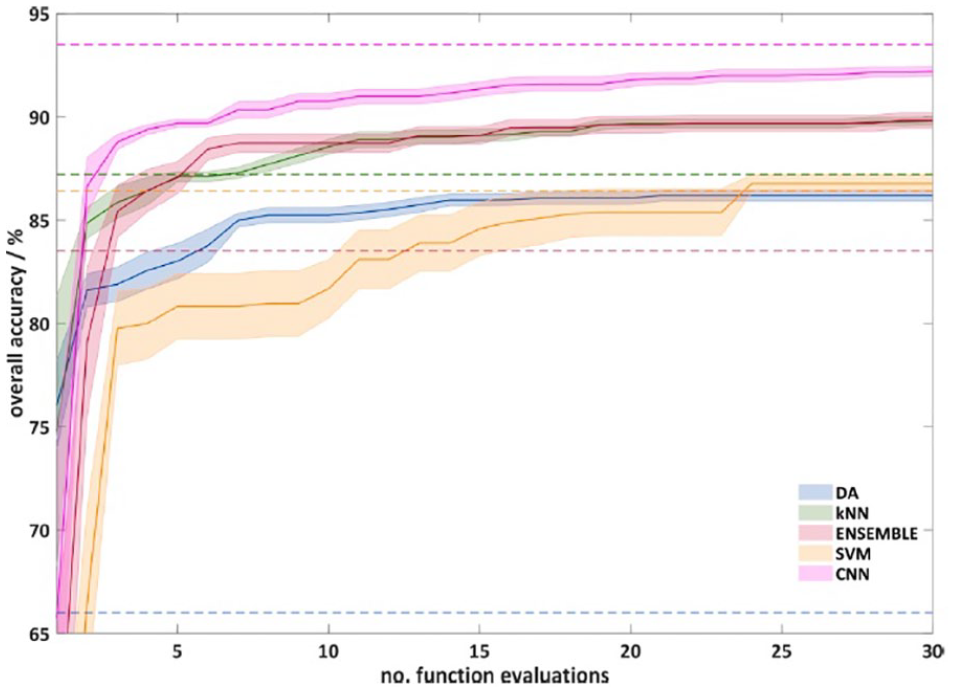
Results of “hyperparameter” tuning for different approaches, in terms of the number of function evaluations for automatic hyperparameter optimization versus classification precision.
In Hollstein et al. (2015), the following modelling methods were used for the classification of bio-based plastics coming from natural resources as well as plastics with oxo-degradable additives: chemometric methods, specifically PLS-DA; ANNs; and SVMs and decision trees. For the “oxo-biodegradable” plastics data it was found that ANN and SVM had a high computational cost. The input stream was a waste mix of bottles and containers consisting of PET, PP and PLA.
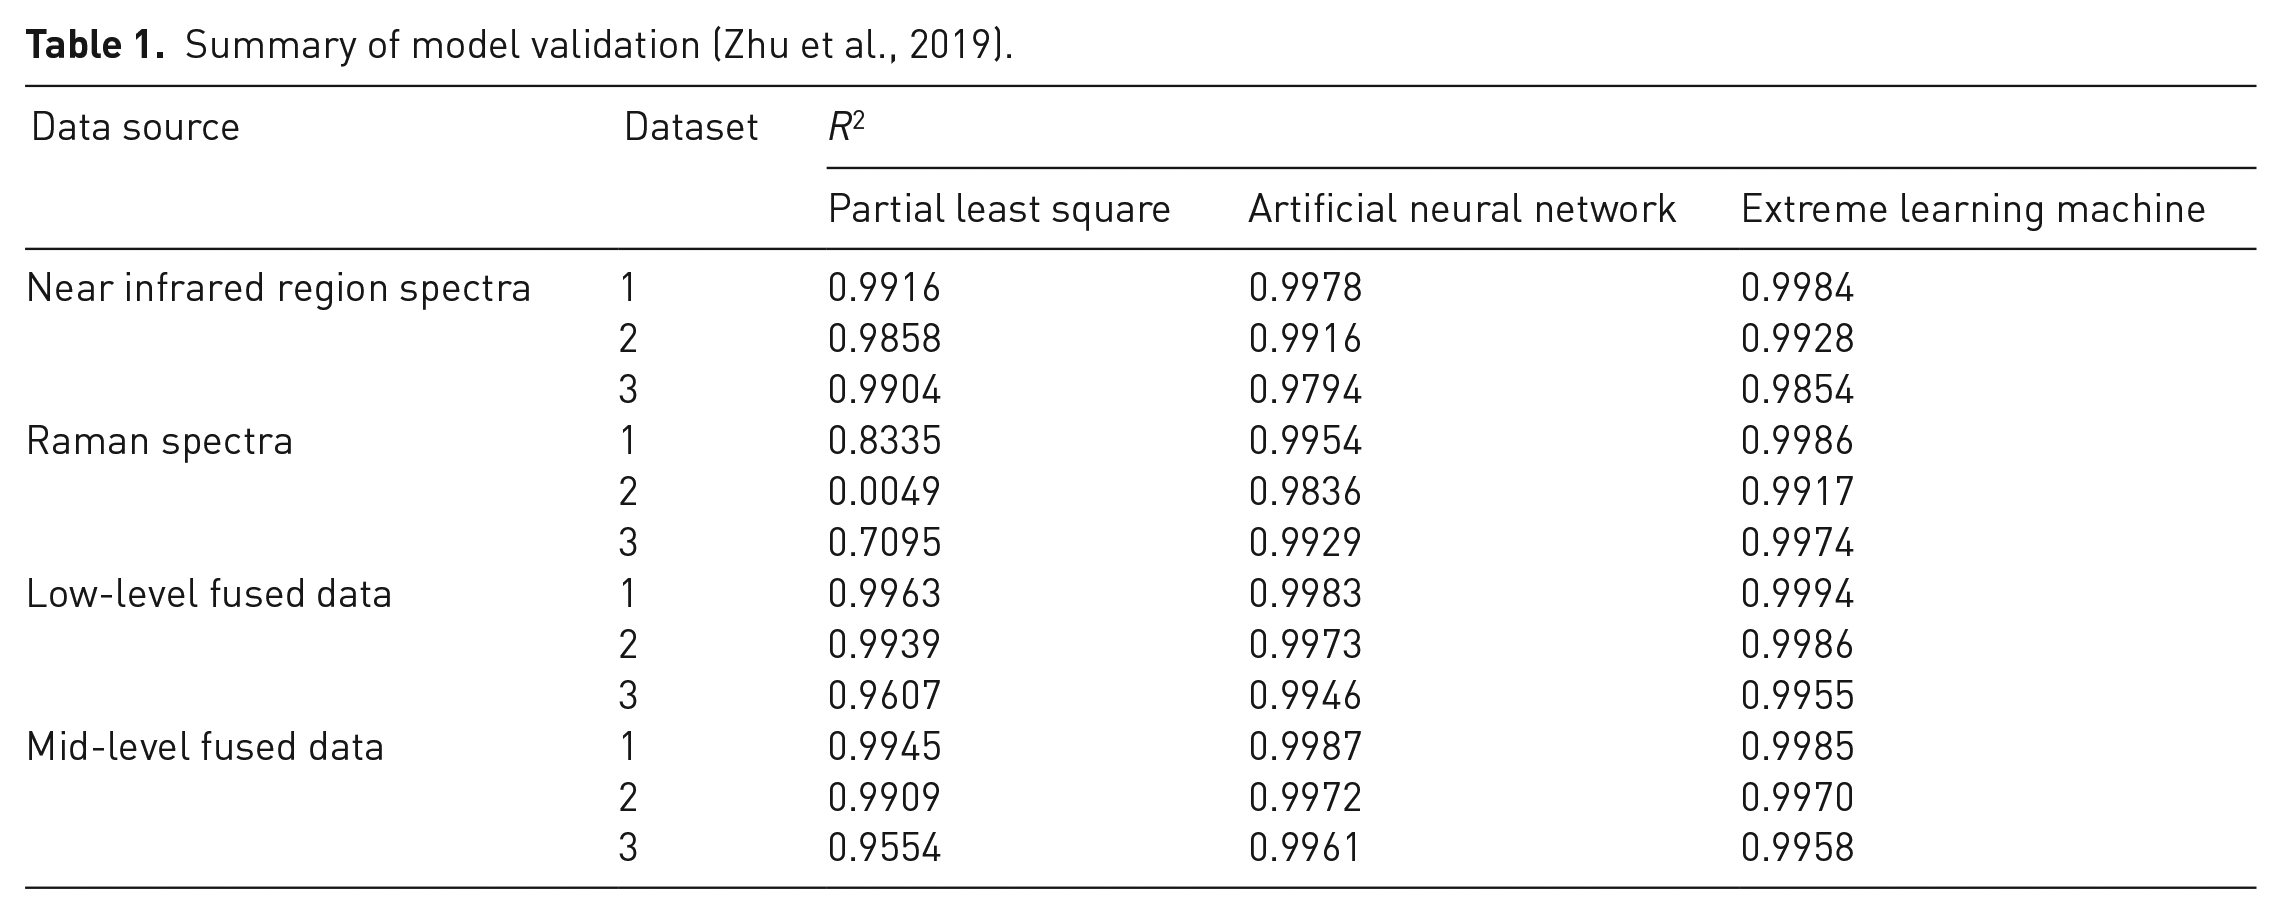
Zhu et al. (2019) proposed two data fusion strategies (low-level and mid-level fusion) to combine the NIR and Raman spectra to generate fusion spectra or fusion characteristics. The objective of doing this was to improve the in-line measurement precision of component content of molten polymer blends. The fusion and non-fusion versions of the data were then given as input to different modelling techniques to compare their performance. For evaluating the response of different models to data fusion strategy, PLS regression, ANNs, and extreme learning machine (ELM) (Huang et al., 2006) were applied to the modelling of four kinds of spectral data (NIR, Raman, low-level fused data, and mid-level fused data). Two types of polymer blends were considered: PP; and PS. Table 1 shows a summary of the results for the four different fusion types and four different kinds of spectral data (2 fused and 2 non-fused). It can be seen that ANN and ELM had very similar performance results and both outperformed PLS (the traditional chemometric modelling technique). In terms of data source, all gave a similar performance, except for “Raman spectra” which was slightly worse (see Table 1, outlier result for PLS with dataset 2).
Summary of model validation (Zhu et al., 2019).
Terahertz imaging (THz)
THz background
Radiation in the THz region – also known as far-IR radiation – is a low energy radiation that has the remarkable property of passing through a great quantity of nonconductive materials, such as clothing, paper, cardboard, wood, masonry, plastics and ceramics. However, it cannot penetrate metal and is strongly attenuated by water. THz spectroscopy is based on the interaction of the radiation in the spectral region (0.1–10 THz or 0.03–3 mm) with the matter. Radiation in this frequency range causes an alteration in the rotational energy of the molecules and can be used for the chemical characterization of different materials.
The THz imaging provides a unique combination of high contrast imaging, high spatial resolution and safety, making it an alternative to X-ray tomography and imaging, ultrasound imaging, IR thermography and optical coherent tomography (Zeitler and Shen, 2012). Among the diverse applications of THz imaging, we can list defence and security, quality control on integrated circuits, detection of polymer composites and flames retardant, grains and seeds analysis and quality control, characterization and analysis of tissues; analysis of polymers and pharmaceutical tablets, among others (Garbacz, 2016; Knop and Kleinebudde, 2013; Liu et al., 2007; Nüßler et al., 2016; Trofimov and Varentsova, 2015; Zeitler and Shen, 2012).
THz instrumentation, sampling and data analysis
The THz systems can be classified according to the type of source used: vacuum electronic; solid-state electronic; lasers; and mechanical excitation. Nowadays, THz sources commercially available include optically pumped THz lasers (Mueller, 2016), time-domain system sources (Globisch et al., 2015), THz impact avalanche transit time (IMPATT) diodes (Mukherjee et al., 2007), and backward-wave oscillators (Garbacz, 2016).
The simplest setup for THz imaging requires a THz-source (tuned for a single wavelength) and a THz-camera (array of single detectors). Measurements provide a contrast image that can be recorded in a transmittance or reflectance configuration and preparation of samples is not required. Figure 6 shows a basic setup for THz imaging under transmittance configuration (Terasense, 2019).
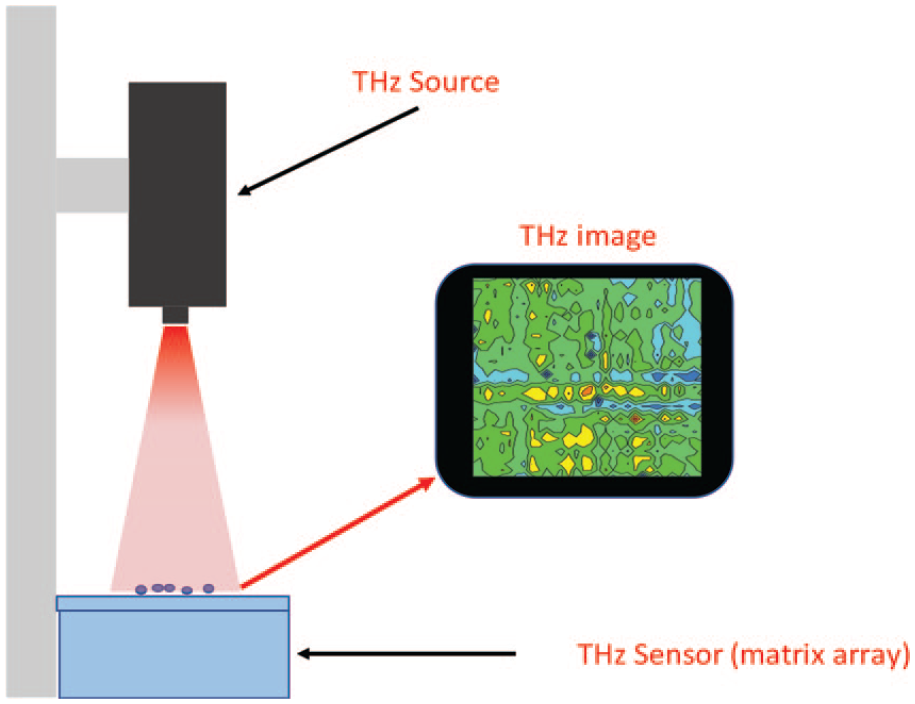
Terahertz spectroscopy (THz) imaging setup on transmittance configuration. The THz source is an impact avalanche transit time diode and the camera is fabricated with a GaAs high-mobility heterostructure.
According to the methods used for the generation and detection of THz radiation, setups can be divided into active and passive (Wilke, 2016).
There are two types of detection systems for THz radiation: incoherent (broadband); and coherent (narrowband). The most commonly used incoherent detectors are based on thermal absorption, and require cooling to reduce thermal background noise. In this category we can mention bolometers and pyroelectric IR detectors (Lee, 2013). For coherent detection, most of the systems are based on photoconductive and free-space (i.e., freely propagating THz beams) electro-optic sampling (Chan et al., 2007).
THz industrial applications
There are several industrial applications of THz imaging and spectroscopy reported: automated imaging of coated pharmaceutical tablets to investigate the thickness and homogeneity of polymer coatings (Zeitler et al., 2007); in-line sensor monitoring a polymer compounding process (Krumbholz et al., 2009); in-line thickness gauge to measure the thickness of polymer laminates during production (Zimdars et al., 2010); and in-line sensor measuring the thickness of polymer coatings on individual tablets during production (May et al., 2011). Nevertheless, the range of industrial applications has increased over recent years, for example in the motor vehicle industry for detection of disrupted steel reinforcements inside tyres, detection of corrosion in metal parts, defect detection and humidity measurements in ceramics (Terasense, 2019), among others.
THz applications in analysis of plastics
As mentioned previously, most polymers are transparent to THz wavelengths. Conversely, some applications on polymers are related to the evaluation of joints in plastics (Koch and Krok, n.d.). Furthermore, since some black plastics used in the motor vehicle industry cannot be sorted using conventional optical sorting systems, THz technology can help in identifying different polymeric resins as well as black plastics (Küter et al., 2018). Another application is related to the monitoring of composites and identifying fillers in polymers such as in PP (Menlosystems, 2015). In addition, polymer composites with wood fibres can be examined by THz imaging since the technology is very sensitive to the water content (Jördens et al., 2010).
Atomic spectroscopies
These spectroscopic techniques commonly use high-energy radiation sources to provide information about the atomic or elemental composition of a sample. The specificity of these techniques is low when compared to molecular spectroscopies. Samples with similar elemental composition will give similar or identical spectra, limiting the applications in sample discrimination/classification. Some of the most common techniques in this class are: laser-induced breakdown spectroscopy (LIBS); and X-ray fluorescence spectroscopy (XRFS). These technologies, however, can be used as a complement to the previously discussed techniques, for example to identify all components in organic–inorganic composites such as polymers with flame retardants or inorganic fillers.
LIBS
LIBS background
The LIBS is based on the use of a laser as the excitation source to create a plasma on the surface of the sample to be analysed. In addition, LIBS systems can be miniaturized and portable devices are nowadays available in the market. The whole spectra profile is used in order to identify not only inorganic elements but also organic components. Chemometric analysis is needed to provide suitable data processing.
LIBS instrumentation, sampling and data analysis
The LIBS systems can be found on the market as modular systems and as portable or hand-operating configurations. Any LIBS device uses a high-energy pulsed laser as the excitation source, and optical elements to focus the laser light onto the sample and to collect light and a detector for the Vis-NIR range. Figure 7 shows a basic setup to conduct LIBS experiments.
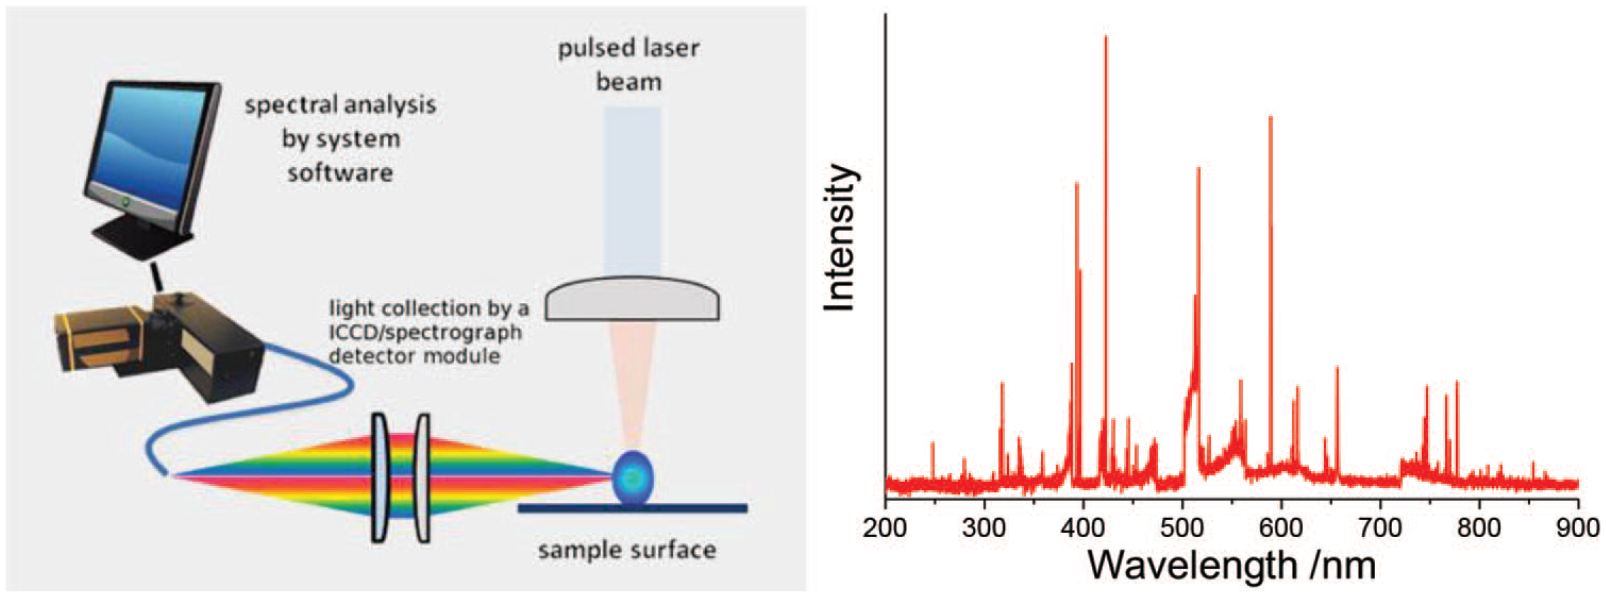
(Left) basic laser-induced breakdown spectroscopy (LIBS) setup where a pulsed laser is focused on a sample; and (right) example of a LIBS spectrum where the peaks correspond to specific atomic lines. Thus, the atomic composition of the sample can be retrieved.
For the optimal collection of LIBS spectra, it is necessary to optimize the delay between the laser pulse and the spectrum recording (gated LIBS measurements) in order to avoid the high-temperature and broad emission plasma (i.e., black body or continuum emission) generally present in the first microsecond after the impact of the laser on the sample. The LIBS spectrum is made up of discrete and narrow atomic lines. Another parameter is the laser intensity (W·m−2) which should be high enough to create a plasma on the surface of the material.
Different LIBS systems are commercially available: modular systems for laboratory and industrial applications; and portable devices for in-situ applications.
LIBS industrial applications
Although LIBS can be used for the compositional analysis of many gases, liquids, aerosols, powders and solid bulk materials, its first industrial use was for fast and low-cost heavy metal detection in order to improve the value of the output product, mainly in recycling processes. An overview of industrial applications of LIBS and especially on development from 2014–2018 has been published (Noll et al., 2018) addressing recent R&D activities in the field of automated LIBS: (a) combined use of in-line measured three-dimensional (3D) geometry information and LIBS analyses for high-speed sorting tasks of piece goods; (b) sorting of refractories; (c) identification of steel blooms in a rolling mill, and, as we will see later for the plastics case; and (d) inverse production application for the recovery of valuable materials from EoL electronic equipment. Also, other works on automated methods have been extensively reported (Connemann et al., 2016; Rosenwasser et al., 2001; Rzecki et al., 2018; Ukwatta et al., 2012). Finally, LIBS-based imaging has promising applications in biology, medicine and geology (Jolivet et al., 2019). Thanks to the recent advances in laser, optics and detector miniaturization, portable systems are now widely used in the industry.
However, these portable systems are not suitable for in-line processes with moving conveyor belts as they require to be in contact with the sample and the analysis can take several seconds. Being expressly dedicated to metal detection, the core of the commercial software is usually not easily accessible and data cannot be obtained if the sample has not been detected as a metal. Finally, most of the handheld systems can only detect in the visible range whereas in some cases, the useful information is beyond this range (i.e., plastics). Figure 8 shows some examples of LIBS systems integrated with conveyor lines and used for the detection in real time of precious metals or minerals in mining industries.
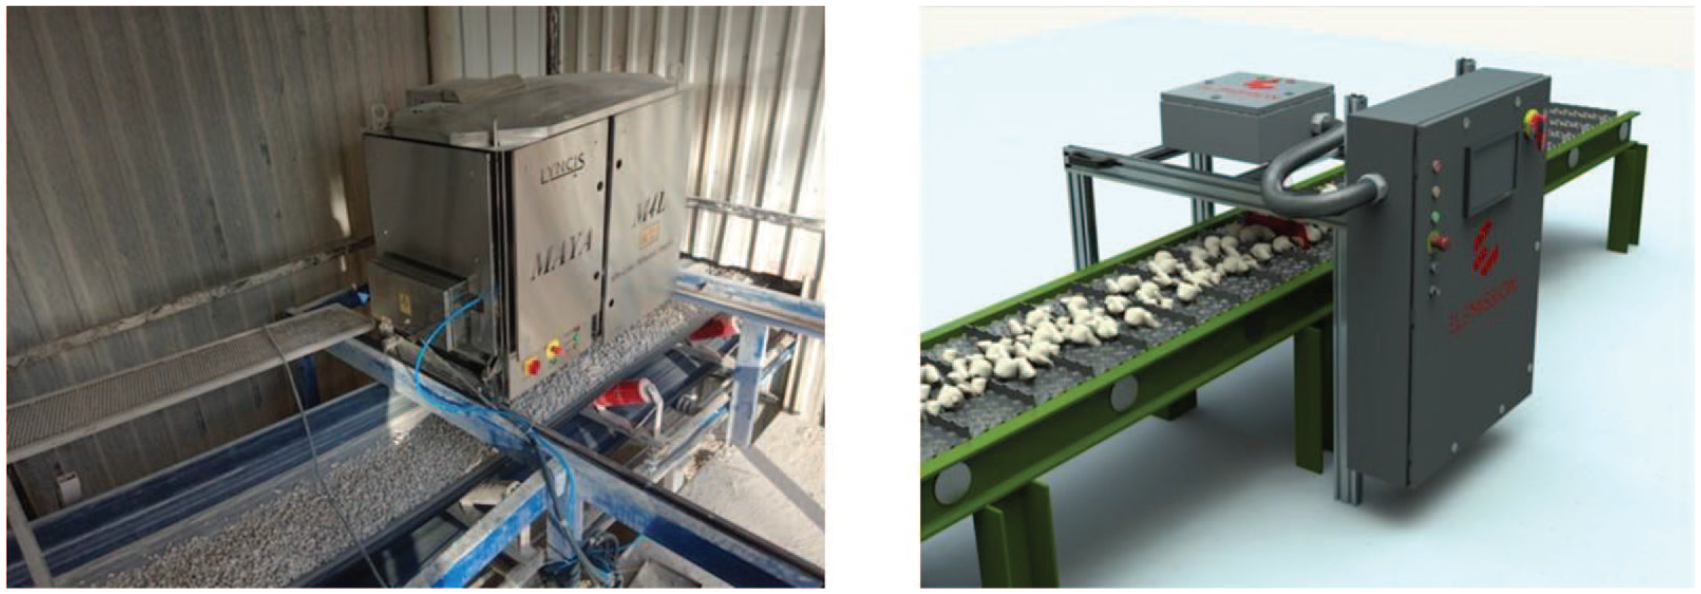
Commercial in-line laser-induced breakdown spectroscopy systems integrated on a conveyor belt and dedicated to the real time detection and sorting of material elemental composition for mining and mineral industries.
LIBS applications in analysis of plastics
Recent research on LIBS for the sorting of waste of electrical and electronic equipment (WEEE), opens some perspectives to generate data on the composition of WEEE in a fast and reliable manner, in order to support recycling procedures. Further studies show the ability of LIBS to identify polymers such as polyoxymethylene, PVC, polytetrafluoroethylene, polyoxyethylene, PA, PE and PP for the aliphatic ones, and ABS, PET, PS, and PC for aromatic ones (Anzano et al., 2011; Costa et al., 2017, 2018; Grégoire et al., 2011; Huber et al., 2014; Shameem et al., 2017; Trautner et al., 2017).
The application of LIBS to the analysis of plastics has recently been reviewed (Liu et al., 2019). The identification of plastics has been studied (Lasheras et al., 2010), and with respect to plastics in WEEE (Costa et al., 2017) based on spectral lines of oxygen, carbon, and hydrogen. However, using elemental lines of bromine, chlorine, silicon or carbon, LIBS has also been used for the analysis of flame retarded plastics (Stepputat and Noll, 2003; Wagner et al., 2018), for chlorinated plastics (Huber et al., 2014) and also for fibre-reinforced plastics (Ledesma et al., 2019). In terms of plastics discrimination using LIBS, organic components show a very similar chemical composition based on cyano groups, carbon–carbon bonds and carbon, hydrogen, oxygen and nitrogen atoms. Furthermore, the analysis of organic materials in air is a particular challenge for LIBS as hydrogen strong lines appear, which originate, however, often from the humidity in air or absorbed moisture at the sample surface, while for oxygen and nitrogen the lines originate mainly from the air. Therefore, the use of powerful chemometric tools (sometimes also combined with inert atmosphere) often give an advantage and provide a solution to this problem.
A review of the research progress of chemometrics methods in LIBS for the pre-processing of spectral data as well as for qualitative and quantitative analysis from 2012–2016 has been published (Zhang et al., 2018). The reader is invited to consult the latter reference that gives an exhaustive review of the several strategies conducted to identify and classify plastics based on either the determination of the relevant emission lines ratio or the use of chemometrics methods and advanced data analysis.
Beyond the simple use of LIBS, Shameem et al. (2017) present an elegant combination of LIBS, Raman and chemometrics tools in order to classify post-consumer plastics (PET, PE, PP and PS) regardless of their colour. While LIBS, providing atomic elemental information, works better for coloured plastics (including black plastics), Raman, providing molecular information, works better for transparent plastics. Post-consumer recycled (PCR) plastics are often dirty, making the detection quite challenging. Nevertheless, the LIBS technique can address this issue by the use of a double-pulse laser (Gottfried et al., 2007; Viskup et al., 2010). The first laser pulse cleans a small area on the surface of the sample and a second laser pulse comes immediately after, on the same area, thus analysing a fresh portion of the sample. Beyond the fact that the analysis occurs on a clean surface, the LIBS signal intensity is usually enhanced when compared to single-pulse measurements.
XRFS
XRFS background
The XRFS is a high-energy spectroscopy providing information about the elemental composition of the target sample by analysing the X-ray radiation emitted (fluorescence) after the interaction between the incident X-ray radiation (λ = 10-3 nm to 10 nm) and the target material.
The X-ray fluorescence (XRF) is characteristic for each element and specific for each electronic transition. Hence, by measuring this radiation it is possible to determine the elemental composition of the material under study. This technique is mainly applied for the detection and sorting of ferrous and non-ferrous metals, rocks and glass. However, it has also been used for the separation of certain plastics such as coloured PVC and brominated plastics (Weiss, 2011).
The photons emitted during XRF can be detected and quantified using wavelength (WD-XRFS) or energy dispersive spectroscopies (ED-XRFS). WD-XRFS detects and measures the wavelength of the emitted photons using crystal diffraction so that one single characteristic wavelength is measured at a time. As a consequence, WD-XRFS has a higher resolution than ED-XRFS (Weiss, 2011).
The XRF has developed into a well-established multi-elemental analysis technique with a very wide field of practical applications including novel low-power micro-focus tubes, novel X-ray optics and detectors, as well as simplified access to synchrotron radiation, that have made it possible to extend XRF to low Z elements and to obtain 2D and 3D information from a sample on a micrometre-scale (Beckhoff et al., 2006). The work of these authors has led to the development of XRF instruments capable of high spatial resolution analysis, the new field being denominated as XRF microscopy.
XRF instrumentation, sampling and data analysis
The ED-XRFS and WD-XRFS present an enormous variety of different configurations in sources, optics and detector technologies. Portable and benchtop instruments are commercially available (e.g., BRUKER, HORIBA, SPECTRO, THERMO, OLYMPUS, ANALYTICON, etc.). They can operate under full vacuum conditions and can accommodate large detectors and high voltage X-ray tubes. Portable XRF spectrometers are smaller, lighter, cheaper and their operation and maintenance require less technical expertise. They can be ideal for field applications where in-situ chemical screening is essential, such as environmental toxicity studies and industrial quality control applications.
When it comes to sample preparation, benchtop instruments need samples to be prepared properly, including in some cases extra pre-processing such as milling or filling into sealed cuvettes. Handheld devices can be applied directly to relatively flat sample surfaces; however, special care needs to be taken to avoid reflectance of X-rays or related fluorescence radiation. In the case of machines integrated in-line, samples are provided on conveyor belts and do not require specific treatment.
Different approaches can be taken to XRF data analysis. XRF raw data represent the number of counts of element-specific fluorescent X-ray energies received in an XRF instrument detector and these are considered as qualitative data. The spectrum shows peaks where the fluorescence of a specific element was detected. Finally, it is also possible to directly compare the spectral data from different samples in order to obtain information with respect to the relative concentrations of the elements from sample to sample as a semi-quantitative data processing approach (Bruker, 2020).
XRF industrial applications
The XRF technology is the gold-standard for accurate, non-destructive elemental analytical techniques in a wide range of industrial applications including cement, metals (steel), mining, petroleum, chemicals and food, primarily in quality control.
As application examples in the food industry, we can highlight quality analysis at critical control points of raw materials, semi-elaborated and finished products, hazardous analysis at critical control points for adulterant and metallic contaminant identification, and food content analysis for fortifiers such as iron and calcium in liquid and powder milk.
When spatial resolution matters, XRF microscopy has been applied to sectors such as pharmaceutical or forensic analysis, electronics, archaeology, metallurgy, chemistry, biology, medicine, space exploration or art conservation.
Chemical distribution of the components in pharmaceutical formulations can be directly observed with the HSI capabilities of ED-XRF microscopy. Dispersion of the active pharmaceutical ingredient is of vital importance to the performance of the final drug product (Clarke et al., 2005). XRF microscopy is also applicable to many microscopic particles and fragments of evidence often found in forensic science, such as gun-shot residue, glass fragments or paints.
XRF applications in analysis of plastics
The XRF technique is useful for qualitative and quantitative analysis of inorganic materials, metals and inorganic or halogen-containing additives in polymers. Therefore, XRF can be used both as a: (a) process control tool to evaluate the presence of these agents in the finished product; and (b) sorting tool for the process of plastics’ recycling.
European and other countries are enforcing regulations for monitoring the level of hazardous substances in the manufacture, recycling and destruction of products including plastics, to prevent the release of hazardous toxins into the environment. European WEEE and Restriction of Hazardous Substances regulations have established the highest tolerable limit for certain metals, specifically lead (Pb), cadmium (Cd), mercury (Hg), chromium (Cr) and halogens like bromine (Br). For the given ranges specified in these regulations, XRF seems to be an appropriate solution for its determination (Bonvin, 2015).
As application examples, XRF allows to identify Cl in PVC, flame retardants (Br, Sb and P), or regulated heavy metals (Pb, Hg and Cd) in EoL products (Riise et al., 2000; Schlummer et al., 2015). Although, chemical analysis and IR spectroscopy techniques can be used to determine the type of plastic with reasonable certainty, these techniques are less useful when looking for additives.
As with LIBS, XRF can be used to identify aluminium (Al)-layers in multi-layered packaging, silicon in glass fibre-reinforced plastics, and has no difficulties with black plastics. However, as XRF does not provide information on polymer types, a combined sorting routine with MIR, NIR or THz is currently under evaluation.
Application strategies of photonic technologies in recycling of plastics
General strategies
Different photonic technologies among those previously described play a substantial role in advanced polymer recycling (van Engelshoven et al., 2019) but applications differ in terms of target characteristic, sorting strategy and position in the value chain.
Molecular spectroscopy is mainly applied to identify the polymer composition of the investigated materials, atomic spectroscopy aims at identification of typical elements that indicate a specific polymer (Cl for PVC, (Huber et al., 2014)), a specific group of additives (Br for brominated flame retardants (Aldrian et al., 2015; Wagner et al., 2018)) or specific metals applied in composite materials (Al in multi-layered packaging, Ni, Cu and Cr for metal coated plastic composites).
When photonic technologies are applied to sorting, an identification is linked to a separation decision. In this sense, positive sorting is applied when the material of a sample, drawn from the sorter’s input, is identified as the target material. Target materials will be found in the take-out fraction. Negative sorting separates items from the input stream, if photonic information is not in line with the expected characteristic of the target material. In this case, target materials are enriched in the unsorted fraction.
In this way, the process through which the separation decision is put into practice is also important for the overall sorting strategy. Furthermore, it is important to know if the sorting is performed at the beginning of the recycling process or at its end.
Possible application in manual sorting and optional dismantling
The easiest strategy is the use of handheld (or portable) operating spectrometers (which as previously seen to exist in a number of spectral ranges) that are applied to larger plastics parts in the course of manual dismantling. According to the photonic result, the user or a software decides to collect this specific item in the target fraction or assign it as a reject. The failure rate of such a sorting only depends on the quality of the photonic measurement or the correctness of identification. As dismantling is obviously at the beginning of a recycling line, sorted fractions may not be pure enough for direct re-melting, since the items are still too big and may not be completely dismantled. Thus, residual adhesives, labels, screws or other composite materials may still affect the purity of the stream and require an efficient post-treatment like washing, magnetic/non-magnetic material sorters, etc.
Manual dismantling is mainly applied for large and complex products such as ELV or WEEE. It is important to mention that dismantling is, in general, not considered for plastics’ recycling, mainly because it is rather targeting other more valuable raw materials or sorts-out critical components. However, it could increase in line with eco-designed initiatives facilitating this step.
Two approaches are followed in general: (a) sorting of plastics parts by polymer type, mostly by molecular spectrometers in, for example, NIR, MIR ranges or others; or (b) identification of disturbing materials such as brominated flame retardants, metals, fillers or chlorinated polymers. In these cases, atomic spectroscopy is used, with devices such as portable XRF or LIBS. In both cases, dismantling targets (i.e., 5 minutes per dismantling of a WEEE item) are decisive for applicability of handheld instruments. Measurement time is expected to be below 30–60 seconds, in order not to perturb the overall dismantling rate. Such fast-screening analysis can be done with handheld instruments but requires trained staff, suitable equipment and efficient decision support software. The latter translates analytical results (85% agreement of MIR spectrum with PE or 3000 parts per million (ppm) Br in solution) into a clear indication of whether to sort a plastic part in a specific polymer fraction or to reject it. With respect to molecular spectroscopy, well equipped data bases of relevant polymer spectra are required, whereas for atomic spectroscopy the handheld items need to provide suitable limits of detection. With respect to bromine as an indicator for brominated flame retardants, this might be even below 50 ppm if hexabromocyclododecane waste streams are considered. A special sample pre-treatment was proposed (Schlummer et al., 2015) to enable distinguishing between extractable and non-extractable polymeric flame-retardant additives.
Examples for industrial application of these technologies are only seldom reported in the scientific literature – one example is Arends et al. (2015). Other examples which describe the separation of bromine containing expanded polystyrene materials from bromine free items, actually refer to the separation of brominated flame retarded housing plastics from electronic devices (Arends et al., 2015; Schlummer et al., 2015; Wagner et al., 2018), all using handheld instruments of molecular analysis (e.g., XRF). Such reports describe the successful application of photonic separation methods on industrial scale dismantled plastics performed by R&D teams. Mostly, down-stream treatment is not performed by the dismantling company but by plastic recycling experts. Subsequent, state-of-the-art operations to shred and clean the sorted plastics are essential for the quality of PCR materials and thus, success of such a recycling chain only partly depends on photonic technologies.
Application in automated plastic sorting
If spectroscopy is applied in automated sorting, separation is performed by air nozzles that blow-out particles from the feed stream, which has previously been subjected to size reduction processes. As recently reported (Maisel et al., 2020), the particle size of such processes is decisive for the sorting outcome. Nevertheless, failures in automated sorting may occur by incorrect identification but also if the air nozzle emits more than the targeted items or if a blown-out particle hits another one, which is then falsely separated. Therefore, automated sampling often combines positive and negative sorting, with positive sorting enriching the target polymers in the eject fraction and then negative sorting applied on this sorted fraction further cleans the sorting by separating all particles which are not the target polymer.
The position in the value chain is further relevant for automated sorting strategies. Applied to mixed shredded plastics, sorting will, in the first place, enrich the collection of a target polymer from around 20–30% to a purity of 80–90%, as the probability of miss-sorting of a wrong single particle into the target fraction is higher compared to better enriched feedstocks. Since the sorted fraction will not be pure, it does not make sense to apply too strict sorting parameters, in order not to lose target material in the rejected fraction. If, however, automated sorting is applied at the end of a recycling process cascade, purity rather than yield is decisive. In this case, strict negative sorting is applied, rejecting every particle not showing the typical photonic pattern of the target material. This often leads to an over-sorting effect, for example, 5% wt. of the feed is rejected with only 3–4% of the material being off-specification. Another issue of the position in the value chain is the particle size, especially if photonic sorting is combined with other processes such as density separation or washing procedures (Maisel et al., 2020).
Automated sorting applies to waste streams that have undergone a pre-treatment to define a specific particle-size range. With respect to packaging, this is mainly achieved by rotating sieves and wind sifters defining an input particle size between 3 mm and 20 cm by 30 cm items. With respect to WEEE and ELV plastics deliberated from other materials by shredders and supplied to sorting machines as a shred, typical sizes below 5–50 mm, and preferably between 10 and 20 mm are obtained (Maisel et al., 2020).
In automated sorting, infeed materials are provided on conveyer belts and detected via photonic spectrometers. Detection results are computed and govern air nozzles that blow out specific particles from the infeed stream. For plastic recycling, automated sorters need to manage suitable amounts of waste (0.14–0.83 kg·s−1) which translate into conveyer belt speed of several m·s−1, depending on the thickness of the items. Such belt speeds will therefore require spectrometers with higher scanning speeds. For example, a detection of 20 mm plastic particles with five scans per item on a belt moving at 0.2 m·s−1 translates into a scan time of 2 milliseconds. Furthermore, a precise and equally fast control of particle positions and fast acting air nozzles are required. As previously outlined, recyclers apply positive and negative sorting and non-identified fractions may be circulated several times to increase the ability to identify them, which also depends on the instrument (the repetition increases the probability). Negative sorting activates air nozzles if no target spectrum is monitored for a given particle. However, in order not to waste compressed air and related energy, a software is necessary which compensates for the spectra produced by the material coming from the feedstock.
Photonic applications to PCR plastics
Among the photonic technologies previously described, molecular/vibrational spectroscopies are the most versatile and reliable techniques for the discrimination, classification and sorting of plastics. Nevertheless, as discussed before, not all of these techniques can be easily implemented in industrial configurations, for example, due to the need to have a direct contact between the sample and the spectrometer in some cases. While the previous review of the single photonic technologies mainly reported their use in academic studies using model samples, there are also additional challenges discussed below when deploying them in industrial environments on actual post-consumer waste streams, for example, due to contamination or degradation.
The NIR, NIR-HSI and FTIR spectroscopies have shown that it is feasible to discriminate between pure and post-consumer resins by analysing their spectral features. Since both photonic techniques provide information of their molecular composition and structure, the minimal change in one of them is translated in a modification in their spectral fingerprint. Degradation of resins coming from post-consumer waste can occur by diverse factors such as temperature, exposure to the environmental elements and microorganisms, among others. This can cause consequent alterations in their polymeric structure, more specifically in the stretching regions of C=C and C–H bonds (Beigbeder et al., 2013; Hadi et al., 2014; Moroni et al., 2015; Raut et al., 2019; Signoret et al., 2019). In this regard, vibrational spectroscopies such as NIR or NIR-HSI are nowadays the main photonic techniques implemented at industrial scale for the sorting of plastic waste streams. These techniques would potentially be used as a reliable tool to evaluate the degree of degradation of the resins entering to the recycling process, and hence their future in the circular value chain of plastics (Serranti and Bonifazi, 2010; Serranti et al., 2011). Nevertheless, although the discrimination among virgin and post-consumer resins can be conducted using these photonic techniques, they are currently used only for the discrimination and/or sorting of plastics considering the polymer identity as the main discriminating factor (van Engelshoven et al., 2019).
Strategies where a pre-sorting is made on the full plastic item with several sorting loops to maximize the detection capacity and a final finer sorting is made on flakes, make it possible to handle the challenges related to the presence of food residues or other organic dirt on the PCR which also have a fingerprint in the NIR region.
Automated sorting of plastics (and other materials) from EoL packaging represent a highly developed application area. NIR is applied mainly to 3D plastic fractions that have been previously separated from ferrous and non-ferrous metals, beverage cartons and aluminium, providing PE, PP, PS and PET fractions. More recently, application of NIR is reported for separation of packaging films, mainly in order to separate PE from PP. All of these applications have in common that purity of sorted fractions does not allow a direct re-melting. Therefore, fractions are transported to specialized plastic recycling companies performing further shredding, washing and even another sorting on flakes. After this downstream treatment, reasonable qualities of PCR materials can be produced by re-compounding, melt filtration and deodorization (Strangl et al., 2019).
In Germany, PET bottle to bottle recycling is a special case of packaging recycling as it depends on a refund-based collection of PET bottles and a subsequent so-called “super clean” recycling process. Part of the PET recycling chain is an automated NIR or laser-based sorting of shredded and washed PET flakes targeting a negative sorting of non-PET materials from the bulk input (van Velzen et al., 2020; Welle, 2014).
A study from the Waste and Resources Action Programme, UK, charity, compares the efficiency of different industrial sorting solutions for separating different polymers contained in mixed waste plastics generally returning efficiency between 70 and 95%. A more recent study by the company TOMRA highlights how subsequent sorting-steps allow for PCR purity to be sequentially improved from 67% at the exit of sorting plants to close to 99% for rigid PP after flake sorting. It is therefore clear that the use of NIR is a key enabler for the recovered materials to be usable without significant downgrading. The same study also reports the initial purity of pre-sorted PE film streams at around 65%, but not the final achieved purity of resulting flakes. However, it is expected to be lower than rigid PP due to the greater difficulty to sort flexible packaging and the proportion of multi-materials films in this stream. While no study could be found at an industrial level on the use of photonic techniques (NIR-HSI or combinations of different techniques) to sort multi-layered films, they would also support a better valorization of PCR as experienced for mono-materials in the recent years.
With respect to recycling of plastics from WEEE, automated sensor-based sorting is starting to be implemented. In contrast to packaging, black plastic items are an important issue here (Turner, 2018) since reflectance spectroscopy is limited due to the absorption of black particles. Laser-based spectroscopy may help to overcome this issue and is currently implemented in WEEE recycling targeting at high value engineering plastics such as PC/ABS. Another serious issue of WEEE plastics is the presence of brominated flame retardants. As an effective sorting tool, LIBS and XRFS have been proposed, with XRFS being implemented at industrial scale already (personal communication).
Commercial solutions for monitoring and/or sorting plastics using photonic techniques
In the plastics’ recycling industry, sorting is a crucial step in order to recover polymers of high quality. Sorting should be performed quickly in order to generate high throughputs resulting in economic profits (Al-Salem et al., 2009). Some companies currently offer industrial equipment for the sorting of plastic waste, based on different spectroscopic approaches. These companies are generally integrators which use the spectrometric devices previously discussed that are obtained from external suppliers. Their techniques are mainly based on NIR spectroscopy which is most used for plastic sorting generally in single point configuration or cascades thereof. NIR-HSI is more expensive and generally limited to more complex composition monitoring such as plastic flakes. In recent years, MIR has been emerging commercially for sorting of black plastics. XRF is also commercially available with a main goal to sort non-plastics phases or contaminants. THz and LIBS are also commercially available although no industrial use has yet been identified in mainstream polymer sorting.
Next, we briefly describe the capabilities and technology of the equipment offered by the following mentioned companies (BÜHLER, CIMBRIA, PICVISA, REDWAVE, SENSE2SORT, SESOTEC, STEINERT and TOMRA):
BÜHLER is a Swiss company dedicated to plant equipment and related services for processing foods and manufacturing advanced materials. BÜHLER offers the SORTEX E, an equipment designed for the sorting of plastic waste coming from packaging (PET and HPDE), construction (uPVC) and WEEE/ELV. The SORTEX is available in different versions (SORTEX A, SORTEX B, SORTEX E POLYVISION) depending on its mainstream capacity and sorting capabilities. The sorting technology is based on Vis-NIR spectroscopy and HSI.
CIMBRIA is a Danish company that develops and manufactures a wide range of optical sorters for diverse applications and type of products (i.e., cleaning seeds, grains, food commodities and industrial products). SEA is a line of optical sorters (i.e., SEA-NEXT and SEA-HYPERSORT) that can sort ground plastics, flakes or granules based on differences in colour, opacity and transparency. CIMBRIA equipment can sort PVC, PET, HDPE, WEEE, coloured plastics, car scraps, etc. SEA sorters use InGaAs technology for the Vis-NIR region, as well as the HSI option for some applications.
PICVISA, a Spanish company, provides industrial solutions based on image processing and machine vision. They develop sorting equipment for recycling materials. ECOGLASS and ECOPACK are two of the sorting machines they have on the market for the sorting of glass and plastics, respectively. ECOPACK uses Vis-NIR technology for the sorting of plastic waste and is able to sort rigid packages of PET, HDPE, PP, PS, PVC, EPS, ABS.
REDWAVE, a division of BT-Wolfgang Binder GmbH, is located in Austria. REDWAVE is also the name of its optical sorters line (i.e., REDWAVE NIR, REDWAVE XRF). The REDWAVE sorters can be used for the sorting of glass, plastics and films (PET, HDPE, LDPE, PP, etc.), scrap metals, paper, WEEE, wood, etc. They can sort solid plastics and films, as well as bio-degradable plastics, using Vis-NIR and XRFS.
SENSE2SORT, a company with headquarters in the United States, in alliance with the Spanish company TORATECNICA SL, focuses on the development of sorting equipment for recycling applications. This company offers three different sorting machines: XRF-SENSE; LIBS-SENSE; and TERA-SENSE. The first two use XRFS and LIBS for the sorting of metallic materials whereas TERA-SENSE machines sort waste plastics by specific content such as ABS, PA, HIPS, PP, PE, PET, PVC, etc. This is also possible with black plastics.
SESOTEC, headquartered in Germany, develops high-tech systems for contaminant detection and materials sorting. VARISORT is a piece of equipment designed by the company for the sorting of different kind of materials, such as glass, plastic, scrap metal and WEEE. SESOTEC’s sorting systems enable the combination of up to three sensors for detecting contaminants: a colour and shape sensor; a metal sensor; and a NIR sensor that distinguishes between different types of materials.
STEINERT is a German company that has developed equipment for the sorting of a wide range of solid waste, including metal and plastics. UNISORT is an equipment line (i.e., UNISORT-PR and UNISORT-BLACKEYE) for the sorting of a wide variety of plastics waste coming from packaging, motor vehicle, household, construction and other industries. STEINERT sorting systems generally use NIR and HSI technologies but the specific UNISORT-BLACKEYE system can sort black and dark plastics by type using MIR.
TOMRA, is a Norwegian multinational corporation active in the manufacturing of advanced collection and sorting solutions for resource optimization. The company is the largest reverse vending machine, and a leading supplier of sensor-based sorting solutions for the food, recycling and mining industries.
Comparison of the different photonic technologies’ suitability for identifying waste plastics
Based on the previous sections of the paper, Table 2 summarizes the comparative assessment on the main characteristics of each technique, as well as their performance for black plastics and plastic packaging analysis.
Comparative summary of considered optical techniques and their performance in plastic identification (“black plastics” refers to carbon black or carbon fibre-containing plastics).
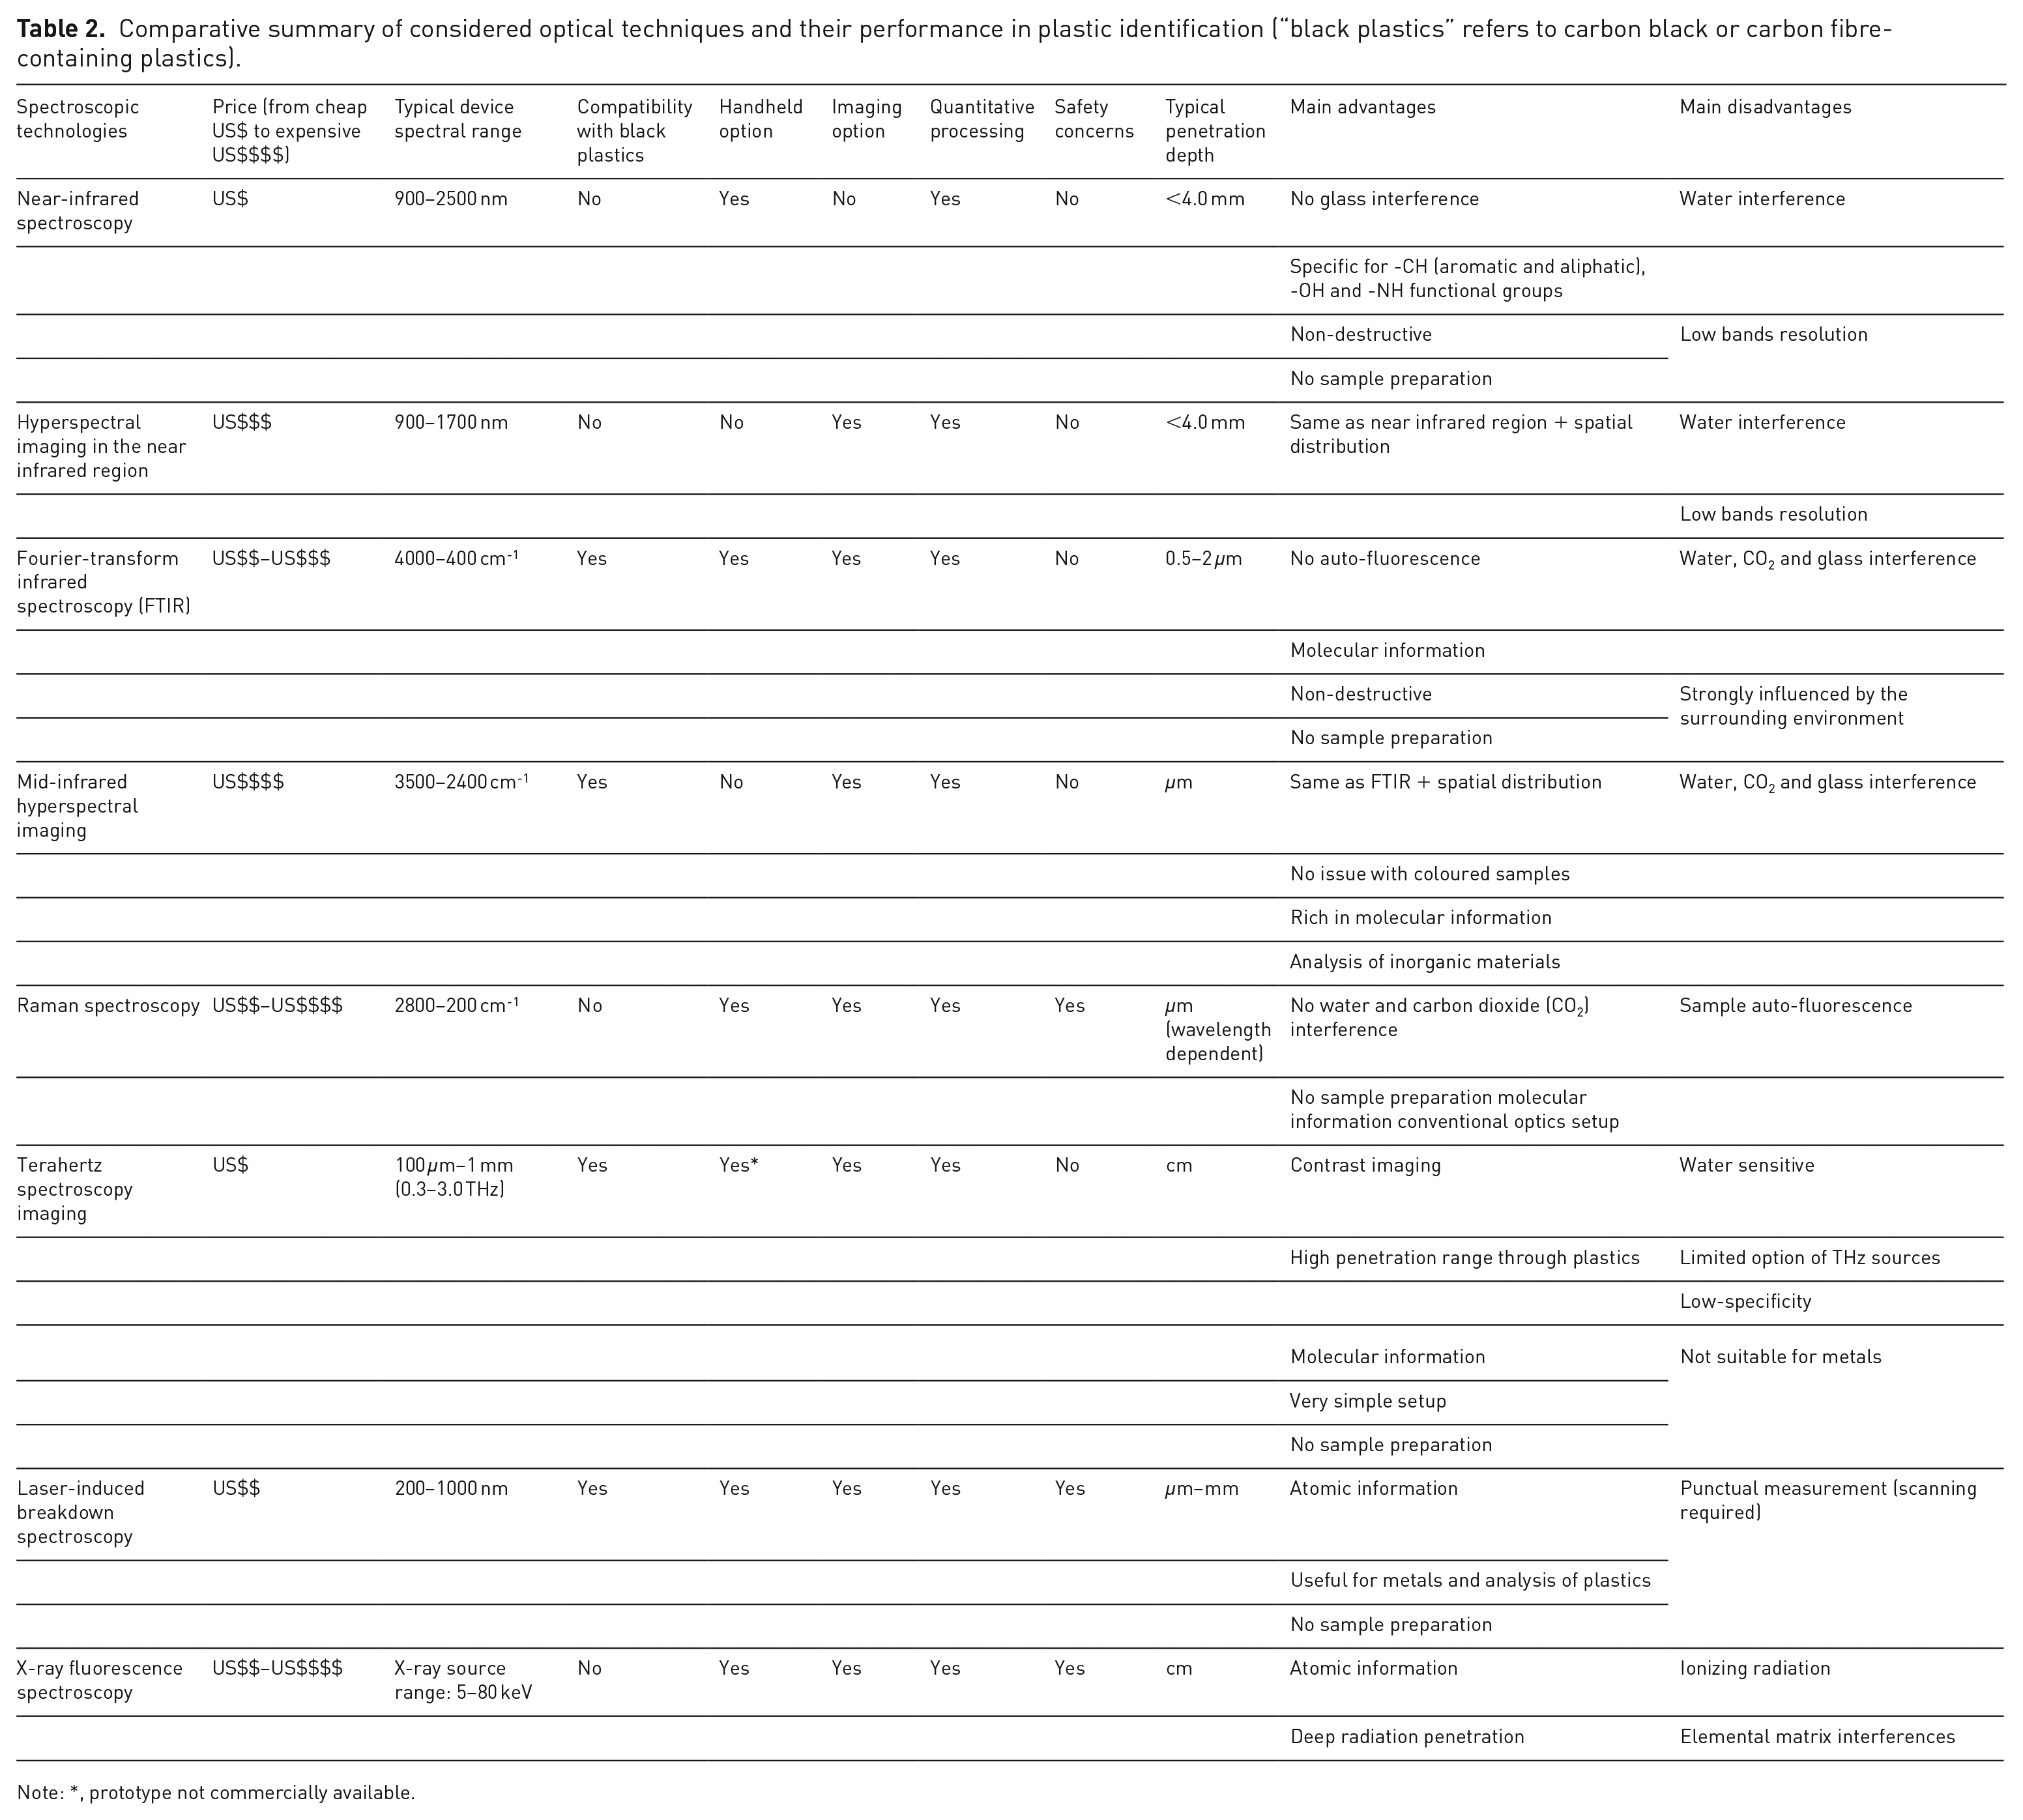
Note: *, prototype not commercially available.
Conclusions
This review has presented the different features of the main photonic technologies suitable for the analysis of plastics. In particular, insights were obtained from the academic literature which reference specific spectroscopic techniques for more complex materials identification. While a number of studies have been identified, not all techniques used are suitable for in-line implementation in a sorting facility. Likewise, limited research has been found related to the automatic identification of fibre reinforcements in composites. All in all, there is no single technology that can identify all the materials of interest used in carbon black and/or carbon fibre-reinforced plastics as well as other composites materials and multi-layered packaging (e.g., paper, polymers, aluminium, etc.) and even less when assembled in composite structures.
Further improvements in the classification of materials have been reported thanks to the use of more advanced data processing approaches of the obtained spectra beyond classical chemometrics. It is reported that machine learning can help towards the goal of identifying multi-layer polymers when the spectral data from different layers blend together (as in HSI). Machine learning models can leverage on LDA models when noise, ambiguity or stochastic behaviour are present in the data.
Finally, while different sorting solutions, which are already in the market, use optical sensors, most of those used for PCR are based on Vis-NIR technologies which are not suitable for black plastics. Emerging solutions that can bridge this gap have also been reported, proposing for example MIR, LIBS or THz technologies. The ability to identify the composition of multi-layered films is also not generally established industrially. NIR-HSI can however detect bi-layered polymer films according to the literature reviewed, but it would need to be complemented for by other techniques for metallic layers.
With the emergence of new solutions to recycle such materials, it is important to intensify the research on more versatile waste composition monitoring and/or sorting solutions, which may require combining different photonic techniques and advanced data treatment. Indeed, novel recycling methods such as selective polymer dissolution can recycle multi-layered films or composites without preliminary separation of pure fractions. Nevertheless, even for such processes tolerant to blends of materials and/or multi-materials, having a clear understanding of the batch-to-batch input composition will give a significant advantage for the optimal configuration of multistep fibre and polymer recovery processes.
Footnotes
Declaration of conflicting interests
The authors declared no potential conflicts of interest with respect to the research, authorship, and/or publication of this article.
Funding
The authors disclosed receipt of the following financial support for the research, authorship, and/or publication of this article: This article has been written in the frame of the MULTICYCLE project receiving funding from the European Union’s Horizon 2020 research and innovation programme under Grant Agreement Number: 820695. For more information, refer to ![]() . The authors also wish to acknowledge the support from ISWA in terms of the publishing fees.
. The authors also wish to acknowledge the support from ISWA in terms of the publishing fees.