
Abstract
Oil-based mud (OBM) waste from the oil and gas exploration industry can be valorised to tailor-made reclaimed clay-reinforced low-density polyethylene (LDPE) nanocomposites. This study aims to fill the information gap in the literature and to provide opportunities to explore the effective recovery and recycling techniques of the resources present in the OBM waste stream. Elemental analysis using inductively coupled plasma–optical emission spectrometry (ICP-OES) and X-ray fluorescence analysis, chemical structural analysis by Fourier transform infrared (FTIR) spectroscopy, and morphological analysis of LDPE/organo-modified montmorillonite (LDPE/MMT) and LDPE/OBM slurry nanocomposites by scanning electron microscopy (SEM) have been conducted. Further analysis including calorimetry, thermogravimetry, spectroscopy, microscopy, energy dispersive X-ray analysis and X-ray diffraction (XRD) was carried out to evaluate the thermo-chemical characteristics of OBM waste and OBM clay-reinforced LDPE nanocomposites, confirming the presence of different clay minerals including inorganic salts in OBM slurry powder. The microscopic analysis revealed that the distance between polymer matrix and OBM slurry filler is less than that of MMT, which suggests better interfacial adhesion of OBM slurry compared with the adhesion between MMT and LDPE matrix. This was also confirmed by XRD analysis, which showed the superior delamination structure OBM slurry compared with the structure of MMT. There is a trend noticeable for both of these fillers that the nanocomposites with higher percentage filler contents (7.5 and 10.0 wt% in this case) were indicated to act as a thermal conductive material. The heat capacity values of nanocomposites decreased about 33% in LDPE with 7.5 wt% MMT and about 17% in LDPE with 10.0 wt% OBM slurry. It was also noted, for both nanocomposites, that the residue remaining after 1000°C increases with the incremental wt% of fillers in the nanocomposites. There is a big difference in residue amount (in %) left after thermogravimetric analysis in the two nanocomposites, indicating that OBM slurry may have significant influence in decomposing LDPE matrix; this might be an interesting area to explore in the future. The results provide insight and opportunity to manufacture waste-derived renewable nanocomposites with enhanced structural and thermal properties.
Keywords
Introduction
Sustainable waste management in oil and gas industries represents the rational recovery or uses of resources, ensuring health and safety and thus improvement of life quality, protection of eco-systems, and conversion of waste into valuable products (Binnemans et al., 2015; Colborn et al., 2011; Elektorowicz and Habibi, 2005; Maloney and Yoxtheimer, 2012). Spent drilling fluids, also known as oil-based mud (OBM), are one of the main sources of waste stream in the oil and gas industry (Hickenbottom et al., 2013; Ismail et al., 2017; Onwukwe and Nwakaudu, 2012; Susich and Schwenne, 2004). Drilling fluid is an essential part of the drilling operation in oil and gas exploration, performing several functions such as removing and cleaning drill cuttings from the downhole, cooling and lubricating the drill bit, and controlling the hydraulic pressure to protect well blowouts (Caenn et al., 2011; Fink, 2015; Khodja et al., 2010). OBM is environmentally hazardous, but due to its special features such as reliable shale inhibition and excellent lubricity, it is still an essential part of deep drilling in oil and gas exploration industries (Gholami et al., 2018; Liu et al., 2004; Zhong et al., 2011). This deep drilling operation intensifies the addition of pollutants in OBM, which is considered a great concern for different stakeholders including spent OBM waste treatment services, local authorities, environmental activists, and regulators involved in running waste framework directives (Veil, 2002 and Force, 2009).
To protect the environment and to recycle or recover the useful compounds associated with this waste stream, different techniques have been applied in drilling fluid waste treatment operation, including solidification technology (Tuncan et al., 2000), solid–liquid separation technology (Zou et al., 2011), mud transform to cement technology (Nahm and Wyant, 1993), incineration technology (Onwukwe and Nwakaudu, 2012), and some other thermo-mechanical treatments (Mokhalalati et al., 2000). These processes have certain advantages and disadvantages with respect to operational or treatment time, cost, space requirement, and treatment efficiency. These processes are successful in protecting the environment to some extent, but the detrimental effects of this waste on the environment are common and increasing in level of concern (Cranford and Gordon, 1991; Ball et al., 2012). The management of OBM waste is an important issue, as most of the hazardous chemicals associated with OBM waste exist in solid form and are disposed of in landfill sites (Hainey et al., 1999; Walter et al., 2012). Of interest, this OBM waste contains significant amounts of clay minerals and metals, which makes the use of this waste attractive in engineering polymeric nanocomposites applications (Siddique et al., 2019a, 2019b).
An in-depth qualitative analysis of petroleum sludge was performed by Andrade et al. (2009). The key findings from the study, using scanning electron microscopy (SEM) analysis, confirmed the presence of irregular sizes of dry oily petroleum sludge. Moreover, the study also highlighted smaller sized layered platelets, which were attributed to bentonite clay. The larger particles in dry oily petroleum sludge are suggested to be barite, calcite, sandstone, and quartz, which were demonstrated by the findings from other studies, performed by Wang et al. (2012) and Bin Merdhah (2010). Another research group presented different minerals content in petroleum sludge by X-ray diffraction (XRD) and attenuated total reflectance–Fourier transform infrared (ATR-FTIR) analysis. The XRD pattern in that study, at certain peaks at 2-theta data, confirmed the presence of barite (2θ = 26.2°(26°), 29.1°(29°), 31.9°, and 43.5°), quartz (2θ = 21.5°, 23°, and 26.0°), zinc oxide (30–40°), montmorillonite (MMT) (6°, 9°, 12°, 14°, 18°, 27°, 30°, 61°), bentonite (6°, 9°, 12°, 14.8°, 18°, 27°, 30°, 61°), magnetite oxide (35.5°), and calcite (29.6°, 39°). In addition, the band peaks at 1166 cm−1 in their ATR-FTIR study also confirmed the presence of Si-O stretching of quartz, and the spectra bands at 1124 cm−1 and 1014 cm−1 highlighted the presence of MMT (Pendleton, 2014).
Several research groups have reported the thermal stability behaviour of polyethylene clay nanocomposites. Xie et al. (2012) have reported the thermal stability by analysing the thermogravimetric analysis (TGA) curves (under a nitrogen gas condition) of their low-density polyethylene/organo-modified montmorillonite LDPE/OMMT nanocomposite specimens. The onset degradation temperature of the nanocomposite specimens of only 0.5 wt% have increased by a considerable 23°C for OMMT compared with that of neat LDPE. Morawiec et al. (2005) have also performed TGA on their samples, conducted in a nitrogen atmosphere and in an air atmosphere. Based on the TGA curves, Morawiec et al. (2005) have concluded that the presence of filler did not significantly improve the thermal stability in a nitrogen atmosphere as decomposition temperature and peak intensity were all recorded to be relatively consistent. More research on the thermal properties of organoclay/polymer nanocomposites carried out by Attaran et al. (2015) reported no notable change in the nucleation activity between neat LDPE and LDPE/OMMT 6 wt% specimens from their differential scanning calorimety (DSC) analysis. Hemati and Garmabi (2011) observed improved thermal stability of their LDPE/LLDPE/nanocomposites in the air and nitrogen atmosphere and observed a weight loss at a lower temperature due to the decomposition of the organic modifier.
The amount of total petroleum hydrocarbon (TPH) associated with OBM waste is the key factor in handling this waste in the oil and gas industry, because of the restriction of disposing of OBM waste containing more than 1% oil on residue (Perry and Griffin, 2001). Perry and Griffin (2001) used gas chromatography to identify the TPH content in OBM and associated drill cuttings, which was 65,000 ppm. Furthermore, using a sieve method, particle size analysis results were also presented in that study, and the average particle size was 210 µm. Although the study by Perry and Griffin (2001) presented some characterisation of the OBM waste, this study was limited to identifying the nanoparticles content of the OBM waste. However, Gbadebo et al. (2010) investigated the elements present in both oil-based and water-based mud using atomic absorbtion spectrophotometry, and the content of Fe, Ca, Mg, Cr, Pb, Mn, and Ni were reported in that study. Another study performed by Adegbotolu et al. (2014) also highlighted the presence of heavy and trace metals using inductively coupled plasma optical emission spectrometry (ICP-OES) analysis of oil-based drilling fluid and cuttings. Investigation of the utilisation of these clay minerals including metals as nanofiller in polymer matrix to improve thermal stability is an interesting area of research undertaken at the Centre for Advanced Engineering Materials, Robert Gordon University.
OBM waste slurry is generally composed of clay minerals including metals in a strong suspended solid phase condition. This suspended clay slurry has been selected in this study as reinforcement in LDPE matrix not only because it improves the thermal stability, but also because of the potential for valorising an unwanted and unexploited waste discarded at landfill site as an existing practice in oil and gas industry. This paper highlights other properties of OBM waste and delivers the potential opportunity of utilising this OBM waste as nanofiller in developing and manufacturing novel nanocomposite materials.
Materials and experimental details
Preparation of materials and samples
The OBM waste slurry was donated by a local oil and gas service company in Aberdeen, UK. To characterise the solid content in this OBM slurry and to use this OBM powder as a filler in nanocomposite, the petroleum hydrocarbons were eliminated using a thermal treatment process. To obtain the solid residue, the OBM slurry is heated following the stages: 50°C for 12 h (1st heating) followed by 80°C for a further 12 h (2nd heating); finally the residue is heated at 700°C for 12 h (3rd heating). To facilitate different analyses and to use as a filler in nanocomposite manufacturing, this solid residue was crushed into smaller pieces using a grinder, followed by a further size reduction to produce powder by using IKA UltraTurrax ball mill.
Lupolen 1800S (trade name of LDPE, manufactured by Lyondellbasell industries Ltd) was supplied by Northern Polymers and Plastics Ltd, UK. It has a melting point of 106°C and a V-2 rating in accordance to UL 94 (vertical burning test) at 1.6 mm thickness. The MMT, K10, was supplied by Sigma-Aldrich UK, and was used as a reference material to evaluate characteristics between MMT and OBM nanofiller. MMT was chosen for its established and typical use as filler in polymer compounds.
LDPE/OBM slurry and LDPE/MMT nanocomposite manufacturing process
LDPE/OBM slurry and LDPE/MMT nanocomposites were manufactured by reinforcing fillers in certain weight percentages in the LDPE matrix: 2.5, 5.0, 7.5, and 10.0 wt% in this study. LDPE pellets and MMT were dried at 90°C overnight prior to melt compounding. Moisture-free LDPE (oven dried at 90°C for 12 h) was mixed with slurry prior to melt compounding. LDPE/OBM slurry and LDPE/MMT mixed compounds containing different weight percentage of fillers were manufactured using a twin screw extruder (TwinTech extrusion Ltd.) at 60 rpm over five different heating zones: 1st zone (120°C), 2nd zone (200°C), 3rd zone (210°C), 4th zone (200°C), and die/5th zone (200°C). The compounded strands were prepared, using a pelletiser, into pellets, which were then injection-moulded into a bar mould (dual cavity) using the barrel temperature at 230°C with a moulding pressure of 10 bar to manufacture nanocomposite materials for different analyses.
Characterisation
SEM was performed using a JEOL JSM-7400F instrument with a magnification of 25000×, 8.0 mm working distance and accelerating potential of 5.0 kV. The samples were coated with gold and palladium using sputter deposition for 2 min prior to the analysis.
ATR-FTIR spectroscopy was carried out for 32 scans between 4000 and 400 cm–1 with a resolution of 4 cm–1. A blank measurement was taken to minimise the influence of water vapour and carbon dioxide from the atmosphere. The air background was collected and then the sample spectra were collected and saved. The dry drilling waste sample was placed between the ATR stage and the diamond.
Mineralogical composition for OBM powder, MMT and LDPE/OBMFs nanocomposites was determined by XRD using a Siemens D5000 diffractometer with Cu Kα radiation (λ = 0.15406 nm) in the range of 3–60° and 0.1° 2θ step size, and scanning speed was 0.02°s–1. The diffraction details and relative intensities were obtained and compared using Rietveld refinement software.
Element analysis
To determine the elemental composition of dry OBM waste, LDPE/OBM slurry nanocomposites and LDPE/MMT nanocomposites, energy dispersive X-ray analysis (EDXA) (Oxford Instruments INCA Energy) was carried out. To determine the inorganic elements including heavy metals in the dry OBM slurry powder, LDPE/MMT, and LDPE/OBM slurry nanocomposites, an investigation was carried out using Malvern Panalytical X-ray fluorescence (XRF) spectrometers.
Thermal analysis
The TA Q100 instrument under a nitrogen environment was used for performing DSC thermal analysis by following a heat–cool–heat procedure with the temperature ramp of 10°C/min from −20°C to 250°C. The TA Q500 instrument was used to perform TGA to identify the degradation and decomposition nature of the materials. The temperature was set on ramp mode from room temperature (15°C) to 1000°C at a rate of 10°C min–1.
Result and discussion
Morphology study
In Figure 1, the micrograph shows the tightly stacked platelets of MMT and OBM waste powder with size ranges up to 1000 nm.
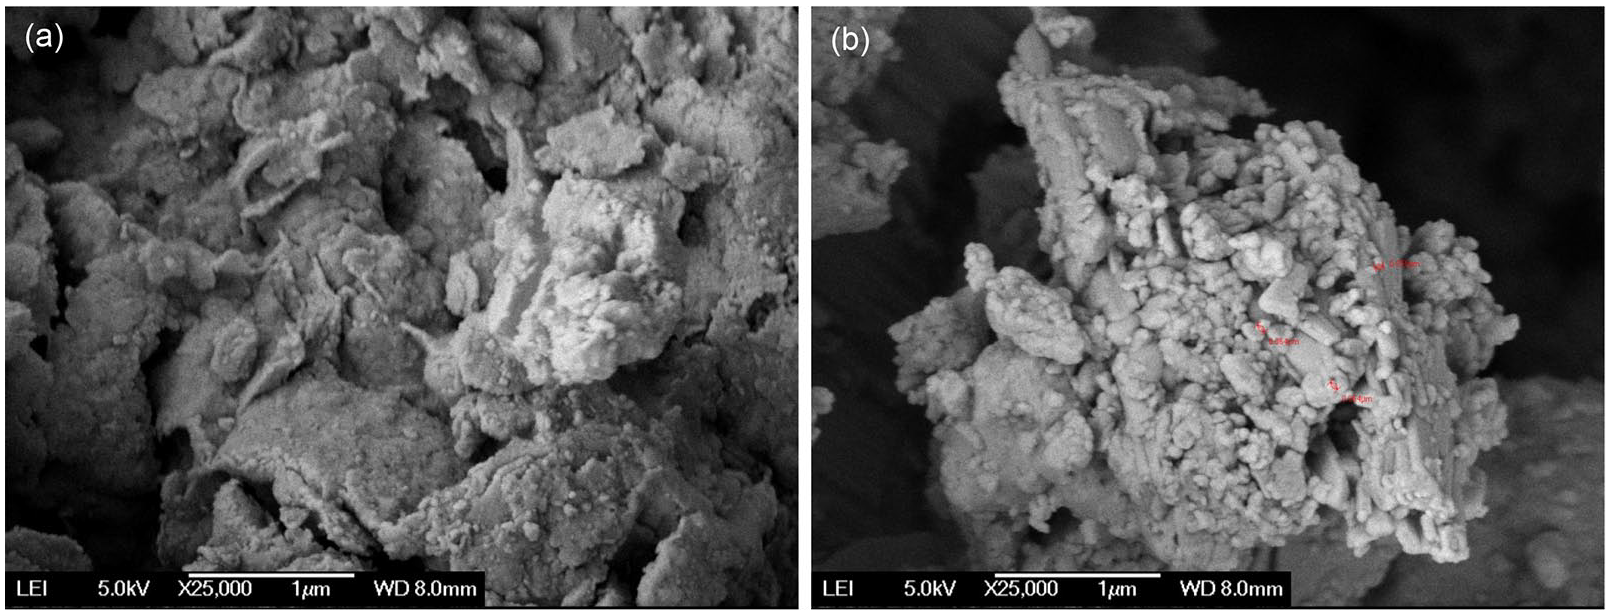
SEM images of (a) Montmorillonite as a reference material and (b) OBM waste dry powder.
The SEM micrographs were used to investigate the morphological representation of different clay minerals present in OBM waste, compared with that of a standard MMT sample supplied by Sigma-Aldrich. Both micrographs show the platelet structure. However, OBM shows tightly stacked platelets, with varying platelet sizes of different shapes, whereas MMT shows regular platelet shapes with uniform structure. It can be noted that different clay minerals may influence the structure and shape of the platelets present in OBM waste.
To identify the surface topography of reclaimed clay from OBM waste-reinforced LDPE nanocomposites, MMT-reinforced LDPE nanocomposites are considered as standard benchmark samples. It is noticeable that the OBM clay platelets are better distributed in the polymer matrix compared with MMT clay platelets in the LDPE matrix (Figure 2). The interfacial adhesion between clay platelets and the polymer matrix is stronger in the LDPE/OBM slurry nanocomposites compared with the adhesion between MMT and the LDPE matrix. This is most noticeable in samples with higher filler content, such as LDPE with 7.5 and 10.0 wt% filler nanocomposites, which show strong physical contact between filler and polymer matrix. From the morphological observations (Figure 3) it can be concluded that OBM slurry is distributed evenly throughout the polymer matrix and has regular gaps between platelets in LDPE with 2.5, 5.0, and 7.5 wt% OBM slurry nanocomposites. It can be highlighted here that the interfacial gap between platelets and LDPE matrix is less in LDPE/OBM slurry nanocomposites compared with that in LDPE/MMT nanocomposites. This observation suggests a superior interfacial adhesion mechanism between OBM slurry and LDPE matrix compared with the adhesion mechanism in LDPE/MMT nanocomposites. It can be concluded that OBM slurry is distributed evenly throughout the polymer matrix, and has regular gaps between platelets in LDPE with 2.5, 5.0, and 7.5 wt% OBM slurry nanocomposites.
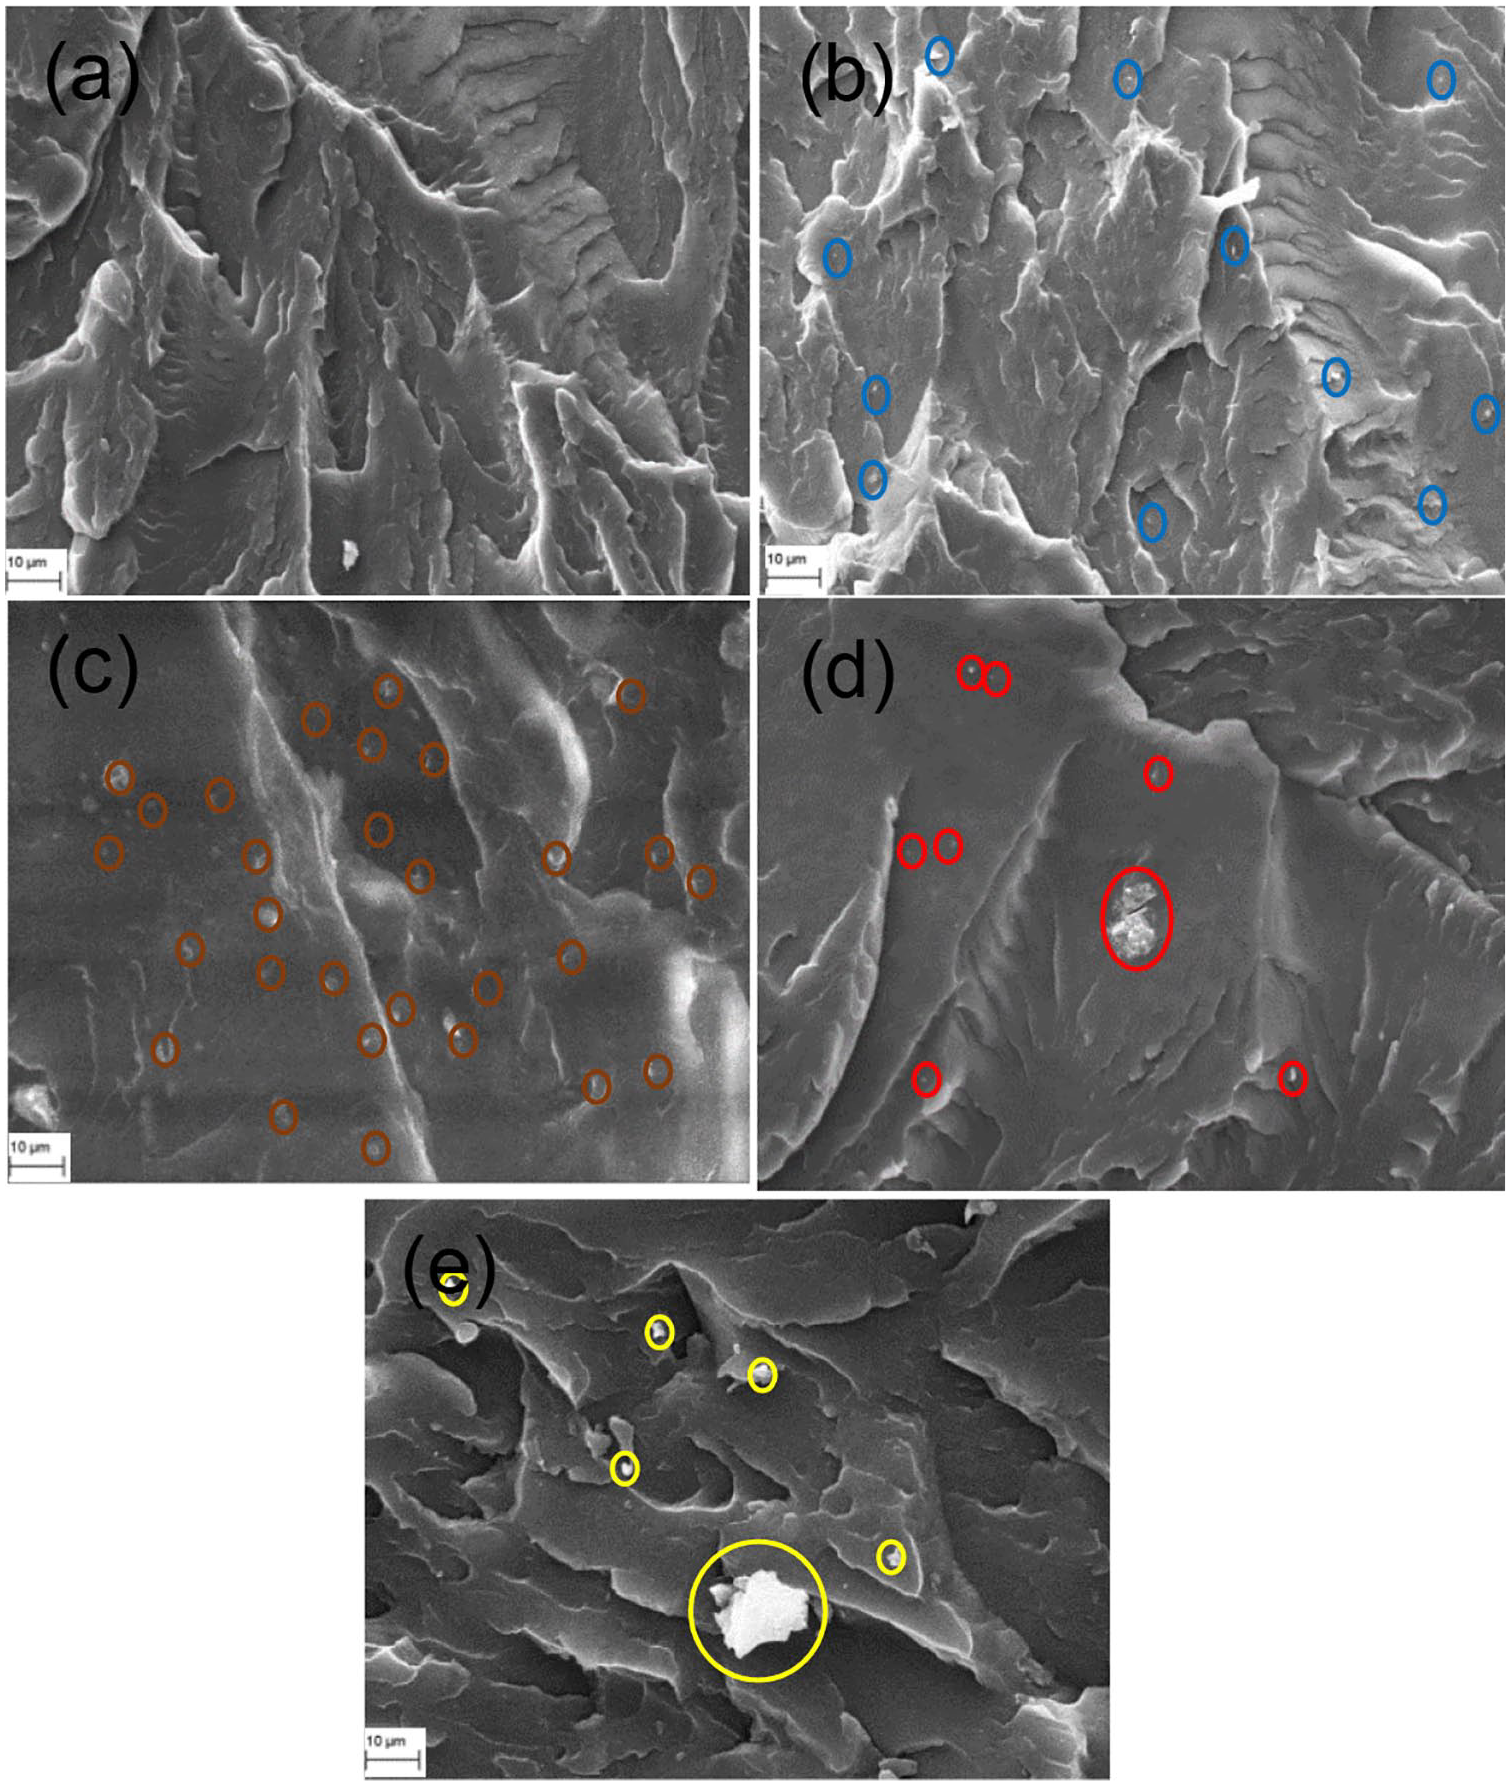
SEM images of (a) neat LDPE; (b) LDPE with 2.5 wt% MMT; (c) LDPE with 5.0 wt% MMT; (d) LDPE with 7.5 wt% MMT and (e) LDPE with 10.0 wt% MMT.
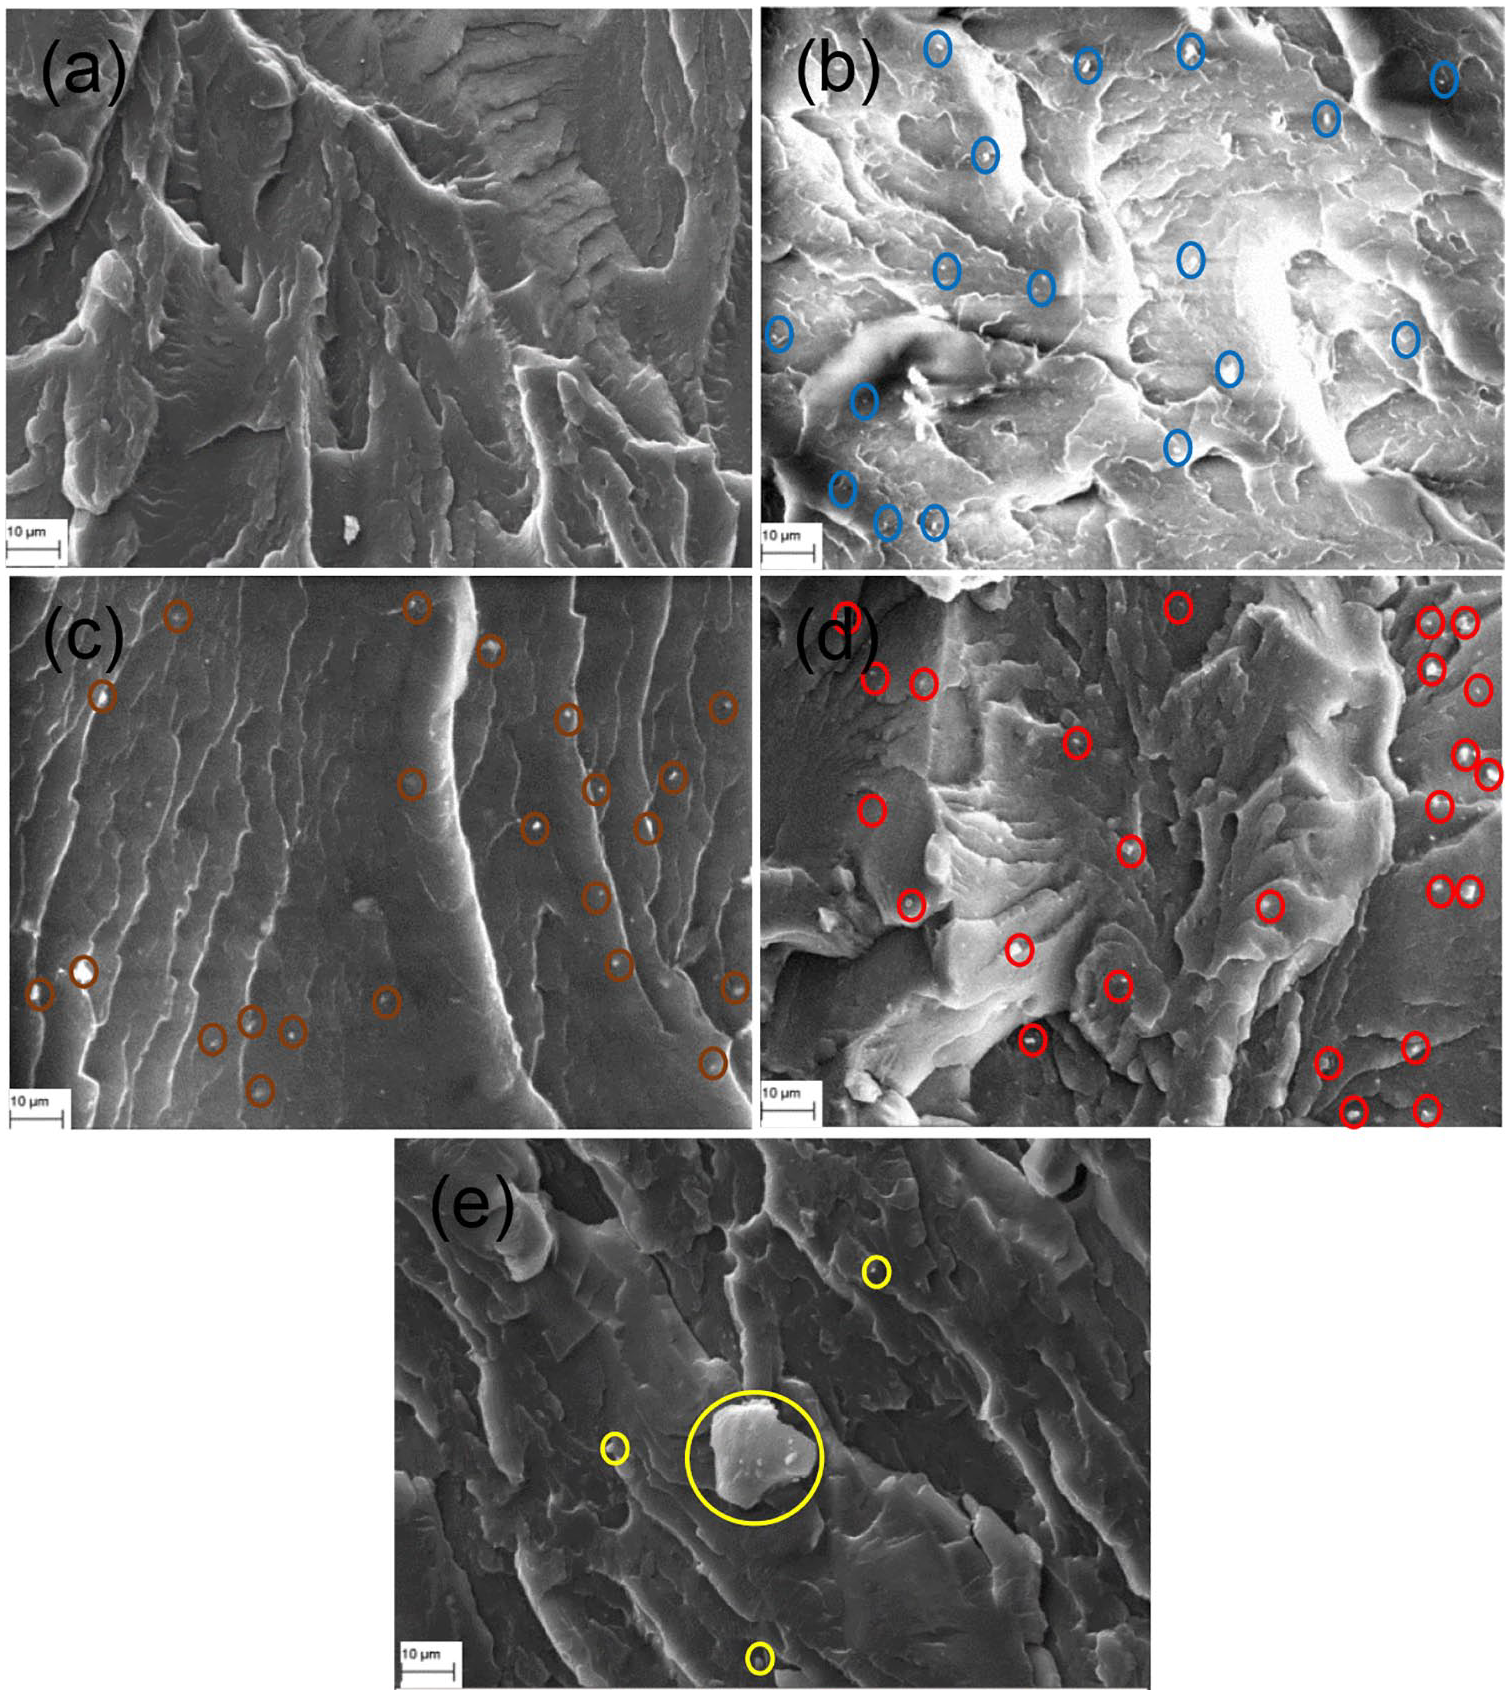
SEM images of (a) neat LDPE; (b) LDPE with 2.5 wt% OBM slurry; (c) LDPE with 5.0 wt% OBM slurry; (d) LDPE with 7.5 wt% OBM slurry and (e) LDPE with 10.0 wt% OBM slurry.
Chemical structure analysis
The ATR-FTIR spectrum analyses of neat LDPE, LDPE/MMT nanocomposites, and LDPE/OBM slurry nanocomposites were carried out, and the resulting spectra are presented in Figures 4 and 5.
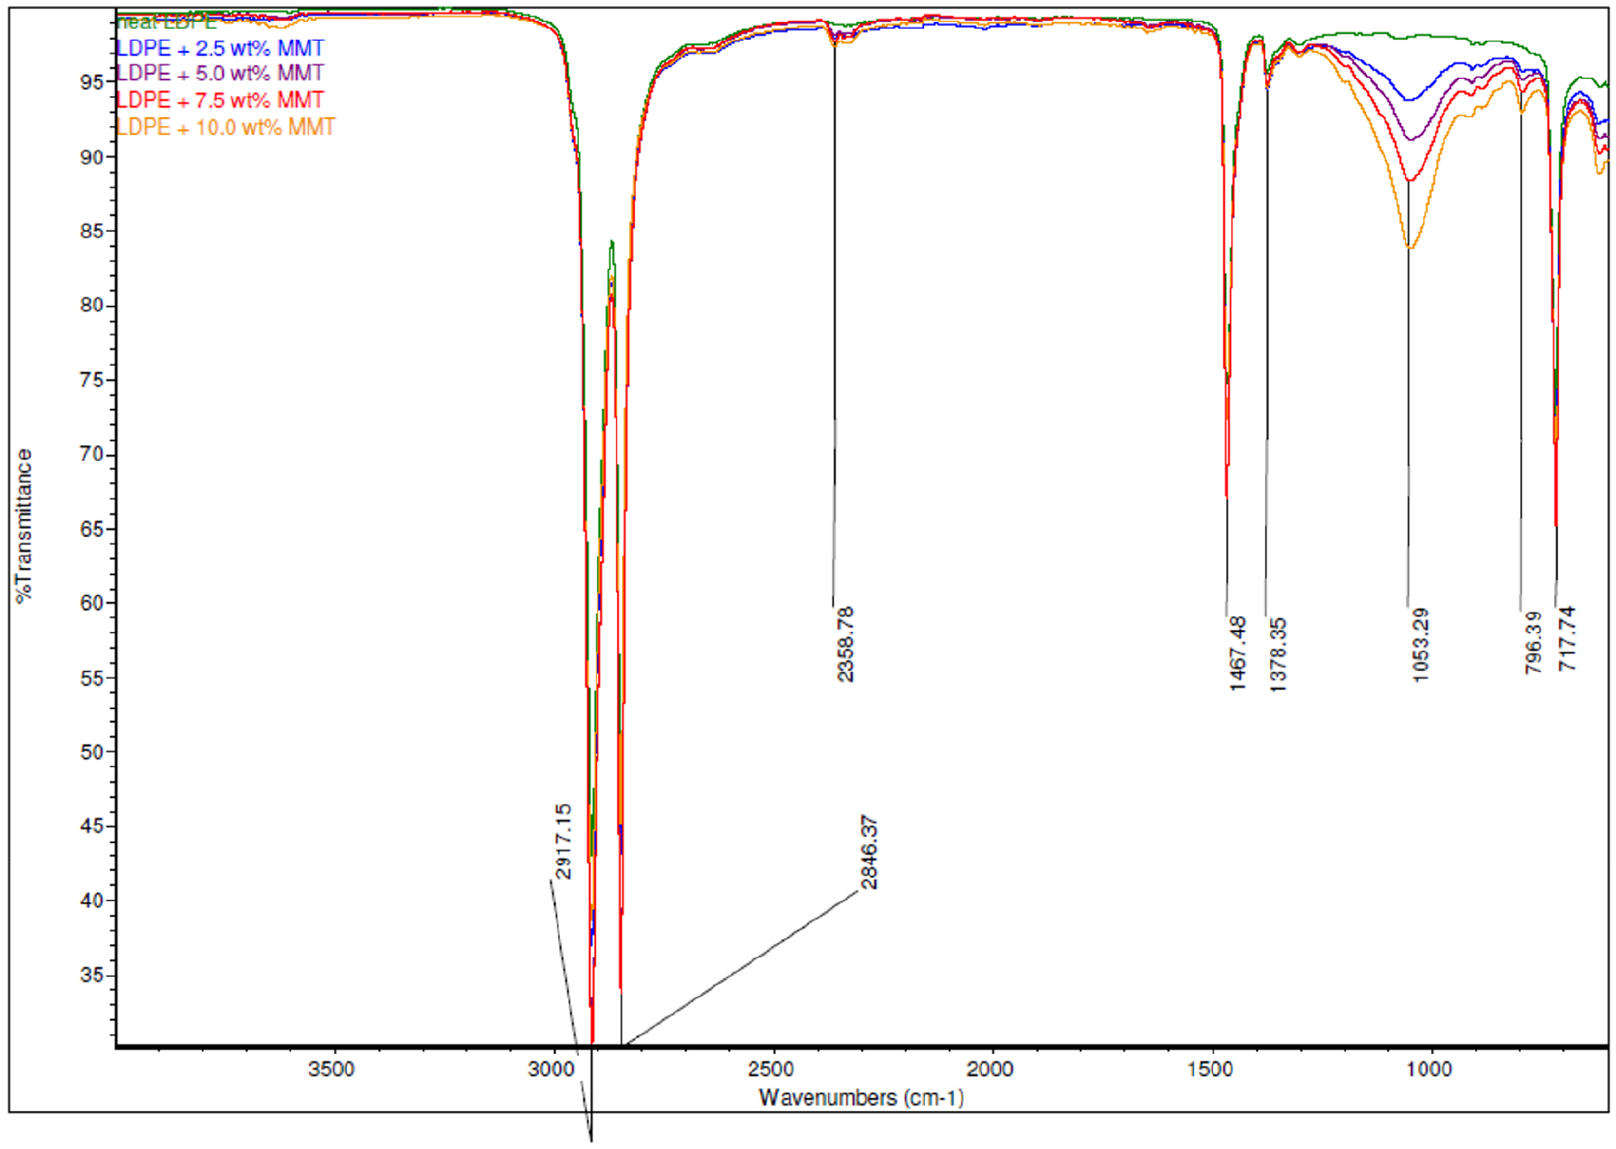
Comparison of ATR-FTIR common scale spectra of LDPE and LDPE/MMT nanocomposites.
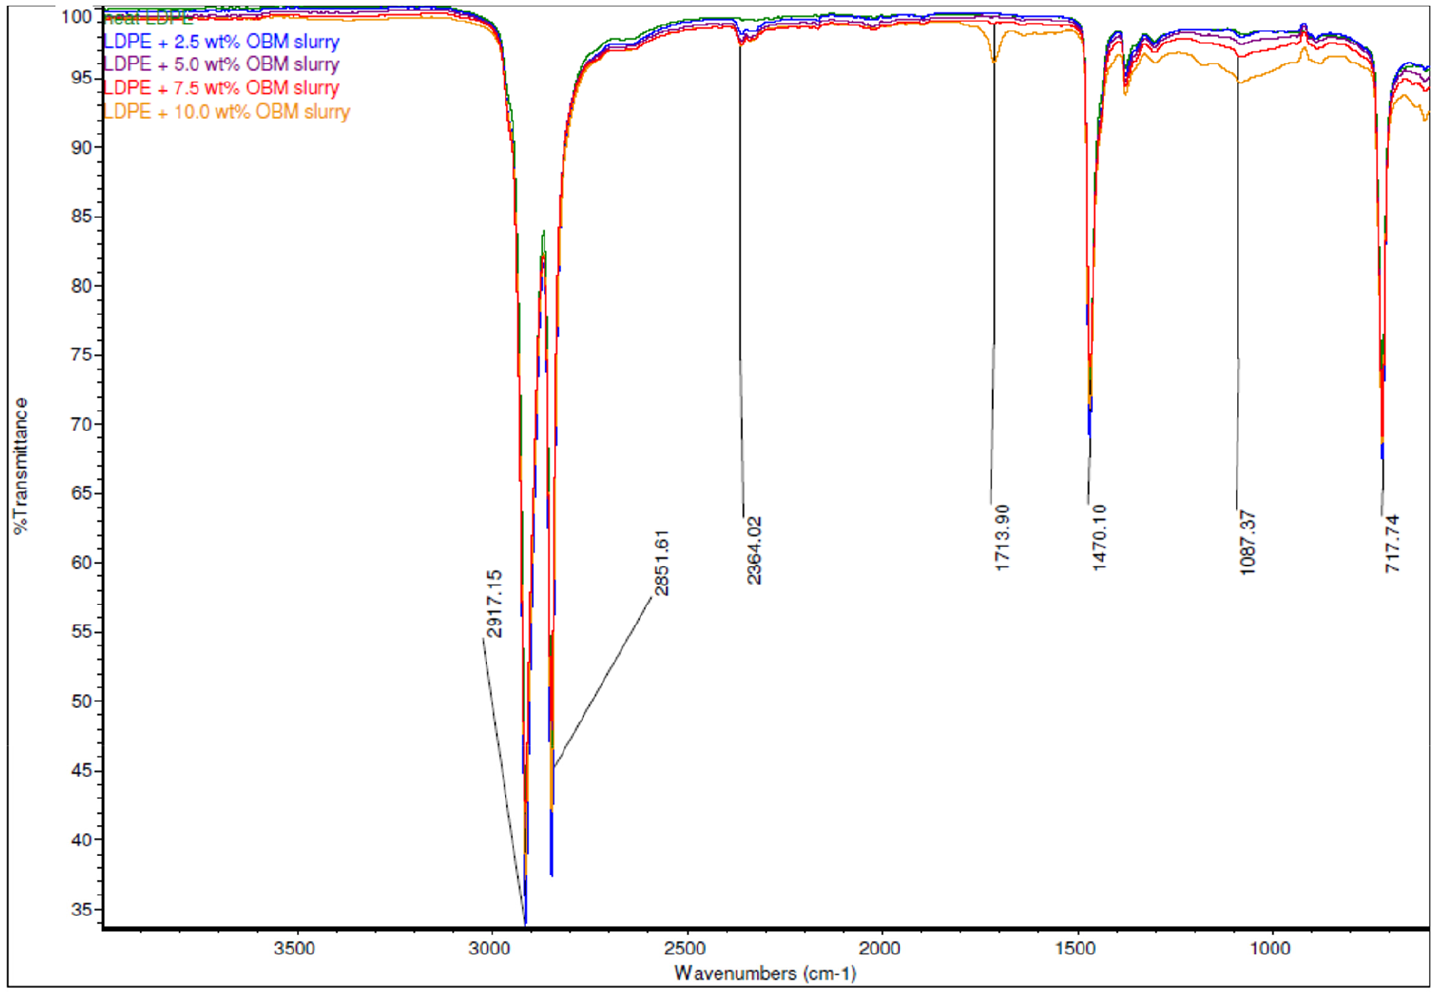
Comparison of ATR-FTIR common scale spectra of LDPE and LDPE/OBM slurry nanocomposites.
The absorption bands due to structural OH and Si-O groups play an important role in identification of different clay minerals present in LDPE/OBM slurry and LDPE/MMT nanocomposites. The chemical structures of LDPE and LDPE/MMT nanocomposites were identified using ATR-FTIR, which shows IR transmittance peaks at 1053.29 cm–1 corresponding to MMT (Figure 4) (Madejova, 2003; Nayak and Singh, 2007). In Figure 5, three peaks, at 2364.02 cm–1, 1713.90 cm–1, and 1087.37 cm–1, are clearly noticeable. The presence of a band at 2364.02 cm–1 indicates the possibility of the presence of illite (Nayak and Singh, 2007). The peak at 1087.37 cm–1 represents the stretching of Si-O, which indicates the presence of kaolinite (Siddique et al., 2019b) (Nayak and Singh, 2007). The infrared absorption band at 1713.90 cm–1 corresponds to silica-aluminium and aluminosilicates present in the nanocomposites (Djomgoue and Njopwouo, 2013).
Mineral composition analysis
Mineralogical analysis for the OBM waste showed that it is essentially dominated by muscovite, barite, MMT, and quartz. However, trace amounts of kaolinite, meionite, halloysite, aluminium, silicon chlorite, and anorthite are also present in the OBM waste.
XRD patterns of the OBM samples in an air-dried state were compared with the XRD pattern of MMT as a reference, which indicated the presence of sharp MMT peaks in the OBM waste. The diffraction peaks in Figure 6 correspond to the sets in the 29-1490 JCPDS card and confirmed the presence of MMT, using Rietveld refinement software. The d001 spacing was calculated using Bragg’s law nλ = 2d sinθ, where λ is the wavelength of X-ray radiation used in the analysis, d corresponds to the distance between diffraction lattice planes, and θ is the half diffraction angle. For MMT and OBM slurry waste a diffraction peak at about 2θ = 6.700° was observed, which corresponds to a d-spacing of 12.62 Å and 13.2 Å, respectively.
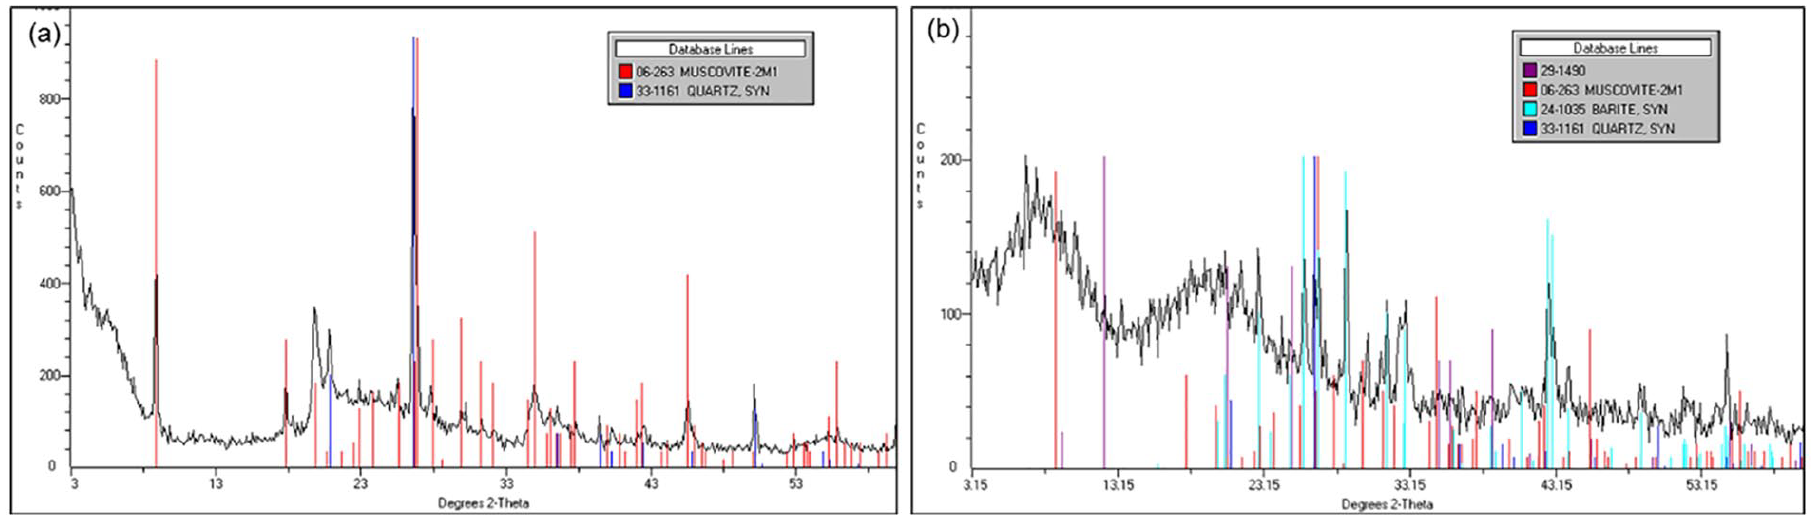
WAXD patterns of (a) MMT and (b) OBM waste.
The XRD analyses are illustrated in Figure 7 and Figure 8, showing the diffractograms at (a) wide-angle X-ray diffraction (WAXD) and (b) small-angle X-ray diffraction (SAXD) of LDPE/MMT and LDPE/OBM slurry nanocomposites, respectively. In Figure 7, XRD patterns of LDPE and LDPE/MMT nanocomposites are presented. A clear shift of the diffraction peaks of the planes (001) of MMT towards lower angles for the LDPE/MMT nanocomposites is noted. The basal spacing of MMT increases with different nanocomposites in different ratios.
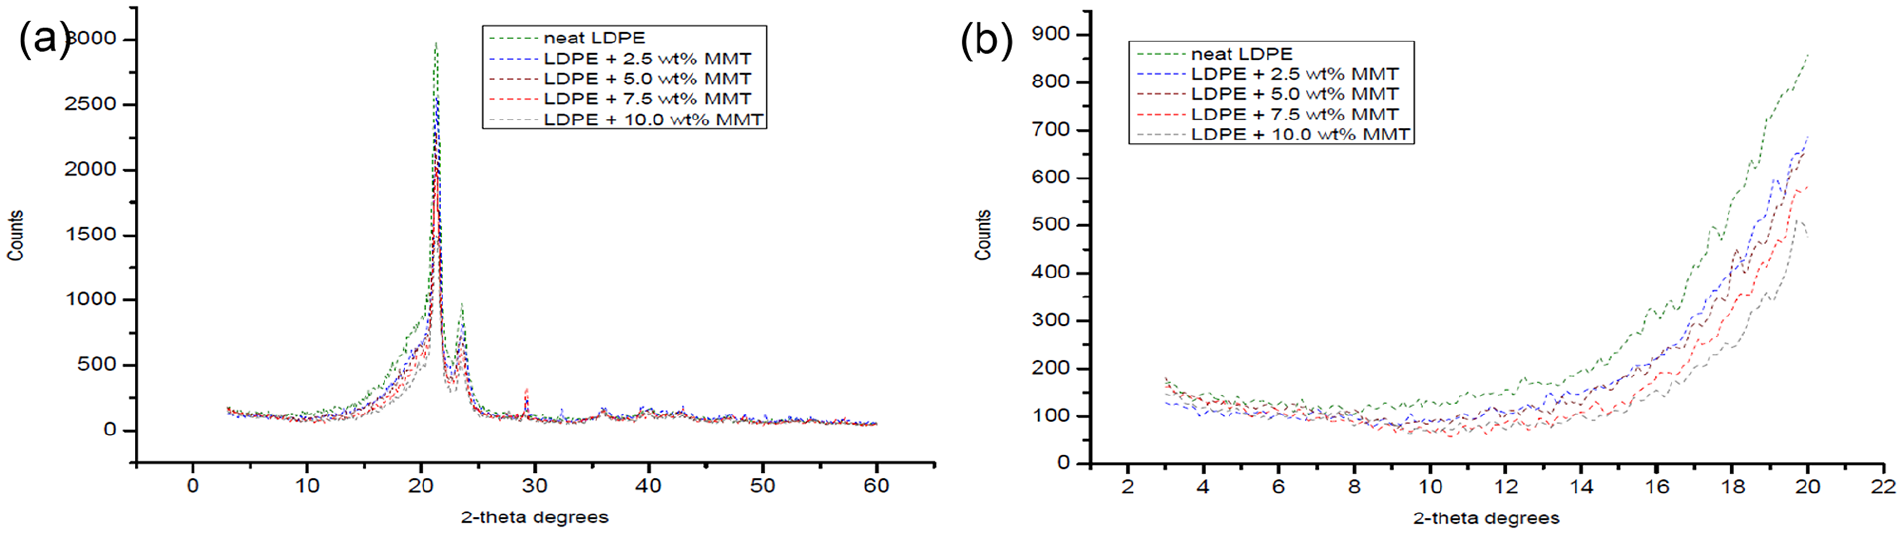
Different XRD patterns of LDPE and LDPE/MMT nanocomposites at (a) WAXD; (b) SAXD.
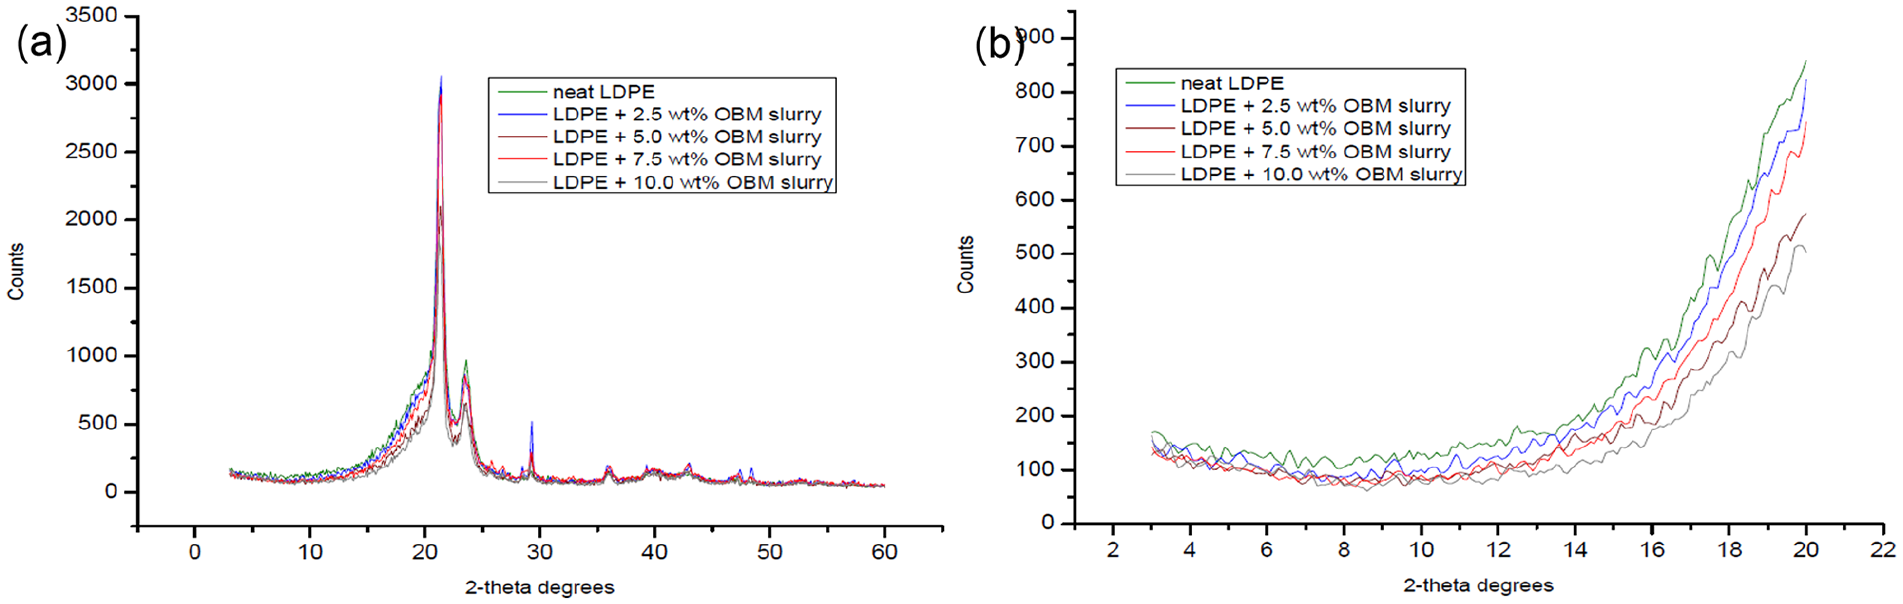
Different XRD patterns of LDPE and LDPE/OBM slurry nanocomposites at (a) WAXD; (b) SAXD.
The diffraction peak of MMT was observed at 2θ = 11.40°, which corresponds to a d-spacing of 7.75 Å. The d-spacings of LDPE with 2.5 wt% and 5.0 wt% MMT nanocomposites were identified at 10.6° and 10.2°, which corresponds to the value of 8.34 Å and 8.67 Å, respectively. However, the d-spacings of LDPE with 7.5 wt% and 10.0 wt% MMT nanocomposites were analysed at 9.3° and 8.6°, which corresponds to the value of 9.50 Å and 10.27 Å, respectively. Moreover, the diffraction peak of OBM slurry (dry powder) was observed at 2θ = 12.40°, which corresponds to a d-spacing of 7.13 Å. The d-spacings of LDPE with 2.5 wt% and 5.0 wt% OBM slurry nanocomposites were identified at 10.9° and 9.7°, which corresponds to the value of 8.11 Å and 9.11 Å, respectively. The d-spacings of LDPE with 7.5 wt% and 10.0 wt% OBM slurry nanocomposites were identified at 9.1° and 8.2°, which corresponds to the value of 9.71 Å and 10.77 Å, respectively. Considering the XRD data obtained in this investigation, it can be inferred that OBM slurry showed better delamination (higher basal spacing) compared with that of MMT in the LDPE matrix.
Elemental analysis
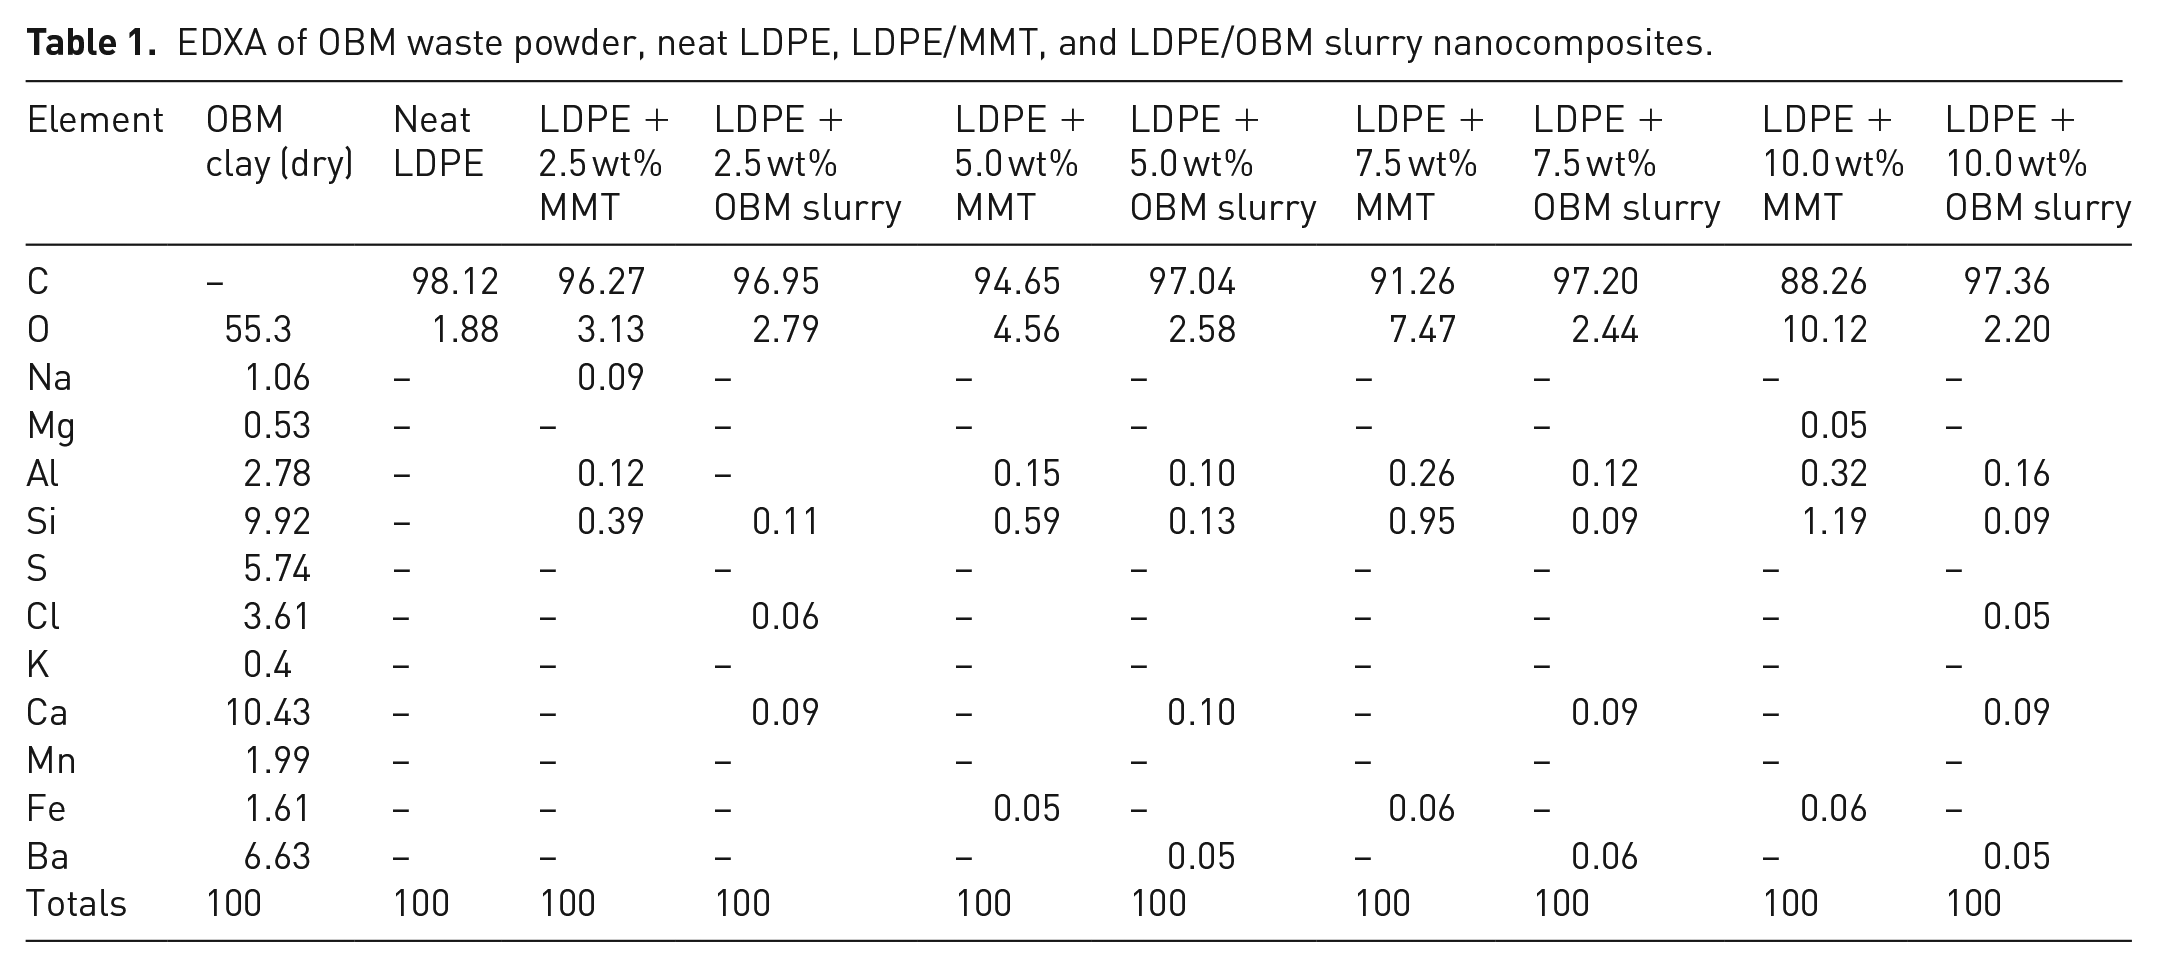
EDXA was carried out to determine the elemental composition of dry OBM waste, neat LDPE, LDPE/MMT, and LDPE/OBM slurry nanocomposites, presented in Table 1.
EDXA of OBM waste powder, neat LDPE, LDPE/MMT, and LDPE/OBM slurry nanocomposites.
The XRF chemical composition of OBM slurry powder, neat LDPE, LDPE/MMT and LDPE/OBM slurry nanocomposites is presented in Table 2.
XRF analysis of OBM waste powder, neat LDPE, LDPE/MMT, and LDPE/OBM slurry nanocomposites.
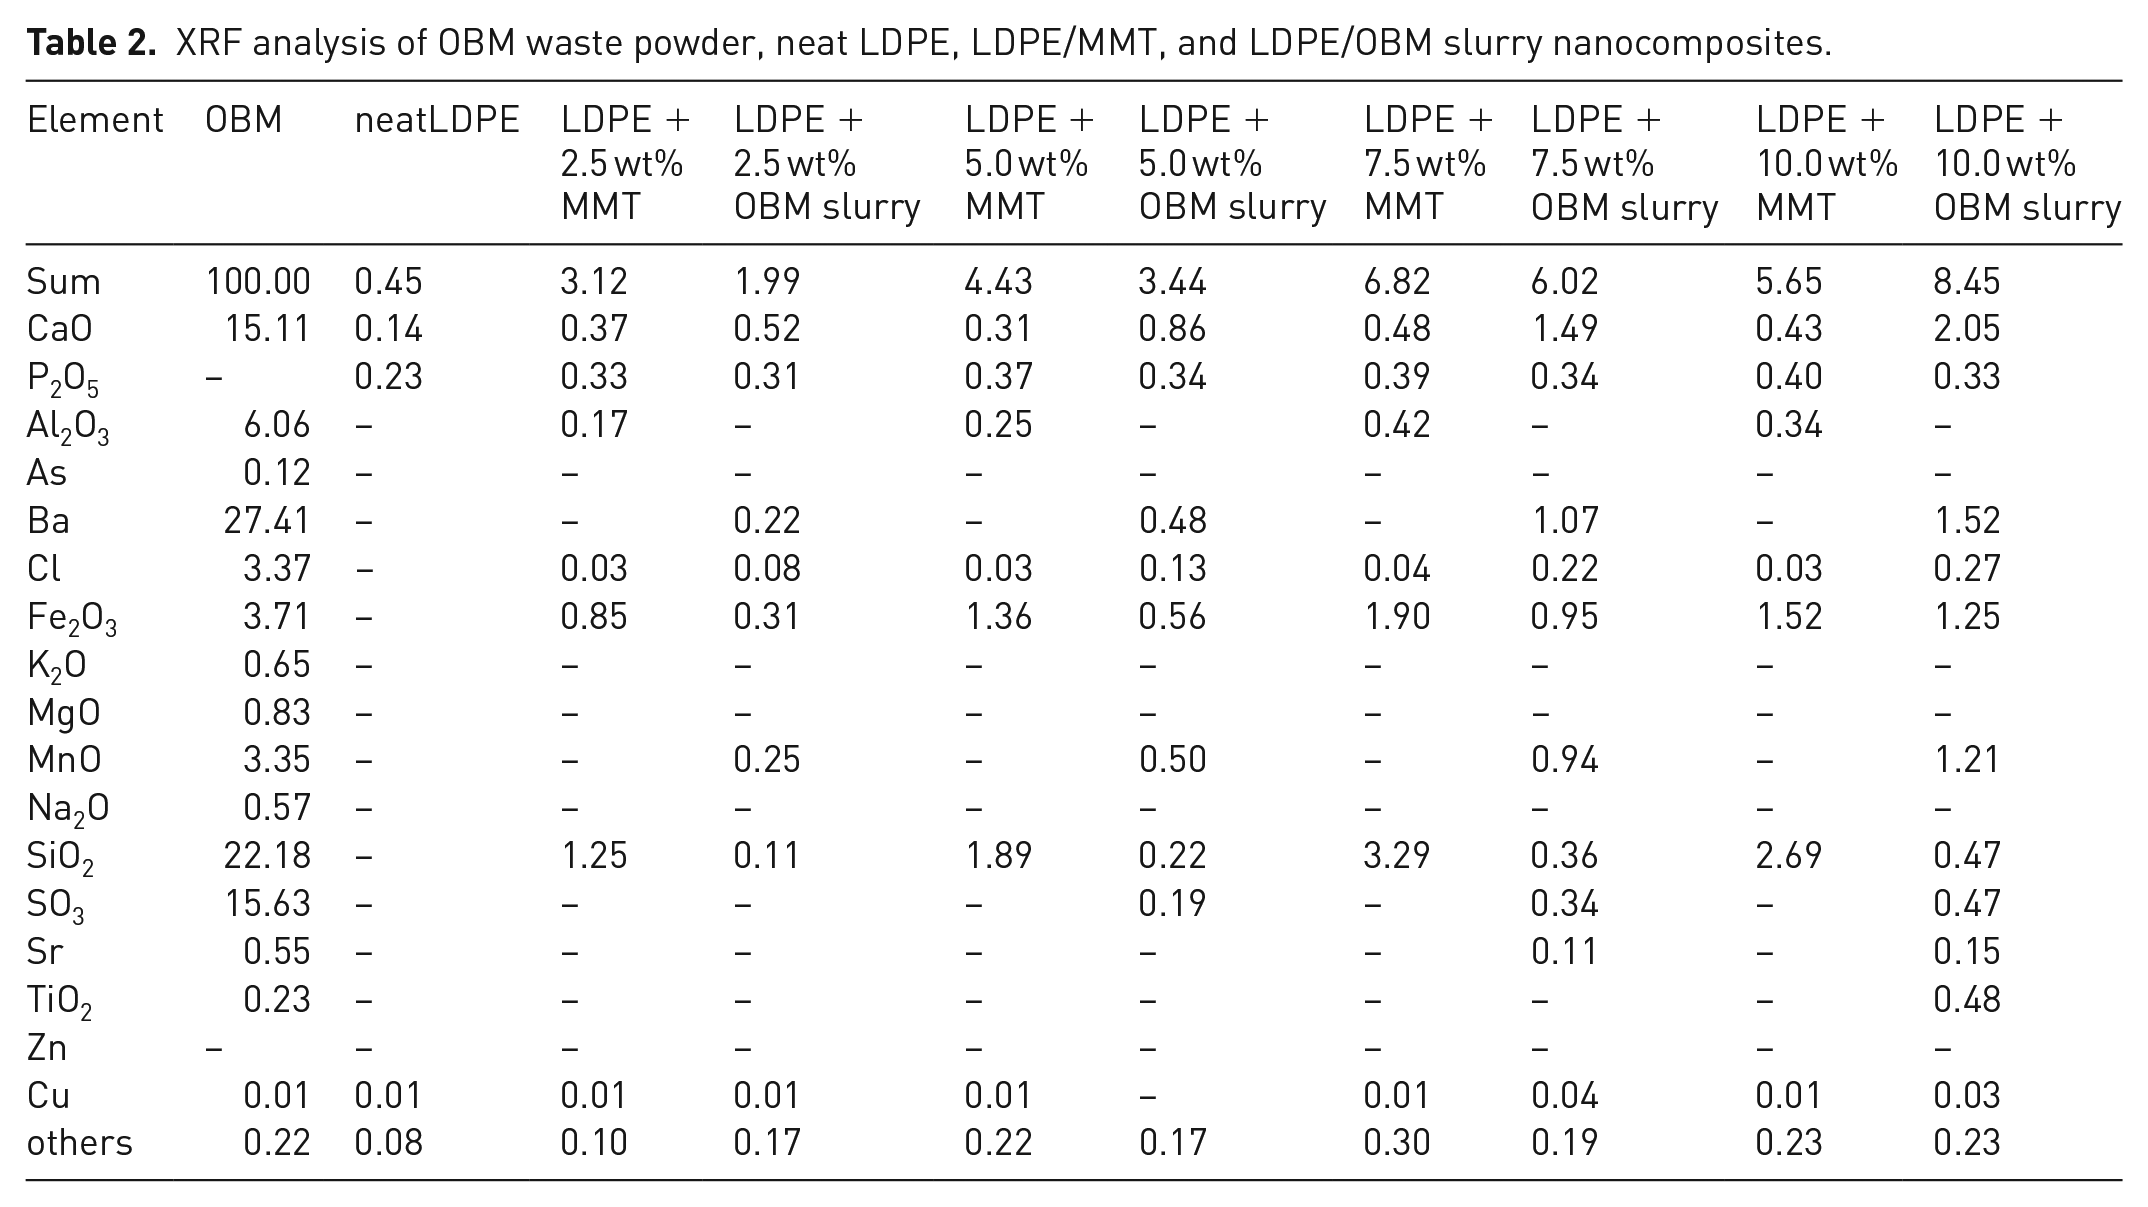
XRF analysis confirmed that BaSO4, SiO2, Al2O3, CaO, and Fe2O3 were found to be major constituents of OBM slurry (dry powder). Silicon dioxides, iron oxides, alumina, barium sulphate, calcium and manganese oxides are known to be the hardest substances. The presence of these hard substances in OBM powder suggested that this slurry can be used as a particulate reinforcement in polymer matrix.
Thermal properties
To investigate the thermal degradation behaviour of OBM waste, non-isothermal measurements were taken using a DSC instrument and the results are shown in Figure 9.
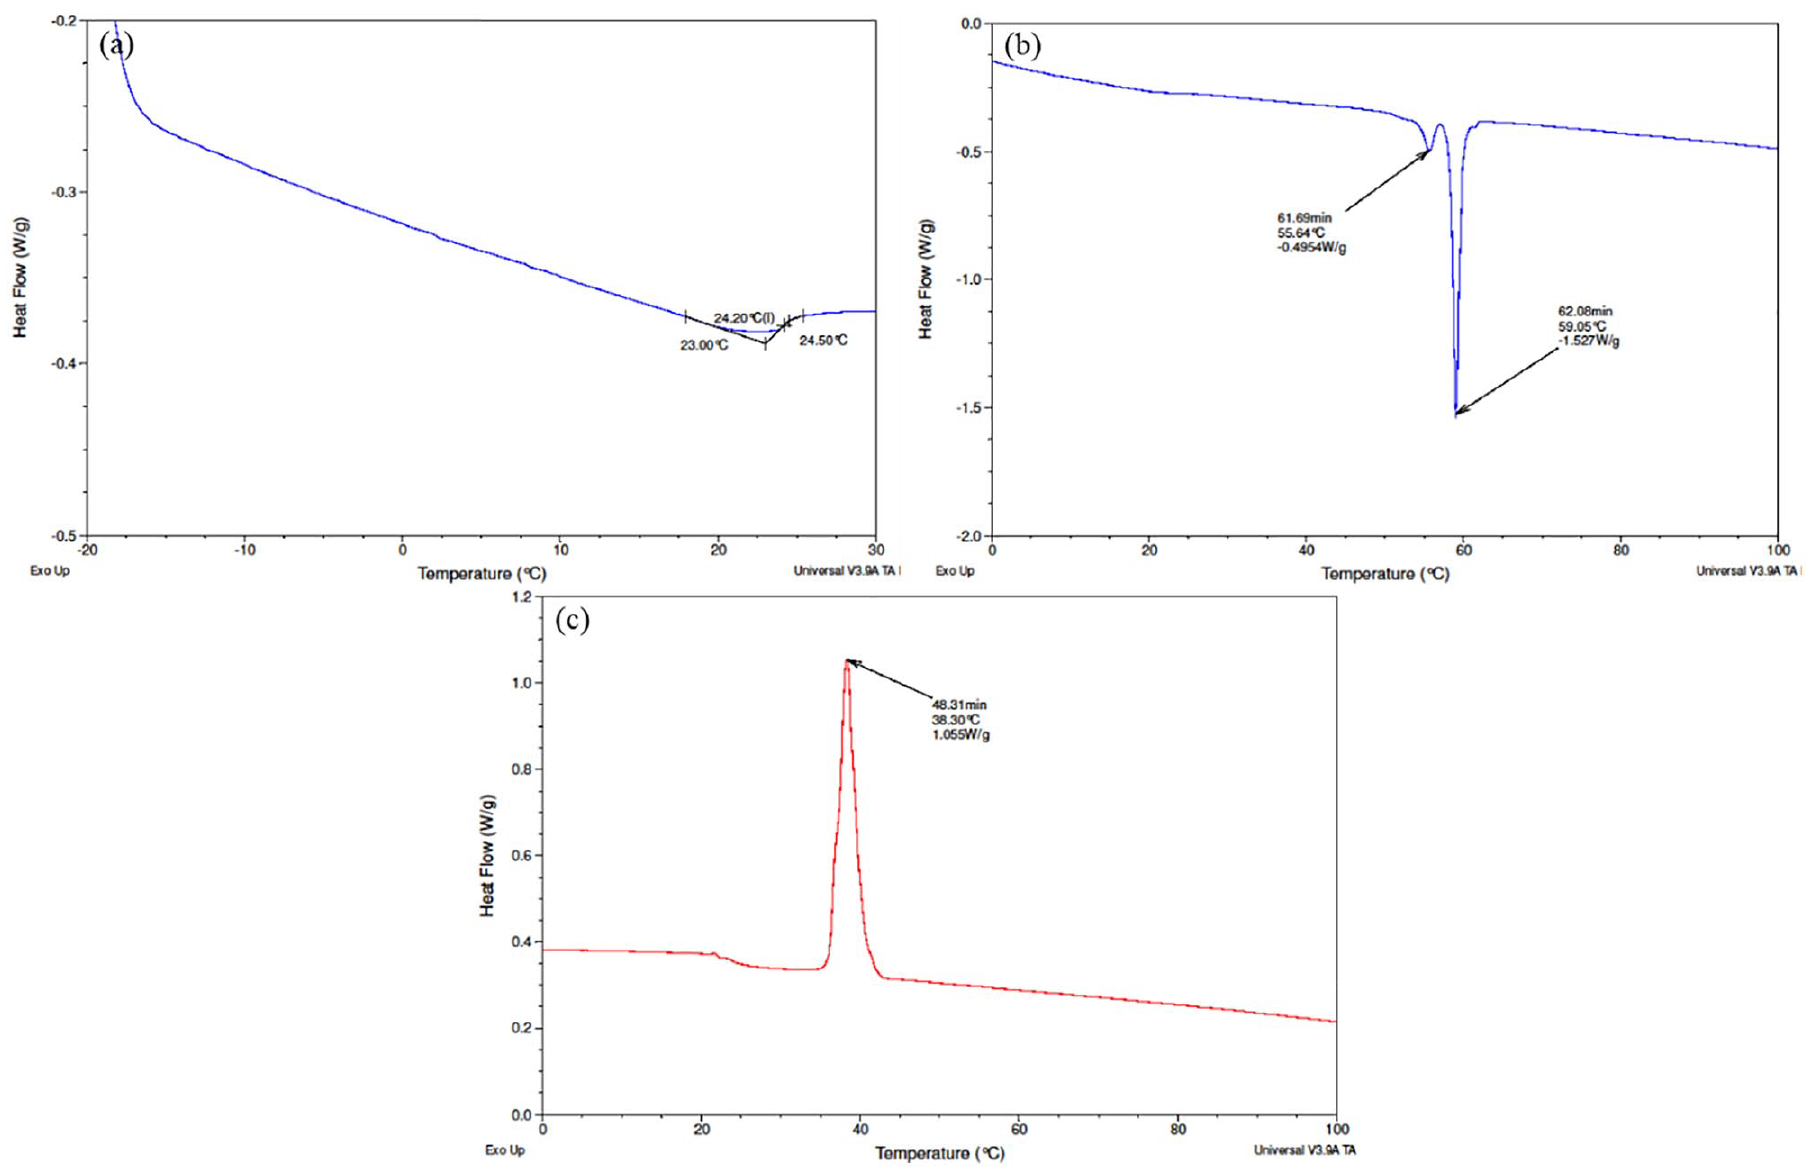
DSC thermograms of OBM waste at (a) glass transition temperature (Tg); (b) melting temperature (Tm); and (c) crystallisation temperature (Tc).
Comparing different thermograms, in Figure 9(b) there are two peaks present in melting temperature at 56.64°C and 59.05°C. It can be attributed here that the first peak at 56.64°C corresponds to the γ crystal phase, whereas the peak at 59.05°C represents α phase crystals. It is important to notice that the α-phase crystal, which is thermodynamically stronger than γ phase crystals, is dominant in this OBM waste. This observation is also established by the amount of residue recovered after TGA study. Figure 9(a) and (c) shows the glass transition temperature (Tg) and crystallisation temperature (Tc) of OBM waste, respectively.
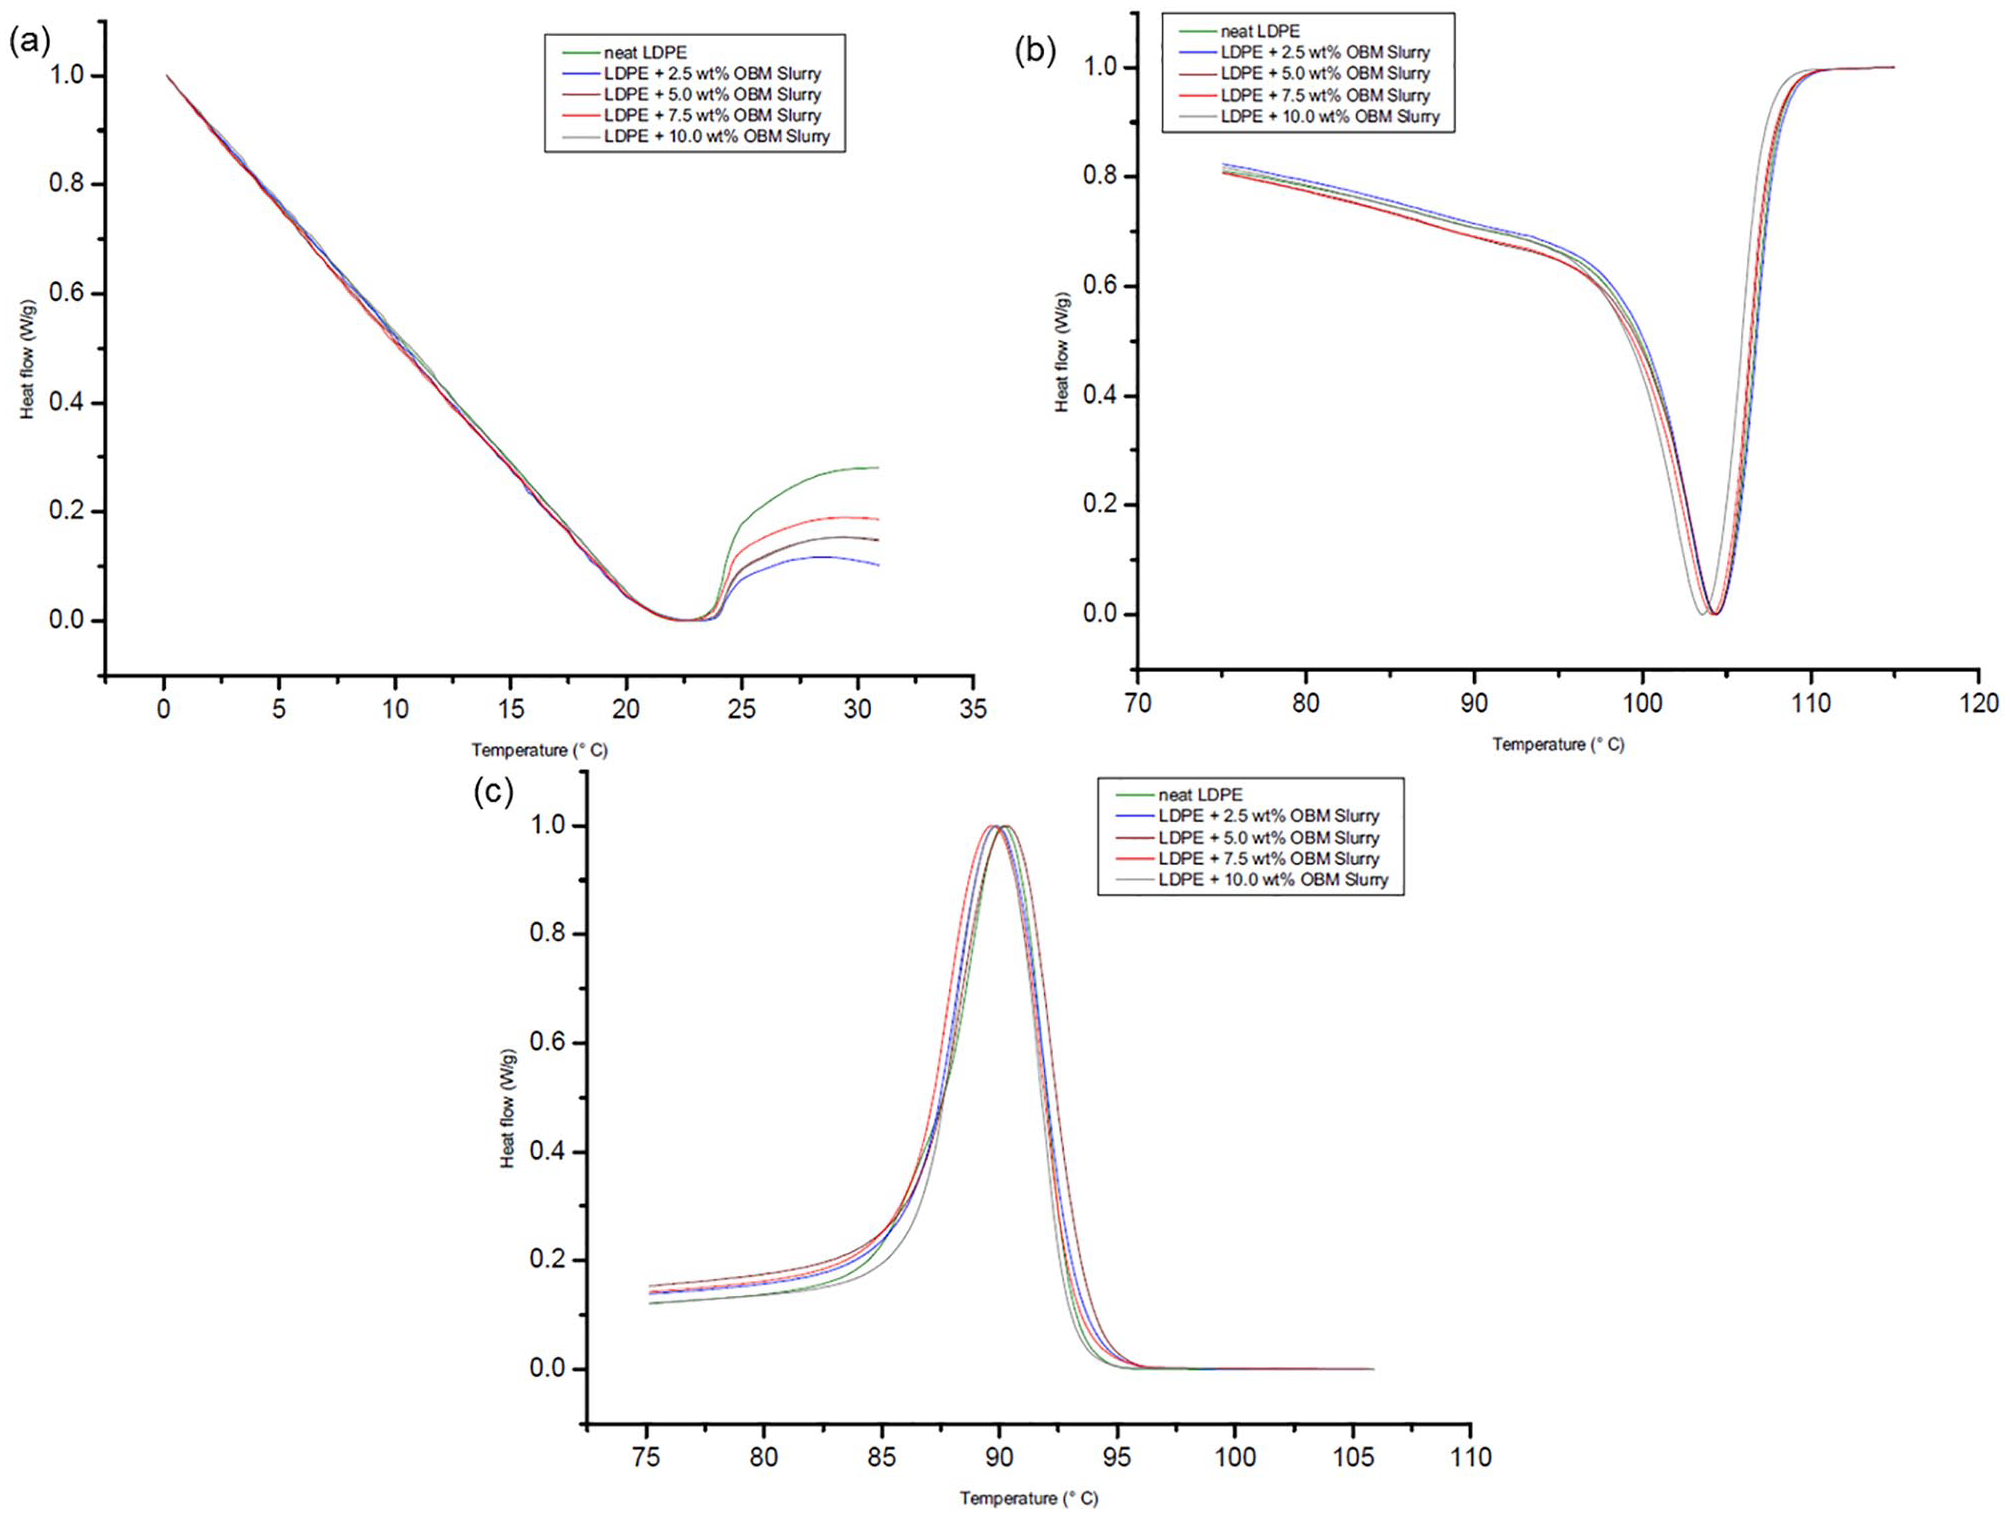
To identify the influence of OBM slurry on the thermal degradation behaviour of LDPE/OBM slurry nanocomposites, non-isothermal DSC studies were conducted. Investigation of the thermal degradation behaviour of LDPE/MMT nanocomposites was considered as a benchmark standard.
Analysing the DSC thermograms in Figure 10(a), it can be noted that there are no significant changes in the glass transition temperature (Tg) of LDPE/MMT nanocomposite materials, but this Tg is lower than the Tg of neat LDPE. However, there are no significant changes among the Tg values of neat LDPE and LDPE/OBM slurry nanocomposites. The same trend is noticeable when comparing the thermograms of LDPE/MMT and LDPE/OBM slurry nanocomposites. The melting point remains almost same for neat LDPE and LDPE/OBM slurry nanocomposites, whereas the addition of MMT filler lowered the melting point of LDPE/MMT nanocomposites. Considering the heat capacity value from the melting thermograms in Figure 10 and Figure 11, the % of crystallinity can be identified using the following equation:

where ∆Hm is the heat of melting, ∆Hc the heat of cold crystallisation which is 0 in this experiment (∆Hc = 0 in this case) due to the absence of a cold crystallisation phase in this experiment, and ∆Hm° is a reference value if the polymer were 100% crystalline. All the units are in Jg–1 and the value of ∆Hm° is 293 Jg–1 (Siddique et al., 2019b). The % of crystallinity values of LDPE, LDPE/MMT and LDPE/OBM slurry nanocomposites are presented in Table 3.
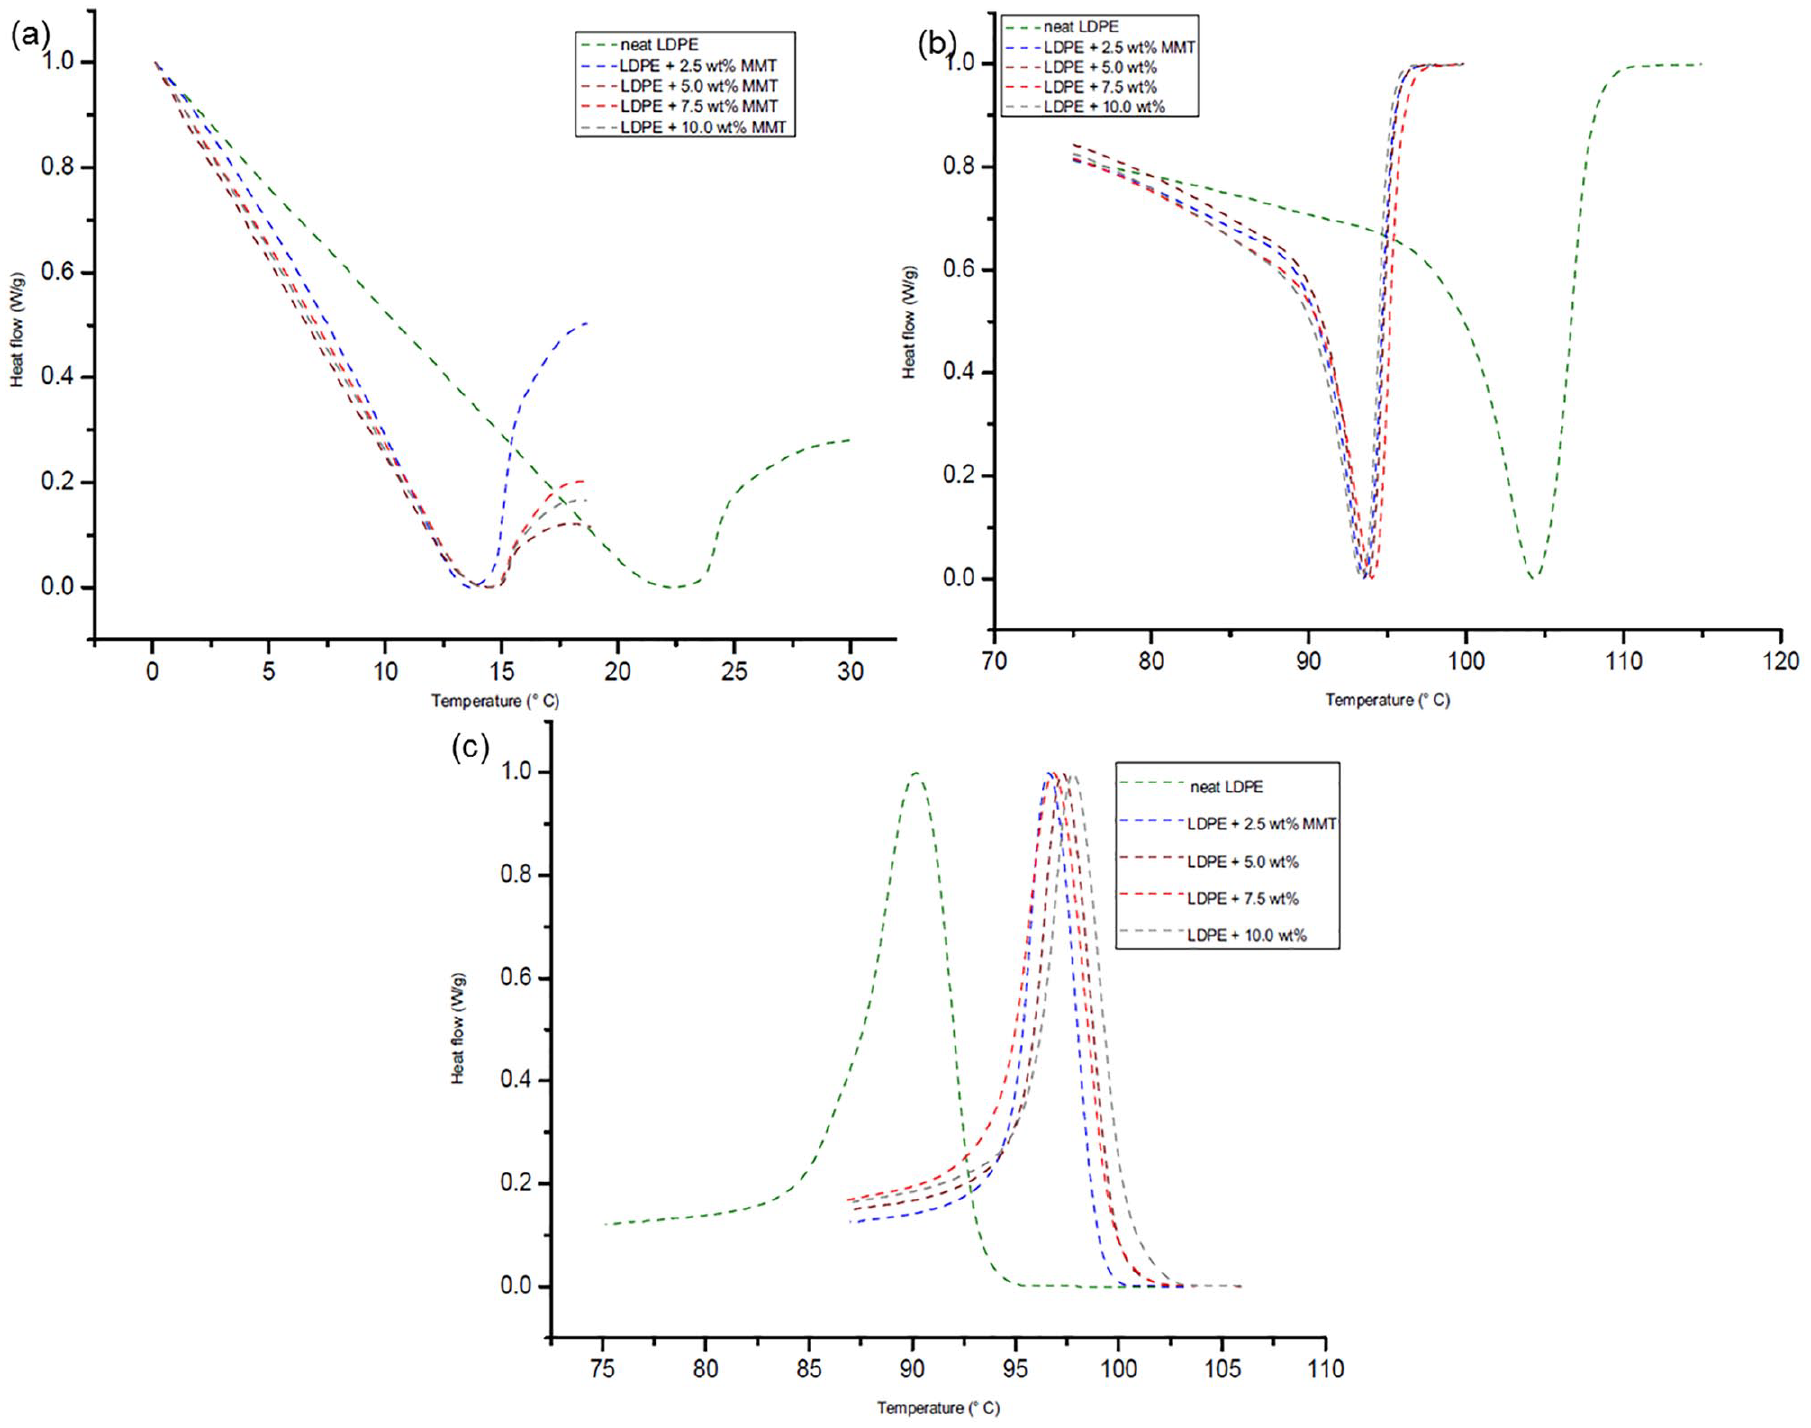
DSC thermograms of LDPE and LDPE/MMT nanocomposites at (a) glass transition temperature (Tg); (b) melting temperature (Tm); and (c) crystallisation temperature (Tc).
DSC thermograms of LDPE and LDPE/OBM slurry nanocomposites at (a) glass transition temperature (Tg); (b) melting temperature (Tm); and (c) crystallisation temperature (Tc).
Structural composition and thermal properties details of neat LDPE, LDPE/MMT, and LDPE/OBM slurry nanocomposites.
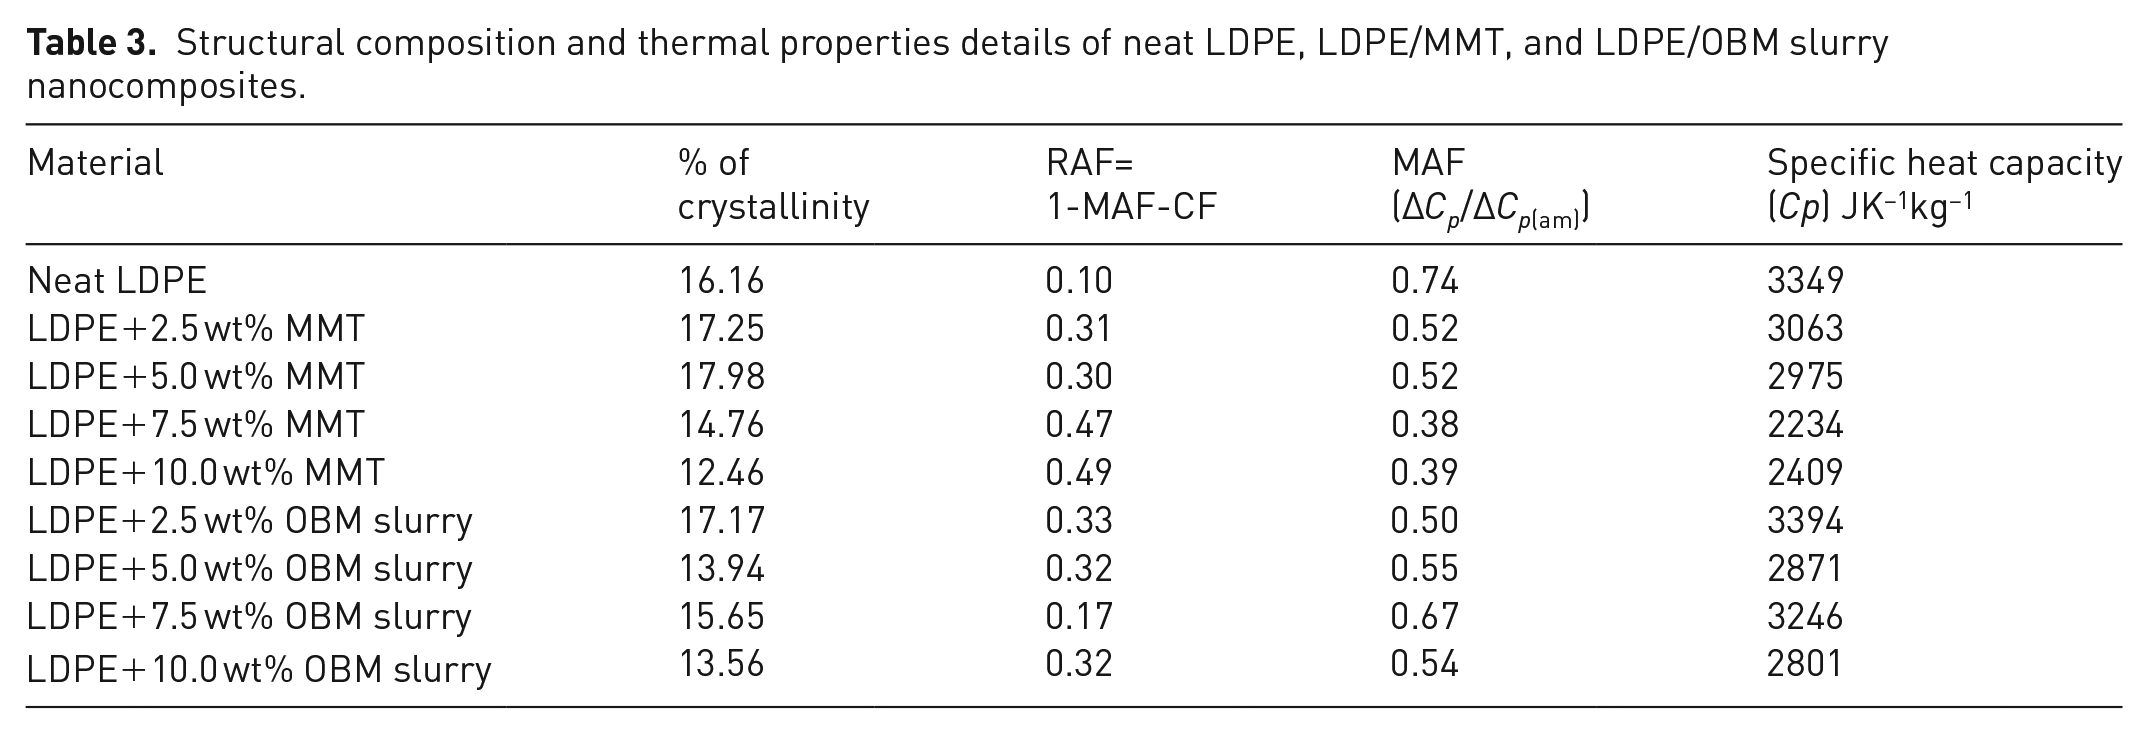
It is noticeable that there is a decreasing trend of % of crystallinity in nanocomposites with higher (more than 5.0 wt%) filler contents. However, there is an indication of increasing % of crystallinity in nanocomposites with lower (less than 5.0 wt%) filler contents. This decreasing trend in nanocomposites with higher wt% filler contents can be explained by the interruption caused by this filler in the LDPE matrix, which hinders the motion of the polymer chain segments and inhibits crystal growth.
The specific heat capacity value of LDPE, LDPE/MMT, and LDPE/OBM slurry nanocomposites have been identified by analysing the thermograms in Figures 10(c) and 11(c). The specific heat capacity value can be determined by the following equations:


where Cp is the heat capacity in Joules per Kelvin (JK–1), Q is heat energy in Joules and T is the temperature denoted as °C or K. δQ/δt represents the heat flow and δt/δT corresponds to reciprocal heating rate (Siddique et al., 2019a). By using these two equations, the analysed specific heat capacities of neat LDPE, LDPE/MMT, and LDPE/OBM slurry nanocomposites are identified, as presented in Table 3.
The heat capacity data presented in Table 3 show the negative effects of clay minerals as filler in polymer matrix. However, LDPE with lower filler contents (2.5 and 5.0 wt%) showed higher specific heat capacity tendency compared with that of higher filler contents nanocomposites. There is a trend noticeable for both of these fillers that the nanocomposites with higher percentage filler contents (7.5 and 10.0 wt% in this case) are indicated to act as a thermal conductive material. The heat capacity value decreases about 33% in LDPE with 7.5 wt% MMT nanocomposite, whereas it is about 17% heat reduction in LDPE with 10.0 wt% OBM slurry nanocomposites.
It is important to identify the different phases that exist in semi-crystalline polymer nanocomposites, as this will dictate the mechanical and thermal properties of the materials. Evaluating the heat capacity value, Cp, in glass transition temperature, the mobile amorphous fraction (MAF) can be identified by the following equation:

where ∆Cp/∆Cpamp are the heat capacity increments at the glass transition temperature of LDPE and its nanocomposites and the pure amorphous LDPE polymer, respectively. Using the MAF value, rigid amorphous fraction (RAF) can also be identified by the following equation:

Using Equations (4) and (5), the MAF and RAF values are identified and presented in Table 3.
It can be highlighted here that the RAF increases up to five times compared with RAF of neat LDPE by adding MMT fillers in the LDPE matrix. There is an increasing trend of RAF noticeable with the increasing amount of MMT content in LDPE/MMT nanocomposites. However, the RAF increases about three times compared with the RAF of neat LDPE by adding OBM slurry into the LDPE matrix. The RAF remains almost constant for different LDPE/OBM slurry nanocomposites, which indicates there is no influence of filler amounts in increasing the RAF in LDPE/OBM slurry nanocomposites.
The thermal degradation of OBM waste has been analysed in a N2 environment using TA instrument TGA Q500. Onset degradation of the sample in different stages is presented in Figure 12.
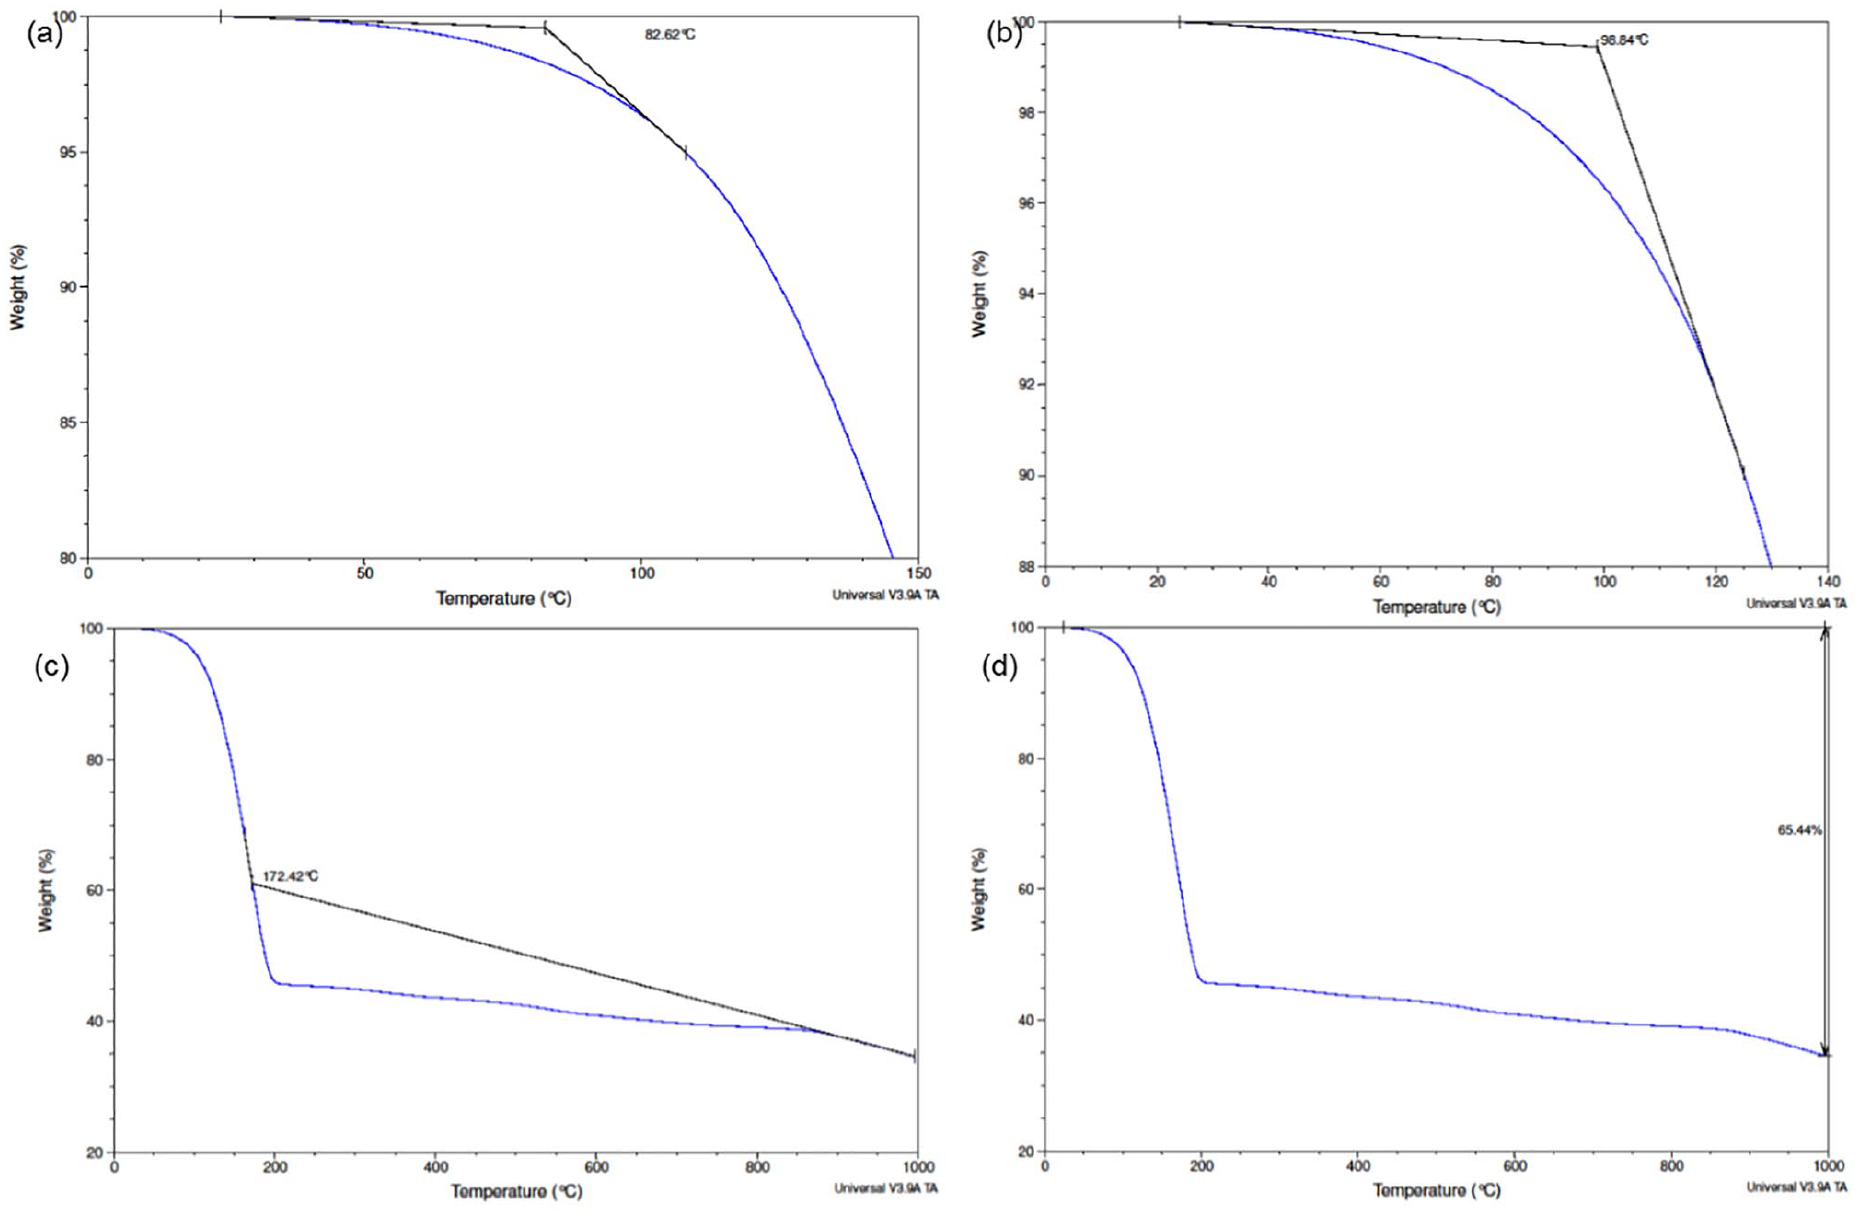
TGA thermograms of OBM waste at (a) onset degradation at 5% weight loss; (b) onset degradation at 10% weight loss; (c) onset degradation at 65% weight loss; and (d) residue at 1000°C.
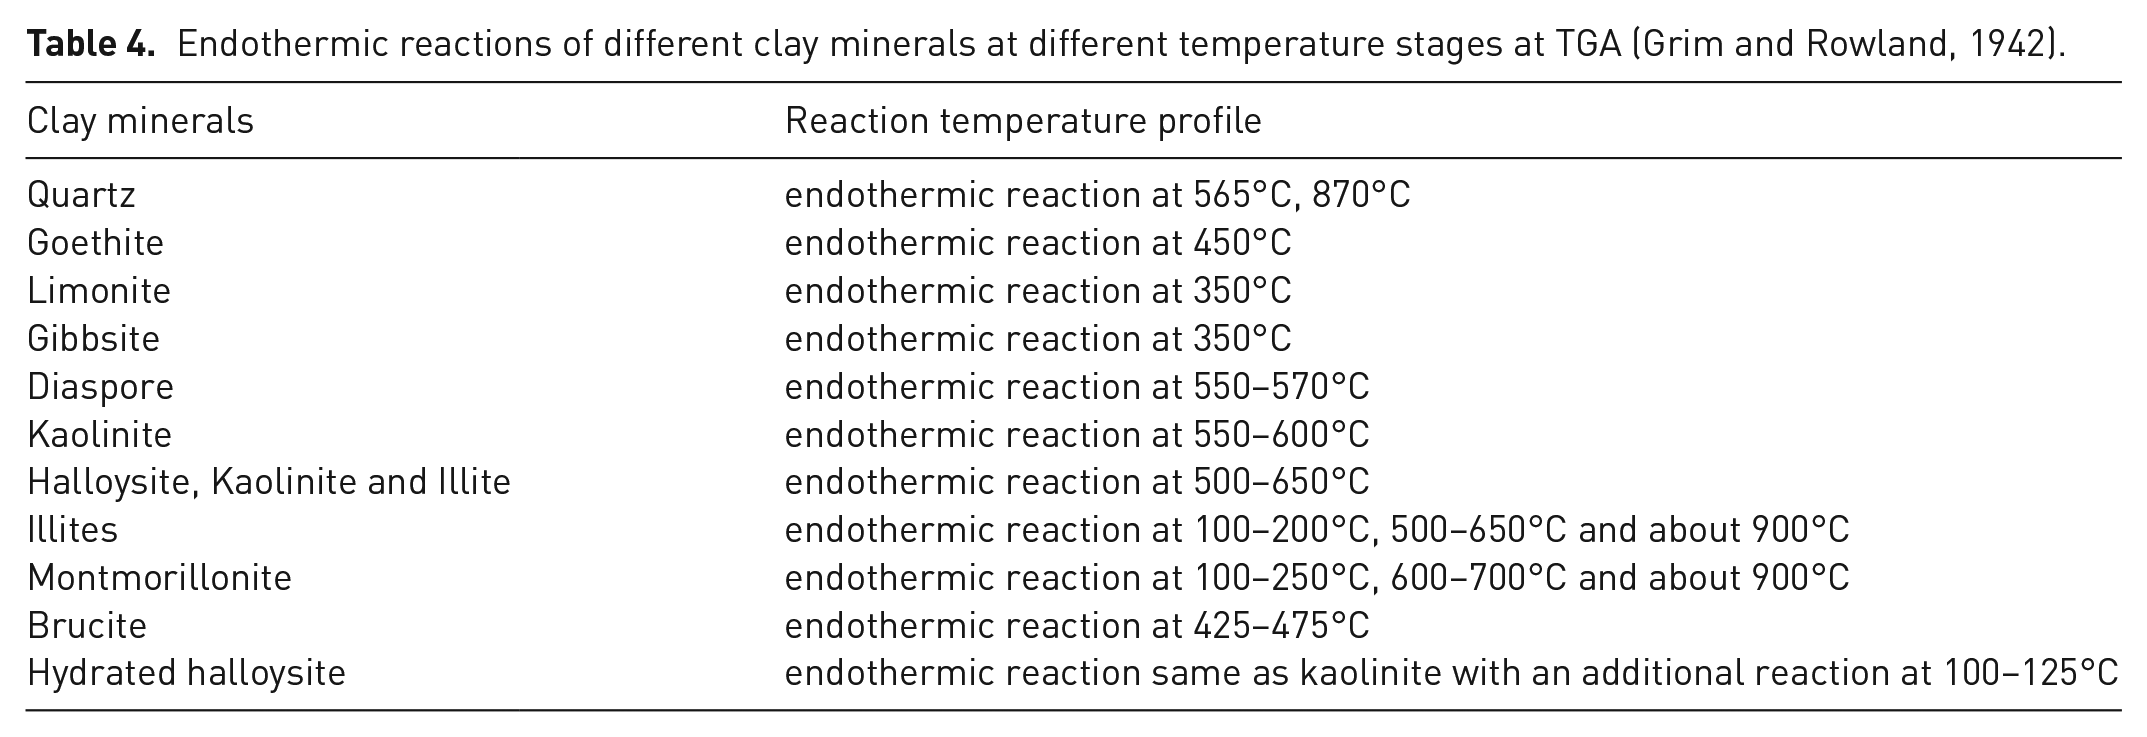
Figure 12(a–c) shows the onset degradation of OBM waste at different stages such as 5%, 10%, and 65% weight loss. Figure 12(d) shows the weight % of residue left after 1000°C. As this OBM waste is a complex mix of organic and inorganic substances, it is very difficult to establish the thermograms associated with the endothermic reaction of any specific materials/minerals. However, Table 4 shows the potential thermogram peaks associated with different clay minerals.
Endothermic reactions of different clay minerals at different temperature stages at TGA (Grim and Rowland, 1942).
The thermal degradation behaviour of LDPE/MMT and LDPE/OBM slurry nanocomposites was studied under the same environmental condition and analysis method as the environmental condition and analysis method followed in identifying the thermal degradation behaviour of OBM slurry waste (Figures 13 and 14).
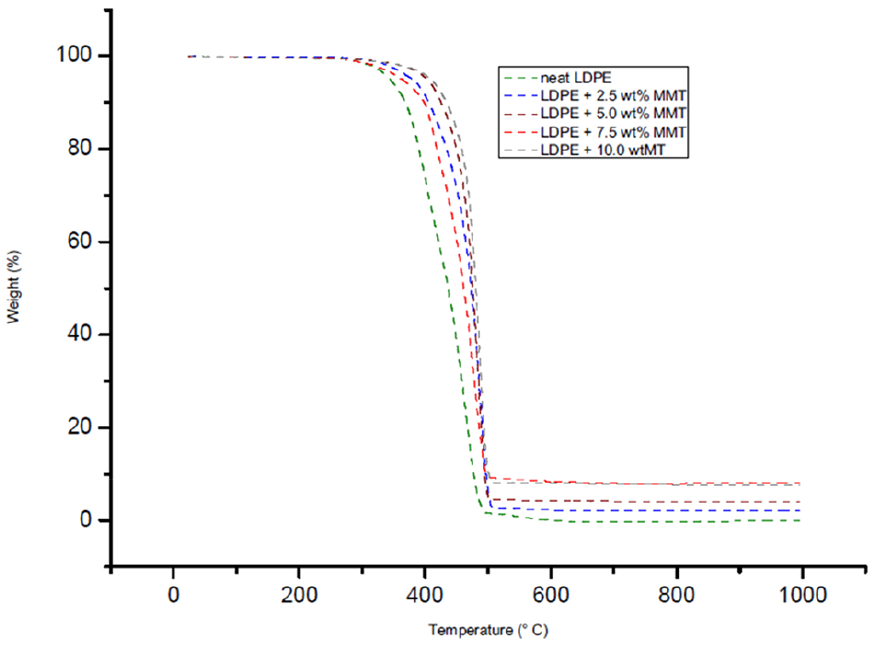
TGA thermograms of neat LDPE and LDPE/MMT nanocomposites.
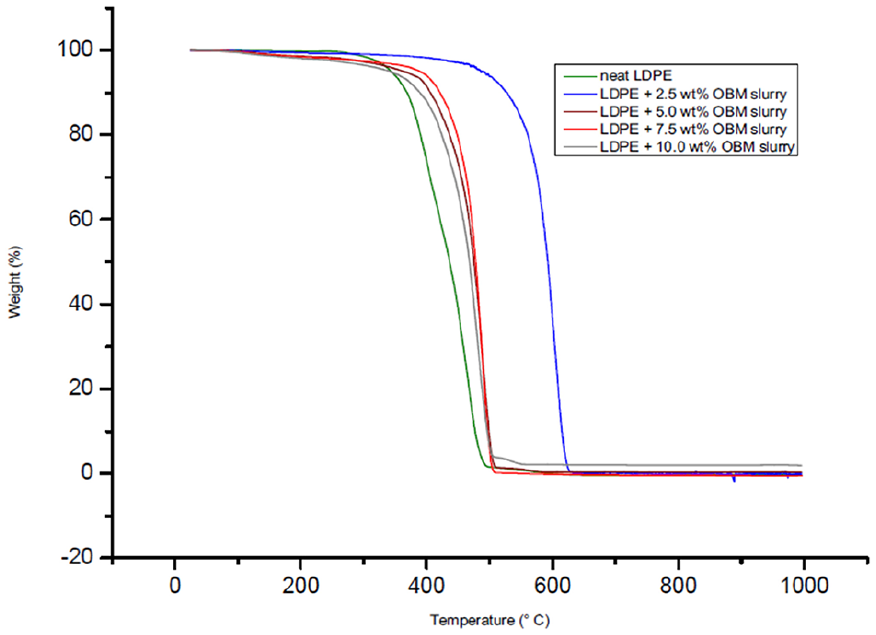
TGA thermograms of neat LDPE and LDPE/OBM slurry nanocomposites.
The degradation scenarios of these materials at different heating stages are analysed and the key findings are presented in Table 5.
TGA analysis at different decomposition stages of LDPE, LDPE/MMT, and LDPE/OBM slurry nanocomposites.
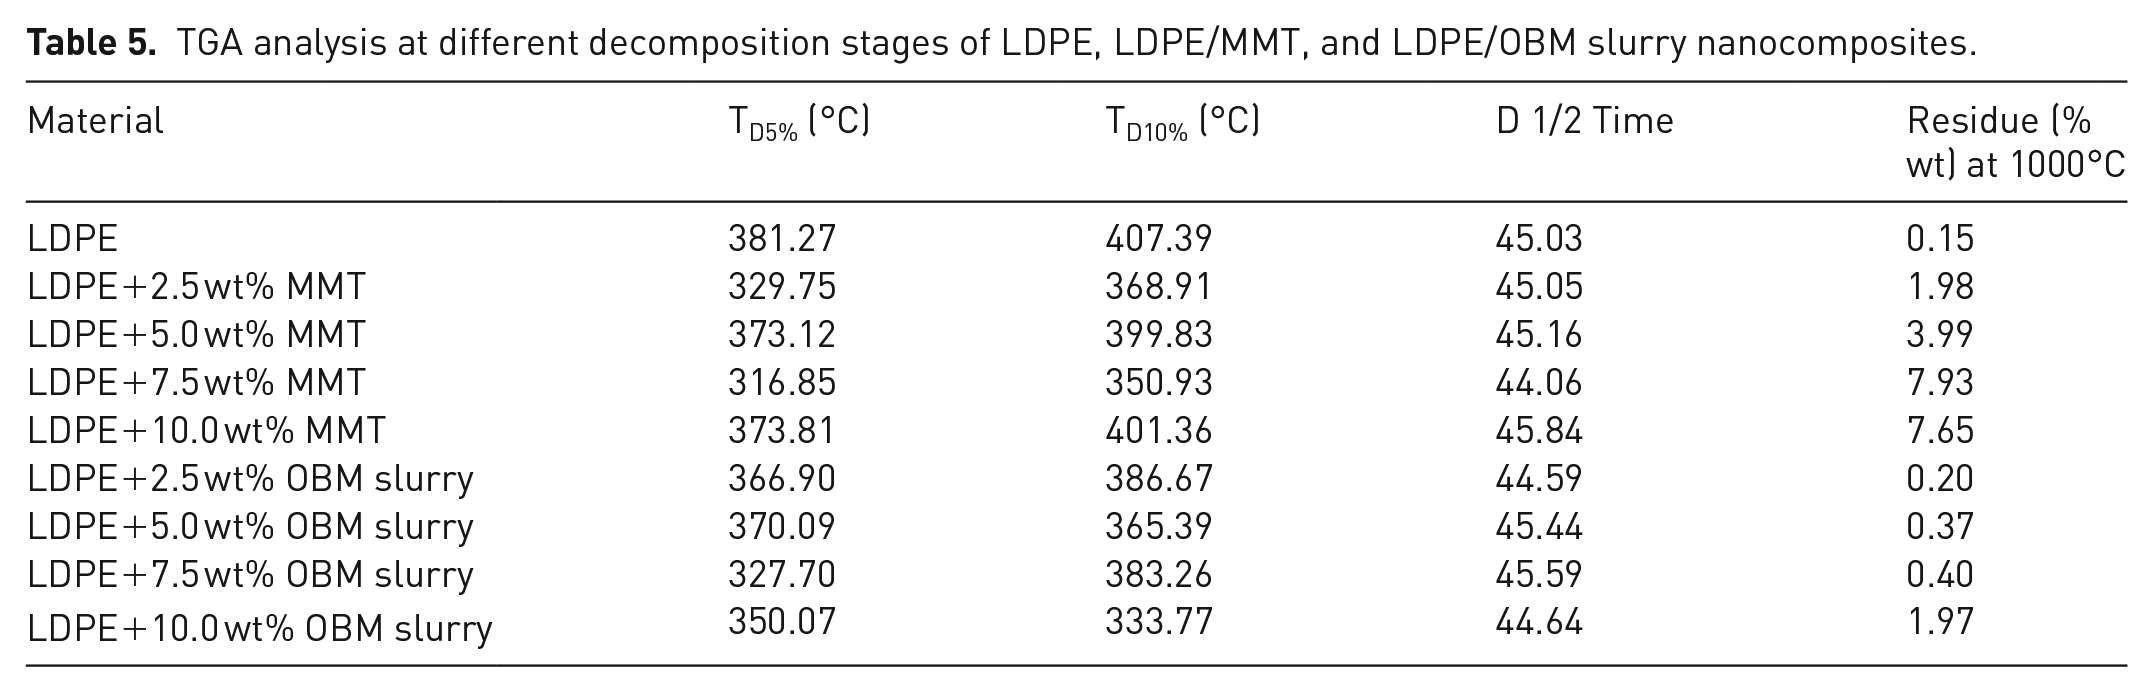
The onset degradation temperature of neat LDPE, LDPE/MMT, and LDPE/OBM slurry nanocomposite materials are presented at weight % losses of 5% and 10%. In all cases, the onset degradation temperature of nanocomposites is less than that of neat LDPE. There are no significant changes in D1/2 time (the time needed to reach 50% degradation), which indicates that the filler content may have no influence on degradation time and the increase in filler contents in nanocomposites may intensify the heat flow, which is shown by elevated temperature in D1/2 time. It is also noticeable, for both nanocomposites, that the residue remaining after 1000°C increases with the incremental wt% of fillers in nanocomposites. There is a big difference in residue amount (in %) left after TGA in the two nanocomposites, indicating that OBM slurry may have significant influence in decomposing LDPE matrix; this might be an interesting area to explore in the future.
Conclusion
The possibility of manufacturing novel, economically valuable engineering nanocomposite materials from OBM waste has been demonstrated. From the findings of different characterisations including morphology study, chemical and mineralogical study, and thermal study, it can be concluded that this waste is associated with critical raw materials for different industrial applications, environmentally significant materials including heavy metals, and potentially nanoclay as a green filler in nanocomposite manufacturing to improve mechanical, thermal, gas barrier and flame-retardant properties.
In concluding remarks, based on the results of the analyses it was found that OBM clay can be dispersed evenly compared with MMT in LDPE polymer. Furthermore, no significant new peaks were apparent in FTIR analysis, which confirmed the OBM clay minerals masked with the LDPE polymer chains, reflecting the compatibility of OBM clay with LDPE. LDPE with higher wt% OBM slurry filler loadings (7.5 and 10 wt% in this study) behaved as a thermally conductive material based on the specific heat capacity data reported in this study. Considering the results of the different analyses presented in this study, it can be highlighted that this OBM waste, currently considered as an environmental burden in the industry, can be utilised sustainably. Combined initiatives may lead to innovative technologies and approaches that may produce sustainable OBM waste management practices in oil and gas industries. Practical applications of reclaimed clay from OBM waste, as compared with those of commercial nanoparticles, in the area of engineering structural materials are currently under investigation in our laboratories, with promising results for the use of such clay mineral-rich OBM waste streams in structural components in the aerospace and automotive industries.
Footnotes
Declaration of conflicting interests
The authors declared no potential conflicts of interest with respect to the research, authorship, and/or publication of this article.
Funding
The authors received no financial support for the research, authorship, and/or publication of this article.