
Abstract
The purpose of this study was to investigate the effects of the concrete-representational-abstract–integrated (CRA-I) sequence on students with learning disabilities’ performance when learning fraction and decimal concepts. Three elementary-level students in Grades 4 and 6 participated in a single-case multiple probe across behaviors study. The intervention involved explicit use of fraction blocks, coins, base ten blocks, number lines, pictures, and abstract symbols to teach unit fractions, fraction and decimal equivalence, addition of fractions with unlike denominators, and writing fractions as decimals. The researchers demonstrated a functional relation between CRA-I and three different behaviors related to fraction concepts: decreased error in estimating fraction magnitude, addition of unlike fractions, and writing fractions as decimals. The findings show promise in the use of CRA-I for teaching fraction concepts to students with learning disabilities.
A recent systematic review of the fraction intervention literature for students with disabilities indicted that promising intervention practices were explicit instruction and the use of multiple representations (Ennis & Losinski, 2019). These findings echo those of Hwang et al. (2018) whose review concluded that fraction interventions that included multiple representations were effective for students with disabilities and students who struggle. The concrete-representational-abstract (CRA) sequence is an instructional approach that includes both explicit instruction and the use of multiple representations (Bouck, Satsangi, & Park, 2018). The CRA sequence has three stages of instruction that a teacher presents systematically, beginning with instruction using concrete or hands-on materials. Students use concrete materials while solving problems involving numbers and symbols (abstract tasks). These concrete models serve to visually and physically show a variety of mathematical concepts that include but are not limited to the meaning of numbers, operations, and mathematical properties (Agrawal & Morin, 2016). Once students master a concept during the concrete stage, the next stage is representational instruction. Students use pictures and drawings that illustrate mathematical concepts as they solve problems. Once students master concepts during the representational stage, they move to the abstract stage in which they solve problems using just number and/or symbols (Bouck, Satsangi, & Park, 2018).
Integrated CRA (CRA-I) is a variation of CRA in which the system for using concrete, representational, and abstract models is different. Instead of moving from one model to another (e.g., concrete to representational), models are combined and systematically faded (Strickland, 2016). For example, the first stage includes both concrete and representational models that aid students with solving abstract problems. Once students show mastery, concrete objects are removed and the second stage involves the use of representational models to solve abstract problems. The final phase is just like CRA and students use just numbers and symbols.
Since the aforementioned publication of the systematic reviews of fraction literature (Ennis & Losinski, 2019; Hwang et al., 2018), seven CRA or CRA-I studies have been conducted (Bouck et al., 2020; Bouck, Shurr, et al., 2018; Flores et al., 2018; Hinton & Flores, 2019; Flores et al., 2020; Morano et al., 2020; Flores et al., 2022). These studies led to improved student performance in addition of fractions with unlike denominators, fraction comparison, identification of fraction magnitude, unit fractions and fraction decomposition, equivalent fractions, representation of fractions as decimals (e.g., 4/10 = 0.4 and 1/4 = 0.25) and operations with decimals. Two of the studies included the use of virtual manipulatives with online applications (Bouck et al., 2020; Bouck, Shurr, et al., 2018) and the remaining studies used physical items as concrete models (Flores et al., 2018; Hinton & Flores, 2019; Flores et al., 2020; Morano et al., 2020; Flores et al., 2022).
CRA Fraction Research
Bouck, Shurr, et al. (2018) compared two different types of concrete manipulatives, fraction blocks based on a linear model and an online application that showed fractions based on a linear model. Two middle school students with mild intellectual disabilities and one middle school student with a learning disability participated in the study, learning how to add fractions with unlike denominators. Using an adapted alternating treatments design, the researchers alternated instruction using fraction blocks and an online application. The linear model presents numbers (fractions) using a rectangle or number line representation. Linear representations are more effective in assisting students with conceptual understanding of fractions and their magnitude as related to other numbers (Morano et al., 2019). Bouck, Shurr, et al. (2018) found that both the blocks and the online application were effective for students, meaning that their accuracy of calculation and independence in task completion were high. Bouck et al. (2020) used the same online application to teach fraction equivalence or addition of fractions with unlike denominators to middle school students with intellectual disabilities and autism spectrum disorders. Using a multiple probe across students design, the researchers showed a functional relation between virtual manipulatives and fraction skills. The use of technology to adapt CRA instruction is particularly relevant and informative for teachers, given the increased use of virtual instruction since the beginning of the COVID-19 pandemic (Long & Bouck, 2022). The remainder of the CRA and CRA-I studies did not use virtual applications, but physical materials.
Hinton and Flores (2019) worked with younger students, using the CRA sequence to teach fraction comparison to third-grade students receiving Tier-2 instruction within a multitiered system of support (MTSS). The researchers used CRA to teach three different mathematics concepts within third-grade state standards in a multiple probe across behaviors design. One behavior was fraction comparison. The students used area models and linear models across the concrete and representational phases of instruction. According to Morano et al. (2019), area models show fractions as space filled within different geometric shapes divided into equal parts (e.g., square, octagon, and triangle). Students used number lines and rectangular blocks (linear) and outlines of shapes and card stock pieces (area) during the concrete phase (Hinton & Flores, 2019). They shaded number lines and shaded pictures of shapes during the representational phase. There was a functional relation between CRA and accuracy in completing the three mathematical tasks. For fractions, there was an immediate effect with gradual progress to mastery for both students.
Flores et al., (2018) also taught students receiving Tier-2 interventions, but taught fraction concepts within fourth- and fifth-grade state standards using CRA: unit fractions, fraction decomposition, equivalent fractions, adding fractions with unlike denominators, writing fractions as decimals, placing decimals and fractions on a number line, and adding decimals (e.g., 0.4 + 0.24). The CRA materials were linear fraction blocks used with number lines, printed area models with card stock pieces, base 10 blocks with area models, and coins used with number lines. The researchers taught 17 fifth-grade students in four different small groups using a preexperimental design, comparing pretest and posttest scores. Students made significant gains with an average pretest performance of 45% to a posttest accuracy of 91%.
Flores et al., (2020) used the same materials and procedures to teach another group of fifth-grade students receiving Tier-2 instruction. Researchers compared the performance of students who received CRA with that of peers receiving Tier-2 instruction from their general education teachers (business as usual). The researchers taught 17 students as a whole group during an intervention period. The students who received CRA instruction made significant gains, increasing from an average of 46% accuracy at pretest to 89% accuracy at posttest. The CRA group performed significantly better than the business-as-usual group who made no gains.
CRA-I Fraction Research
Strickland (2016) noted that CRA-I provides students with an easier transition between phases. When moving from the first CRA-I stage (concrete, representational, and abstract) to the second CRA-I stage (representational, abstract), students did not have to adjust to an entirely different representation. Therefore, Morano et al., (2020) modified the Flores et al.’s (2020) materials for teaching unit fractions, fraction equivalence, and adding unlike fractions for CRA-I instruction. Morano et al., (2020) compared CRA and CRA-I fraction instruction, teaching fifth- and sixth-grade students with disabilities. Morano et al., (2020) used a researcher-created assessment addressing unit fractions, equivalent fractions, and adding fractions with unlike denominators. They also used the fraction number line estimation test (Bailey et al., 2017) that had been used by other researchers (Fuchs et al., 2013, 2016). This test presented fractions and students marked the fractions’ magnitude on number lines that extended from zero to two.
The researchers randomly assigned matched pairs of students to either CRA or CRA-I instruction and used a pretest and posttest design. Students in both groups received instruction from their special education teacher within their regularly scheduled mathematics instructional time in a resource room. Morano et al. (2020) found that both groups made significant gains. The CRA group improved from an average of 23% accuracy to 91% accuracy and the CRA-I group increased from an average of 21% to 93% accuracy. Students in both groups made significant gains in estimating the magnitude of a given fraction on a number line. Both groups decreased their average error from 26% to 29% to about 5%. There was not a significant difference between students’ performance based on instructional sequence. However, the researchers noted a difference between the interventions’ implementations. Students in the CRA-I group moved through the program faster with eight lessons compared with 14 lessons for CRA.
Given the condensed nature of the CRA-I fraction intervention from Morano et al., (2020), Flores et al. (2022) investigated its use as a Tier-2 intervention implemented by a fifth-grade general education teacher. The study took place in a high-need school (100% of students received free or reduced-price lunch) in which most of the students (88%) were from underrepresented groups. The researchers used a quasi-experimental design, matching students who received the CRA-I intervention with their peers who used a computer-based self-instructional program for Tier-2 intervention. The researchers compared each group’s performance on their state-mandated assessment. Before and after the study, students in the CRA-I group completed the number line estimation test (Bailey et al., 2017) that Morano et al., (2020) used. For 2 weeks, a general education fifth-grade teacher implemented the program with 28 students in a whole-group setting during their intervention time. This group performed better on the state-mandated assessment than their peers who did not receive intervention. Students in the CRA-I group also decreased their average error on the number line estimation test, decreasing their errors from 20% to 5%.
Rationale for Current Study
The CRA and CRA-I line of fraction research has more studies implemented with students who struggle and received tiered MTSS instruction than students with disabilities. Students with learning disabilities participated in two studies. Bouck, Shurr, et al. (2018) included one student with a learning disability. Within Morano et al. (2020) instructional groups, a little more than half of the students had learning disabilities. However, for these interventions to be regarded as evidence-based instead of promising for students with learning disabilities, more research is needed. In addition, Rojo et al. (2023) conducted a meta-analysis of the rational number intervention research and found few studies that included decimals and percentages. They emphasized the importance of understanding rational number notation using decimals in upper elementary grades and a need for additional research (Rojo et al., 2023).
Given the promising modification of a CRA fraction intervention to a CRA-I intervention with fewer lessons (Morano et al., 2020; Flores et al., 2022), and the need for more research related to decimal notation (Rojo et al., 2023), the current researchers sought to modify and combine materials to teach fraction and decimal concepts using CRA-I. They modified Flores et al.’s (2020) and Flores et al.’s (2018) CRA decimal materials and incorporated them with Morano et al., (2020) CRA-I fraction manual and materials to teach both concepts to students with learning disabilities, showing two notations for rational numbers. Although CRA and CRA-I had been compared and found to be similar in effect on student outcomes, there had not been a study focused on students with learning disabilities for both fraction and decimal concepts. Therefore, the research questions were as follows:
Method
Research Design
The researchers used a multiple probe across behaviors single-case design. The independent variable was CRA-I fraction instruction and the three dependent variables were as follows: (a) understanding of fraction magnitude as measured by their average error when estimating fractions (placing fractions on a number line that extends from 0 to 2), (b) understanding of unit fractions and equivalence as defined by accuracy in adding fractions with unlike denominators, and (c) understanding of the relation between decimal and fraction numbers as defined as writing a given fraction as a decimal.
All students began in baseline for all three dependent variables. Students remained in baseline for the first behavior (average error for fraction estimates) until there were 5 stable data points. The researchers defined stability as the last 3 data points in baseline not varying more than 5% from the mean of the baseline data path. Changing to the next phase or behavior was dependent upon the presence of a stable baseline and student performance. Students remained in baseline for the second behavior until they had achieved two consecutive estimate error data points below their mean of baseline. Students remained in baseline in the third behavior until they achieved two consecutive probes above baseline for adding fractions if they had a stable baseline for the third behavior or the data path moved in the opposite direction from expected learning. There were at least 5 data points in each phase. The researchers defined mastery of each behavior as follows. Mastery of fraction magnitude was estimation error of 5% or less based on the performance of students in previous research (Morano et al., 2020; Flores et al., 2022). Mastery of addition with unlike denominators and decimal identification was three consecutive probes at 100% accuracy. Once students met these criteria, the researchers administered probes less often. There were no maintenance or generalization phases.
Data Analysis
For visual analysis, the researchers constructed graphs with y-axes that showed the dependent variables: percentage of average error, percentage of accurate sums, and percentage of decimals correct. The researchers constructed graphs according to recommendations for ordinate scaling and data points per x- to y-axis ratio (Dart & Radley, 2018). The y-axes ranged from 0% to 100%. The researchers visually analyzed the data and noted the following: (a) the level of data paths (mean), (b) the range of data paths (distance between the least and greatest data points in the path), (c) immediacy of effect (space between the last baseline data point and the first intervention data point), and (d) percentage of nonoverlapping data points, a simple metric for magnitude of change (Scruggs & Mastropieri, 2013; percentage of nonoverlapping data [PND]). The researchers calculated baseline corrected τ (Tarlow, 2017) using an online calculator (Tarlow, 2016).
Setting
The study took place in a rural elementary school in the southeastern United States that enrolled 710 students in prekindergarten through sixth grade. About 60% of the students qualified for free and reduced-price meals. The school’s racial demographics were as follows: (a) 78% White, (b) 18% African American, (c) 3% Latinx, (d) less than 1% Native American, and (e) less than 1% Asian American. The intervention occurred in a resource classroom that was the same size as the general education classrooms in the school. The researchers provided instruction to students at a table during their regularly scheduled time for special education services in mathematics. Instructional time was 30 min, 4 days per week, for approximately 4 weeks during the late spring. There were two instructional groups: One group consisted of two fourth-grade students (each participated in the study), and the second group contained three sixth-grade students (one participated in the study). The two other sixth-grade students had needs in fraction operations, but not the third behavior. The students had permission for instruction, but the researchers did not include them in the study. Given the design (across behaviors), the researchers planned for adjusting instructional groups based on the individual student’s progress. There were two researchers: If one student met the criterion for phase change, one researcher taught that student the new behavior while the other researcher continued instruction with the other student. The researchers were qualified to implement the intervention because they had designed the related manuals and implemented them in previous studies (Flores et al., 2018; Flores et al., 2020; Morano et al., 2020). They were certified special education teachers with at least 10 years of experience as university faculty and intervention researchers.
Participants
The criteria for participation were as follows: (a) parent permission and student assent to participate according to an institutional review board–approved protocol, (b) eligibility for special education services under the category of learning disabilities, and (c) demonstrated needs in fraction and decimal understanding as defined as less than 50% correct on a probe with items requiring addition of unlike fractions and writing fractions as decimals, and 10% or more average error on the fraction number line estimation test given prior to intervention. The probes and the fraction number line estimation test are described in the following section. The researchers collected demographic data according to the guidelines set forth by Rosenberg et al. (1994). Each student was eligible for special education under the category of learning disabilities. According to state criteria, students could be eligible using one of three procedures: (a) a 16-point discrepancy between a student’s academic achievement and predicted achievement (derived from a cognitive ability score using a regression table), (b) lack of response to intervention within MTSS, ruling out all other disability categories, or (c) a marked pattern of strengths and weaknesses. The researchers administered the Operations subtest of the Key Math-3 (Connolly, 2007) diagnostic assessment prior to the study. Information regarding the socioeconomic status of individual students was not available; only school demographics were available. English was the first language for each of the participants. All students spent 80% of the school day in general education and received special education services in the areas of reading and mathematics, with IEP goals in each area. Using pseudonyms, student descriptions follow.
Don
Don was an 11-year-old White male in the fourth grade. Don’s achievement on KeyMath-3 Operations subtest score was below the average range, with a standard score (SS) of 81. His cognitive ability was significantly below average (SS = 66) according to the Wechsler Intelligence Scale for Children (Wechsler, 2014; WISC). Don did not meet the criteria for intellectual disability because he had developmentally appropriate adaptive behavior. Don’s understanding of fractions prior to the study follows. He added fractions as 1/5 + 1/10 = 2/15. When writing a fraction as a decimal, he wrote 1/4 as 0.14. Examples of his fraction estimation errors were marking a fraction such as 7/6 as halfway between 0 and 1 and marking 1/19 as one whole.
Fred
Fred was a 10-year-old White male enrolled in the fourth grade. Fred’s KeyMath-3 Operations subtest score was below the average range (SS = 83). According to the WISC, his cognitive ability was within the average range (SS = 85) according to the last full evaluation. Fred’s understanding of fractions prior to the study follows. When given an equation such as 1/5 + 1/10 =, he consistently arrived at a sum of 6/10. A common error when writing a fraction as a decimal was to write the denominator as a hundredth (e.g., 1/4 = 0.04). Fred’s consistent fraction magnitude error was to write a fraction such as 4/3 as less than 1.
Jane
Jane was a 12-year-old White female enrolled in the sixth grade. Jane’s KeyMath-3 Operations subtest score was below the average range (SS = 83). According to the WISC, her cognitive ability was below average (SS = 81) according to the last evaluation. Jane’s understanding of fractions prior to the study follows. When given an equation such as 3/8 + 1/2 =, she consistently arrived at a sum of 4/10. When asked to write a fraction as a decimal, she wrote 4/10 as 4.10. Examples of her fraction estimation errors were marking a fraction such as 7/6 as less than 1 and marking 1/19 as 1 or 2.
Assessment Materials
Using items from pretests and posttests deemed as valid and reliable (Flores et al., 2018; Flores et al., 2020; Morano et al., 2020), the researchers created probes for three behaviors (four items for each behavior): fraction estimation using a number line, adding fractions with unlike denominators (e.g., 1/6 + 1/3 = __), and writing a fraction as a decimal (e.g., 1/4 = __ or 6/100 = __). There were five different forms of the probes. The fraction operation and fraction to decimal items came from pretests and posttests used in previous research that had Spearman–Brown reliability scores of .91 and .92. The items were judged by intermediate elementary mathematics teachers and deemed valid in previous research. The researchers used all items from the number line estimation test (Bailey et al., 2017) to measure students’ fraction magnitude understanding. This assessment had high internal reliability with α = .96 (Bailey et al., 2017). Each item presented a number line (17.5 cm in length), labeled with a 0, 1, and 2. A fraction or mixed number was written above the number line (1/3, 7/4, 12/13, 1 11/12, 3/2, 5/6, 5/5, 1/2, 7/6, 1 2/4, 3/8, 1 5/8, 2/3, 1 1/5, 7/9, 1/19, 1 5/6, and 4/3). Students marked the number line to show the magnitude. Of the fraction magnitude items on a probe, each of the following rational numbers were represented: a proper fraction less than 1 (5/6), an improper fraction (7/4), and a mixed number (1 5/6).
Assessment Procedures
The researchers administered probes during baseline and intervention phases. During intervention, the researchers administered the probes at the beginning of instructional sessions prior to any instruction. This is very important to note because it is different from a schedule in which probes are completed at the end of an instructional session. This schedule required that students remembered their learning from a previous day rather than completing a probe immediately following explicit instruction with modeling, guidance, and feedback.
The researchers gave probes in order of 1 to 5, so that students did not see the same probe within the same week. There was no time limit for the probes. The researcher gave the probe to students, asked them to complete each item, doing the best they could. When the students finished, the researcher gave no feedback other than praise for attempting the items.
The researchers scored each fraction estimation item using the procedures from Bailey et al. (2017). This involved measuring the point at which the student marked the number line in centimeters. Next, they found the absolute value of the difference between that number and the actual position of the given fraction. They divided the absolute value by the numerical range of the number line (17.5 cm) and multiplied that by 100. The researchers scored the fraction operation items as the correct sum without requiring it to be in simplest form (e.g., 3/6 was a correct sum and 1/2 would have been counted correct). The researchers scored the fraction to decimal items correct if the decimal was equal to the fraction (e.g., 7/10 = 0.7 and 0.70).
Instructional Materials
The instructional materials were grouped according to the following three behaviors: (a) decomposing/composing fractions and showing the process using a number line, (b) adding fractions with unlike denominators that involved finding an equivalent fraction, and (c) writing fractions as decimals. Each learning sheet across all behaviors had three sections labeled, Model, Guided Practice, and Independent Practice under which there were four tasks in each.
Materials for Behavior 1
The materials for the first CRA-I stage of decomposing fractions included learning sheets with simple word problems describing a situation in which multiple unit fractions were combined and items in which a fraction was given with an equal sign and a long line onto which the given fraction was decomposed into its unit parts (e.g., 3/5 = 1/5 + 1/5 + 1/5). These items were accompanied by space for assembling rectangular fraction blocks and number lines. The number lines extended from 0 to 2 and had faint equally spaced lines between each whole (8, 10, or 12 faint lines) that assisted in dividing the number line into equal spaces between 0 and 1 and 1 and 2 according to the given fraction. For example, a number line corresponding to fifths had 10 faint lines between each whole, and a number line corresponding to thirds had 12 faint lines between each whole. For CRA-I Stage 2, the materials did not include blocks. For CRA-I Stage 3, the materials did not include number lines.
Materials for Behavior 2
For adding fractions with unlike denominators, the learning sheets included items related to equivalent fractions followed by items requiring addition. For equivalency, there were word problems describing situations in which one determined equivalent fractions and items with partially completed equations (e.g., 2/5 = ⸋/10). During CRA-I Stage 1, the materials were rectangular fraction blocks and number lines corresponding to each denominator as described above. During CRA-I Stage 2, the materials did not include blocks. During CRA-I Stage 3, they did not include number lines. Materials for adding fractions with unlike denominators presented simple word problems describing situations in which fractions with unlike denominators were added and items with only a fraction addition equation. During CRA-I Stage 1, materials for solving these items were rectangular fraction blocks and number lines corresponding to each denominator. During CRA-I Stage 2, these items were just number lines. During CRA-I Stage 3, students solved items without blocks and number lines.
Materials for Behavior 3
The materials for teaching fractions to decimals included incomplete equations with a fraction and an equal sign. To solve these, the materials were base ten blocks (ones and tens) and sheets of paper with squares divided into equal parts. One square had 10 equal parts that were the same size as the tens blocks and another square had 100 equal parts that were the same size as the ones blocks. The sheets with squares were also used for shading without the blocks. Another set of materials for solving these were coins (quarters and dimes) and number lines labeled $0 to $1, with either four equal parts for placing quarters or 10 equal parts for placing dimes. During CRA-I Stage 1, items were solved with base ten blocks, coins, numbers lines, and shading. During CRA-I Stage 2, these items were solved with shading and a number line with pictures of coins. During CRA-I Stage 3, the materials only presented the incomplete equation. Table 1 summarizes materials and content for lesson implementation.
Summary of CRA-I Fraction and Decimal Intervention Lessons.
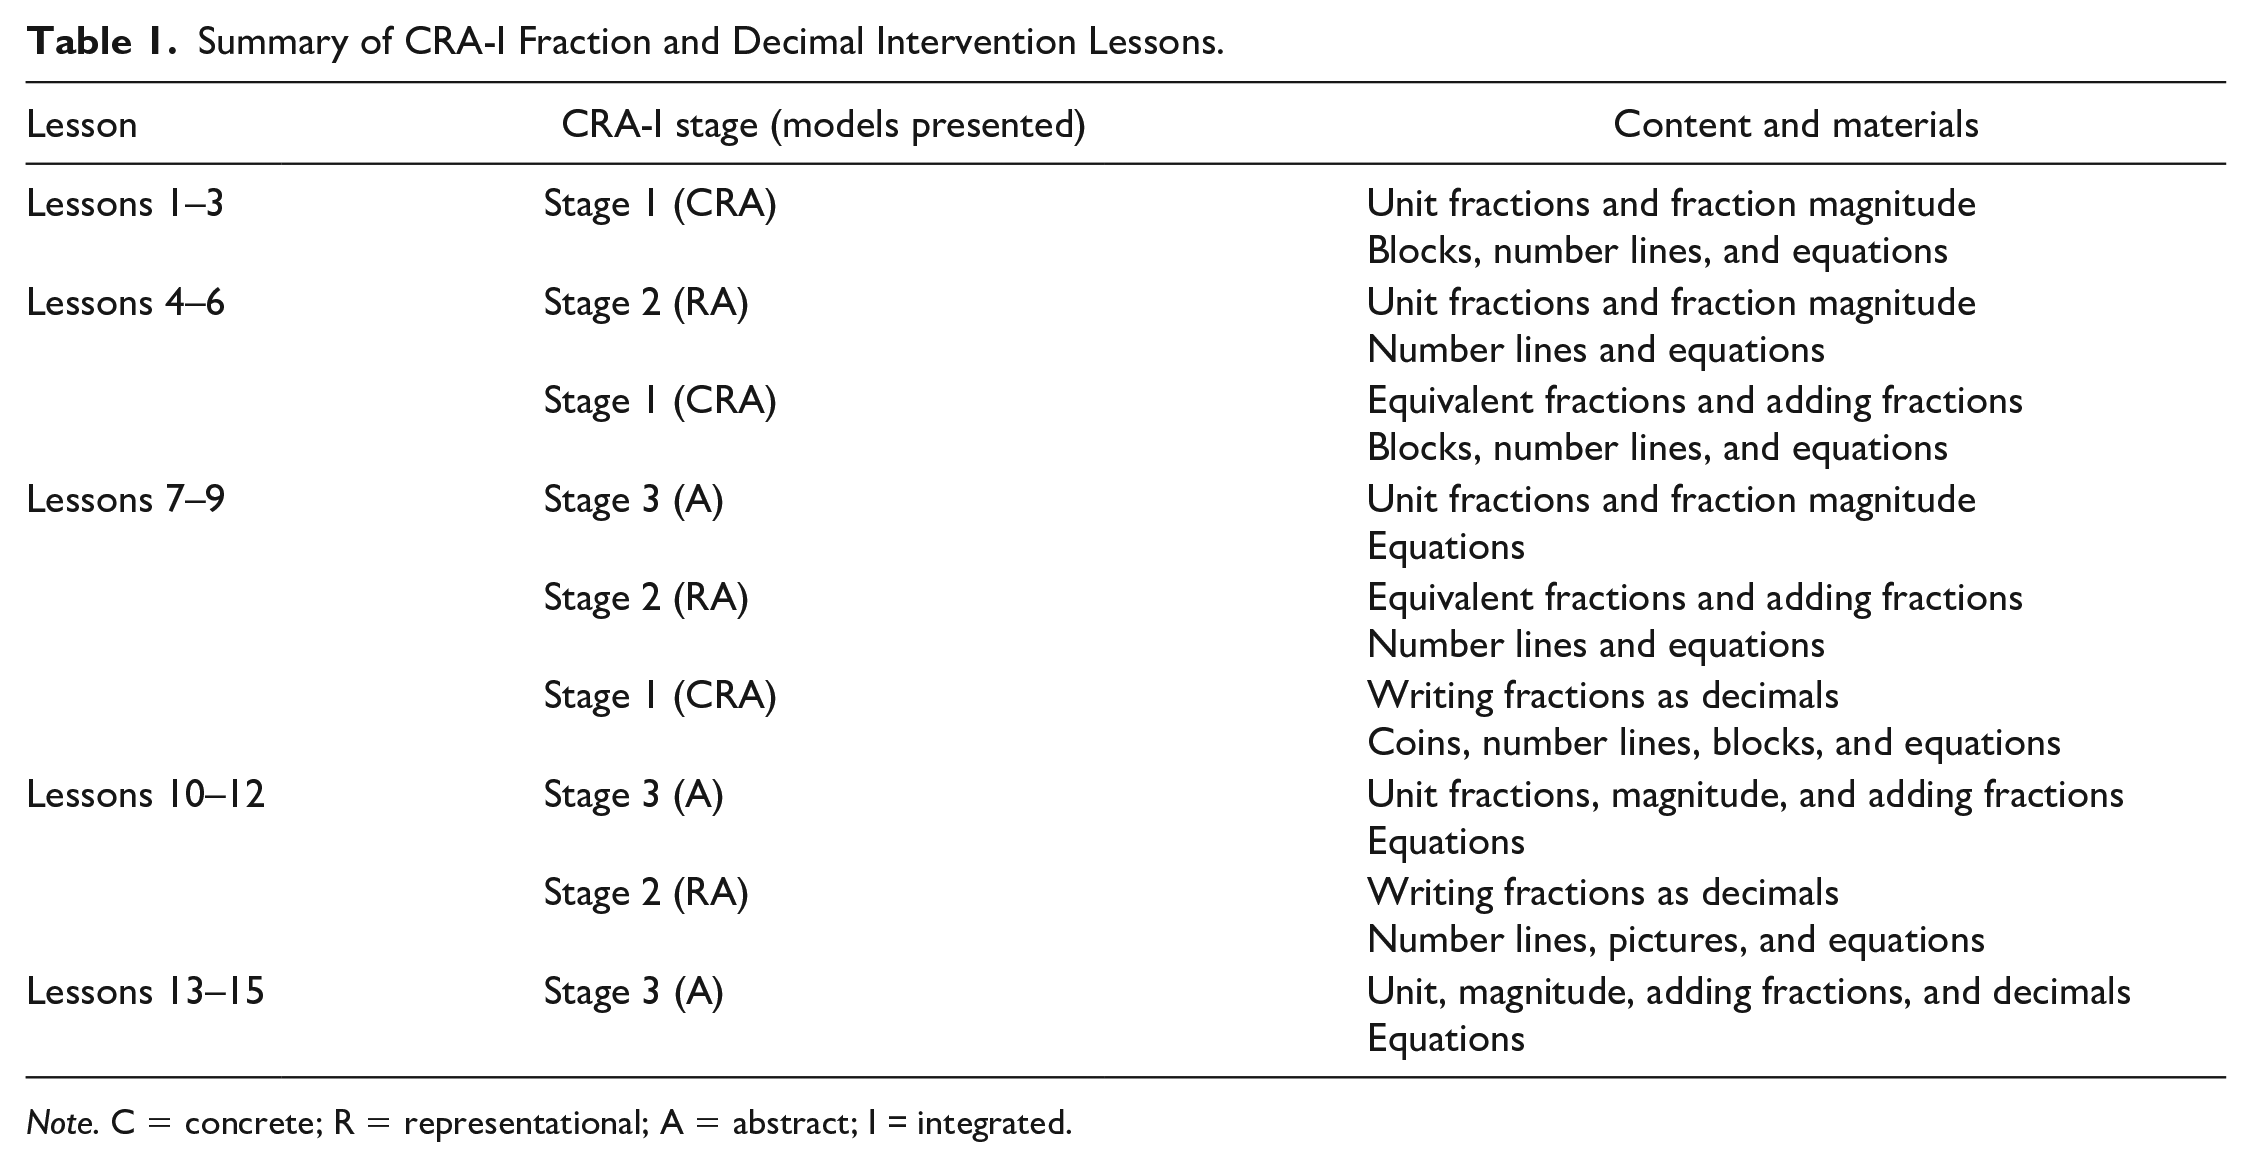
Note. C = concrete; R = representational; A = abstract; I = integrated.
Instructional Procedures
The instructional procedures came from a manual used by Morano et al. (2020), with additional content from a manual used by Flores et al., (2020) and Flores et al., (2018). The manual had pictorial directions and samples scripts that the researchers used to follow the following procedures.
Baseline Procedures
All students began in baseline prior to instruction. The students came to the classroom. They completed a probe and did not receive any feedback. This left much time in their mathematics period. Therefore, the researchers provided instruction in subtraction with regrouping because items on the KeyMath3 showed needs in this area. The researchers used base ten blocks and equations to show subtraction and the regrouping process. The researchers did this to ensure that the students received useful mathematics instruction and there were no other opportunities for fraction instruction during their mathematics time prior to intervention. No data related to subtraction were collected.
Explicit Instruction Procedures
Instructional procedures across all behaviors included an introduction, telling students what they would be doing, and how. For example, “Today, we will make fractions using blocks and number lines. I will show you and you will repeat things and count with me. We will make fractions together, and then you will make fractions using blocks and number lines all by yourself.” Next, the researcher modeled the target skill, keeping students engaged by asking questions about information stated (e.g., “The unit fractions in the equation all have the same denominator. What is the same about these unit fractions?”) and asking students to count with her (e.g., “Let’s count the parts in the whole together”). Then, the researcher conducted guided practice in which the students completed a given task with the researcher, each taking a turn (e.g., the researcher found blocks corresponding to a given fraction and the students divided the number line into equal parts according to the given fraction). Next, students completed independent practice in which the researcher observed students as they completed items. Finally, the researcher ended the lesson with a verbal summary of the lesson and preview of the next.
CRA-I Procedures
The CRA-I sequence has three stages and the first includes all representations. For each behavior, Stage 1 will be described in detail. The procedures for Stage 2 and Stage 3 will only include information that was not included in Stage 1.
Decomposition/Composition of Fractions
During CRA-I Stage 1, when given a simple word problem or fraction, the researcher used explicit instruction and taught students to systematically use blocks (concrete) and a number line labeled from 0 to 2 (representational) to compose or decompose a fraction using an equation (abstract). If given a fraction such as 6/5, they found fraction blocks that showed fifths from a box that contained fraction blocks from halves to twelfths. They divided a given number line into fifths from 0 to 1 and from 1 to 2 (using the faint lines to assist in making equal parts). They systematically put down a block and shaded the number line as they made an equation for decomposition (6/5 = 1/5 + 1/5 +1/5 +1/5 +1/5 + 1/5). They discussed why they used addition signs in the equation. They discussed that the sum of all the unit fractions had the same units; the units did not change. Word problems presented composition of a fraction such as someone needing 1/4-pound patties of ground beef for a cookout in which they needed eight patties. They systematically added the fractions to determine the sum. In such an example, they talked about needing 2 whole pounds of meat, which was the same as their sum, 8/4. During CRA-I Stage 2, they made equations (abstract) with number lines (representational) by marking and shading. During CRA-I Stage 3, they solved equations without any hands-on or visual supports (abstract).
Adding Unlike Denominators
There were two parts to this behavior. They learned how to make equivalent fractions and applied that concept when adding fractions with unlike denominators. The CRA-I stages for each will be described.
During CRA-I Stage 1, they solved simple word problems and incomplete equations that showed a fraction, an equal sign, and a partial fraction (e.g., 2/3 = ⸋/6). The word problems included a situation such as someone needing half cups of an ingredient, but they lost that measuring cup and they only had a 1/4-cup measuring cup. They solved these items using fraction blocks, obtaining blocks according to each denominator (concrete) and dividing number lines into equal parts for each whole according to each denominator (representational). They made the given fraction using the blocks and shading the number line. Next, they systematically shaded and added blocks until the second fraction was equivalent to the first. They discussed how the numerator and the denominators changed, but that the magnitude of the fraction did not.
They used the materials to learn an equation (abstract) for determining the equivalent fraction: the fraction with the smallest units equals the product of the fraction with the larger units multiplied by a fraction equal to 1 (e.g., 2/6 = 1/3 × 2/2). When showing the equation, the researcher talked about multiplication of any number by 1; fractions are numbers and multiplying a fraction by 1 does not change its magnitude, it just changes its numerator and denominator. The researcher showed them how to find the fraction equal to 1 using the blocks and the shaded number line; the proportion of largest to smallest units was the numerator and denominator in the fraction equal to 1. For example, there are two-sixths for each third, so one would multiply 1/3 by 2/2 to make the equivalent fraction with sixths (2/6).
Next, they applied their learning about fraction equivalence to addition equations with unlike denominators. Word problems presented situations in which two unlike fractions were added and other items simply presented equations. The researcher and the students talked about how they could not solve the equations in their current form because the units were not the same. They used the process described above, making the fractions equivalent. Next, they rewrote the equation and solved it. During CRA-I Stage 2, they shaded number lines to make equivalent fractions and add fractions with unlike denominators. During CRA-I stage, they only used the equation for equivalence to add fractions with unlike denominators.
Writing a Fraction as a Decimal
During CRA-I Stage 1, they continued to apply what they knew about equivalent fractions, making tenths into hundredths or hundredths into tenths, using base ten blocks and an area model (square divided into 10 or 100 equal parts). They showed that 7/10 is the same as 70/100 by filling the area model with blocks; it took 70 ones blocks to fill the same space as seven tens blocks. After making 7/10 with blocks, they wrote it as a decimal, 0.7; they did the same with 70/100, writing 0.70. They talked about how they were the same amount. In addition to the base ten blocks (concrete), they shaded the area models (representational). Students learned about benchmark fractions and decimals, such as 1/4, 1/2, and 3/4 using coins (quarters and dimes) and number lines marked from $0.00 to $1.00. The number lines were divided into 10 equal parts (tenths) between $0.00 and $1.00 and four equal parts (fourths) between $0.00 and $1.00. The researcher placed dimes on each tenth, and quarters on each fourth. When given 3/4, they found the number line with fourths, placed quarters at each one-fourth, and put their finger on 3/4. They talked about the value of three quarters. It was 75 cents or 75/100, which was written as 0.75 in decimal form. During CRA-I Stage 2, they shaded area models and used number lines with pictures of dimes and quarters rather than actual coins. CRA-I Stage 3 involved writing decimals.
Given the explanations above, the CRA-I sequence developed from Stages 1 to 3 for each behavior. Until a student met the criteria for phase change according to the research design, no activities in the successive behavior were presented. When a student met the criterion for phase change, the researchers presented the next behavior’s items and procedures for CRA-I Stage 1. When a behavior was added, items from previous concepts continued to appear in the lesson, in or progressing toward Stage 3 (abstract). When Don met criteria for phase change for Behavior 3 (decimals) before Fred, the other researcher presented Don with Stage 1 CRA-I instruction with decimals. Fred continued instruction with the first researcher until he met criteria.
Treatment Integrity and Interobserver Agreement
The researchers collected treatment integrity data using treatment fidelity checklists that had been used in previous research studies. There were checklists for each behavior across CRA-I stages. Checklists were consistent in the categories for behaviors associated with explicit instruction: introduction, model, guided practice, independent practice, and lesson ending. For example, a behavior associated with modeling was keeping students engaged by asking students to repeat information that was stated or counting with the researcher. Across phases, there were categories for behaviors associated with the use of materials and explanations of concepts. For example, in CRA-I Stage 1, the researcher should talk aloud while finding blocks that will be used to show a fraction. This included emphasizing that there should be a certain number of equal parts in the whole based on the denominator and obviously discriminating between blocks that should be chosen or should not be chosen.
The researcher who did not implement instruction observed 25% of the lessons across all behaviors, phases, and students. This researcher watched and completed the treatment integrity checklist. The researcher noted the presence or absence of each behavior on the checklist. Treatment fidelity was calculated as the number of behaviors observed divided by the total number of behaviors on the checklists.
The researchers calculated interobserver agreement for 100% of the probes in baseline and intervention across all behaviors and students. One researcher scored the probes after instruction. Another researcher who was not involved in the implementation scored the probes at a later date. For the fraction estimation items per probe, each researcher added all the lengths of student estimates on a probe and divided the smaller sum by the larger sum. They multiplied that quotient by 100. For fraction operation and fraction to decimal items per probe, researchers used a point-by-point method in which they noted their agreement/disagreement by item. They calculated interobserver agreement by adding all the agreements and dividing that sum by the total number of agreements and disagreements. They multiplied that quotient by 100.
Social Validity
The researchers use the framework described by Snodgrass et al. (2022) when planning social validity assessment. Students’ perception of their competence, change in that perception after the study, and their perception of the intervention and its related materials were important. Because the students received special education services in reading, the researchers avoided a survey/questionnaire and instead interviewed students before and after the study. An interview with questions used in previous research allowed for probing questions. Before the study, they asked students whether they liked working with fractions, whether working with fractions was easy, and whether they needed any help in understanding fractions. After the study, they asked whether students were better at working with fractions and what they thought of using each representation (blocks, number lines, base ten blocks, and coins). The researchers asked what students liked best about the intervention and what they liked least. They asked whether there was anything they would change for next time and whether students would recommend the intervention to other students.
Results
Don
The results for Don are shown in Figure 1. For percentage of average error for fraction estimation, the baseline level was 22%, with a range from 15% to 28%. An immediate change in level was found from last the baseline data point (22%) to the first intervention data point (11%). The intervention level was 9%, ranging from 1% to 24%. Two data points overlapped with baseline for PND of 75%. Baseline had no trend (τ = –.200, p = .806). Without baseline correction, τ calculated was –.562, p = .028 (SEτ = .324). Don’s average percentage of error for fraction estimates decreased to 3% by the end of the study.
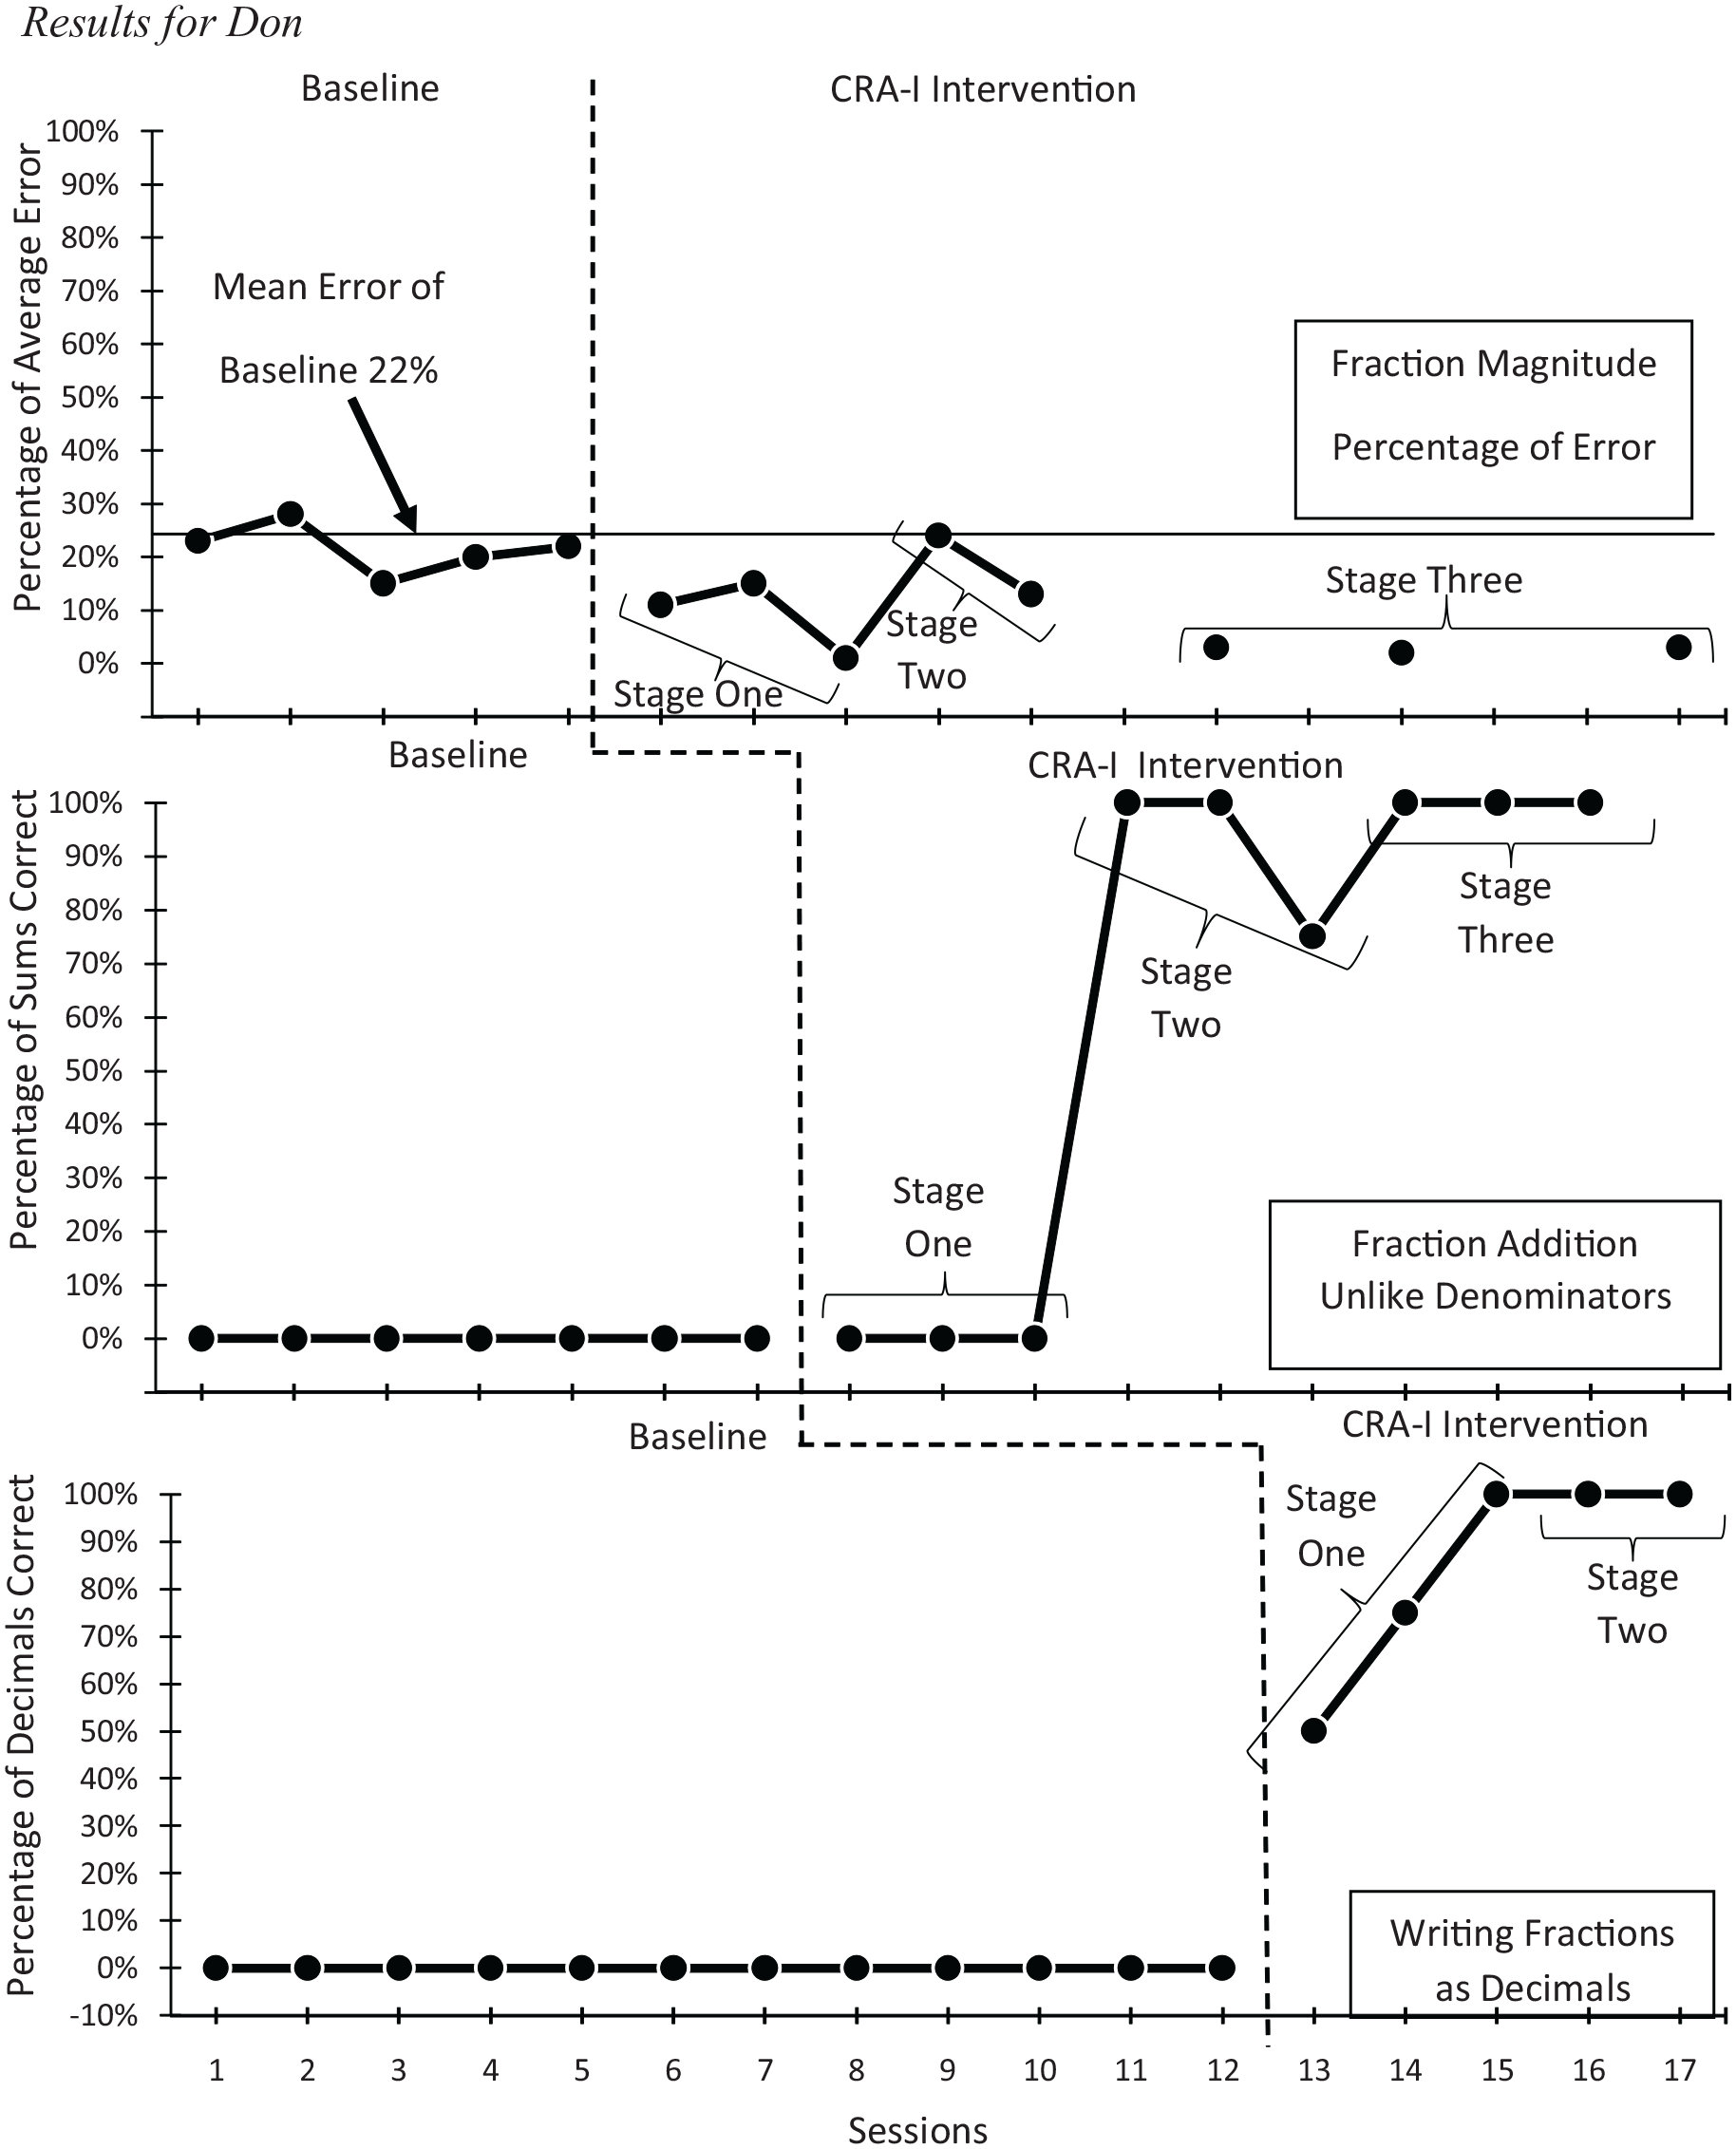
Results for Don.
For percentage of accurate sums, Don’s baseline level was 0% with all data points at 0%. No immediate effect was found with an intervention level at 64% and data points from 0% to 100%. Three data points overlapped (PND = 67%). The baseline had no trend (τ = .000, p = 1.000). Without baseline correction, τ calculated was .656, p = .011 (SEτ = .267). For percentage of correct decimals, Don’s baseline level was 0% with all data points at 0%. An immediate effect was found from the last baseline data point (0%) to the first intervention data point (50%). The intervention level was 85%, with a range from 50% to 100%. The PND was 100%. The baseline had no trend (τ = .000, p = 1.000). Without baseline correction, τ calculated was .946, p = .000 (SEτ = .111). Data are available in Figshare.
Fred
The results for Fred are shown in Figure 2. For percentage of average error for fraction estimation, the baseline level was 11% with a range from 3% to 28%. An immediate change in level was found from last baseline data point (10%) to the first intervention data point (1%). The intervention level was 2%, ranging from 1% to 3%. Two data points overlapped with baseline (PND = 78%). The baseline had no trend (τ = –.105, p = 1.000). Without baseline correction, τ was –.728, p = .004 (SEτ = .259). Fred’s average percentage of error for fraction estimates decreased to 2% by the end of the study. For percentage of accurate sums, Fred’s baseline level was 0%, with all data points at 0%. No immediate effect was found because the first intervention data point was 0%. The intervention level was 61%, with a range from 0% to 100%. Four data points overlapped (PND = 64%). The baseline had no trend (τ = .000, p = 1.000). Without baseline correction, τ calculated was .613, p = .011 (SEτ = .263). For percentage of correct decimals, Fred’s baseline level was 13%, with data ranging from 0% to 25%. Intervention level was 67%, with data points ranging from 25% to 100%. Three data points overlapped for PND of 50%. The baseline had no trend (τ = .140, p = .617). Without baseline correction, τ calculated was .670, p = .003 (SEτ = .241). Data are available in Figshare.
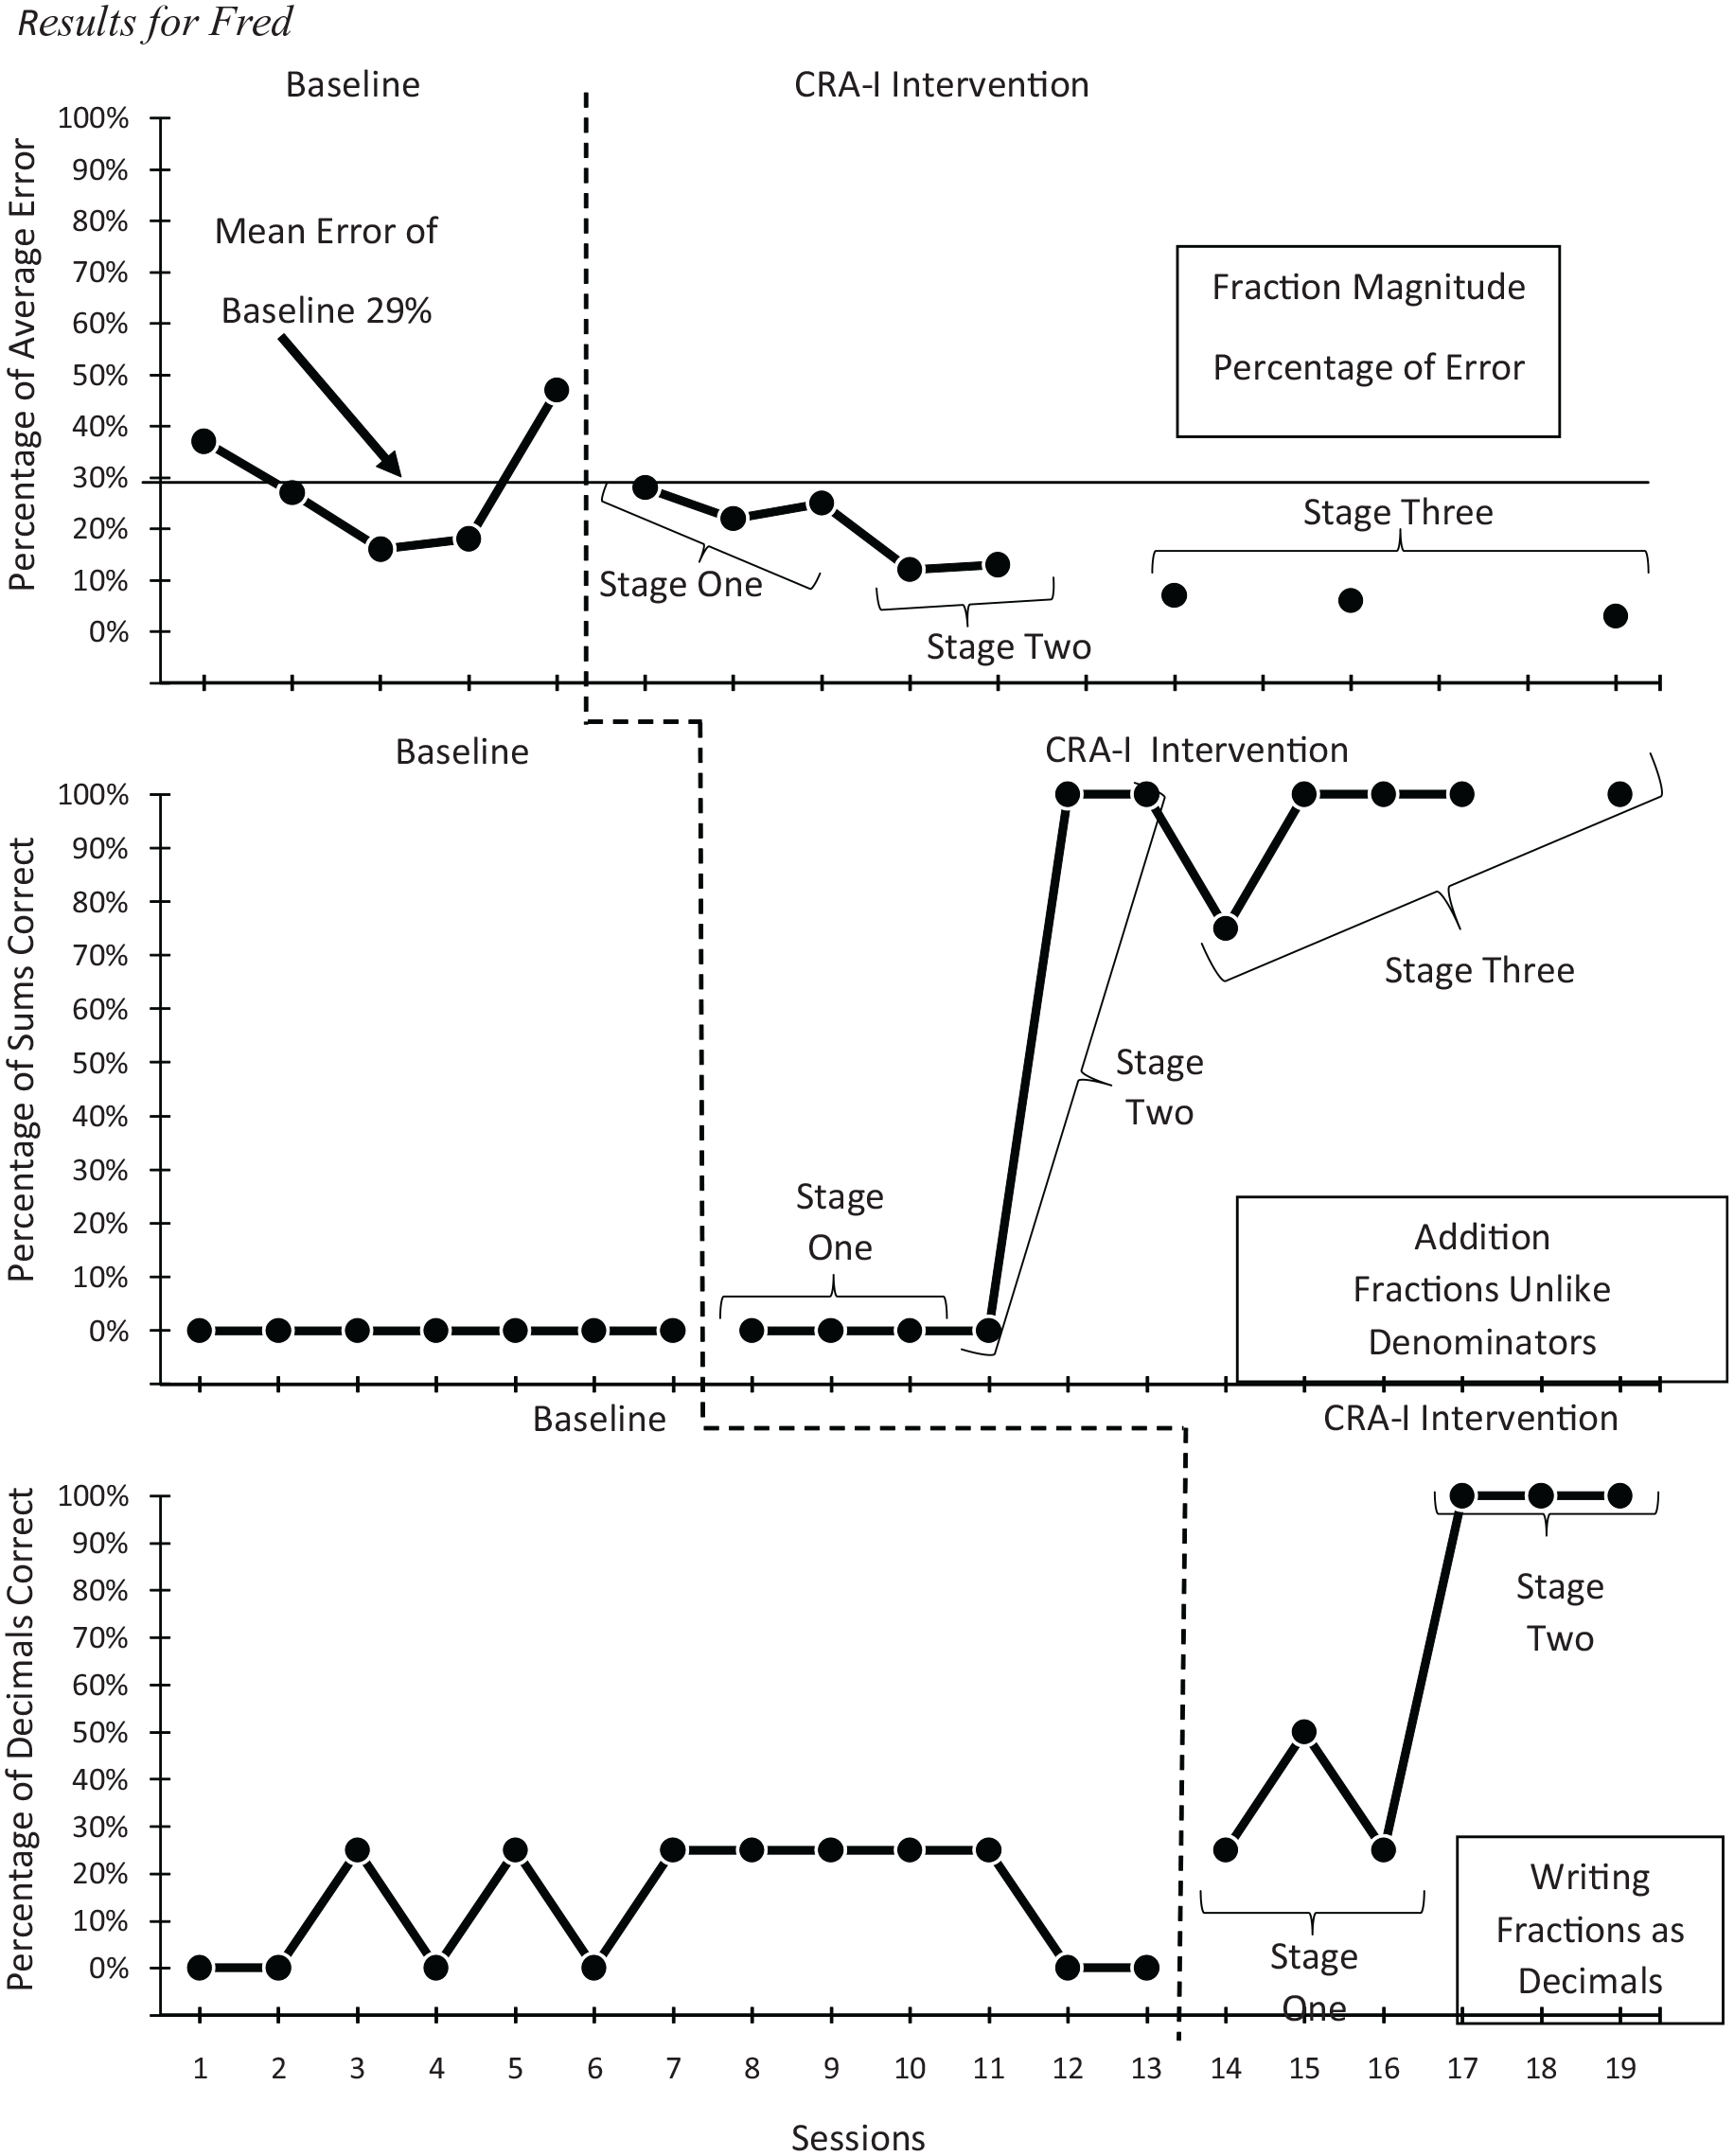
Results for Fred.
Jane
The results for Jane are shown in Figure 3. For percentage of average error for fraction estimation, the baseline level was 29%, with a range from 16% to 47%. The last baseline data point was 47% and the first intervention data point was 28%; although this met the definition of immediate effect, this score was not particularly different from other baseline scores. The intervention level was 13%, ranging from 3% to 28%. Three data points overlapped with baseline for PND of 67%. Jane’s average percentage of error for fraction estimates decreased to 3% by the end of the study. The baseline had no trend (τ = .000, p = 1.194). Without baseline correction, τ was –.487, p = .045 (SEτ = .330). For percentage of accurate sums, Jane’s baseline level was 0%, with all data points at 0%. An immediate effect was not found because intervention level was 61%, with data points ranging from 0% to 100%. Three data points overlapped for PND of 67%. The baseline had no trend (τ = .000, p = 1.000). Without baseline correction, τ was .656, p = .011 (SEτ = .267). For percentage of correct decimals, Jane’s baseline level was 0% with all data points at 0%. An immediate effect was found; the last baseline data point was 0% and the first intervention data point was 75%. The intervention level was 95%, with a range from 75% to 100%. There was no overlap between baseline and intervention (PND = 100%). The baseline had no trend (τ = .000, p = 1.000). Without baseline correction, τ was .971, p = .000 (SEτ = .080). Data are available in Figshare.
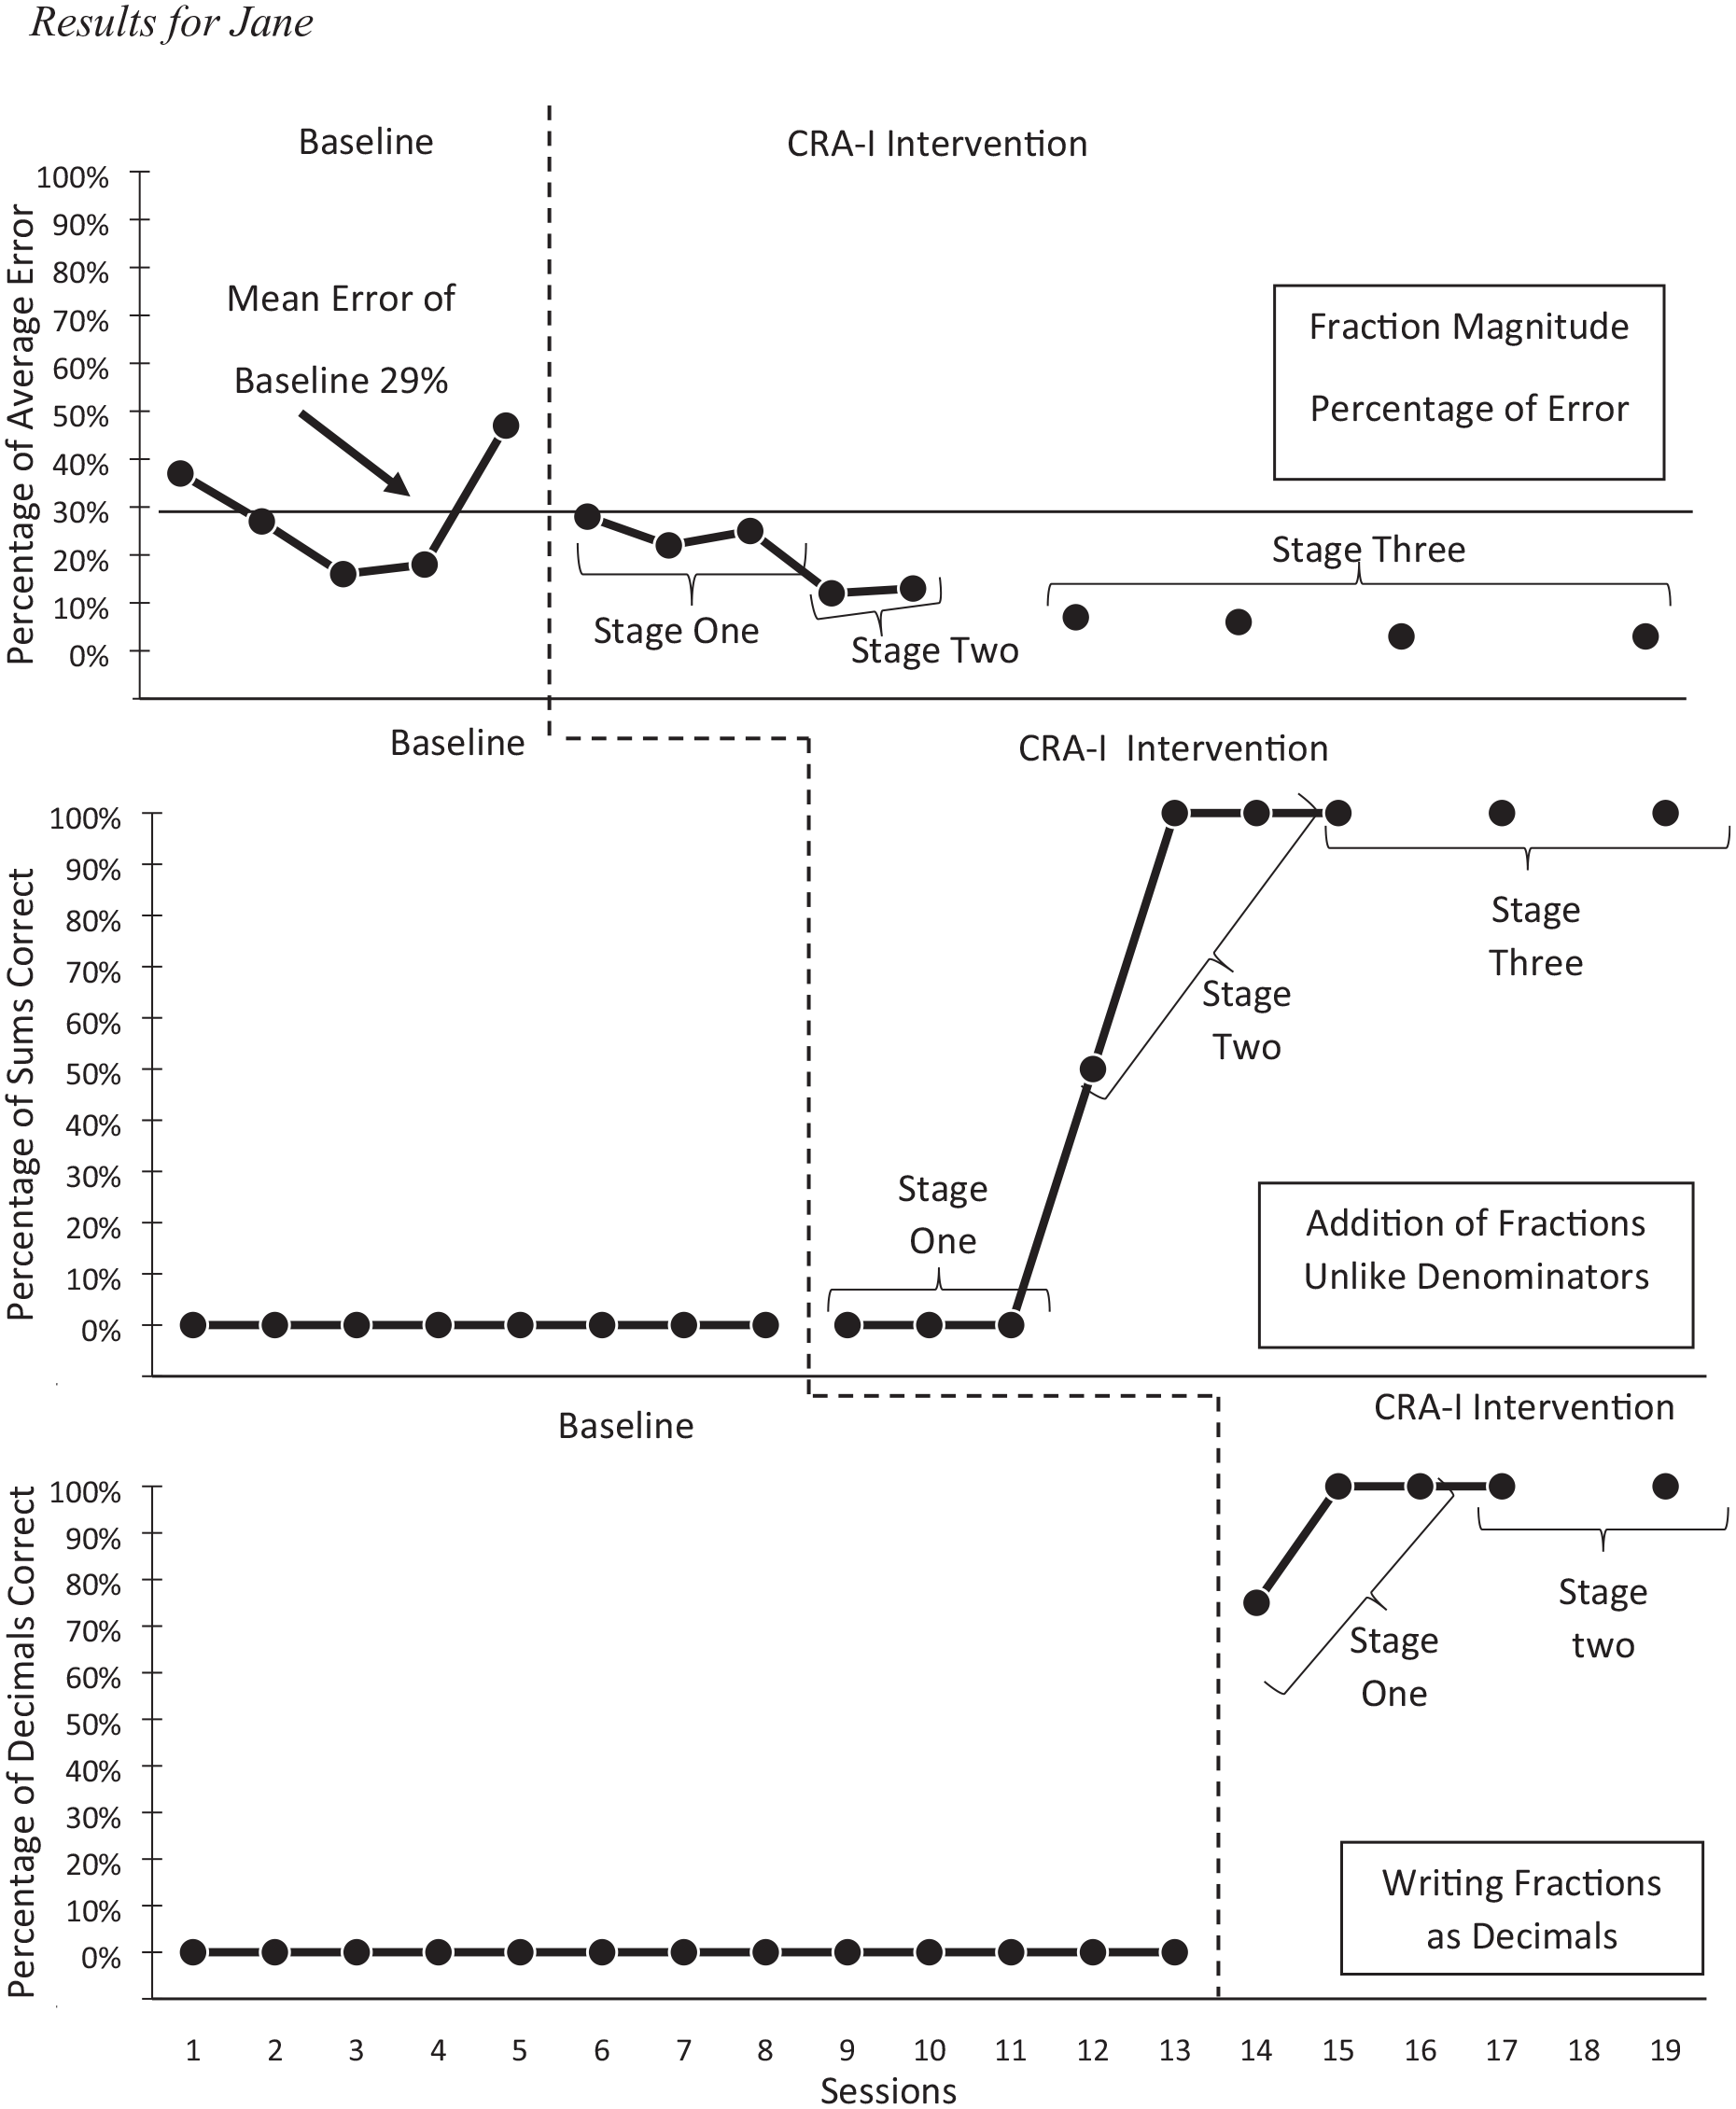
Results for Jane.
Treatment Integrity and Interobserver Agreement
Treatment integrity was 100% across lessons for each student. Interobserver agreement for Don’s probes was as follows: 99.3% (fraction estimation), 100% (addition unlike fractions), and 100% (fractions to decimals). Interobserver agreement for Fred’s probes was as follows: 99.9% (fraction estimation), 100% (addition unlike fractions), and 99% (fractions to decimals). Interobserver agreement for Jane’s probes was as follows: 99.3% (fraction estimation), 100% (addition unlike fractions), and 100% (fractions to decimals).
Social Validity Results
Before the study, students reported that fractions were difficult sometimes, and that they may need help sometimes. However, across students, they specifically noted the ease with which they added fractions. The researchers observed that each student effortlessly added fractions with unlike denominators; however, each consistently used erroneous approaches (e.g., 3/4 + 1/8 = 4/12 or 3/4 + 1/8 = 4/8). After the study, each student reported that they liked using blocks, number lines, base ten blocks, and coins. Across students, using blocks was their favorite way of working with fractions. When asked what they would change, each student referred to the number line estimation probes. They reported that completing probes by marking fractions on number lines was difficult, and that they would not recommend making students complete that task. When the researcher probed further about these responses, each student said that they were better at estimating fractions after the study and the difficulty of the task decreased. Each of the students reported that they would recommend the intervention to other students.
Discussion
This study investigated the effects of CRA-I on three different concepts related to fractions and decimals. There was a functional relation between CRA-I and learning related to fraction and decimal concepts for each student. There were three effects for three different behaviors at three different points in time. There was a functional relation for each student.
The first concept was fraction estimation of magnitude taught through experiences related to composing and decomposing fractions with linear models. All students decreased their percentage of error to 3% (Jane) or 2% (Don and Fred). The students’ percentage of error at the end of the study was within the same range as students who participated in previous studies (Flores et al., 2022; Morano et al., 2020) in which students (including students with learning disabilities) achieved 5% or less percentage of error. This is significant because previous fraction research by Fuchs et al. (2013, 2016) found decreases in error to 20% and 17%.
The second concept was addition of fractions with unlike denominators in which students reached 100% accuracy after intervention, such as in Bouck, Shurr, et al.’s (2018) study. Prior to intervention, Don and Jane did not understand unit fractions and how this knowledge related to operations. Their baseline and overlapping intervention probes exemplified this because they consistently added numerators and denominators, as did students in Flores et al., 2018, Morano et al. (2020) studies in pretests. Fred may have had some developing understanding of unit fractions without knowing how to use it. His consistent behavior was to find a sum using the smallest unit and adding the numerators (e.g., 1/2 + 1/8 = 2/8). Despite completing independent practice problems accurately at the end of each Stage 1 lesson, all students continued their same erroneous approaches to operations on probes. Use of blocks, number lines, and unit fraction experience did not transfer to their performance when given a probe at the beginning of the next session. However, it is important to note that the probes were abstract with no supports and the students received no feedback on their performance. For the students in this study, four to five lesson opportunities with visual and hands-on supports and repeated thinking aloud were needed to connect the equations shown in the probes to the lesson activities in which they solved similar equations. In previous research (Morano et al., 2020), students added unlike fractions, making similar errors; however, the nature of group design masked the learning that occurred from pretest to posttest, specifically the timeline for mastery of this specific skill.
During CRA-I Stage 2 for the second behavior, students showed progress. At times, students talked aloud to themselves when completing probes, parroting thinking aloud that occurred within previous lessons with unit fractions, fraction equivalence, and adding unlike dominators. Anecdotal evidence showed that, when completing probes that showed increase in accuracy, students said things such as, “I can’t add the fractions,” “The units are not the same,” or “I have to do something before I can add.” This was different from behaviors observed in baseline and during Stage 1 when students completed equations using erroneous approaches quickly, without hesitation, and/or with comments about the ease of the task.
All students reached mastery in adding fractions with unlike denominators, three consecutive probes at 100% accuracy. The amount of overlap in this phase led to moderate metrics of magnitude of change (τ = .61–.65). Given this study’s design, calculations for magnitude of change include many consecutive assessments of the behavior that led to 100% accuracy. Both this and previous research (Morano et al., 2020) produced similar results for students with learning disabilities: 93% (Morano et al., 2020) and 100% accuracy in adding fractions with unlike denominators. The benefit of this design is important for practitioners because they should expect gradual progress on abstract tasks as students’ conceptual understanding develops across CRA-I stages. The activities in Stages 1 and 2 are meant to inform students’ approaches to abstract tasks. Frequent data collection associated with single-case design assists in showing such effects that are not apparent in group designs.
The third concept was writing a given fraction as a decimal. Don and Jane made immediate progress after the first lesson in Stage 1 of CRA-I, with increases from 0% accuracy to 50% and 75%, respectively. During Stage 1, Fred’s probes overlapped with baseline. However, the correct item was different from the items that he identified correctly during baseline. The items on Fred’s probes in baseline were not consistent, meaning that probes with 25% accuracy contained responses that changed (e.g., 1/2 written as 0.02 or 0.5, or 7/100 written as 0.700, 0.0007, or 0.07). All students showed progress in writing benchmark fractions (e.g., 1/2, 1/4, and 3/4) before writing tenths and hundredths as decimals. All students had three probes at 100% accuracy during Phase 2 of CRA-I for the third behavior. These scores are consistent with the results from studies of Flores et al. (2018, 2020).
Limitations and Future Research
This study was limited by implementation in late spring, which prevented the researchers from collecting maintenance data during the same school year. Future research should include maintenance, especially as students encounter more complex concepts and algorithms associated with rational numbers in successive grade levels. Implementation of the intervention by researchers is another limitation. The researchers’ reasoning for their implementation was that lessons from two different studies were combined and/or modified for CRA-I. However, data regarding feasibility are limited because a practitioner did not implement. Future research should include training for a professional who implements the intervention under natural circumstances. The research design limits the study’s generalizability beyond the three participants and comparison of its effects with another intervention. Future research can address this limitation with more students who can be randomly or systematically assigned to different explicit interventions. Another limitation of the design was the researchers’ criterion for phase change; requiring 3 data points above/below baseline prior to their phase change would have presented a stronger case for learning because 3 data points define a slope of change.
Implication and Conclusion
This study adds to the fraction intervention literature for students with learning disabilities by showing effects for three students across behaviors using CRA-I. The design allowed for observation of each student’s progress to mastery for each behavior, whereas designs used in previous related research did not provide results for these focused observations (Flores et al., 2020; Morano et al., 2020). Additional research is needed to conclude that it is an evidence-based practice. One promising feature of this study is its inclusion of decimal numbers and their relation to fractions. There are procedures associated with operations with decimals; the inclusion of equivalent fractions and their corresponding decimals allowed for discussion during decimal lessons about how and why students used those procedures in their other mathematics work (e.g., writing 0.5 as 0.50 when adding to a number such as 0.25). Changing the notation is necessary because 0.25 is 25/100 that can only be added to a fraction with a denominator of 100 (e.g., 0.50 that has the same magnitude as 0.5).
The intervention was brief, teaching multiple fraction and decimal concepts within 15 lessons. The lesson length (30 min) is conducive to implementation during supplementary instruction with a special education teacher. More research is needed to investigate the feasibility of such implementation. The activities within CRA-I allow teachers to address gaps in conceptual understanding. According to baseline, it was not clear whether students had foundational understanding of fractions as numbers and the coordination between numerators and denominators. However, using blocks and number lines allowed for visual and hands-on experience in making fractions, a foundational fraction concept. In teaching more advanced fraction concepts (decomposition/composition and operations), CRA-I assisted in filling that gap.
Finally, the idea of filling gaps in understanding is important for special education teachers. Don and Fred learned concepts from grade-level standards and engaged in activities that improved their understanding of concepts from previous grades (e.g., understanding that allows for fraction comparison in third grade). It is not necessary to hold students back and provide instruction at their lowest level of understanding. Instead, they can be part of the CRA-I process in using different representations. The concepts taught in this study come from fourth-grade standards. Although Don and Fred lacked foundational understanding of fractions as numbers, the interactions with CRA-I materials allowed for improvement in critical foundational areas of understanding, so that they could advance to mastering grade-level standards.
Footnotes
Declaration of Conflicting Interests
The author(s) declared no potential conflicts of interest with respect to the research, authorship, and/or publication of this article.
Funding
The author(s) received no financial support for the research, authorship, and/or publication of this article.