
Abstract
This study investigates the influence of banana fibre particle reinforcement on the fracture behaviour of biopolymer composites under Mode I loading using the J-integral approach. The fracture response was analysed for three distinct fibre particle sizes. A two-dimensional compact tension specimen was modelled and analysed using ABAQUS finite element software. For each particle size, six different initial crack lengths were considered. The results indicate that the biopolymer composite reinforced with 150 µm particles exhibits the lowest J-integral values, whereas the 65 µm reinforced composite shows higher J-integral values than the 300 µm reinforced composite. This suggests that the 150 µm reinforced biopolymer demonstrates superior resistance to fracture initiation, which is attributed to its higher Young’s modulus. Furthermore, among the three composites investigated, the 150 µm reinforced material also exhibits the lowest crack tip opening displacement (CTOD), indicating enhanced resistance to crack initiation. For all particle sizes, both the J-integral and CTOD increase with increasing initial crack length, while the stress level at locations away from the crack tip remains relatively stable. Overall, this study provides a comparative assessment of the fracture resistance of banana fibre particle-reinforced biopolymer composites, contributing to a better understanding of particle size effects on fracture performance.
Introduction
An important factor in material integrity is the ability to evaluate defects that inevitably occur over its service lifetime, as these defects affect the mechanical properties. Therefore, proper methods are required to assess and determine defect severity throughout the material’s service life.1,2 Fracture mechanics provides a framework for understanding material failure under various loads. It is important in engineering and materials science, offering insights into why materials fail and enabling the prediction of potential failure points. Fracture mechanics enables the determination of the potential growth of a pre-existing crack or defect in homogeneous, isotropic materials under different loading conditions. Under Mode I, a crack usually develops by kinking in a way that preserves a pure Mode I condition at the end of it. 3 Barsoum et al. predicted the fracture toughness, fracture initiation, crack propagation, and mode of crack extension of polypropylene subsea pipes due to internal pressure.
The authors reported good agreement between the numerical and experimental results. 4 By analysing stress, strain, and crack propagation, fracture mechanics helps assess the integrity of structures under real-world conditions and identify weaknesses in materials. Additionally, it plays a key role in enhancing performance through improved design techniques.
The advantage of fracture mechanics is its ability to characterise crack instability independently of the specimen’s shape. 5 Lauke 6 observed that particle debonding, voiding, and subsequent yielding of polymer composite have a close relationship with fracture toughness, though it depends on the debonding criterion, critical stress, or critical energy. The authors concluded that the energy criterion leads to a debonding process that induces fracture toughness independent of particle size. Zhu and Joyce 7 emphasise the importance of standards and guidelines for choosing an appropriate fracture parameter to characterise fracture toughness for the material of interest, and for measuring the fracture toughness value defined either at a critical point or in a resistance curve format using laboratory specimens, using criteria like the J-integral, CTOD, and other related fracture mechanics methods.
Qayyum et al. 8 describe the J-integral as a powerful and essential tool for characterising the resistance of materials to crack propagation, particularly when they undergo both elastic and plastic deformation. This approach is based on Linear Elastic Fracture Mechanics (LEFM) or Elastic-Plastic Fracture Mechanics (EPFM), as the J-integral applies to both linear and nonlinear material responses and measures the intensity of stress or strain fields at the crack end. The J-integral is calculated across multiple contours to verify contour independence, yielding the possible elastic strain energy release rate associated with crack initiation from the measured displacement field.9,10 If the J integral or the stress intensity factor K exceeds the critical fracture toughness values, K1C or JC, this will lead to the onset of crack initiation and subsequent propagation, which can result in catastrophic failure of the entire structure. 11
According to LEFM, the material is assumed to behave elastically in regions far from the crack, except for a small region of inelastic deformation at the crack tip. Fracture resistance is quantified by the stress-intensification factor (K) or the strain energy release rate (G). The energy that is discharged in the course of crack propagation is a basic characteristic of the material, and it does not depend on the size of the part. 12 This method for obtaining valid fracture toughness is only suitable for extremely brittle materials. The EPFM is employed to expand the applicability of small-scale testing in engineering and materials science. 13 The modelling has been achieved by applying the finite element method (FEM), non-linear material behaviour to determine the fracture behaviour of composite materials.14,15 FEM is another essential technique for developing test geometries, understanding the behaviour and effects of aspect ratios, and accounting for material plasticity. 16
In FEM, researchers have employed various methods to evaluate the J integral, including the Contour Integral Method, Cohesive Zone Modelling, the Virtual Crack Closure Technique (VCCT), and the modified Virtual Crack Closure Technique (mVCCT).17–19 Ding, W. Xu noted that the J integral is simpler and more accurate for measuring the mode I fracture toughness of a composite. 20 In addition, the J integral can be evaluated experimentally, making a critical J value an attractive elastic-plastic fracture criterion. 21
This study evaluates the fracture characteristics and simulates crack behaviour in biopolymer composites incorporating different particle sizes. Linear elastic fracture mechanics is employed to model various crack-length configurations using ABAQUS, with the J-integral adopted as the fracture parameter. The primary objective is to identify how the initial crack length and particle size exhibit the highest resistance to the onset of crack initiation. This investigation is significant, as improved understanding of these fracture properties can support the development of more durable and reliable biopolymer composites for a wide range of applications.
Fundamental theories and mechanisms of J integral
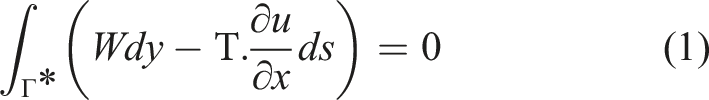
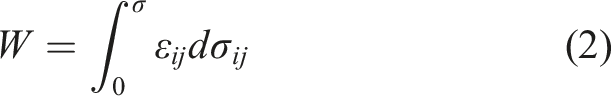
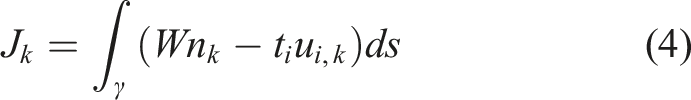
The J Integral was developed by J Rice and is based on the line integral of all paths surrounding the crack tip, as shown in Figure 1, to obtain an approximate stress intensity factor in elastic and elastic-plastic materials, which is given by the equation below
22
J Integral contour.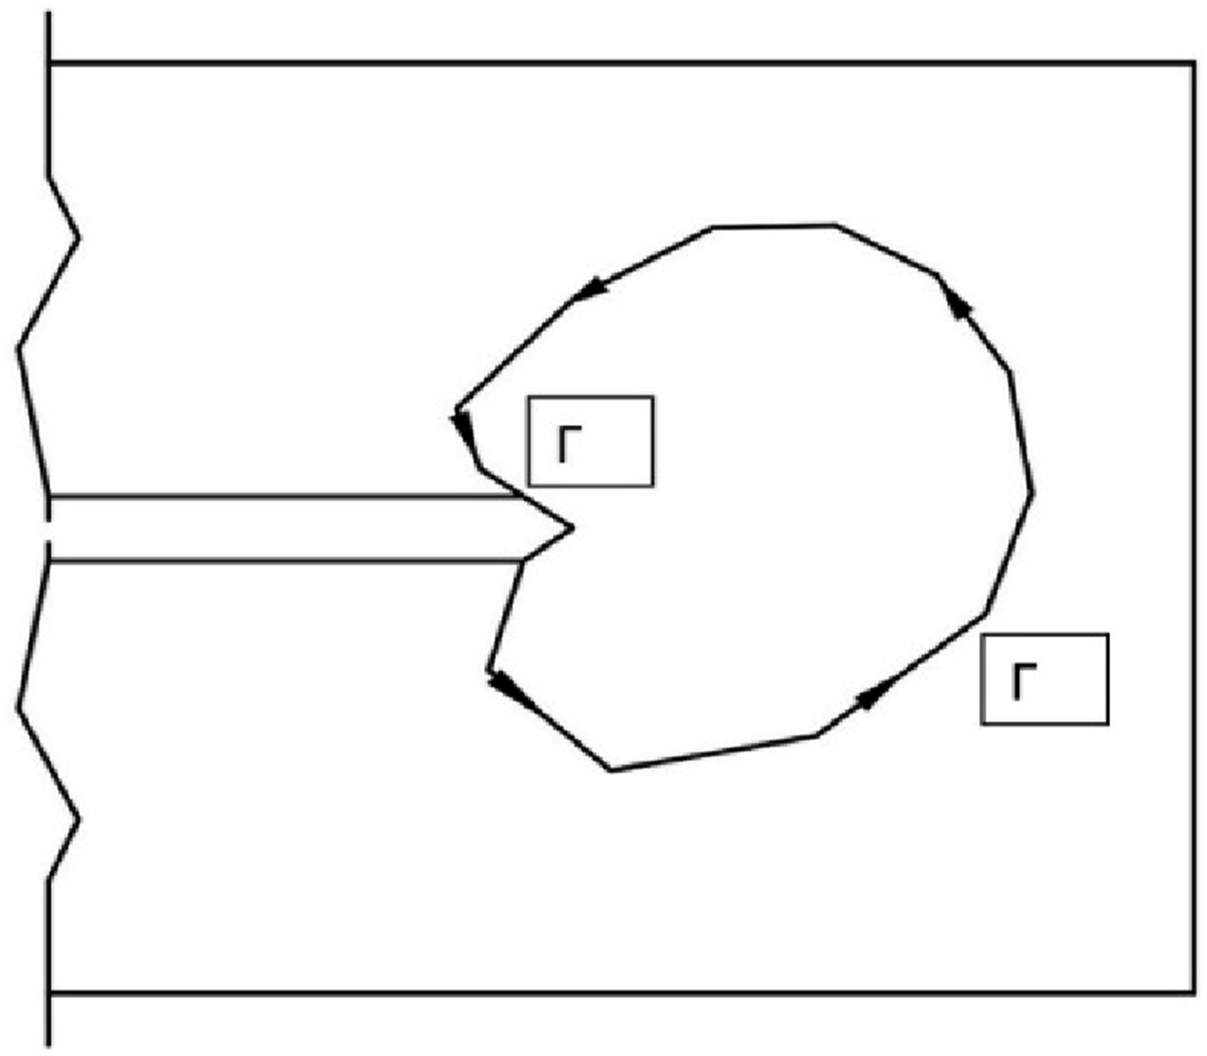
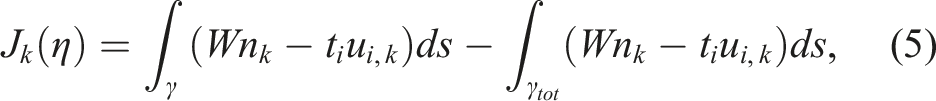
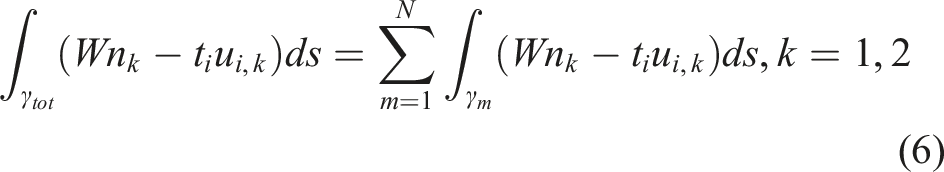
The following is the 3-D J-Integral and Stress Intensity Factor Model derived from the Rice equation. It is the sum of a surface integral in the domain and a line integral along a path Γ23,24
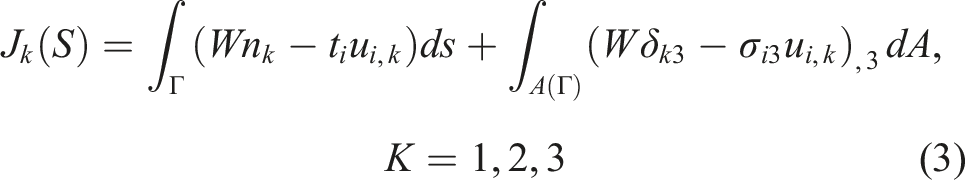
To obtain the J integral for a 2D problem, the above equation can be reduced to a set of equations as follows
23
Since finite element software provides immediate results for displacements and stresses, evaluating the line integral term of the equation is straightforward
24
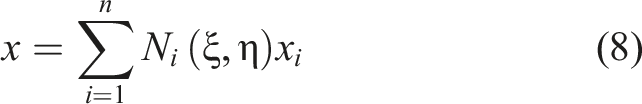
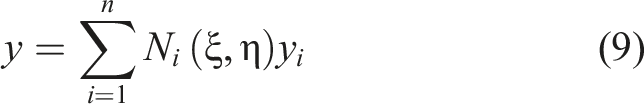
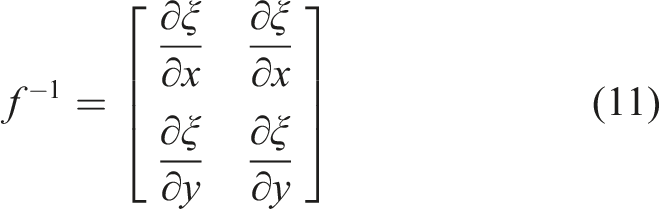
The coordinates (x, y) can be expressed in natural coordinates (ξ, η) of the shape of the isoparametric element function
The integration on domain A of equation (10) in the isoparametric space
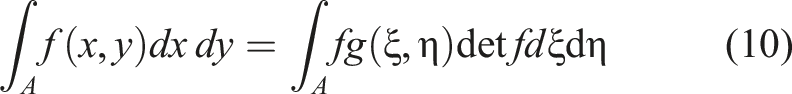
The solution is obtained based on the following (i) An isoparametric element (ii) The element’s connectivity is determined by linking the directions based on the node sequence (iii) Gauss points are numbered according to the selected reference axes (iv) An association between a real axis and an isoparametric axis
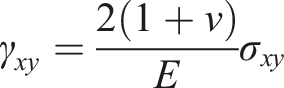
The relationship between J-integral and SIFs is described as follows
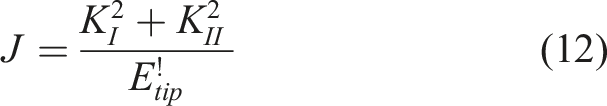
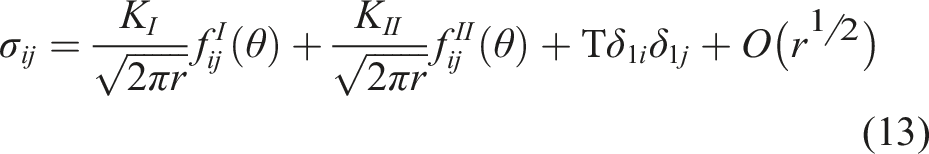
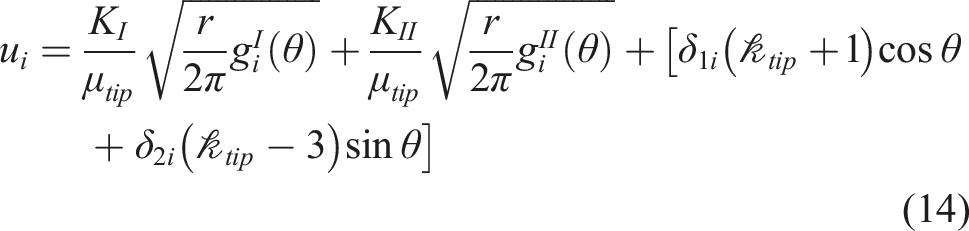
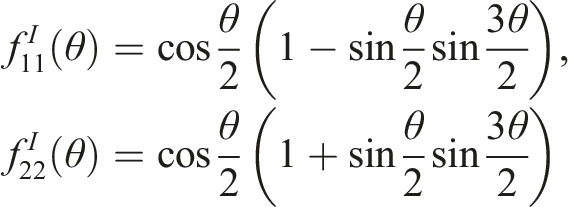
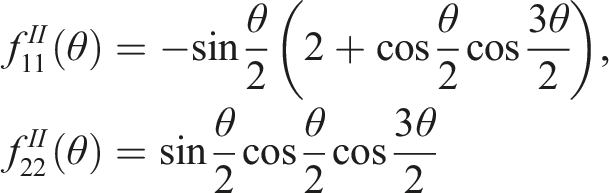
The stress at the crack tip is given below
25
as


A domain integral implemented in the ABAQUS code is used to extract the J-integral and CTOD along the line integral, based on the FEM. 26 Many researchers have utilised the concept of J-integral in fracture mechanics to ascertain the extent of energy release at the crack tip and to assess material fracture initiation.27,28
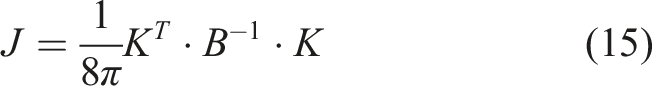
In ABAQUS, the J integral is determined from the stress intensity factor given in the equation below
29
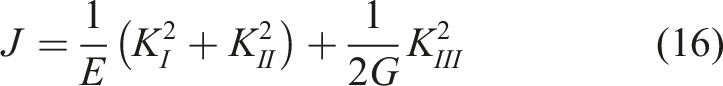
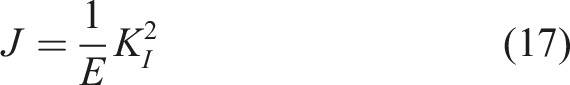
For pure Mode I,
Materials and methods
FE analysis
The FE model of the CT specimens was analysed using the commercial software ABAQUS, known for its robust capabilities in complex simulations. Using 2D plane strain elements in the FE model enabled a thorough depiction of the specimen’s behaviour under applied stresses in this instance. Load-controlled boundary conditions were implemented to ensure that the simulation accurately reflected real-world scenarios.
Material properties
The mechanical properties of banana fibre particle–reinforced biopolymer composites were established through a combined experimental–numerical calibration approach, ensuring that the adopted material model in ABAQUS is both physically representative and suitable for finite element analysis.
Sample production
The three banana fibre particle sizes of 65, 150, and 300 μm were mixed with high-density polyethylene (HDPE) matrix at a volume fraction of 30:70, with 3 wt% compatibiliser. The mixtures were dried in an oven at 60°C for 18 h to remove moisture before compounding. Each formulation was compounded using an extrusion machine at 120–200°C, a feed rate of 6.6 kg h-1, a screw speed of 124 r/min, and a pressure of 2.9 MPa. The extruded filaments were pelletized into pellets to produce dog-bone specimens according to ASTM D638, as shown in Figure 2(a), using an injection moulding machine ENGEL e-mac 50 at a melt temperature of 200°C, an injection pressure of 75 MPa, and a holding time of 15 s
30
Figure 2(b) below shows the produced dog specimen with the micrographs revealing the particle distribution in the polymer matrix in Figure 2(c) Test specimen (a) geometry (b) product (c) micrograph (d) stress–strain graph.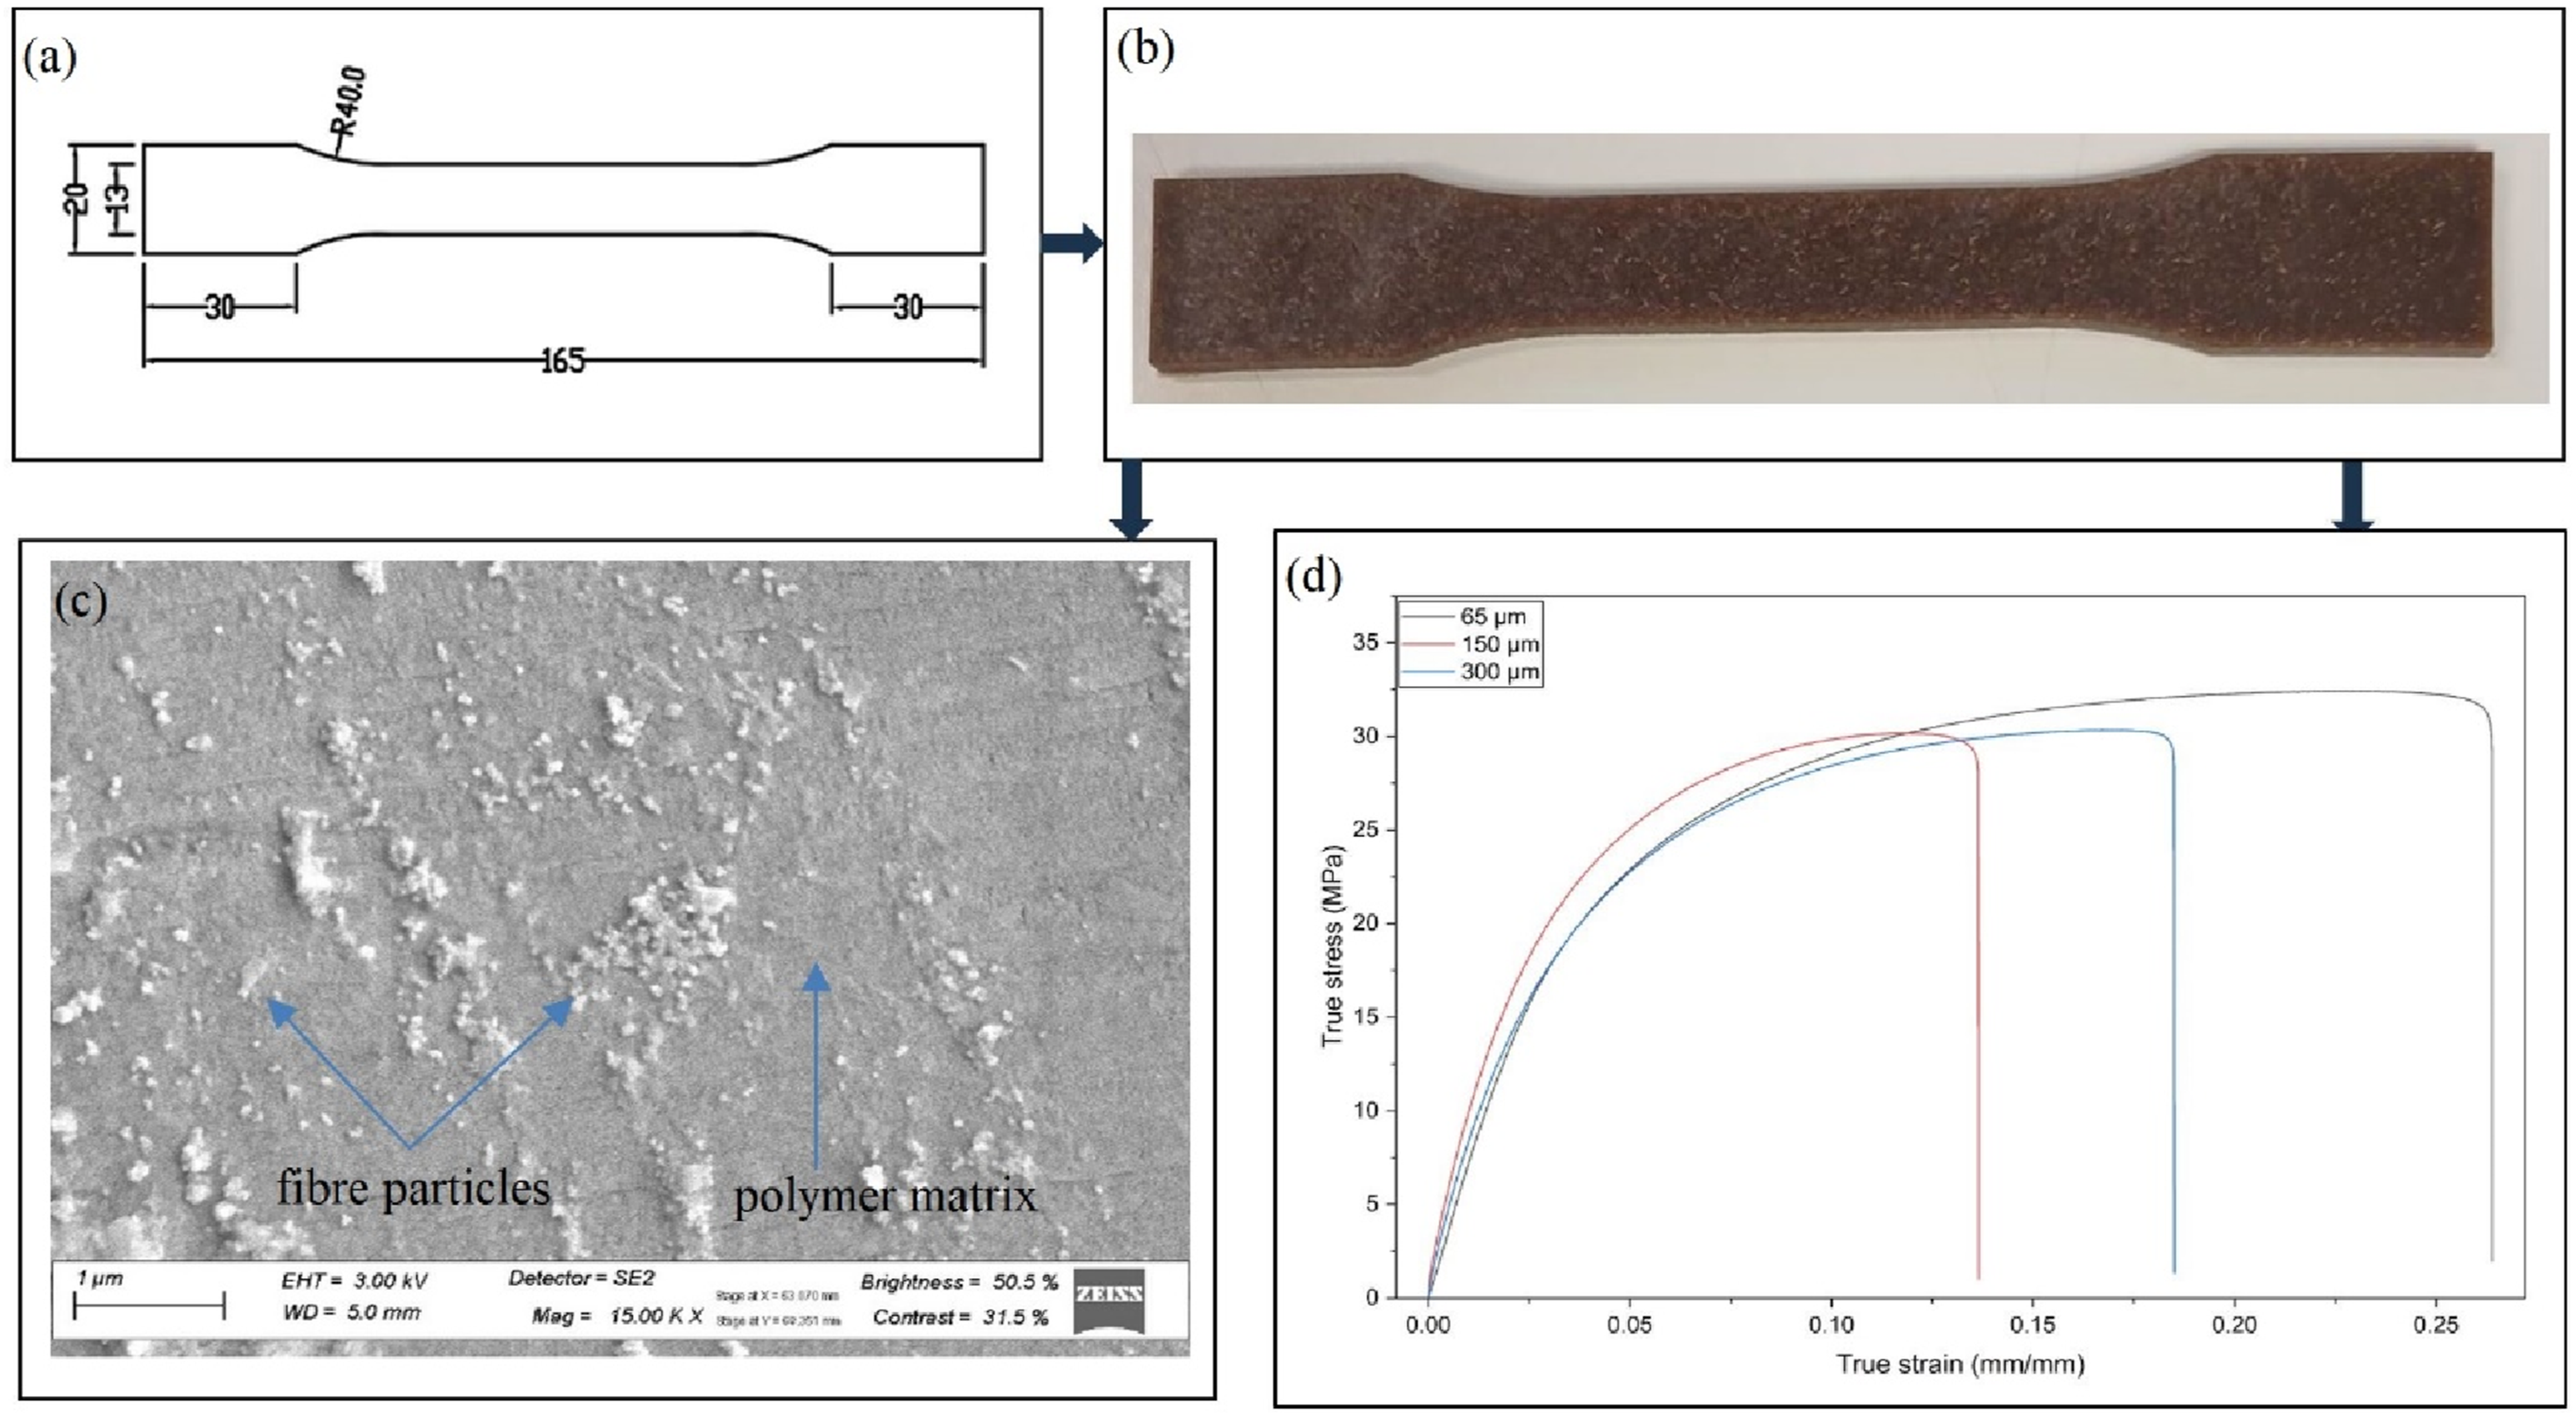
Tensile test
The tensile tests were conducted using the 30 KN capacity MTS 793 machine. A uniaxial load and a crosshead speed of 5 mm/min were applied to each of the three specimens. A gauge length of 50 mm was also considered. These tests provided the fundamental stress–strain response of the biopolymer composite with 65, 150, and 300 µm banana fibre particles, as shown in Figure 2(d).
Materials properties.
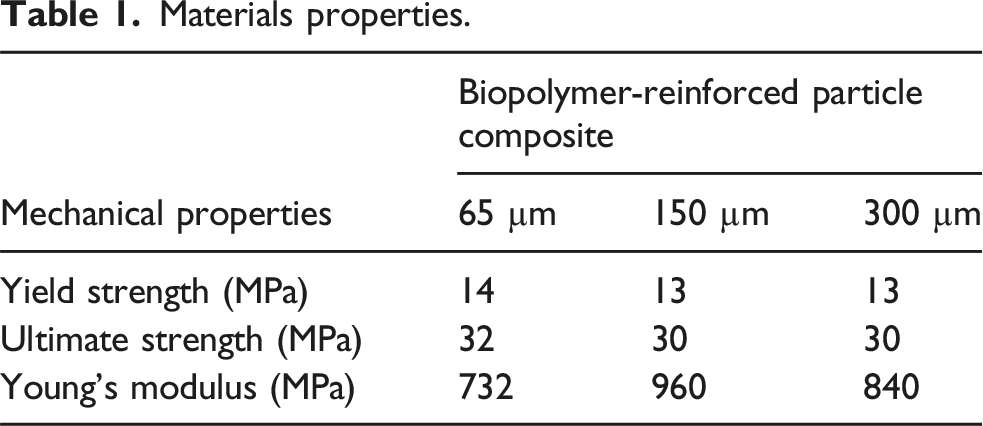
The mechanical properties listed in Table 1, together with a Poisson’s ratio of 0.25, were adopted as input parameters for the finite element simulations. A two-dimensional compact tension (CT) was employed for the numerical analysis, as shown in Figure 3. All dimensions in mm. Compact tension specimen.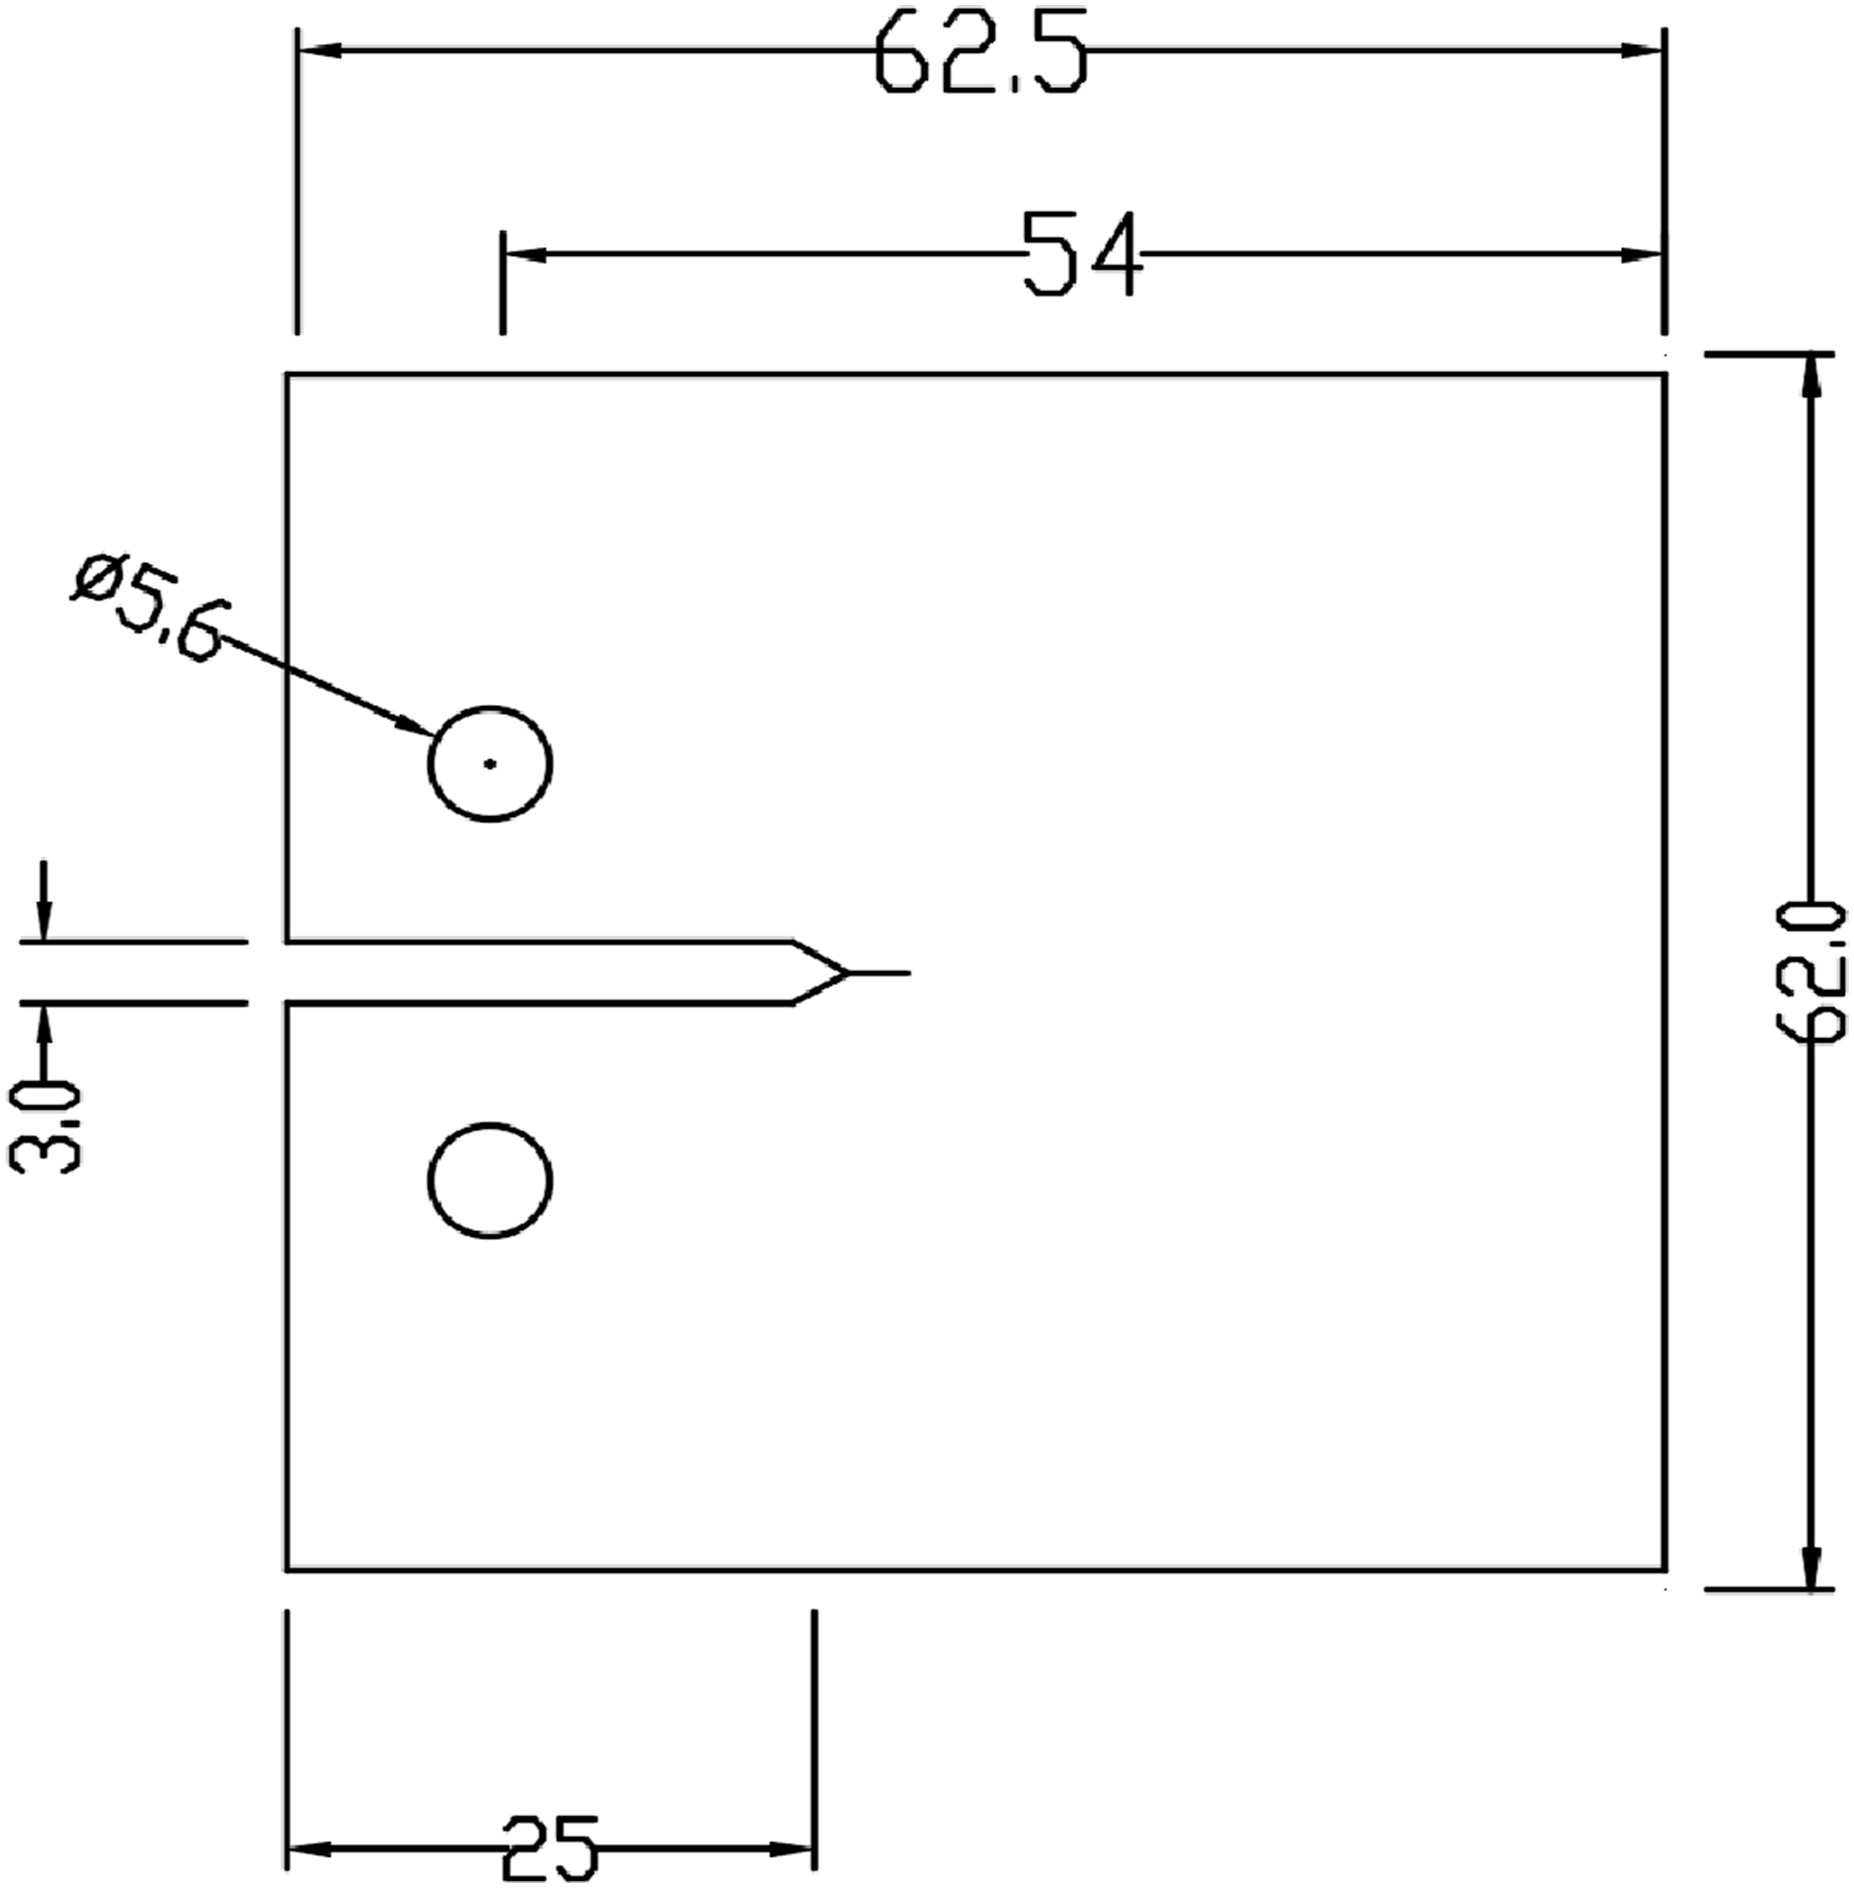
Fracture parameters were evaluated using ABAQUS by applying the domain integral method to compute the stress intensity factor
Load and boundary conditions of the FEA
Two reference points (RF1 and RF2) were defined at the centres of the holes in the finite element model to impose essential and non-essential boundary conditions. Each reference point was kinematically coupled to its corresponding hole. The lower reference point (RF2) and the bottom hole were fully constrained to prevent rigid-body motion. A non-essential load-controlled boundary condition of 100 N was applied at the upper reference point (RF1), acting perpendicular to the crack plane.
The crack was assigned seamlessly and characterised using the five-loop contour integral crack model in ABAQUS. Since the first contour does not provide a highly accurate result, Brocks et al.
33
recommend at least two contours. Six different pre-cracks, 1–6 mm long, were considered. This important modification served to reproduce conditions often encountered in practical applications and provided insight into potential failure mechanisms. The boundary and loading conditions for the FE model of a plate are shown in Figure 4. 2D Compact tension test with crack.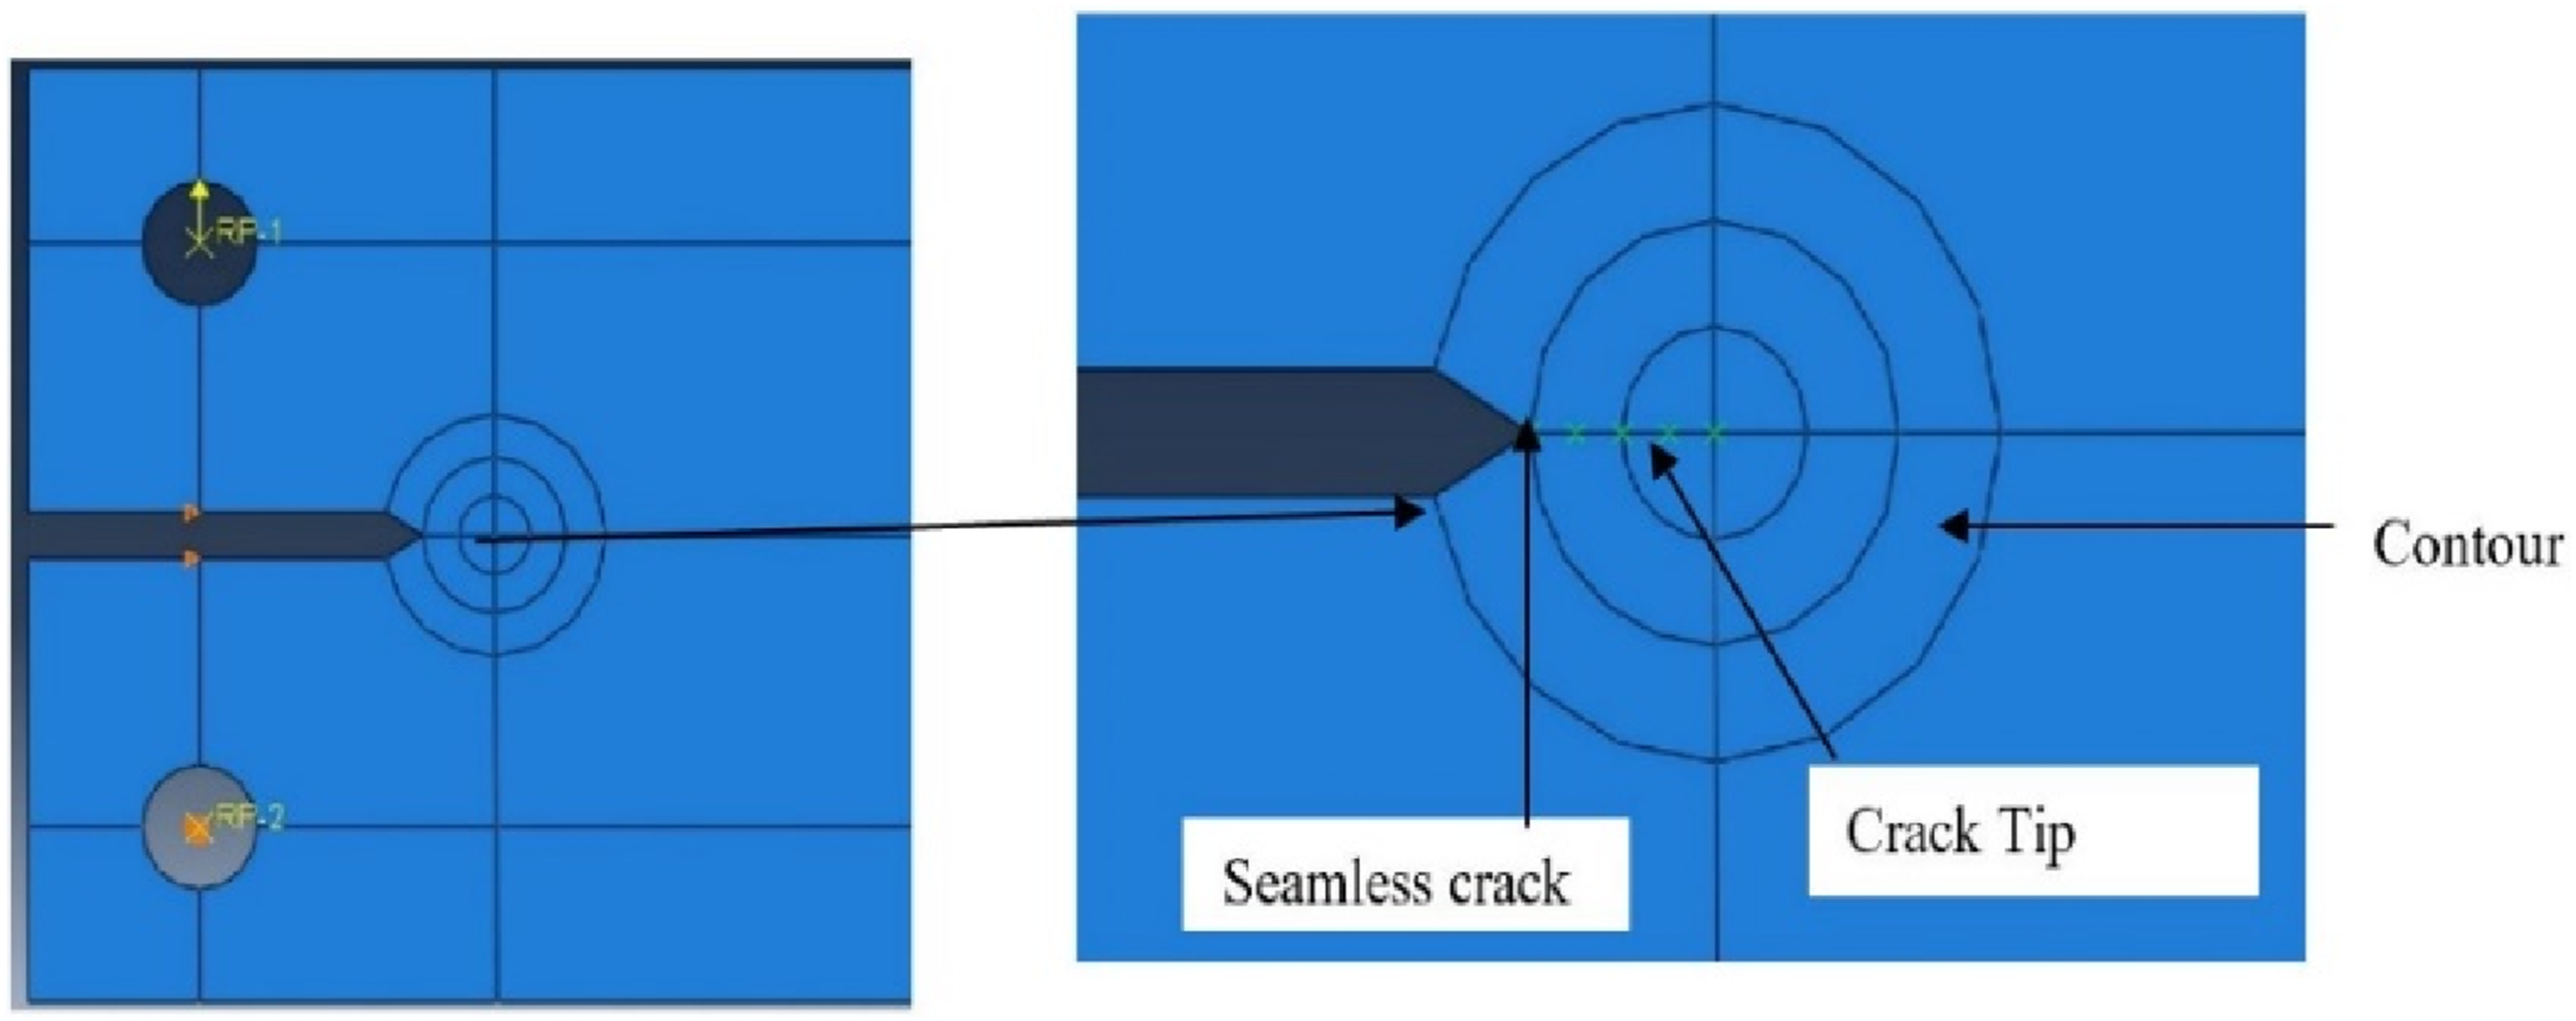
To build confidence in the accuracy of numerical predictions, Pazhouheshgar et al. 33 recommended conducting a thorough convergence study of the FE mesh density first to ensure that the main simulations do not affect the analysis results. Different mesh sizes were considered for each specimen, and convergence was achieved with a 0.4 mm mesh, resulting in 185,346 and 165,000 nodes. The crack tip opening and stress fields were evaluated for six different crack lengths.
Results and discussions
J-integral
The J-integral, widely accepted as a parameter in quasi-static fracture mechanics, plays a crucial role in understanding material response during crack analysis. In this study, we focused on assessing the energy release associated with pre-existing cracks using five different contour integrals.
As illustrated in Figure 5, which shows the J-integral contours for three different materials, there is minimal variation in J values across all three cases. This lack of significant fluctuation along the contour typically indicates no potential errors or convergence issues related to the number of contour integrals defined. The difference in J-values between the first and last contour values is less than 1% across all cases, which aligns closely with previous studies.
34
It is noteworthy that the results begin to converge reliably starting from the second contour. This trend indicates improved accuracy as the number of analysed contours increases, thereby enhancing the reliability and credibility of our results overall. This phenomenon aligns with previous research,
35
which emphasised that J-integral values derived from the first contour should be approached with caution. They often fail to yield satisfactory results due to numerical singularities inherent in such calculations. As a result, it was advised to derive the J-integral values from at least the second contour or more points. J integral versus number of contours.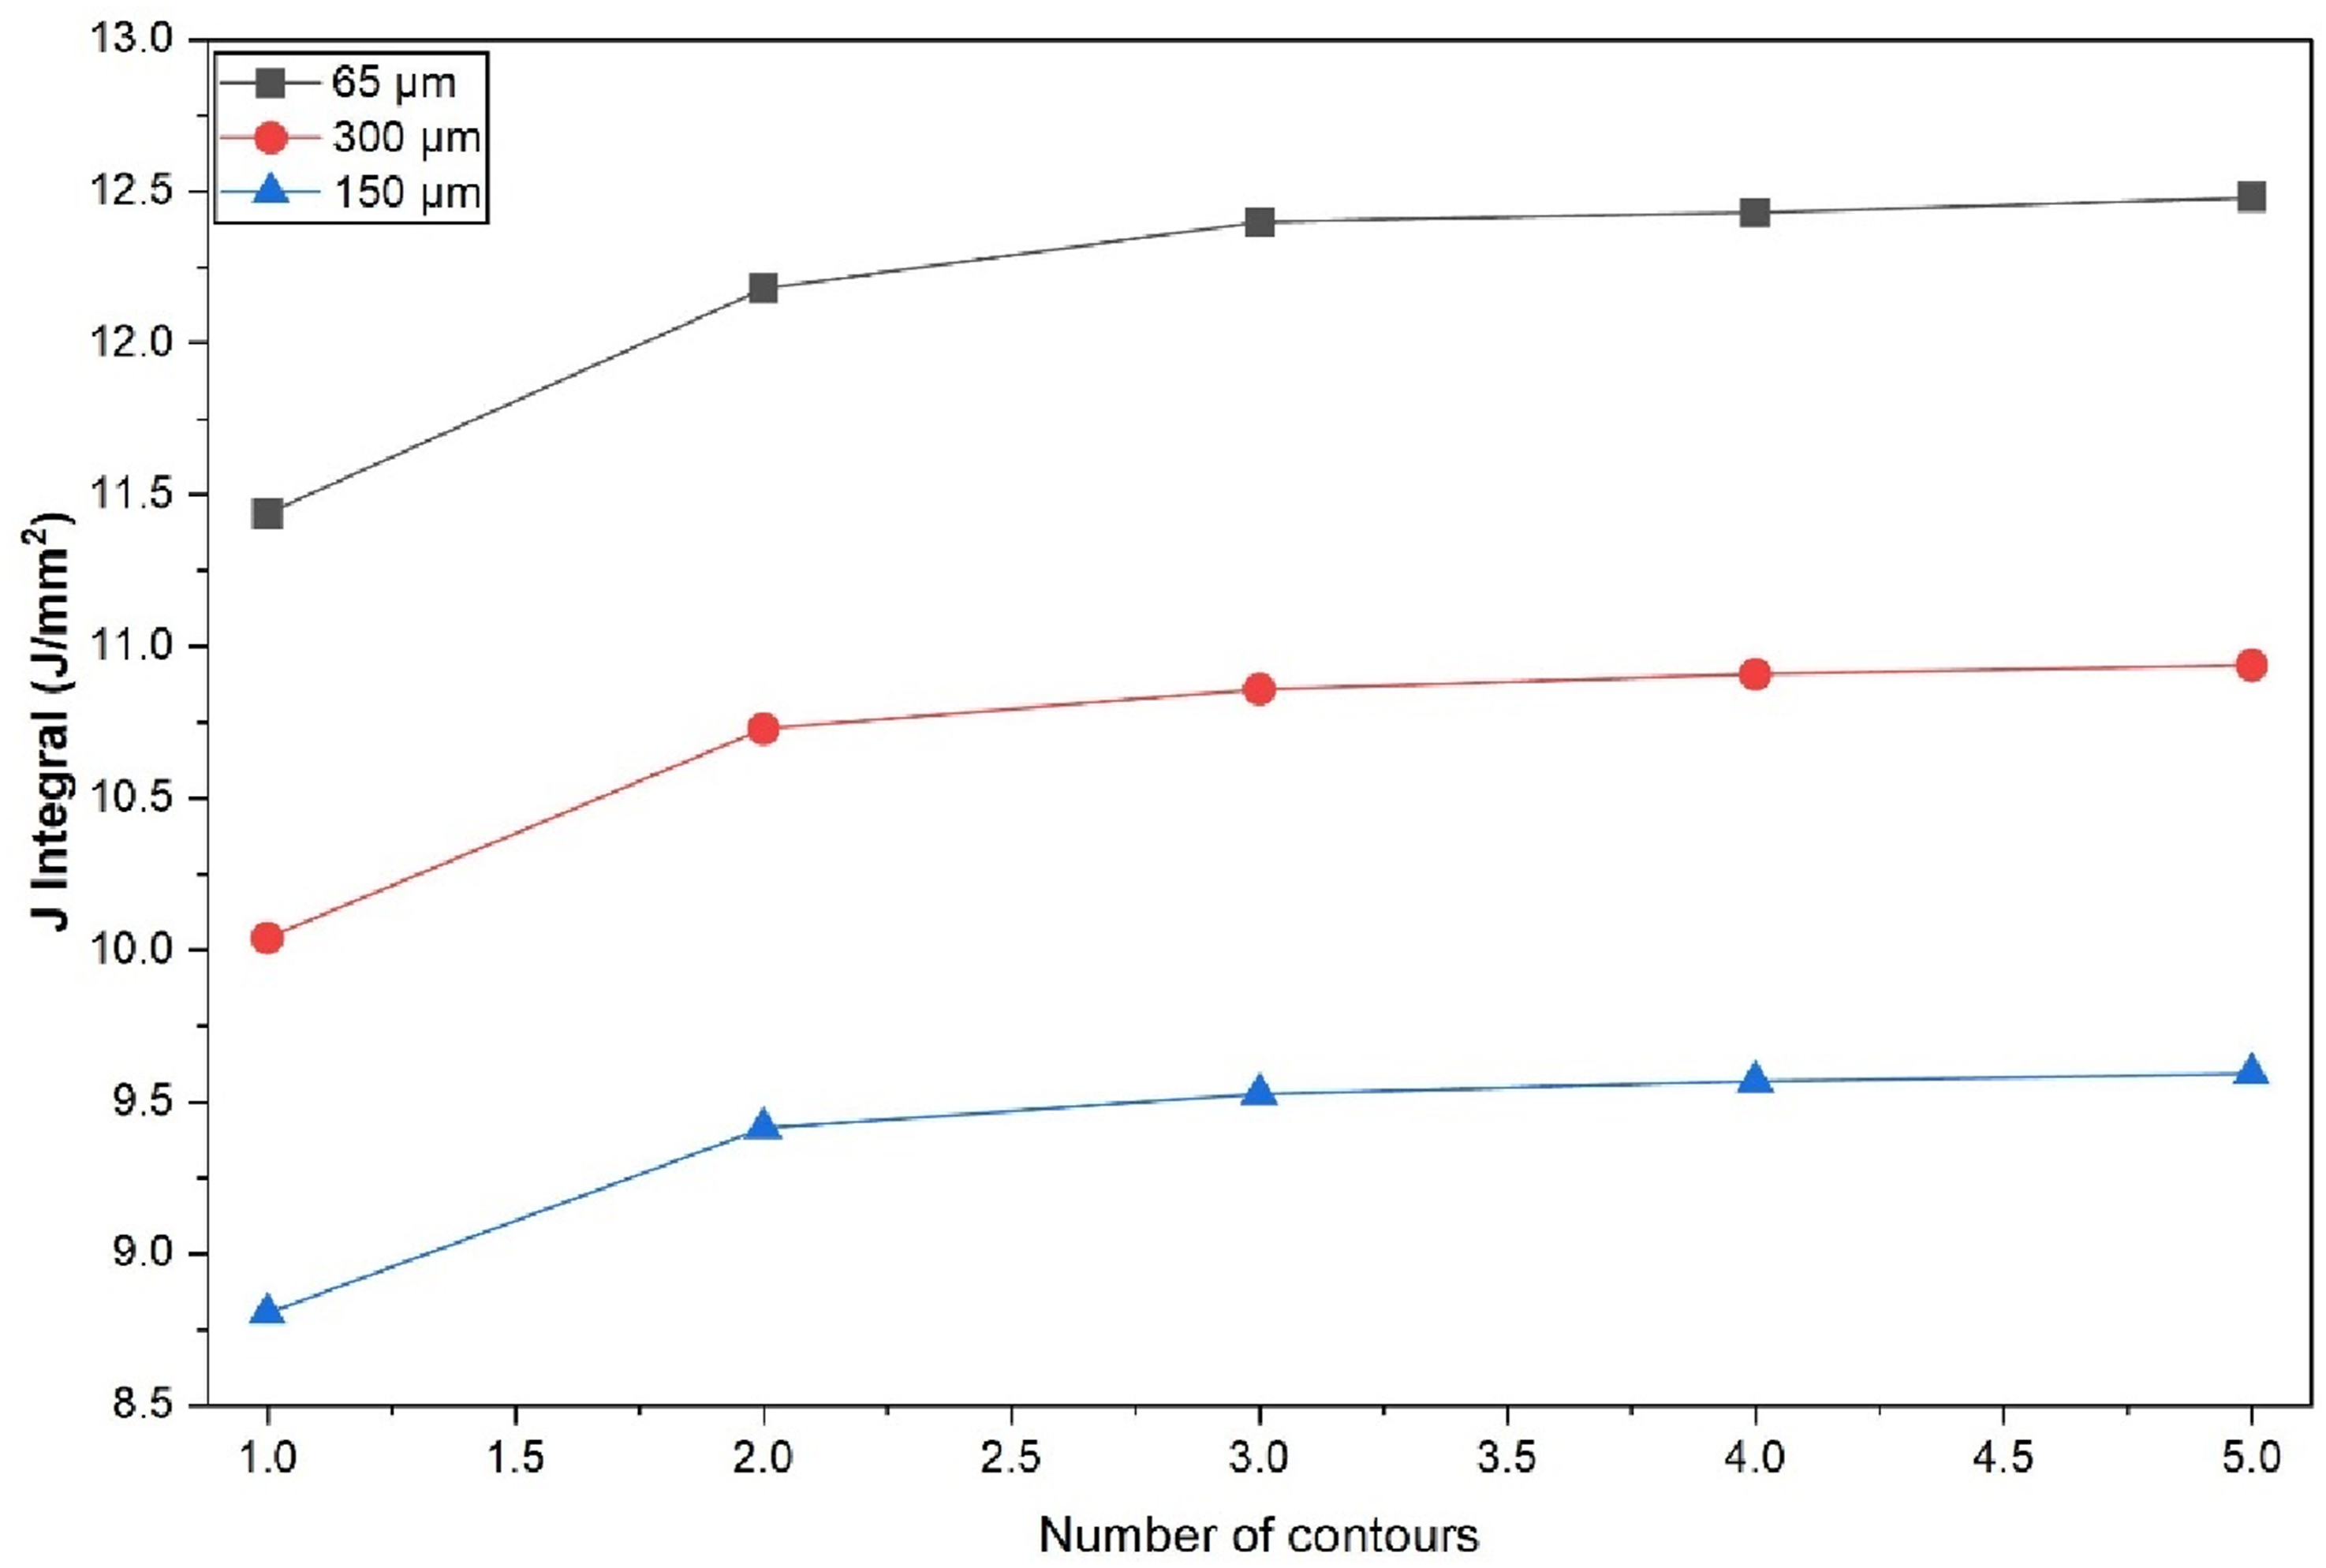
The J-integral as a function of crack length for three different particle-reinforced biopolymer composites is illustrated in Figure 6. From examining the Figure, it becomes evident that the composite identified as 65 µm exhibits notably higher J-integral values across all measured crack length ratios. In contrast, the composite labelled 300 µm shows medium J-integral values, while the one labelled 150 µm shows the lowest among the three. This high J-integral value associated with material 65 µm suggests that it possesses a relatively low resistance to crack propagation, indicating that once a crack initiates, it can advance more easily through this material. Conversely, materials with lower J-integral values, specifically those represented by 300 and 150 µm, indicate an increased requirement for fracture energy to propagate a crack further. Notably, the 150 µm composite appears to exhibit superior resistance to crack propagation compared to its counterparts. This enhanced performance can be attributed in part to its higher Young’s modulus, which indicates greater stiffness and strength under stress. Interestingly, despite variations in initial resistance levels among the materials, a general trend emerges: as the crack length increases across all three composites, their respective J-integral values increase. This is in good agreement with established principles of classical fracture mechanics, which state that as crack length increases, there is a corresponding decrease in the resistance to crack propagation. Supporting this observation,
17
noted that there is a clear correlation between increasing crack lengths and rising J-integral values. Bouchikhi
36
observed that both fracture length and position affect the J-integral near the crack tip. The J-integral increases with increasing crack length. The fracture energy J-integral at the crack tip rises with crack length due to crack propagation. J-integral versus crack length ratio.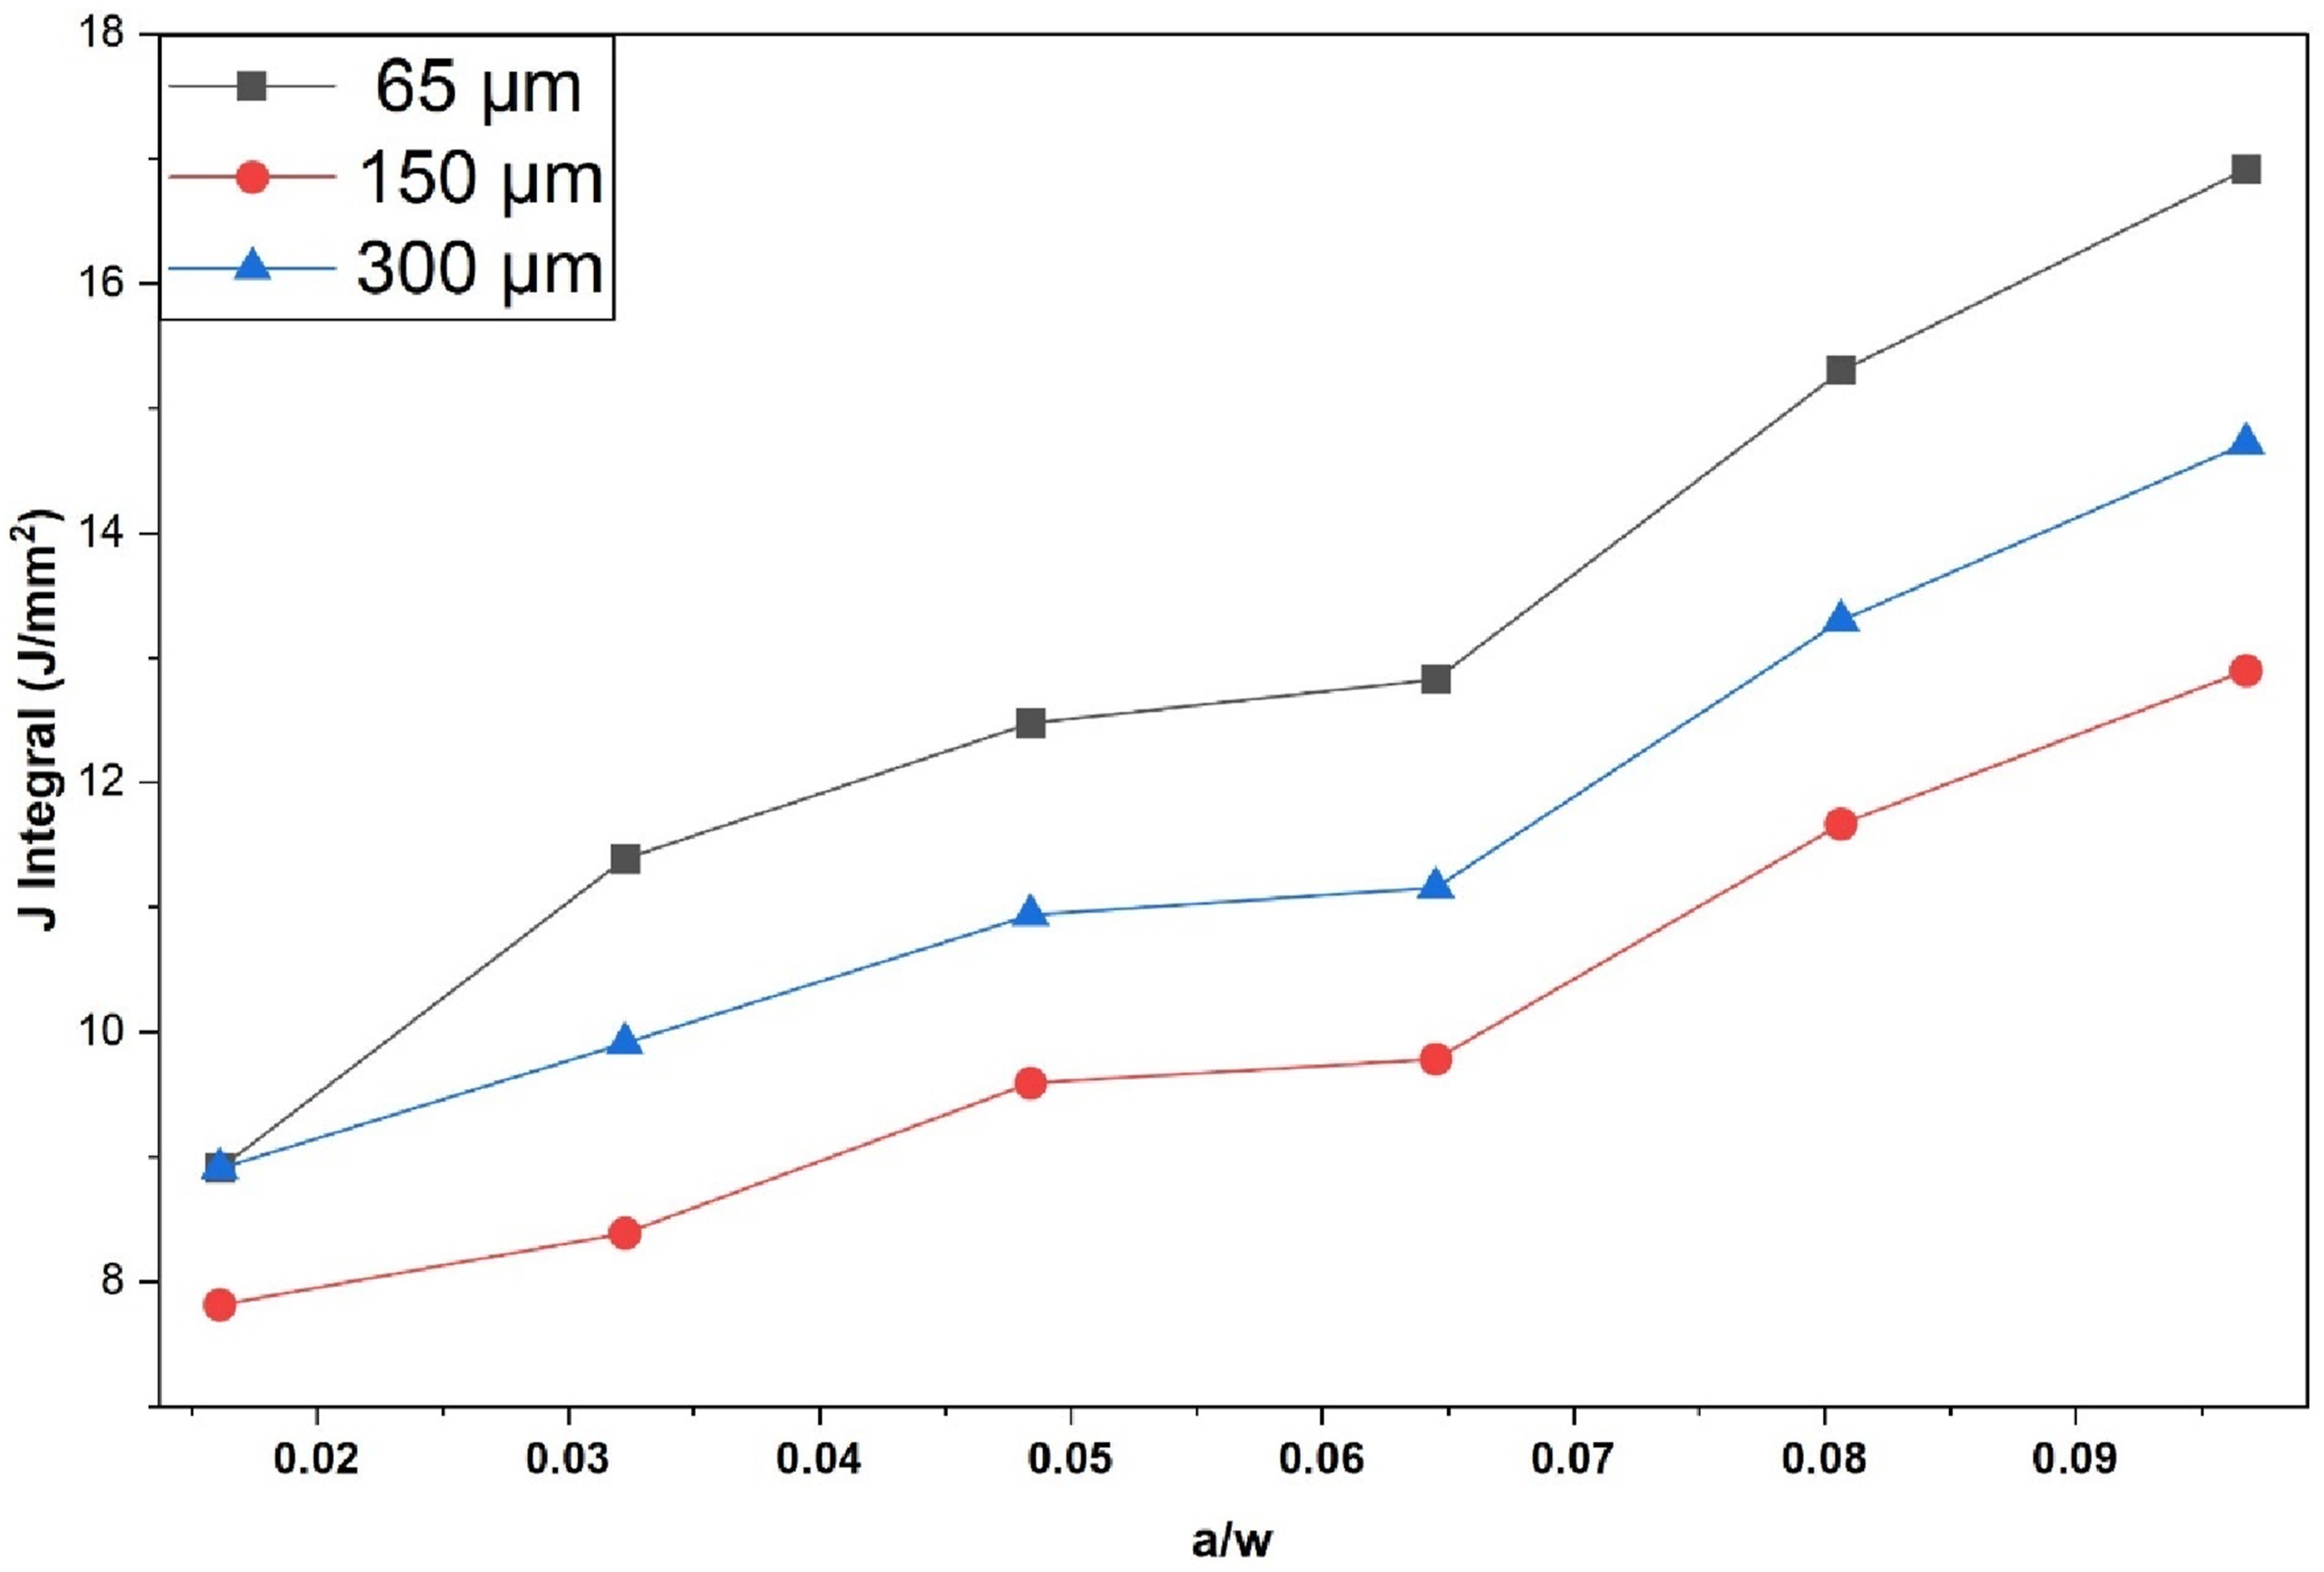
The fracture surface of the tensile-test biopolymer composite used in this numerical analysis exhibited a relatively smooth texture, with visible cracks and voids. This suggests a ductile fracture mechanism with some plastic deformation in the material reinforced with smaller particles. Also, Jibrilla et al. 31 observed that the surface texture appears relatively rough, which may reflect brittle fracture characteristics, typical of polymer composites under stress. These features suggest brittle fracture behaviour, in which the composite fails due to crack propagation. The absence of smooth, continuous regions indicates minimal plastic deformation. The interconnected structure may contribute to enhanced toughness and fracture resistance, while the fine surface texture details suggest the possibility of microcracking.
Stress distribution
To examine the stress state preceding crack initiation, the von Mises stress contour plots at the crack tip were compared for three simulated particle sizes, as shown in Figure 7. In all cases, high stress concentrations were observed around the crack tip. Figure 7 presents the von Mises stress distributions for polymer composites reinforced with particles of three different sizes. Xiaodong et al.
37
also reported comparable stress concentrations in specimens with different microstructures before crack initiation, suggesting a limited effect of microstructural variation at this stage. However, Figure 7 also shows that the stress magnitude at the crack tip increases with increasing initial crack length, indicating that longer cracks are more susceptible to crack initiation than shorter ones. Von Mises stress distributions at different crack lengths for 65, 150, and 300 µm particle sizes.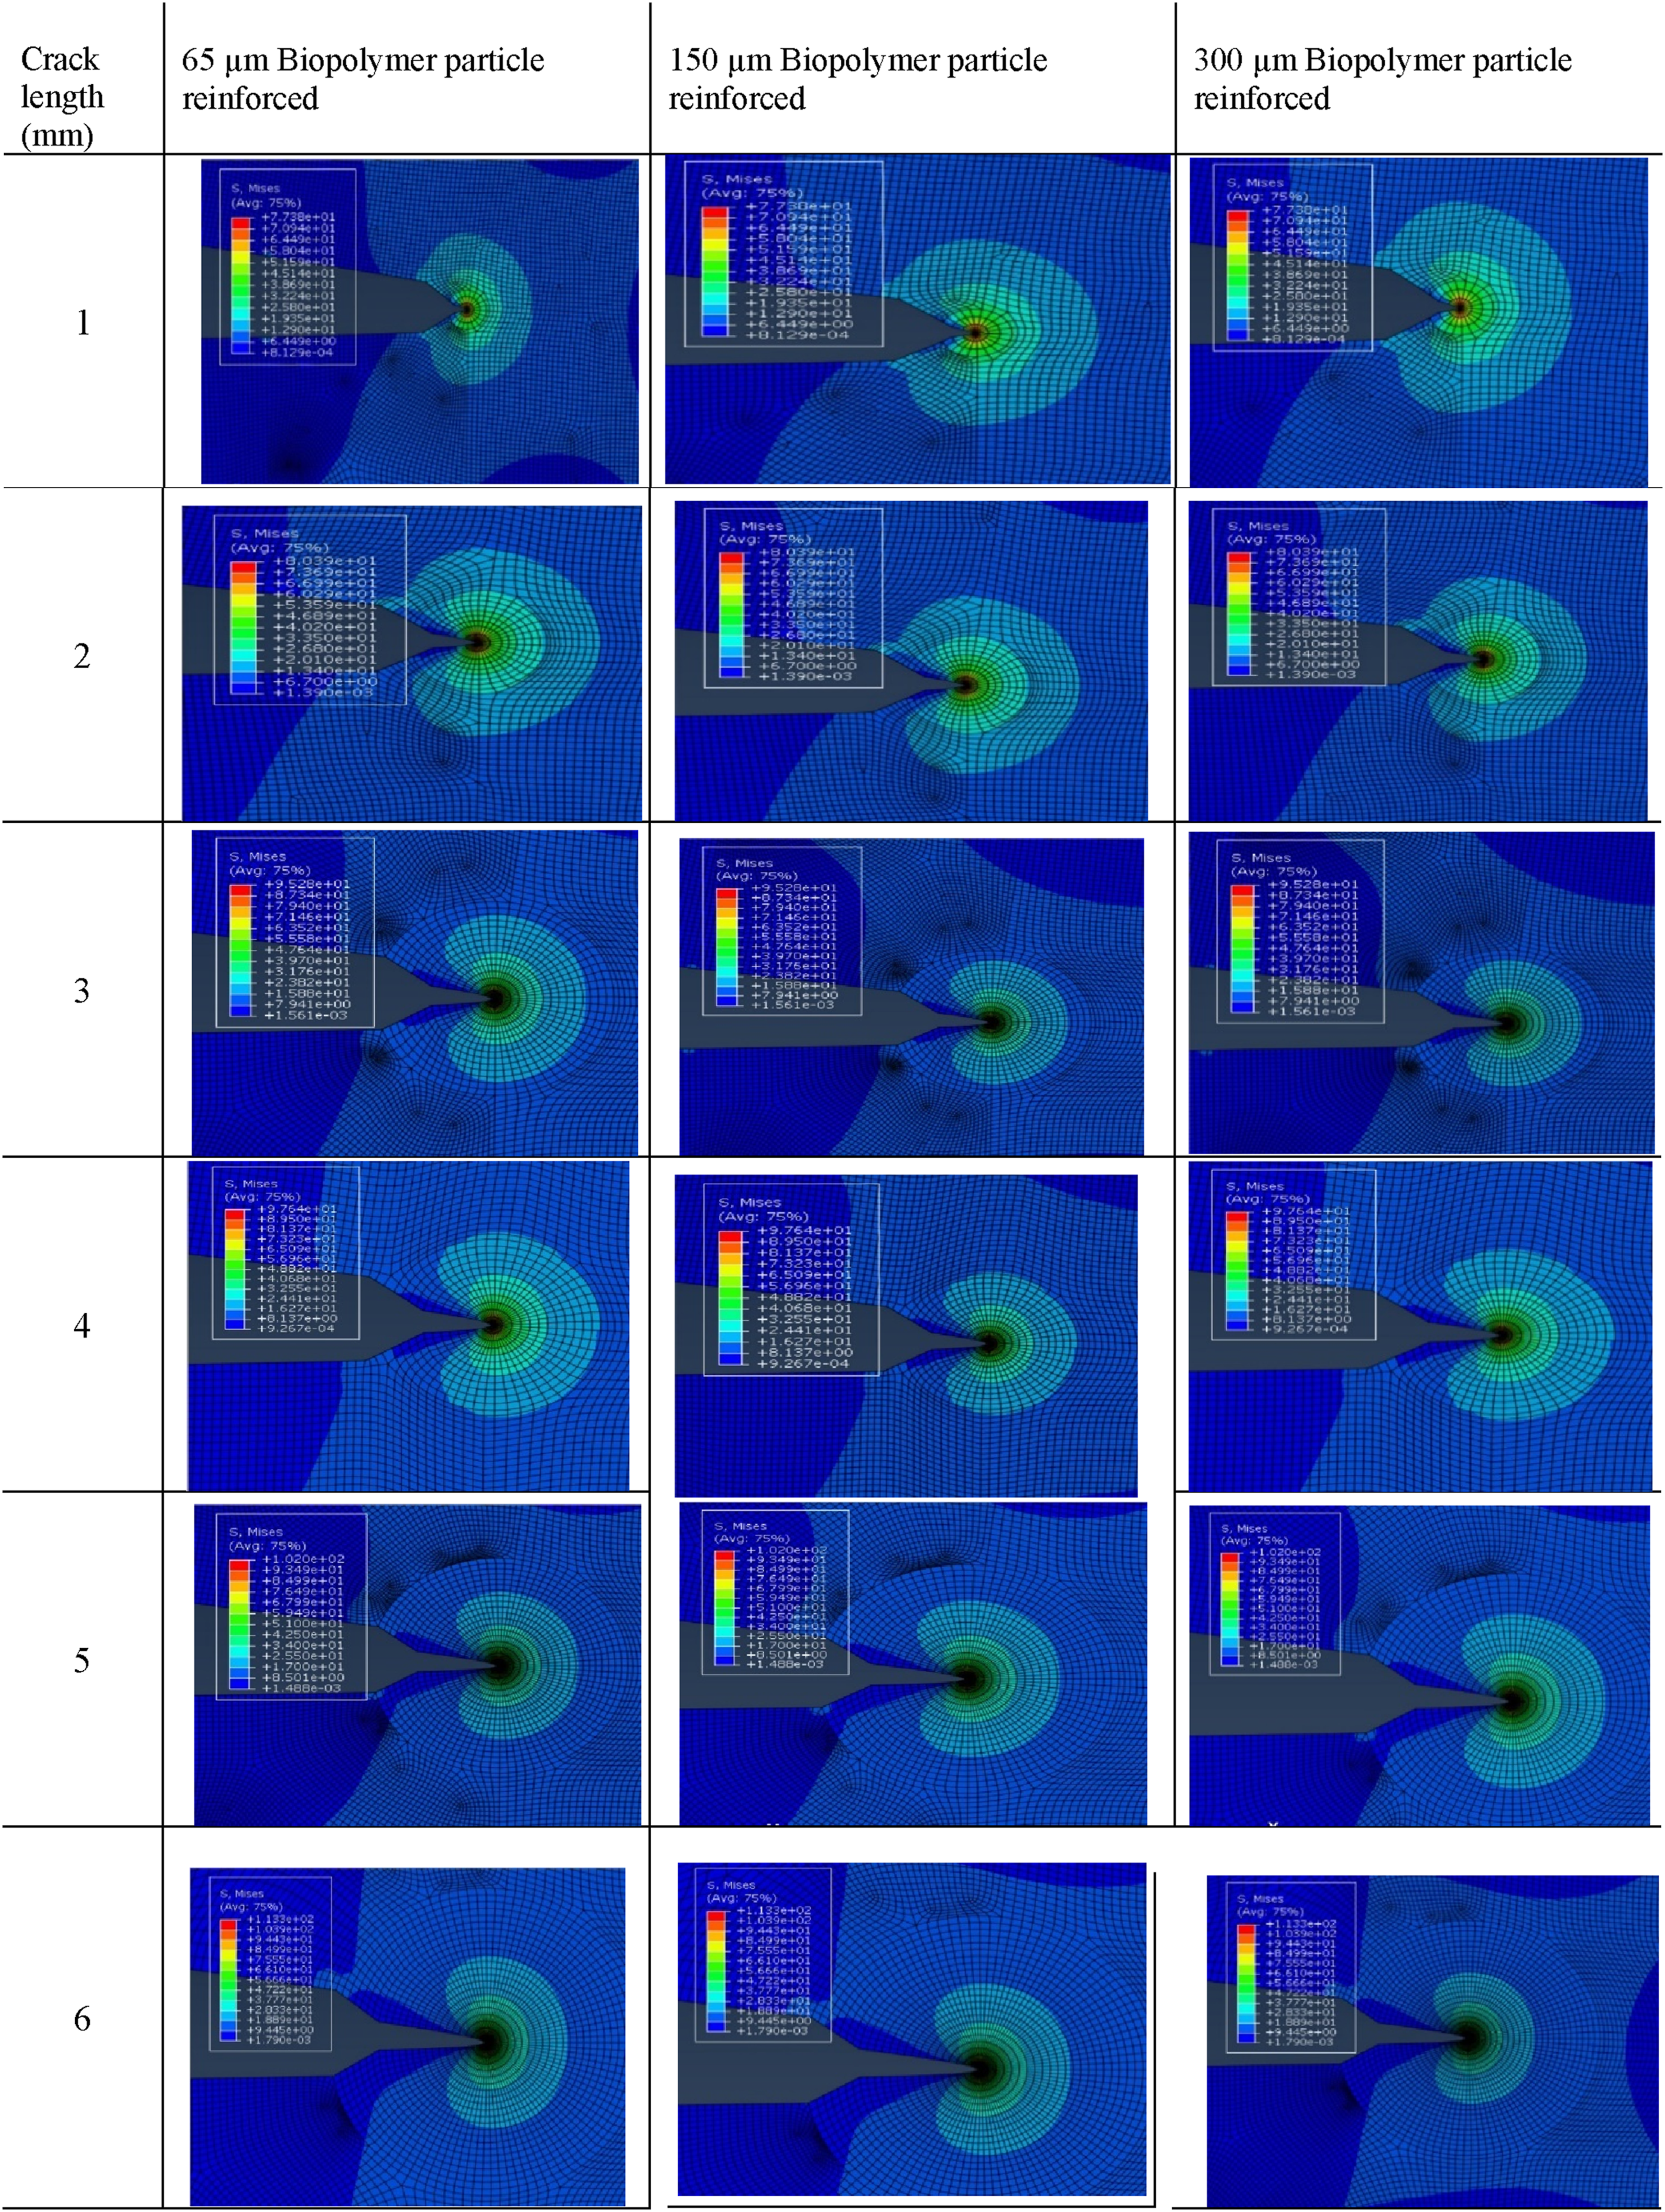
To provide further insight into the fracture process, one representative case was magnified to illustrate the surface energy dissipation near the crack tip. Figures 8(a) and (b) show the integral contour mesh patterns used in the analysis. The red regions around the crack tip correspond to high stress concentrations, where crack initiation is most likely to occur. This behaviour was consistently observed for all particle sizes considered. Deformed CT specimen distribution (a) Enlarge section (b) J-integral contours mesh pattern.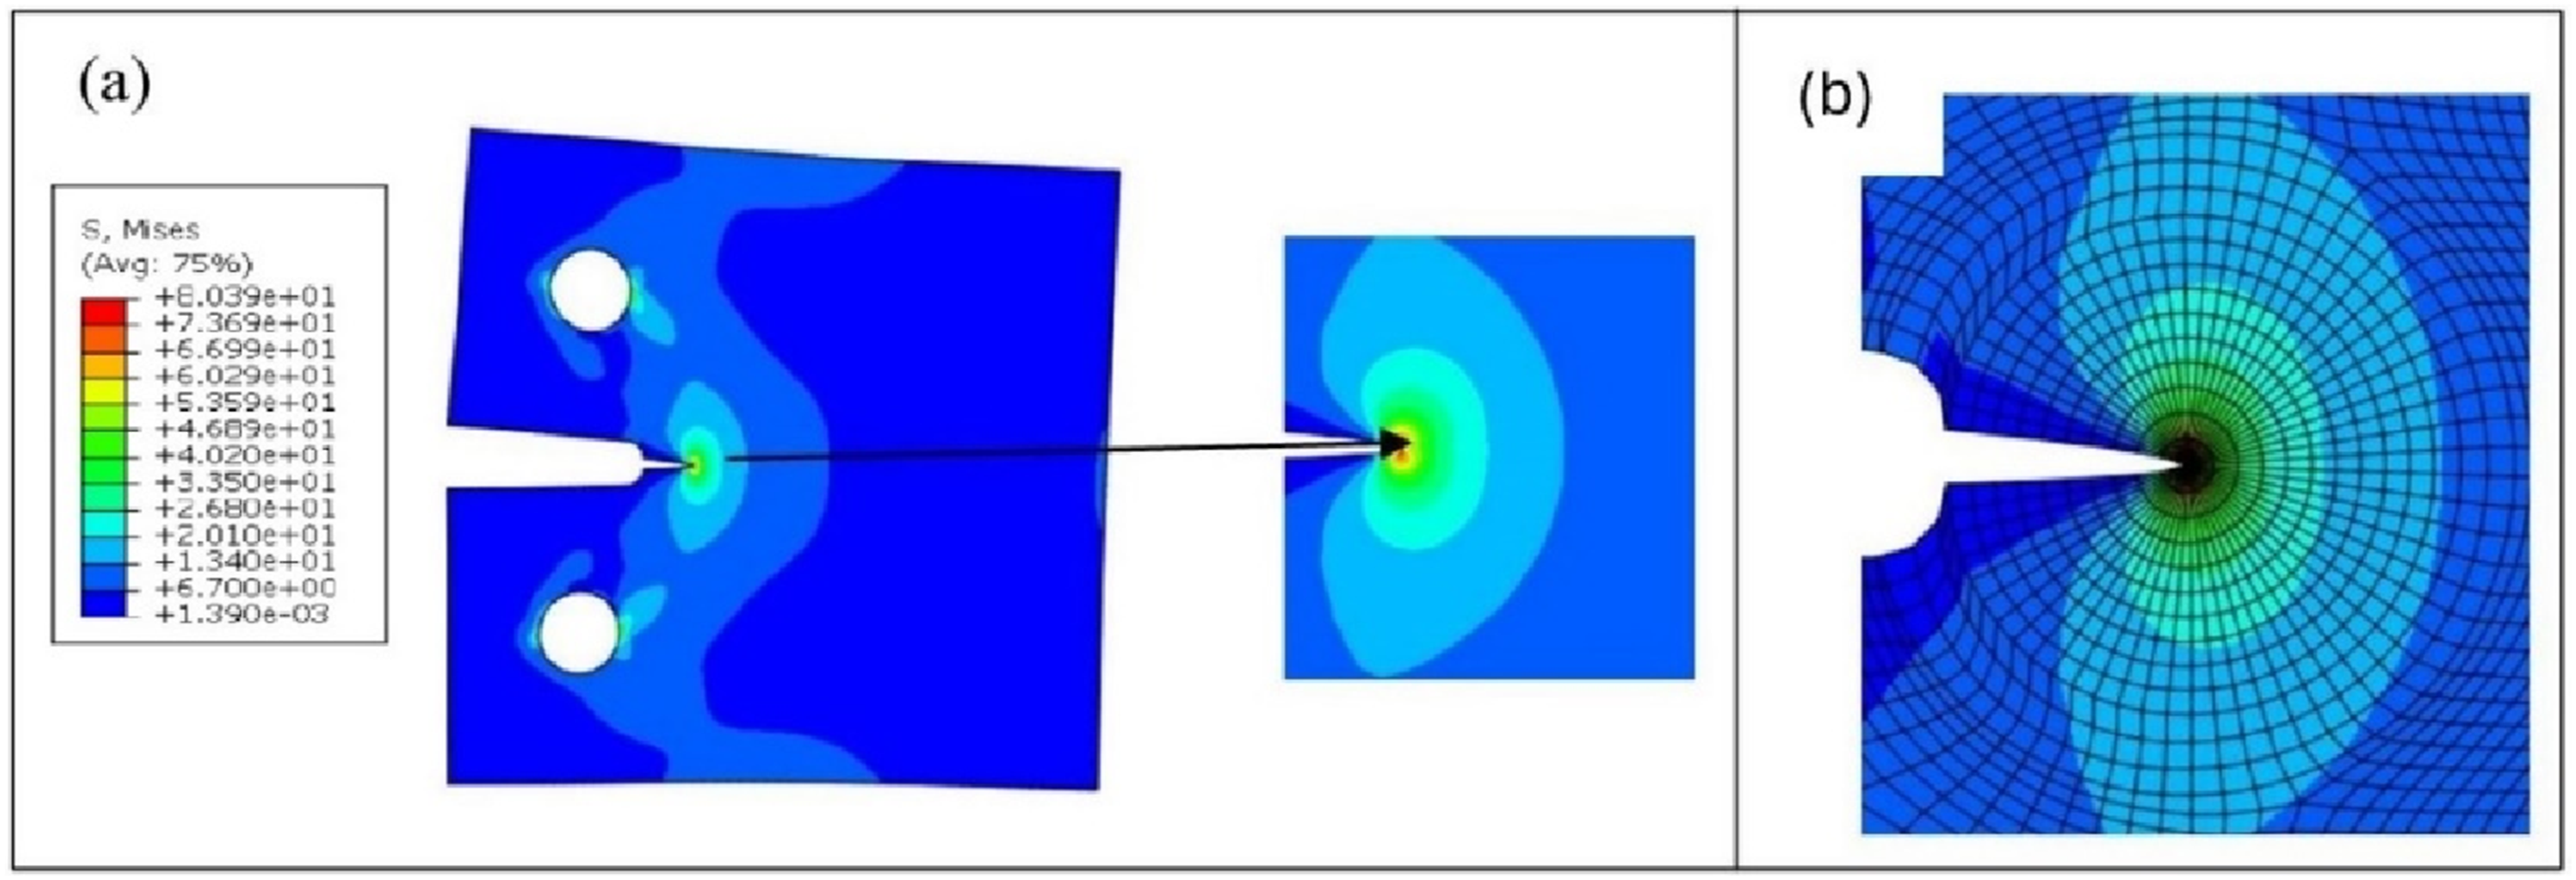
Comparing the stresses for the reinforced material at different crack lengths, the stress around the crack tip is quite high and decreases with increasing distance from the crack tip, as shown in Figure 9. From 5 mm away from the crack tip, the stress starts to decrease and normalise. This shows the J-integral values are independent of the initial crack length and the location of crack introduction.
38
However, the longest crack of 6 mm has the highest stress of 98 MPa, while the 1- and 2-mm cracks have almost the same stress of 63 and 62 MPa, respectively. This shows that the lower the crack, the lower the stress. As the crack length increases, the J-integral difference grows more significant. This behaviour is typical, as the larger J-integral values are due to an increase in stress at the crack front.
39
Furthermore, Torabizadeh
40
observed that strain at crack initiation, tearing modulus, and maximum load and extension before fracture were found to show significant variations with a0. Stress along the crack tip.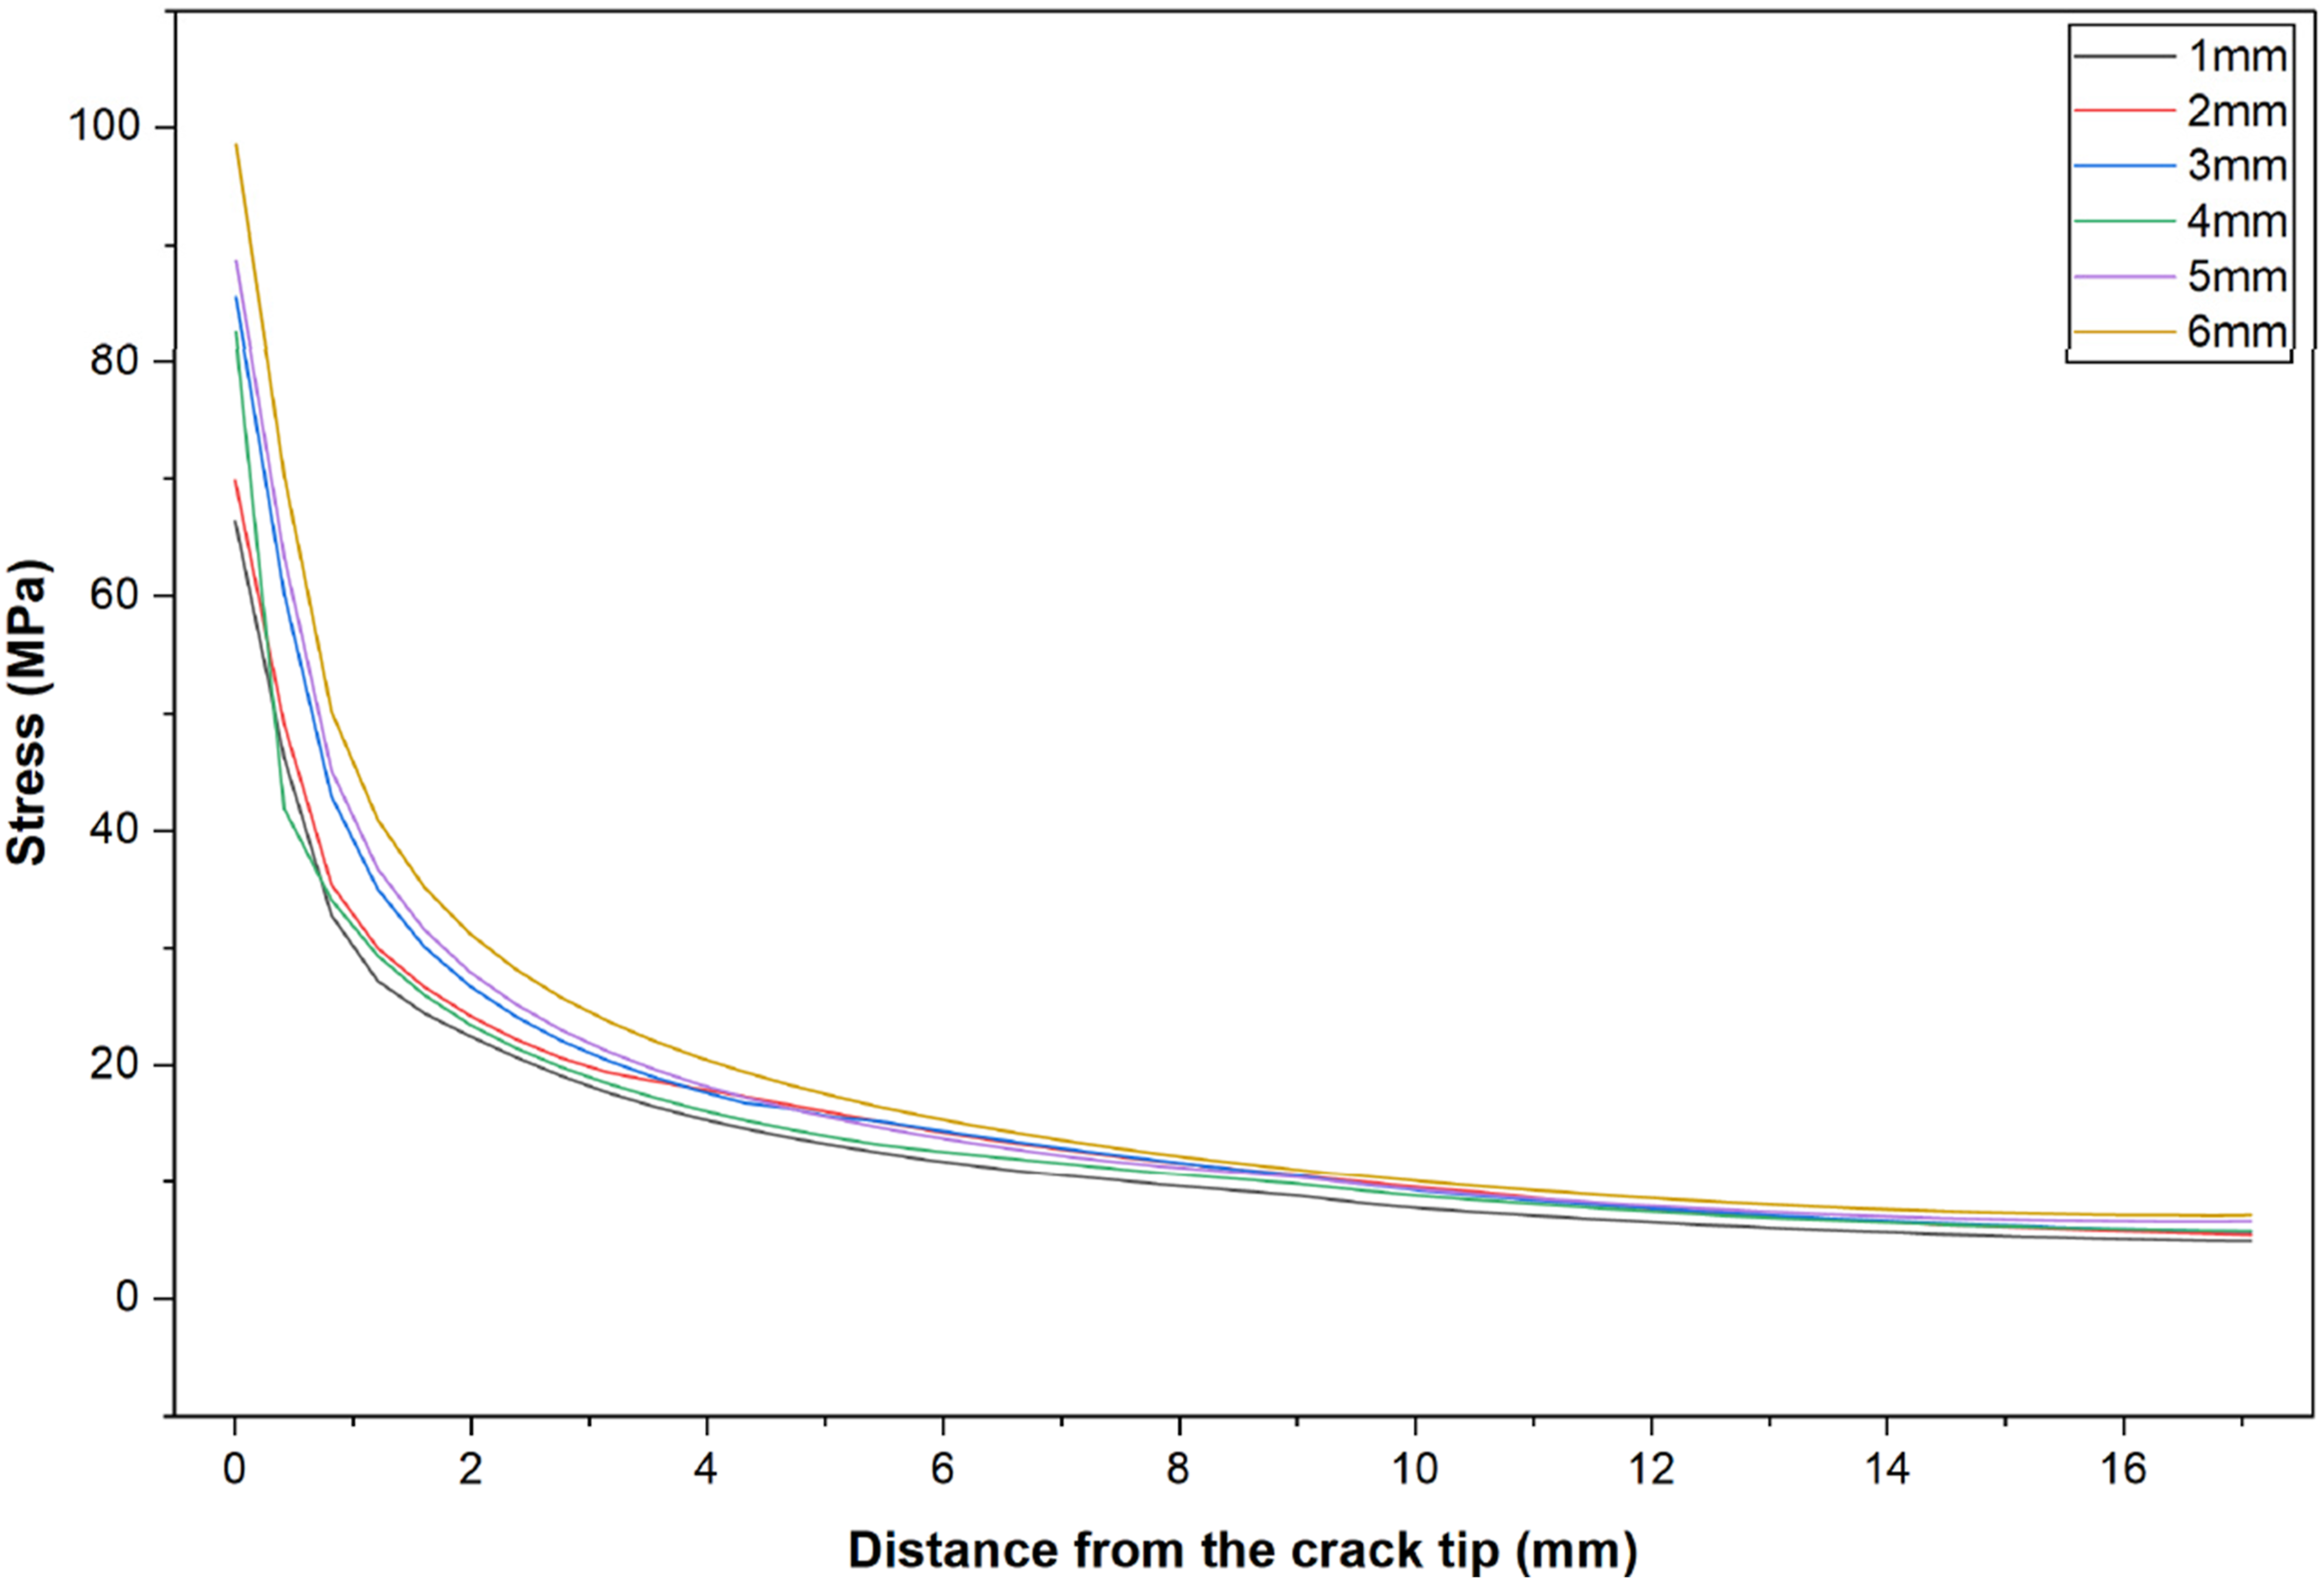
Crack tip opening displacement (CTOD)
A study of CTOD at varying lengths was conducted to assess the fracture toughness and crack-initiation resistance of three composite materials. As shown in Figure 10, CTOD is significantly affected by several factors, including crack length, material properties, and the applied load. CTOD versus crack length ratio.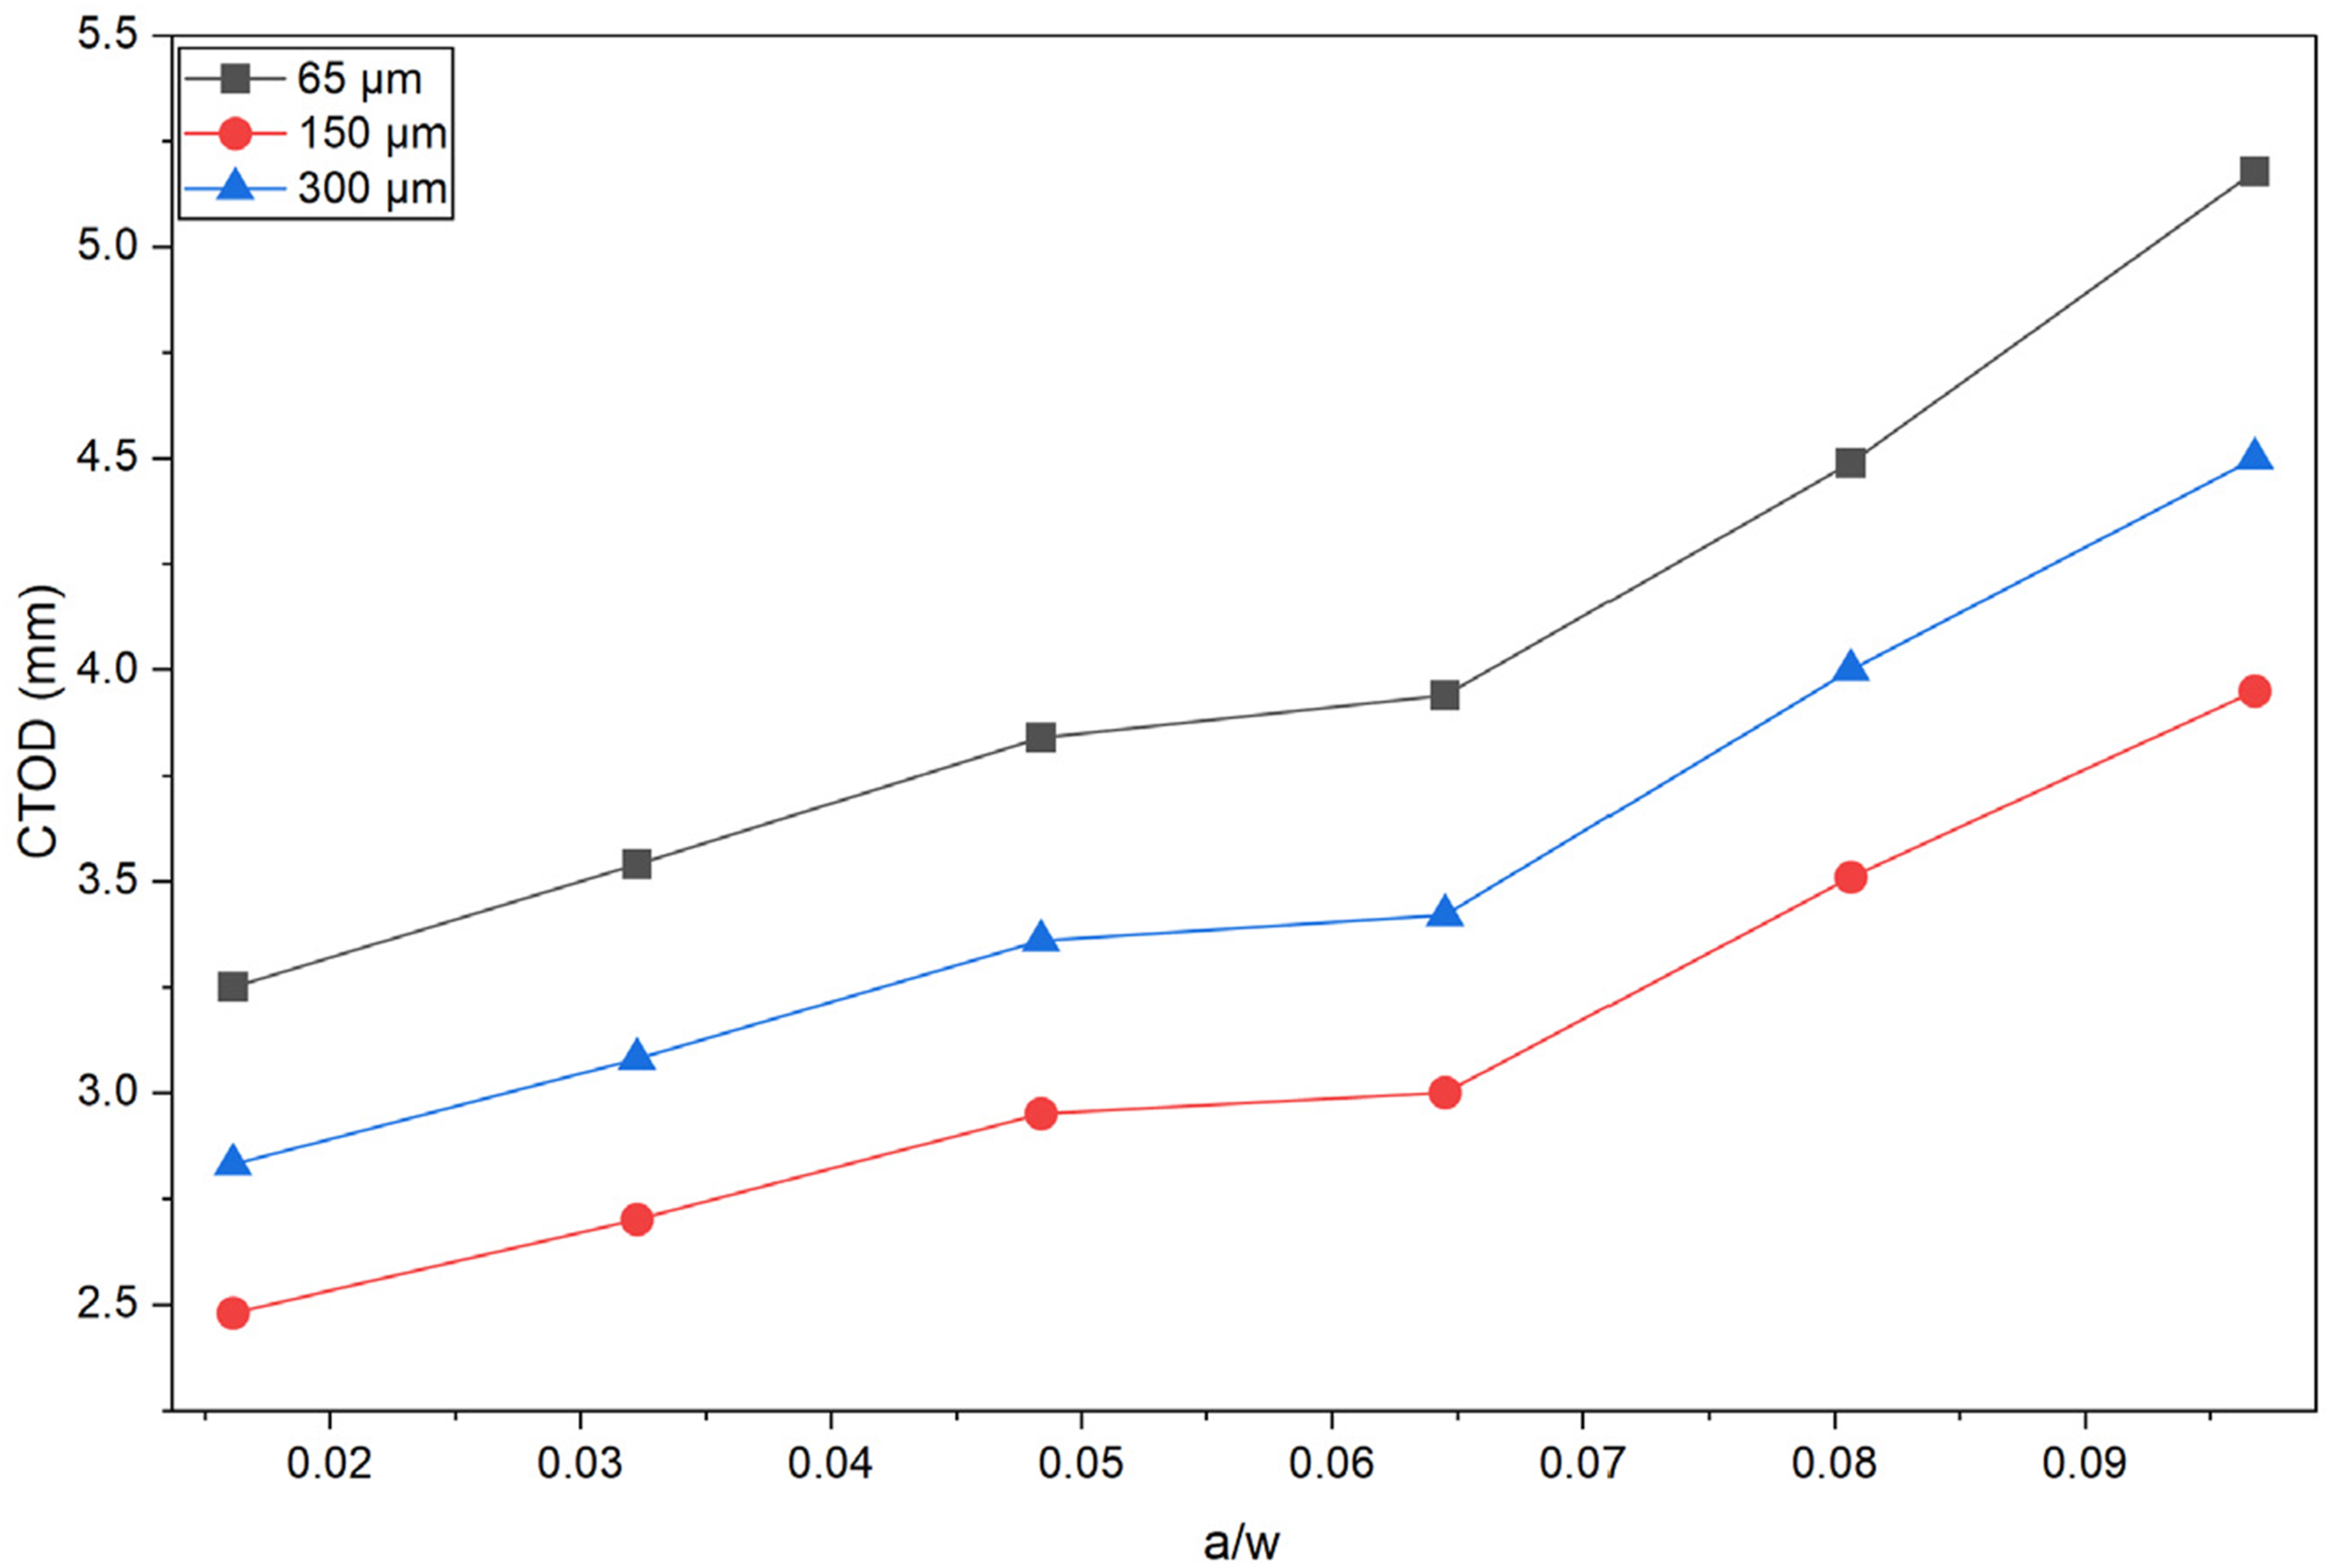
Moreover, Figure 10 shows that as the crack length increases, the CTOD increases correspondingly. This behaviour resembles the observation of the J-integral. Specifically, among the three composite materials investigated, the 150 µm reinforced polymer composites exhibit the lowest CTOD value. This finding indicates a commendable level of crack initiation resistance for this material. In contrast, the 300 µm variant follows closely behind in fracture toughness, while the 65 µm composite shows the least resistance to fracture, with the highest CTOD value. The results of the study highlight a close relationship between J and CTOD, which depends on several factors, including material type, stress state, and the crack length-to-width ratio (a/w) in the tested specimens. This correlation has been corroborated by previous research, 41 reinforcing the understanding of how these various elements interact to determine fracture behaviour across different composite materials.
Conclusion
The study investigated the fracture behaviour of biopolymer composites reinforced with banana fibres in a high-density polyethylene matrix, with a particular focus on three different particle sizes. The findings from this research revealed that biopolymer composites reinforced with 150 µm fibres exhibited the lowest J integral value among those analysed. In contrast, the composites reinforced with 65 µm fibres demonstrated a higher J integral than those reinforced with 300 µm fibres. This result implies that the biopolymer composite reinforced with 150 µm fibres exhibits superior fracture resistance compared to its counterparts, which can be attributed to its higher Young’s modulus. Moreover, among the three composite materials investigated in this study, the polymer composites reinforced with 150 µm particles consistently exhibited the lowest CTOD value. However, both the J integral and CTOD values generally increase with increasing initial crack length for all the analyses. This finding indicates an impressive level of crack-initiation resistance inherent in this material composition, especially in biopolymer composites reinforced with 150 µm banana fibres, highlighting their potential applications in fields where durability and performance are paramount. The simulations consider a homogeneous material subjected to Mode I tensile loading. Future studies should extend the analysis to account for yielding induced by shear stresses, using the Tresca failure criterion, to provide a more comprehensive assessment of shear loading conditions.
Footnotes
Acknowledgement
The authors acknowledged the support of Durban University of Technology, South Africa, and the publication of the journal through SANLiC Open Access transformational agreements.
Funding
The authors received no financial support for the research, authorship, and/or publication of this article.
Declaration of conflicting interests
The authors declared no potential conflicts of interest with respect to the research, authorship, and/or publication of this article.
Data Availability Statement
Data will be made available on reasonable request from the corresponding author.