
Abstract
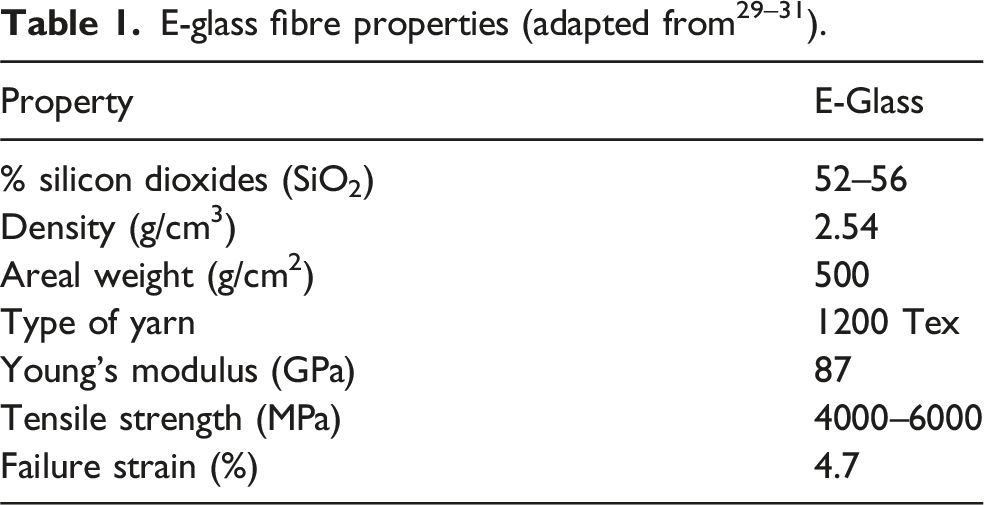
Recycling composite materials presents a viable solution to reduce waste and promote sustainability, yet challenges remain in maintaining mechanical performance and feasibility for reuse. This study evaluates the strength of recycled composite materials and experimentally investigates their feasibility. Composite plates were produced using thermoset resin reinforced with fibreglass, with variations incorporating recycled fibreglass scraps and polymeric particles from automotive components. Mechanical characterisation was conducted through tensile, shear, mode I and mode II fracture tests, to assess their structural integrity. Results demonstrated that the plate containing fibreglass particles, from recycled sources, exhibited the most favourable balance between mechanical properties and cost-effectiveness. A case study on a wind turbine blade reinforced the potential of recycled composites for industrial applications, highlighting fibreglass fibre reinforcement as the most promising option from a sustainability perspective. Among the recycled reinforcements investigated, reclaimed fibreglass particles provided superior tensile modulus and strength compared to PA and PP particles owing to the intrinsically high stiffness and strength of fibreglass, even in discontinuous form coupled with the preserved silane sizing that ensures strong interfacial bonding with the epoxy matrix. These findings contribute to the advancement of composite recycling strategies, promoting the circular economy while maintaining material performance for structural applications.
Keywords
Introduction
A material is classified as a composite when two or more materials, with distinct physical and chemical characteristics, are combined macroscopically to create a material with superior qualities to each of the individual materials. 1 In polymeric composites, the reinforcement, which constitutes the dispersed phase, is responsible for the chemical and physical properties of the final product. 2 Typically, reinforcements are selected for their high strength and stiffness and can take the form of particles, short fibres, or long fibres. Fibre reinforcements, particularly glass, carbon, and aramid fibres, are preferred for their superior mechanical properties. 3 Glass fibres are widely used in wind turbine blades, boat hulls, and construction materials due to their affordability and strength. 4 Carbon fibres are applied in aerospace structures, sports equipment, and automotive body panels for their stiffness and low weight. 5 Aramid fibres, such as Kevlar, are commonly found in bulletproof vests, high-performance ropes, and protective clothing due to impact resistance and thermal stability. 6 However, natural fibres, derived from plant, animal, or mineral sources, have gained attention in sustainable manufacturing due to their eco-friendly characteristics and cost-effectiveness. 7 Automotive companies incorporated natural fibres in components such as sunroof structures and trunk panels, reducing environmental impact. 8 Polymer matrices, classified into thermoplastic and thermosetting types, play a crucial role in composite performance. Thermoplastic matrices, such as polypropylene or polyethylene, offer impact resistance and moisture resilience. They are commonly used in food packaging, lightweight automotive components, and reusable containers. 9 Conversely, thermosetting matrices, such as epoxy and polyester resins, exhibit stiffness, thermal stability, and excellent fibre impregnation due to their low viscosity and find application in aerospace parts, printed circuit boards, and high-performance adhesives. 10
The most common physical tests for composites are the composite density, void content, and fibre volume fraction tests. 11 Mechanical characterisation tests determine key properties by subjecting composite samples to tensile, compressive, shear, or flexural loads. Standards such as ASTM D3039, BS 2782, and ISO 527 define dimensions and parameters, with ASTM D3039 being the most common. 12 Compression tests determine compressive strength, modulus, ultimate strain, and Poisson’s ratio. Standards like ASTM D695, D3410, and D6641 address these tests, with ASTM D3410 being the simplest. 13 Shear testing can be undertaken by different tests, such as the ±45° Tension Test, the Iosipescu Shear Test, the block shear test, the Rail Shear Test, and the V-Notched Test. 14 Flexural tests, such as three-point and four-point bending, are cost-effective to estimate the elastic modulus and flexural strength. Standards like ASTM D790 and ASTM D6272 define specimen dimensions and test procedures. The four-point method reduces shear forces between load points, ensuring consistent bending behaviour. 15 Fracture tests are categorized into three modes: Mode I, Mode II, and Mixed Mode I + II, differentiated by the type of loading. The Double Cantilever Beam (DCB) test is the most common for assessing Mode I fracture resistance, measuring the critical strain energy release rate (G IC ). 16 The specimen geometry, particularly the initial crack length, are defined by standards like ASTM D5528-13. The End Notched Flexure (ENF) test evaluates Mode II interlaminar fracture toughness (G IIC ). 16 Although widely used, ENF tests may produce unstable crack propagation. Alternative methods, such as the End Loaded Split (ELS) and 4-Point End Notched Flexure (4ENF) tests, address these limitations. 17 Among mixed-mode methods, the Mixed-Mode Bending (MMB) test is widely recognized. 18 Initially proposed by Reeder and Crews, 19 the MMB test includes adjustments for material-specific elastic properties, addressing crack-tip rotation and displacement.
With the growing production and usage of fibre-reinforced composite materials, the need for effective end-of-life solutions has increased. Material recycling plays a major role in the sustainable development of industrial processes. However, recycling composite materials is particularly challenging due to the differences in properties between reinforcements and matrices, such as glass transition temperature and mechanical strength. 20 Recycled composites typically exhibit inferior properties compared to the original materials, which limits their applications. Additionally, challenges such as the lack of market demand for recycled composites and high recycling costs further complicate their reuse. 20 Being primarily plastic-based, these materials are non-biodegradable, meaning they do not decompose naturally in a short time without causing environmental harm. In response, the European Union has taken measures to phase out landfill disposal and incineration of composites. These regulations drive industries to adopt recycling and reuse processes. 21 Thus, composite material manufacturers must ensure the recycling and reuse of their end-of-life materials. 21 The wind energy sector exemplifies the relevance of composite recycling in renewable energy contexts. Wind power is a clean, inexhaustible energy source essential for sustainable development. Wind turbines, which rely on enormous blades often made from glass-fibre-reinforced epoxy composites, generate renewable energy. However, about 10 % of the materials used in blade manufacturing become waste during cutting. 20 Wind turbine blades have an estimated lifespan of 20 to 25 years. Given the thermoset-matrix composites used in blade production, there is a strong push to improve recycling techniques. Historically, end-of-life blades were sent to landfills without material recovery. However, the economic value of the glass fibres within these blades has spurred research into recycling processes to repurpose these materials. 22
Pegoretti 23 reviewed recycling technologies for continuous fibre reinforced thermoplastic composites. The work highlighted recent advancements in recycling techniques aimed at promoting material circularity. Most waste from these composites originates during production. The study concluded that mechanical and chemical recycling processes are the most effective for fully recovering fibres and matrix materials both during production and at the end of the composite’s lifecycle. Mamanpush et al. 24 investigated second-generation composites made from recycled wind turbine blades and polyurethane adhesive. The blades were shredded to a specific particle size, mixed with resin, and compressed to achieve the final thickness and compactness. The effects of particle size, moisture content, and resin content on the mechanical properties of the recycled composites were evaluated. The authors concluded that recycling wind turbine blades is feasible and a promising process to produce high-performance composites. Zhang et al. 25 critically reviewed technologies to recover carbon fibres, polymers, and continuous-fibre-reinforced composites up to 2020. The authors discussed emerging research on biodegradable thermoplastics aligned with radical recycling strategies, and highlighted three main recycling methods: mechanical, thermal, and chemical, which have been extensively studied and are commercially available for industrial operations. Ikenaga et al. 26 described a novel recycling process to produce composites from glass-fibre-reinforced plastics (GFRP). The process involved decomposing GFRP using non-catalytic reactions with ethylene glycol monomethyl ether (EGMA). The decomposition product, EGMA-P, showed high reactivity when combined with unsaturated polyester (UP) and a curing agent. The final product, EGMA-HM, exhibited excellent thermal stability and high flexural strength, demonstrating a promising approach for recycling GFRP. Cousins et al. 27 evaluated the feasibility of recycling wind turbine blade components made from Elium thermoplastic resin reinforced with glass fibres. Tests were conducted to assess material properties post-recycling, focussing on thermal degradation, shredding, and matrix dissolution for fibre recovery. The matrix dissolution method successfully recovered both the polymer matrix and intact glass fibres. The fibres retained their stiffness and strength after the recycling process, anticipating a viable method to recycle thermoplastic composites. Chen et al. 22 provided an overview of recycling and reuse technologies for composite materials. The authors emphasized that current recycling methods require significant improvements to become cheaper, less polluting, and more efficient. The development of high-performance composite reuse technologies was suggested to expand the market for recycled composites. For wind turbine blades, it was suggested to use eco-friendly materials such as natural fibres, modified thermoset resins, and recyclable thermoplastic resins to make wind energy a truly sustainable resource.
This study evaluates the strength of recycled composite materials and investigates their feasibility through both numerical and experimental simulations. Four composite plates were produced using a thermoset resin reinforced with fibreglass, with variations incorporating recycled fibreglass scraps and polymeric particles from automotive components. Mechanical characterization was conducted through tensile and shear mechanical tests, and also mode I and mode II fracture tests, to assess their structural integrity.
Materials and methods
Material selection
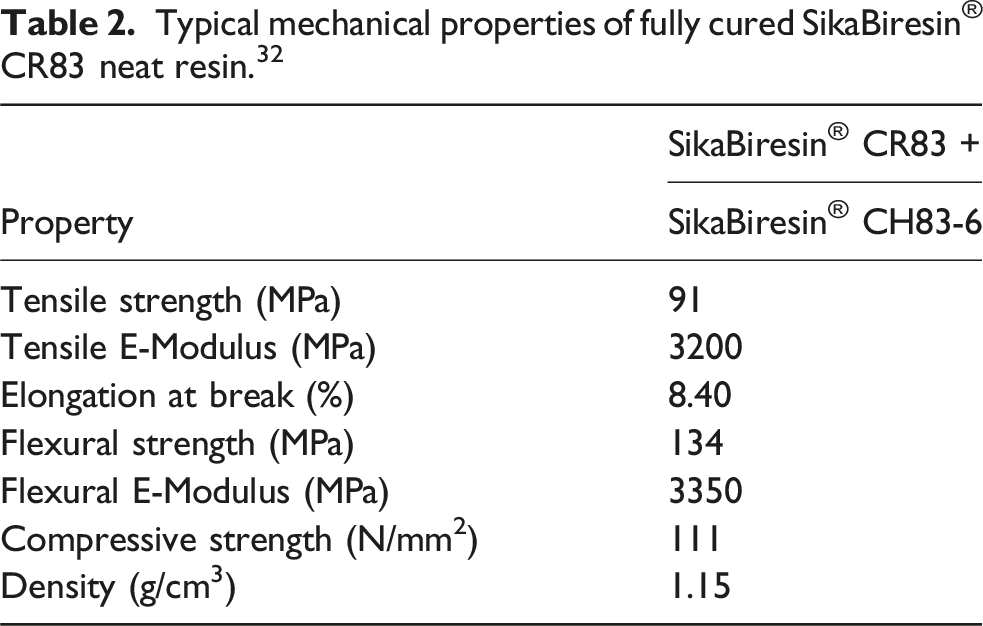
Typical mechanical properties of fully cured SikaBiresin® CR83 neat resin. 32
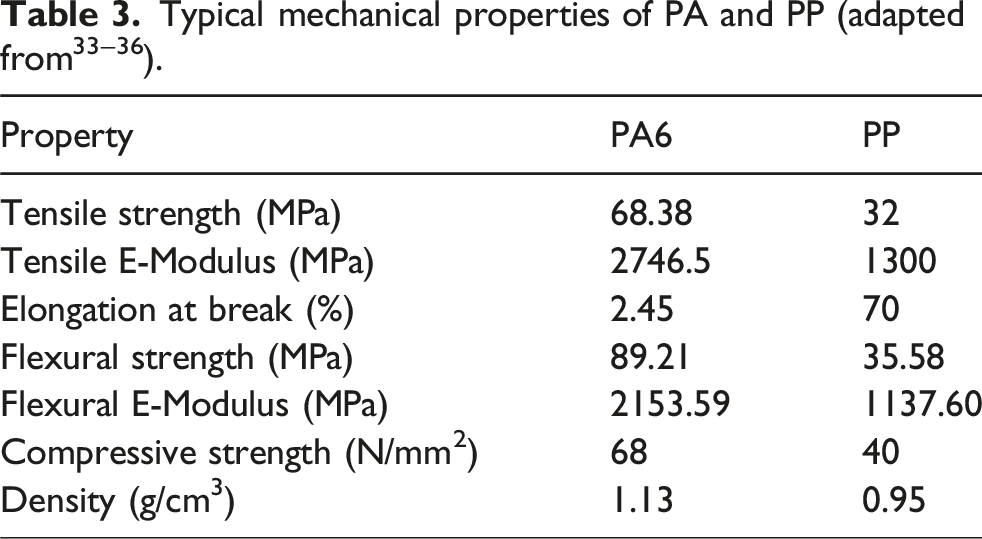
The recycled fibreglass particles used in Plate 2 were obtained directly from the waste generated during cutting of the virgin fibreglass fabric employed for the outer plies of all plates and plate 1. After rough cutting of the 300 × 300 mm2 fabric layers to fit the mould, the remaining trimmings were collected and further shredded until roughly a 2-5 mm size was obtained. The polyamide (PA6) and polypropylene (PP) particles used in Plates 3 and 4 originated from post-industrial automotive shredder residue. The material was provided in granulated form. The resulting particles were irregular granules with low aspect ratio (typically 1–4).
Geometries
With the aim of characterizing the various developed specimens, four types of tests were carried out: tensile tests, Block Shear (BS) shear tests, Mode I fracture tests (DCB), and Mode II fracture tests (ENF). The main objectives of the tensile test are to determine the longitudinal elastic modulus of the composite, as well as its Poisson’s ratio and yield stress. According to ASTM D3039, two types of specimens can be considered: “dog-bone” specimens or rectangular specimens. Due to limitations in specimen machining, rectangular specimens were chosen for manufacturing, as illustrated in Figure 1a. The specimens for tensile tests have different thicknesses in each plate, as the reinforcements used in the intermediate layers of the four plates vary, allowing for differences in the compaction of each one. Tensile (a) and BS (b) specimen geometries and dimensions; BS specimen side view (c).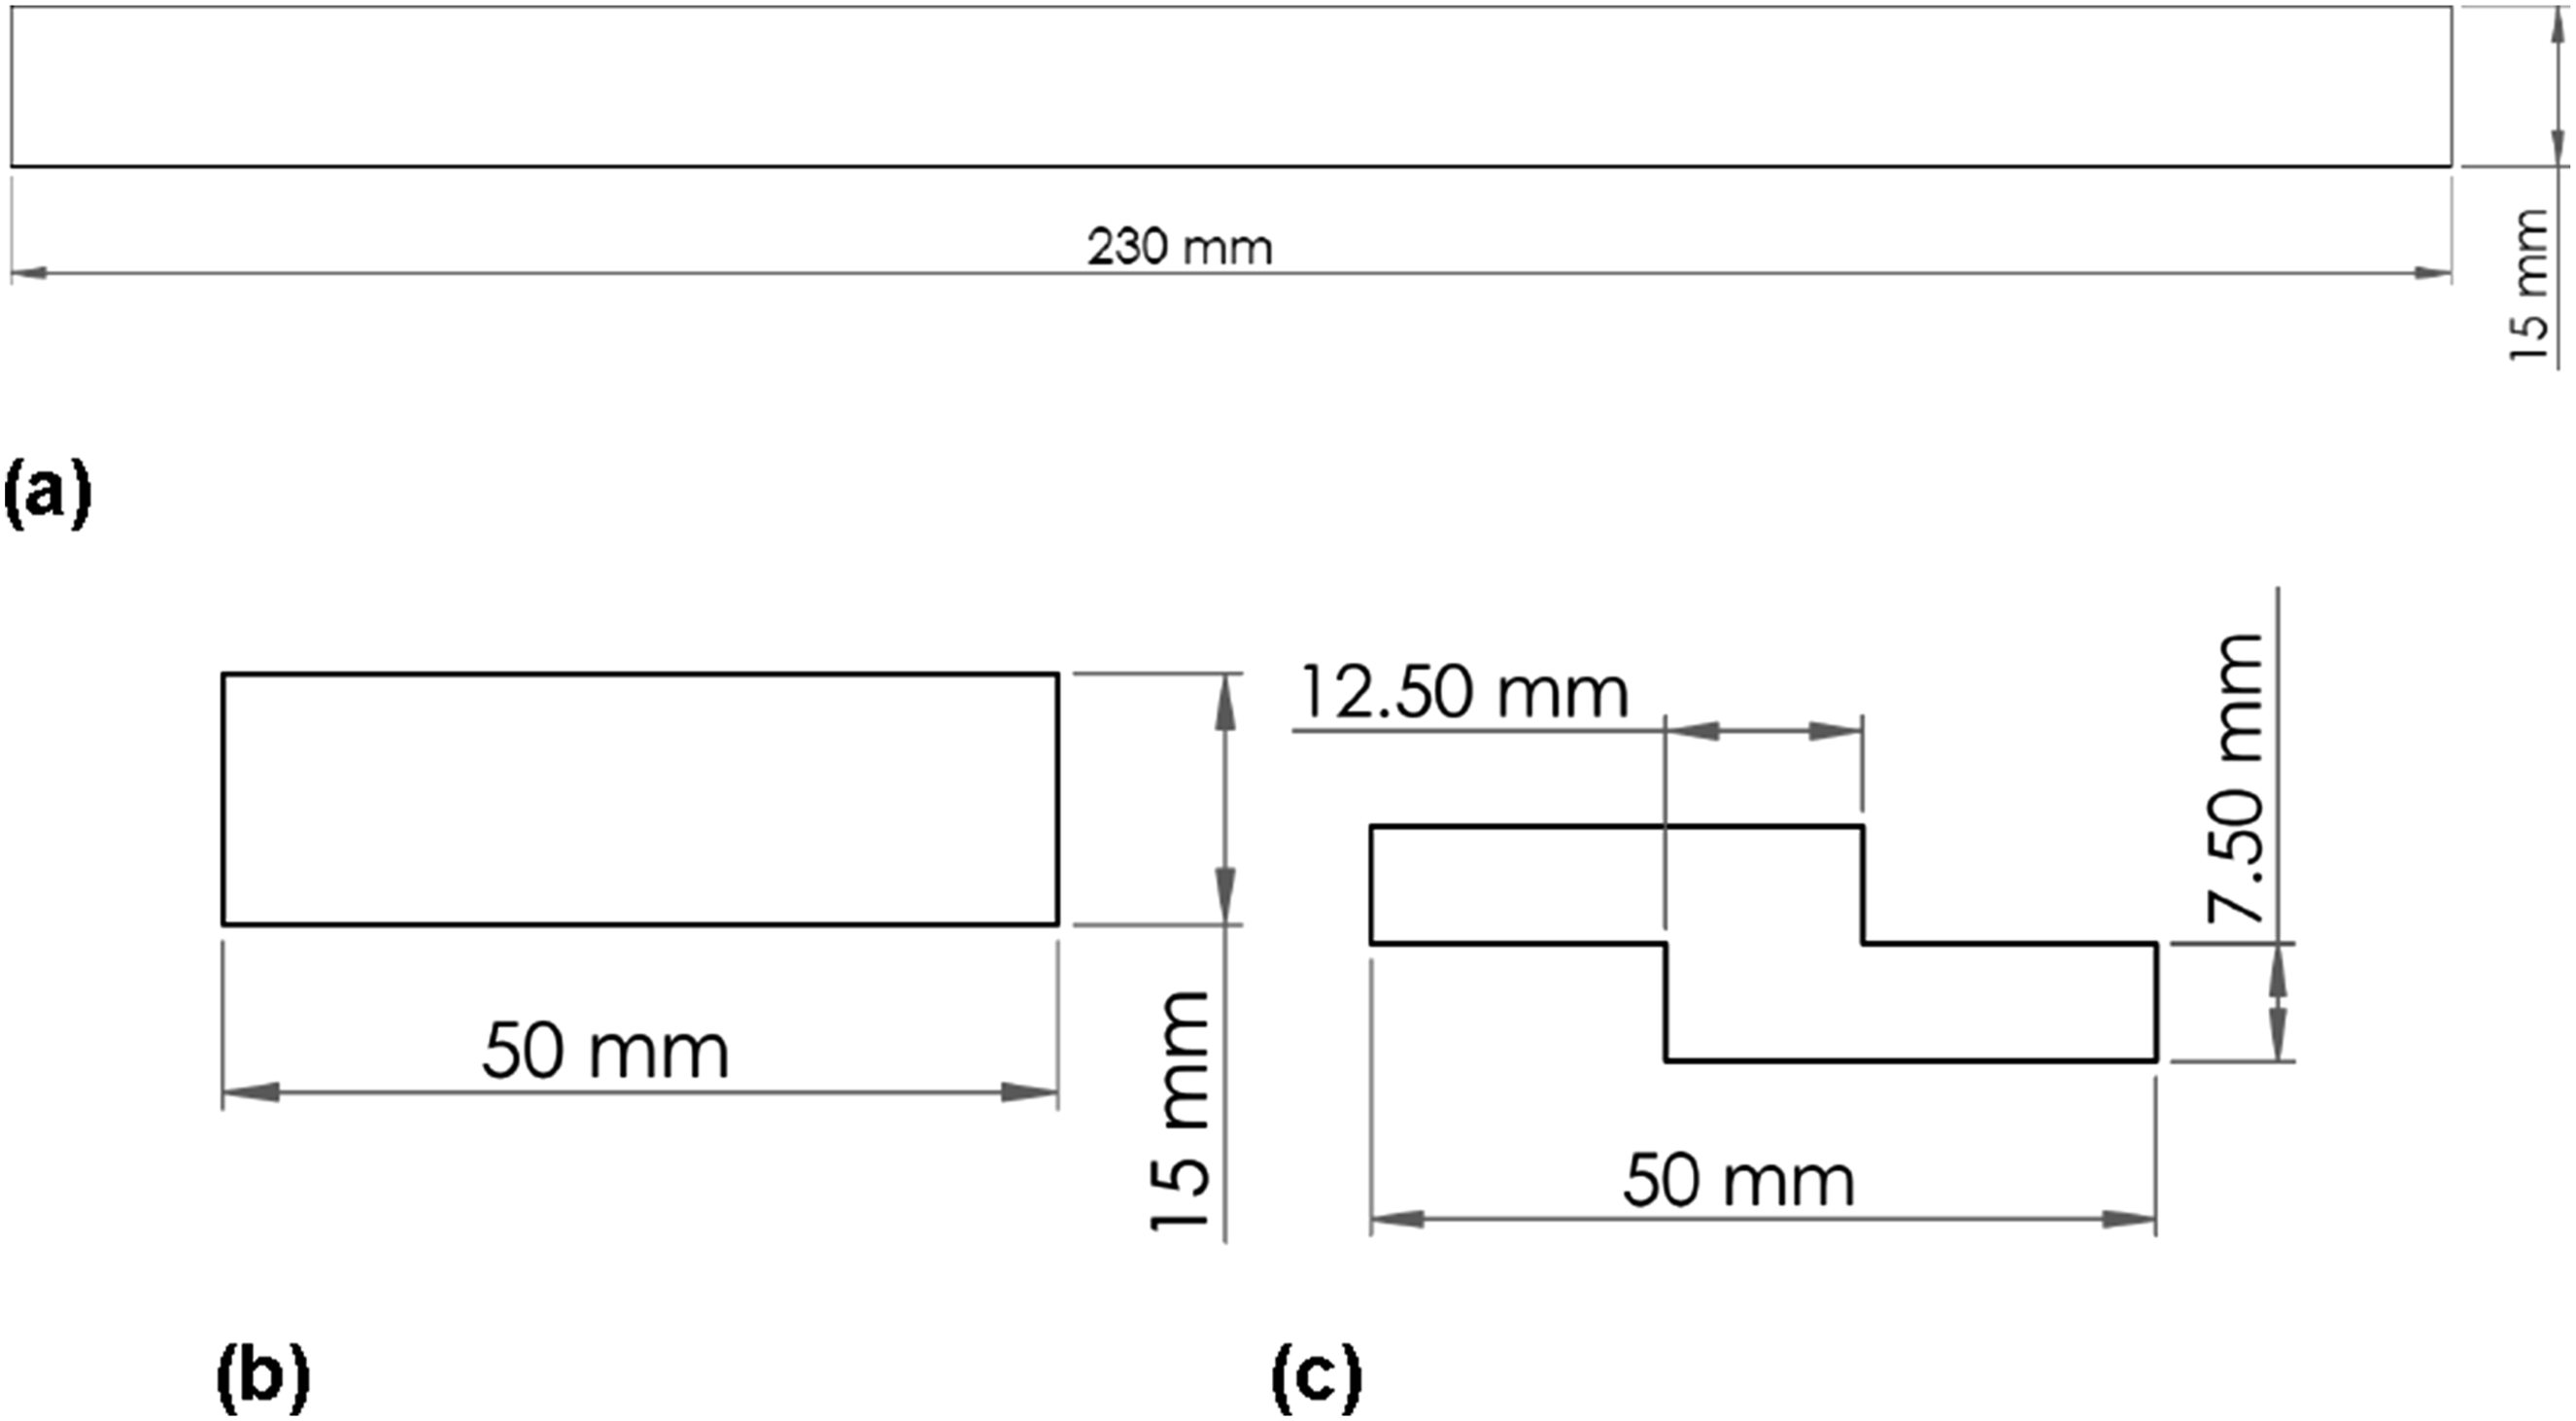
The BS shear test aims to determine the shear modulus, G, of the tested material. The shear tests followed the methodology described in the ASTM D4501-01 standard. In this test, only the applied force over time is recorded, allowing the calculation of the maximum shear stress and subsequently the shear modulus. First, the plates are cut into strips with the dimensions shown in Figure 1(b). Then, the specimens are machined at opposite faces to produce the desired geometry (Figure 1(c)). The mode I fracture test is accomplished by DCB testing and, during the test, the applied load and displacement values are recorded to enable data reduction and G
IC
estimation. A Teflon strip was placed in the mid-thickness of each plate, covering a 50 mm length from one of the edges, to create the pre-crack for both tests. According to the ASTM D5528-13 standard, the specimens must consist of plates longer than 125 mm, 25 mm in width, and between 3 and 5 mm thick. At one of the ends, a notch is made at the mid-plane of the specimen’s thickness, 50 mm long. This is referred to as the pre-crack and is identified as a0. For fixing the DCB specimens in the test setup, stainless steel piano-type hinges were adhesively bonded. The DCB specimen geometry is given in Figure 2(a). The specimen preparation and geometry are identical between mode I and II fracture tests although the dimensions differ. Mode II fracture testing was carried out using the ENF specimen geometry, aiming to estimate G
IIC
. The main difference between ENF and DCB specimens relates to the dimensions, as shown in Figure 2(b). The ENF specimens are lengthier due to the 3-point bending setup and required minimum length for crack propagation. DCB (a) and ENF (b) test geometries and dimensions.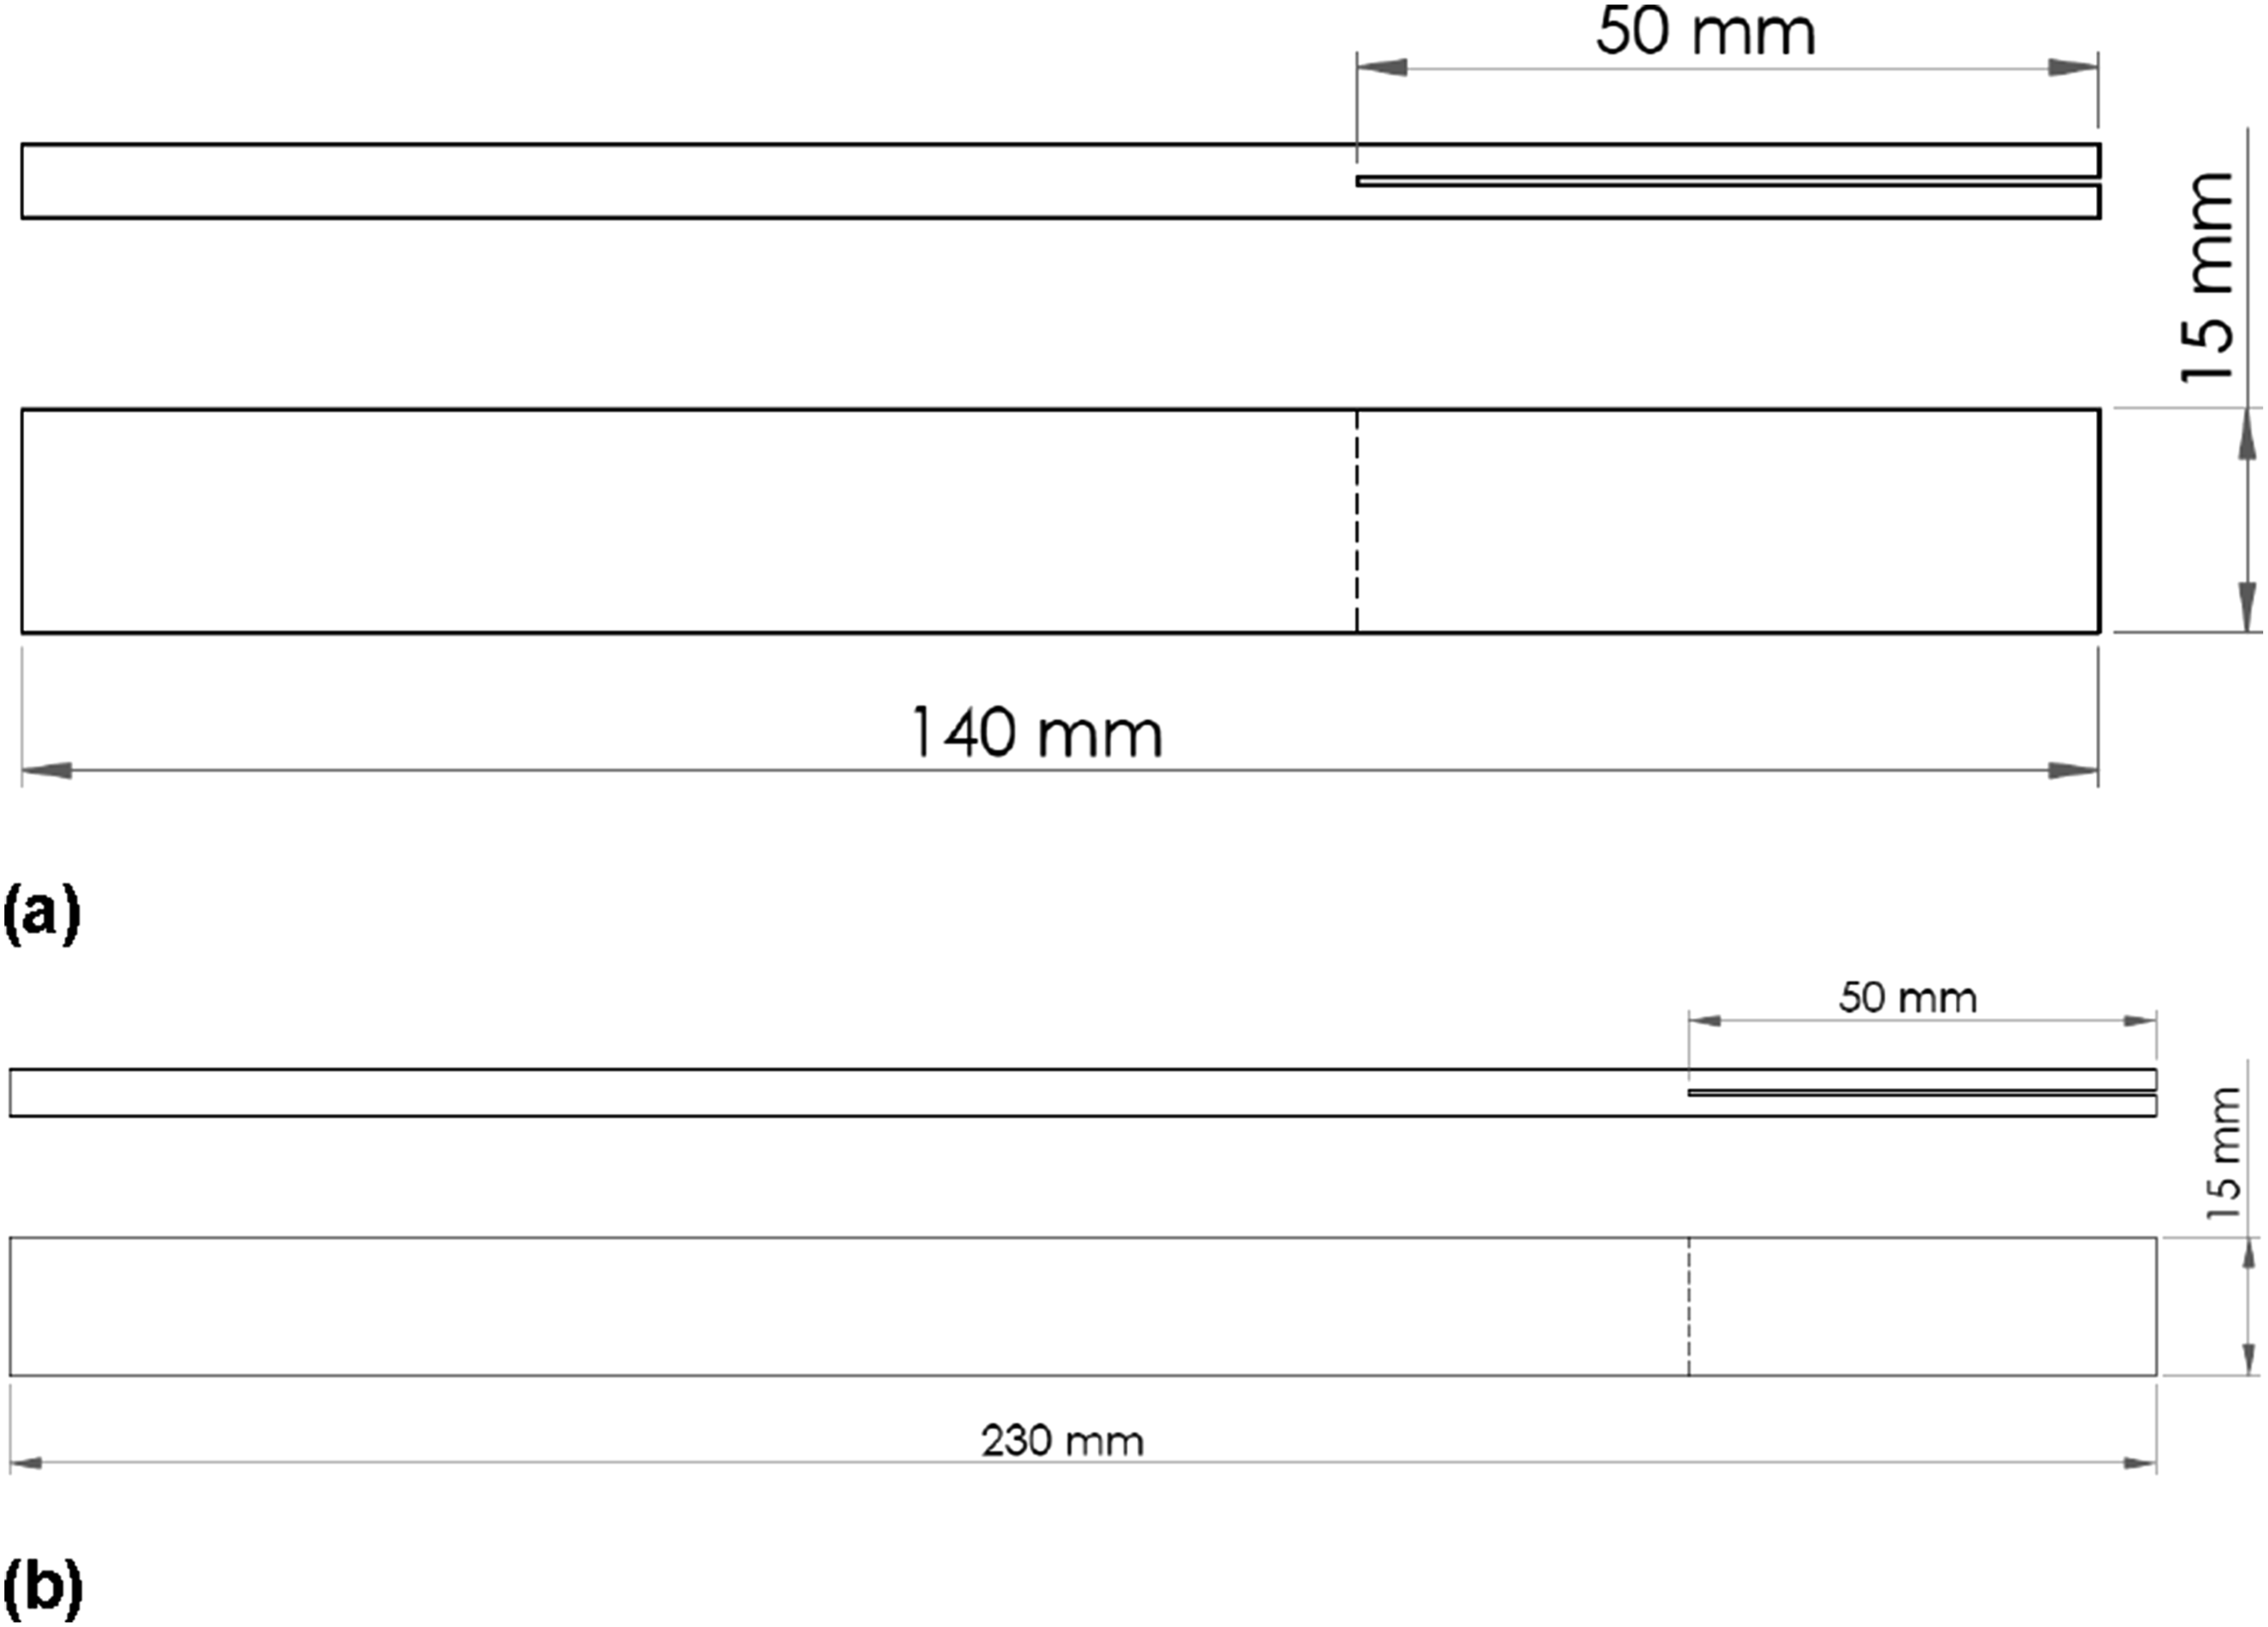
Specimen fabrication
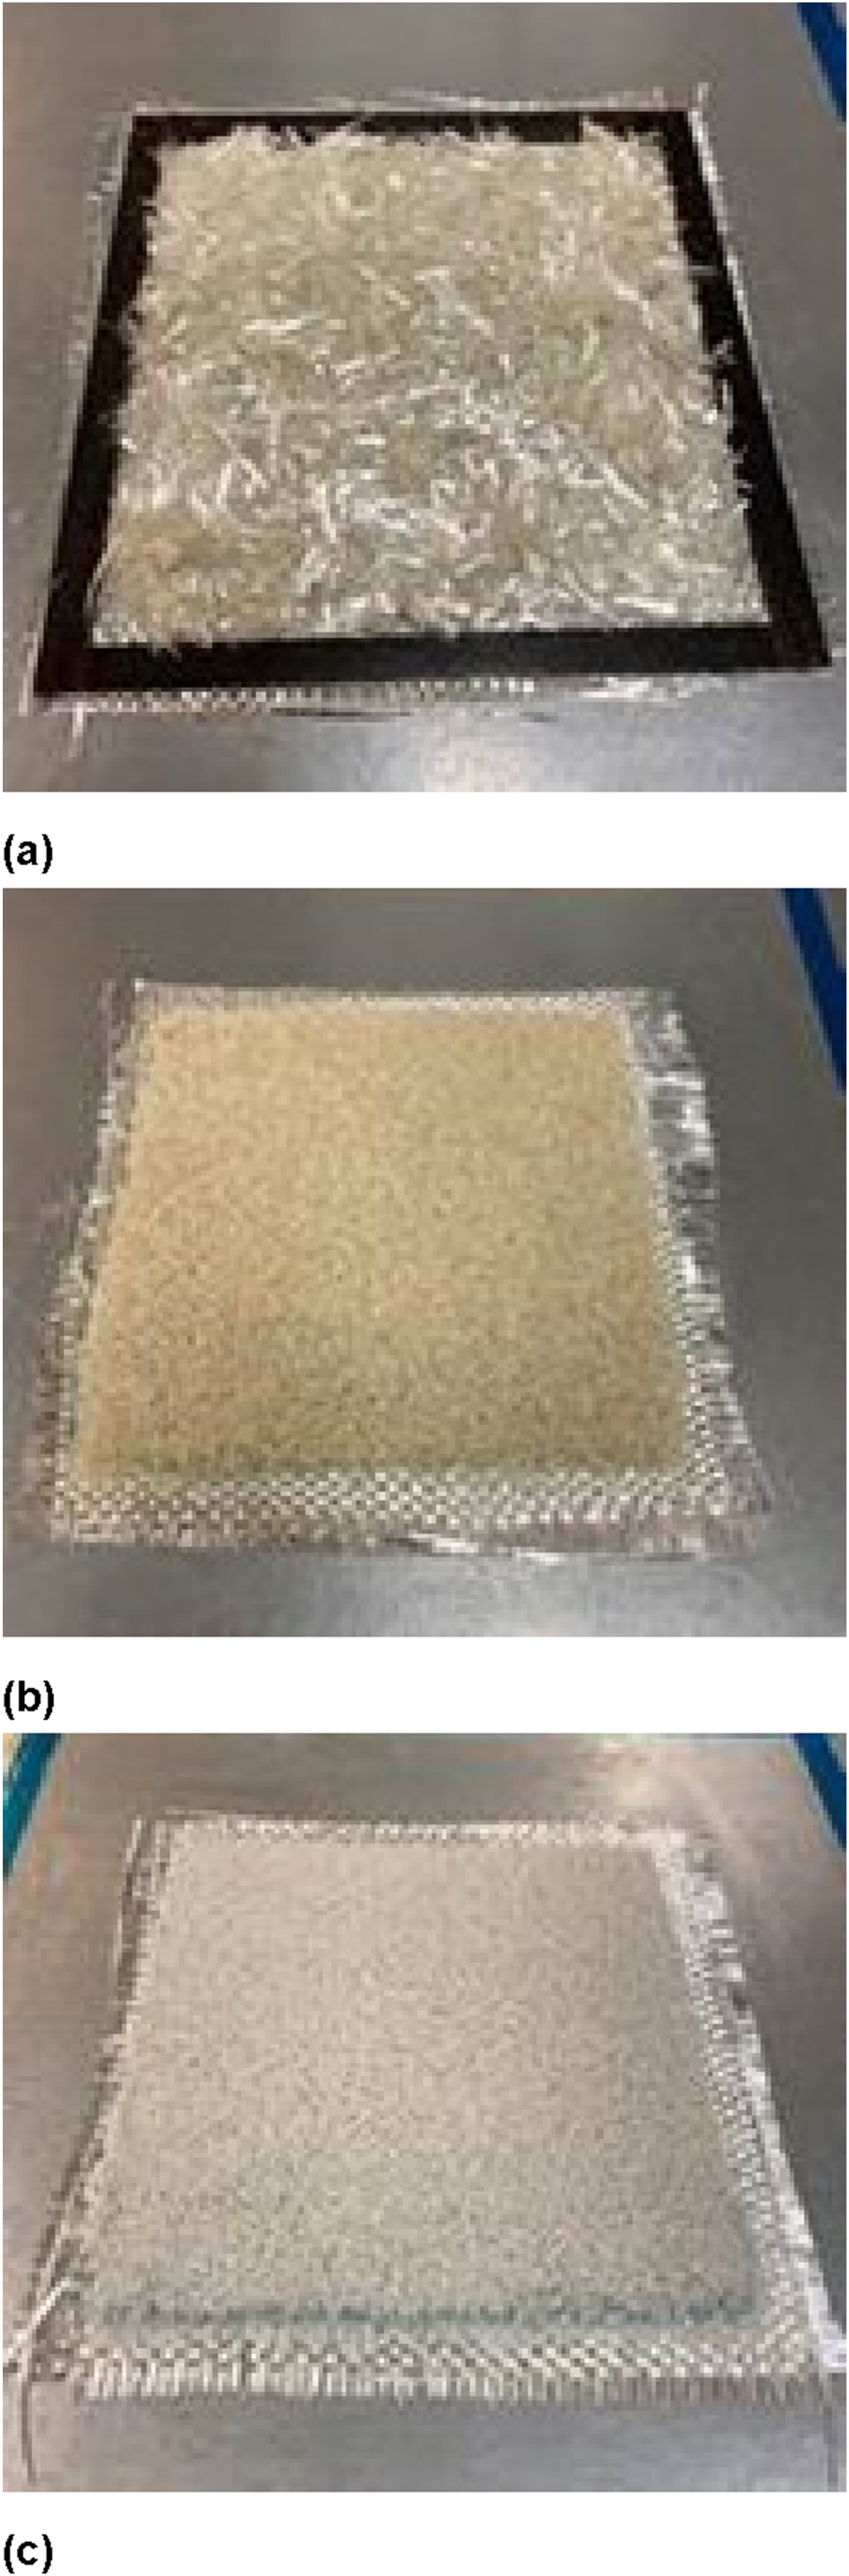
As part of the experimental work, the reuse of composite waste generated during the manufacturing process of virgin and shredded composites was explored. Plate 1 was reinforced with new fibreglass fabric and serves as a reference for comparison with the other three plates made with reused material. Thus, in plate 2, fibreglass particles recovered from its cutting process were used, while plates 3 and 4 contain PA and PP particles, respectively. These were obtained through a double shredding process of automotive components. With this combination of materials, different recycled reinforcement types are evaluated, and it becomes possible to identify the most promising recycling option for structural reuse, by combining mechanical/fracture performance, cost-effectiveness, and sustainability potential. Figure 3 illustrates the stacking arrangement for all four plates. Plate 1 consists of a reinforcement with a uniform stacking of fibreglass fabric layers (12 layers of 300 × 300 mm2, equivalent to 775.8 g of material). Plate 2 is made up of four fibreglass layers of the same material as plate 1, reinforced with non-uniformly cut particles from the same material, randomly distributed between the four layers (Figure 4(a)). Plate 3 has four fibreglass layers (two on each side of the plate) with PA particle reinforcement (600 g) between them (Figure 4(b)). Plate 4 differs from plate 3 only in the reinforcement material used, since it consists of four fibreglass layers (two on each side of the plate) with PP particle reinforcement (600 g) between them (Figure 4(c)). Thus, all four plates follow the same stacking arrangement, differing only in the reinforcement material used in the intermediate layer. Stacking arrangement of the plates. Arrangement of the cut fibres in plate 2 (a), PA particles in plate 3 (b), and PP particles in plate 4 (c).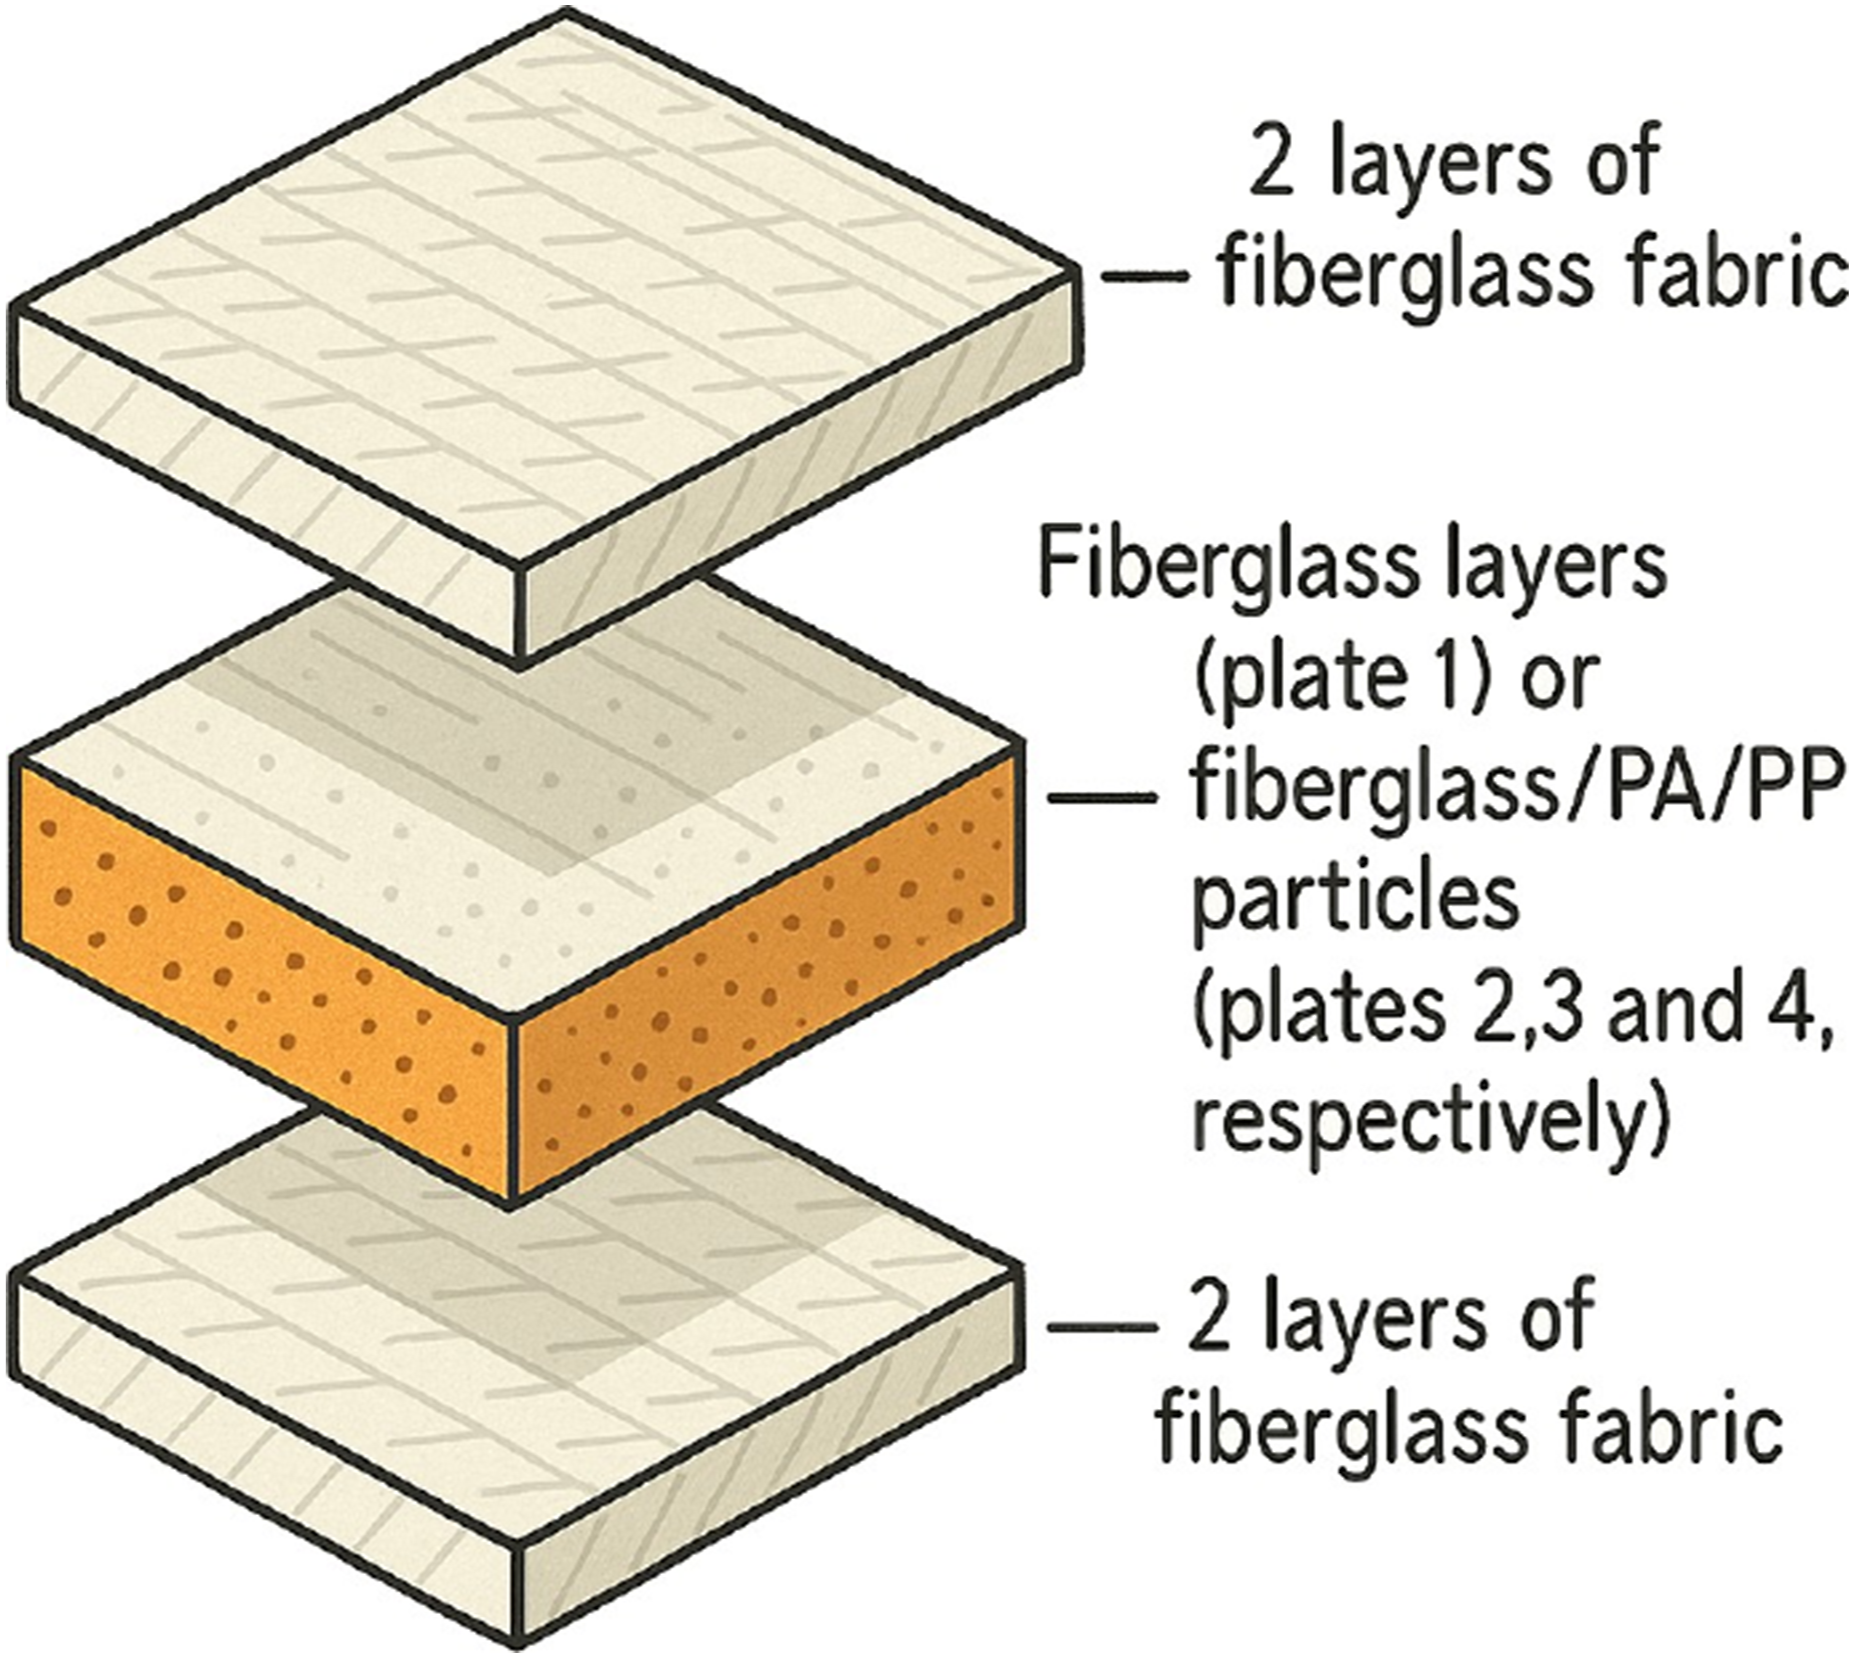
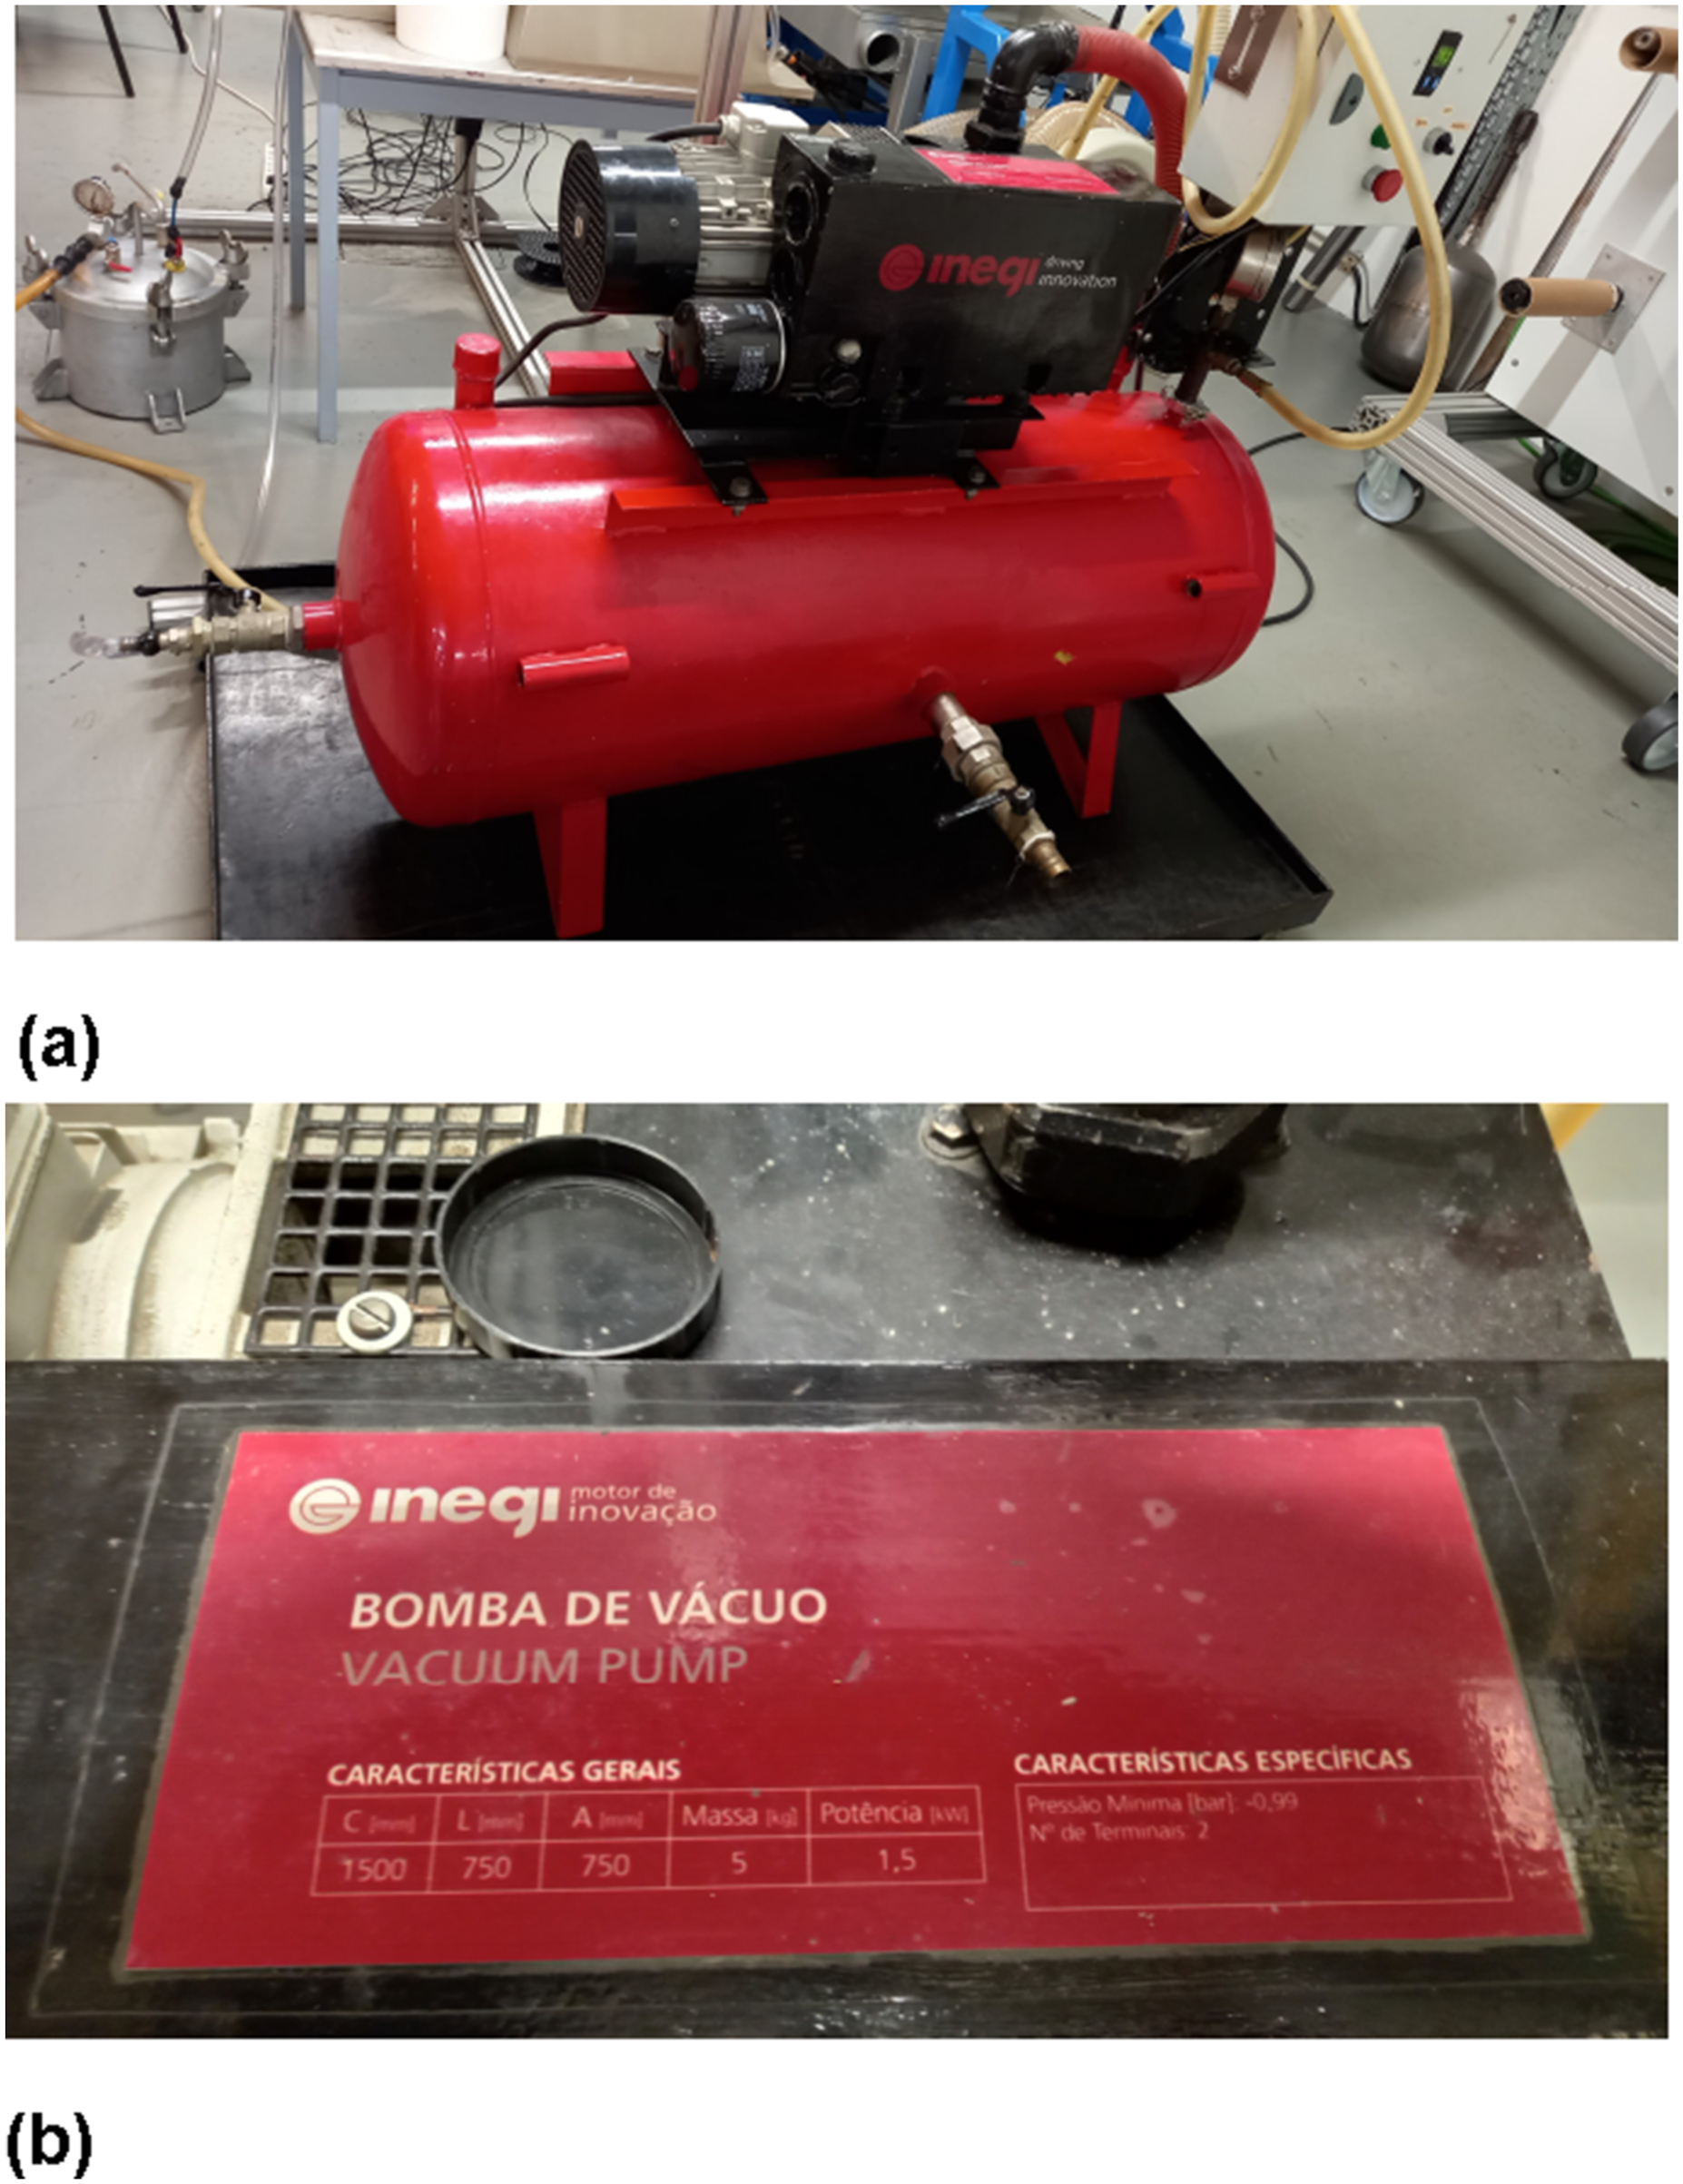
The manufacturing process begins with cutting the fibreglass fabric layers. Those layers are placed on top of a mould, that in this case it consists of a flat steel surface. To prevent the resin to adhere to such mould a release agent is applied to its surface. Next, the various layers are stacked, starting with the deposition of the peel-ply, followed by a perforated film and the flow-mesh. Then, the resin inlet and outlet lines are inserted, the vacuum bag is placed, and it is sealed onto the mould surface. Finally, the resin injection into the vacuum bag begins (Figure 5(a)), and after the curing of each composite plate, they are de-moulded. The final step in obtaining the specimens with their final dimensions consists of cutting the four plates. For the fabrication of the tensile specimens, it was only necessary to cut rectangular strips using a cutting saw (Figure 5(b)). The vacuum equipment used for the infussion process was a rotary slide vane pump (Figure 6(a)), of 1.5 kW of power (Figure 6(b)) and configured to operate at a pressure of −650 mbar. This vacuum value guarantees not only a slow process preventing the reinforcements to stay in place despite the resin flow, but also to generate a pressing force from the vacuum bag to keep the reinforcements and particles at their place. Resin injection into the vacuum bag (a). Obtained specimens (b). General view of the vacuum pump used with the vacuum infussion process (a). Details of the vacuum pump used (b).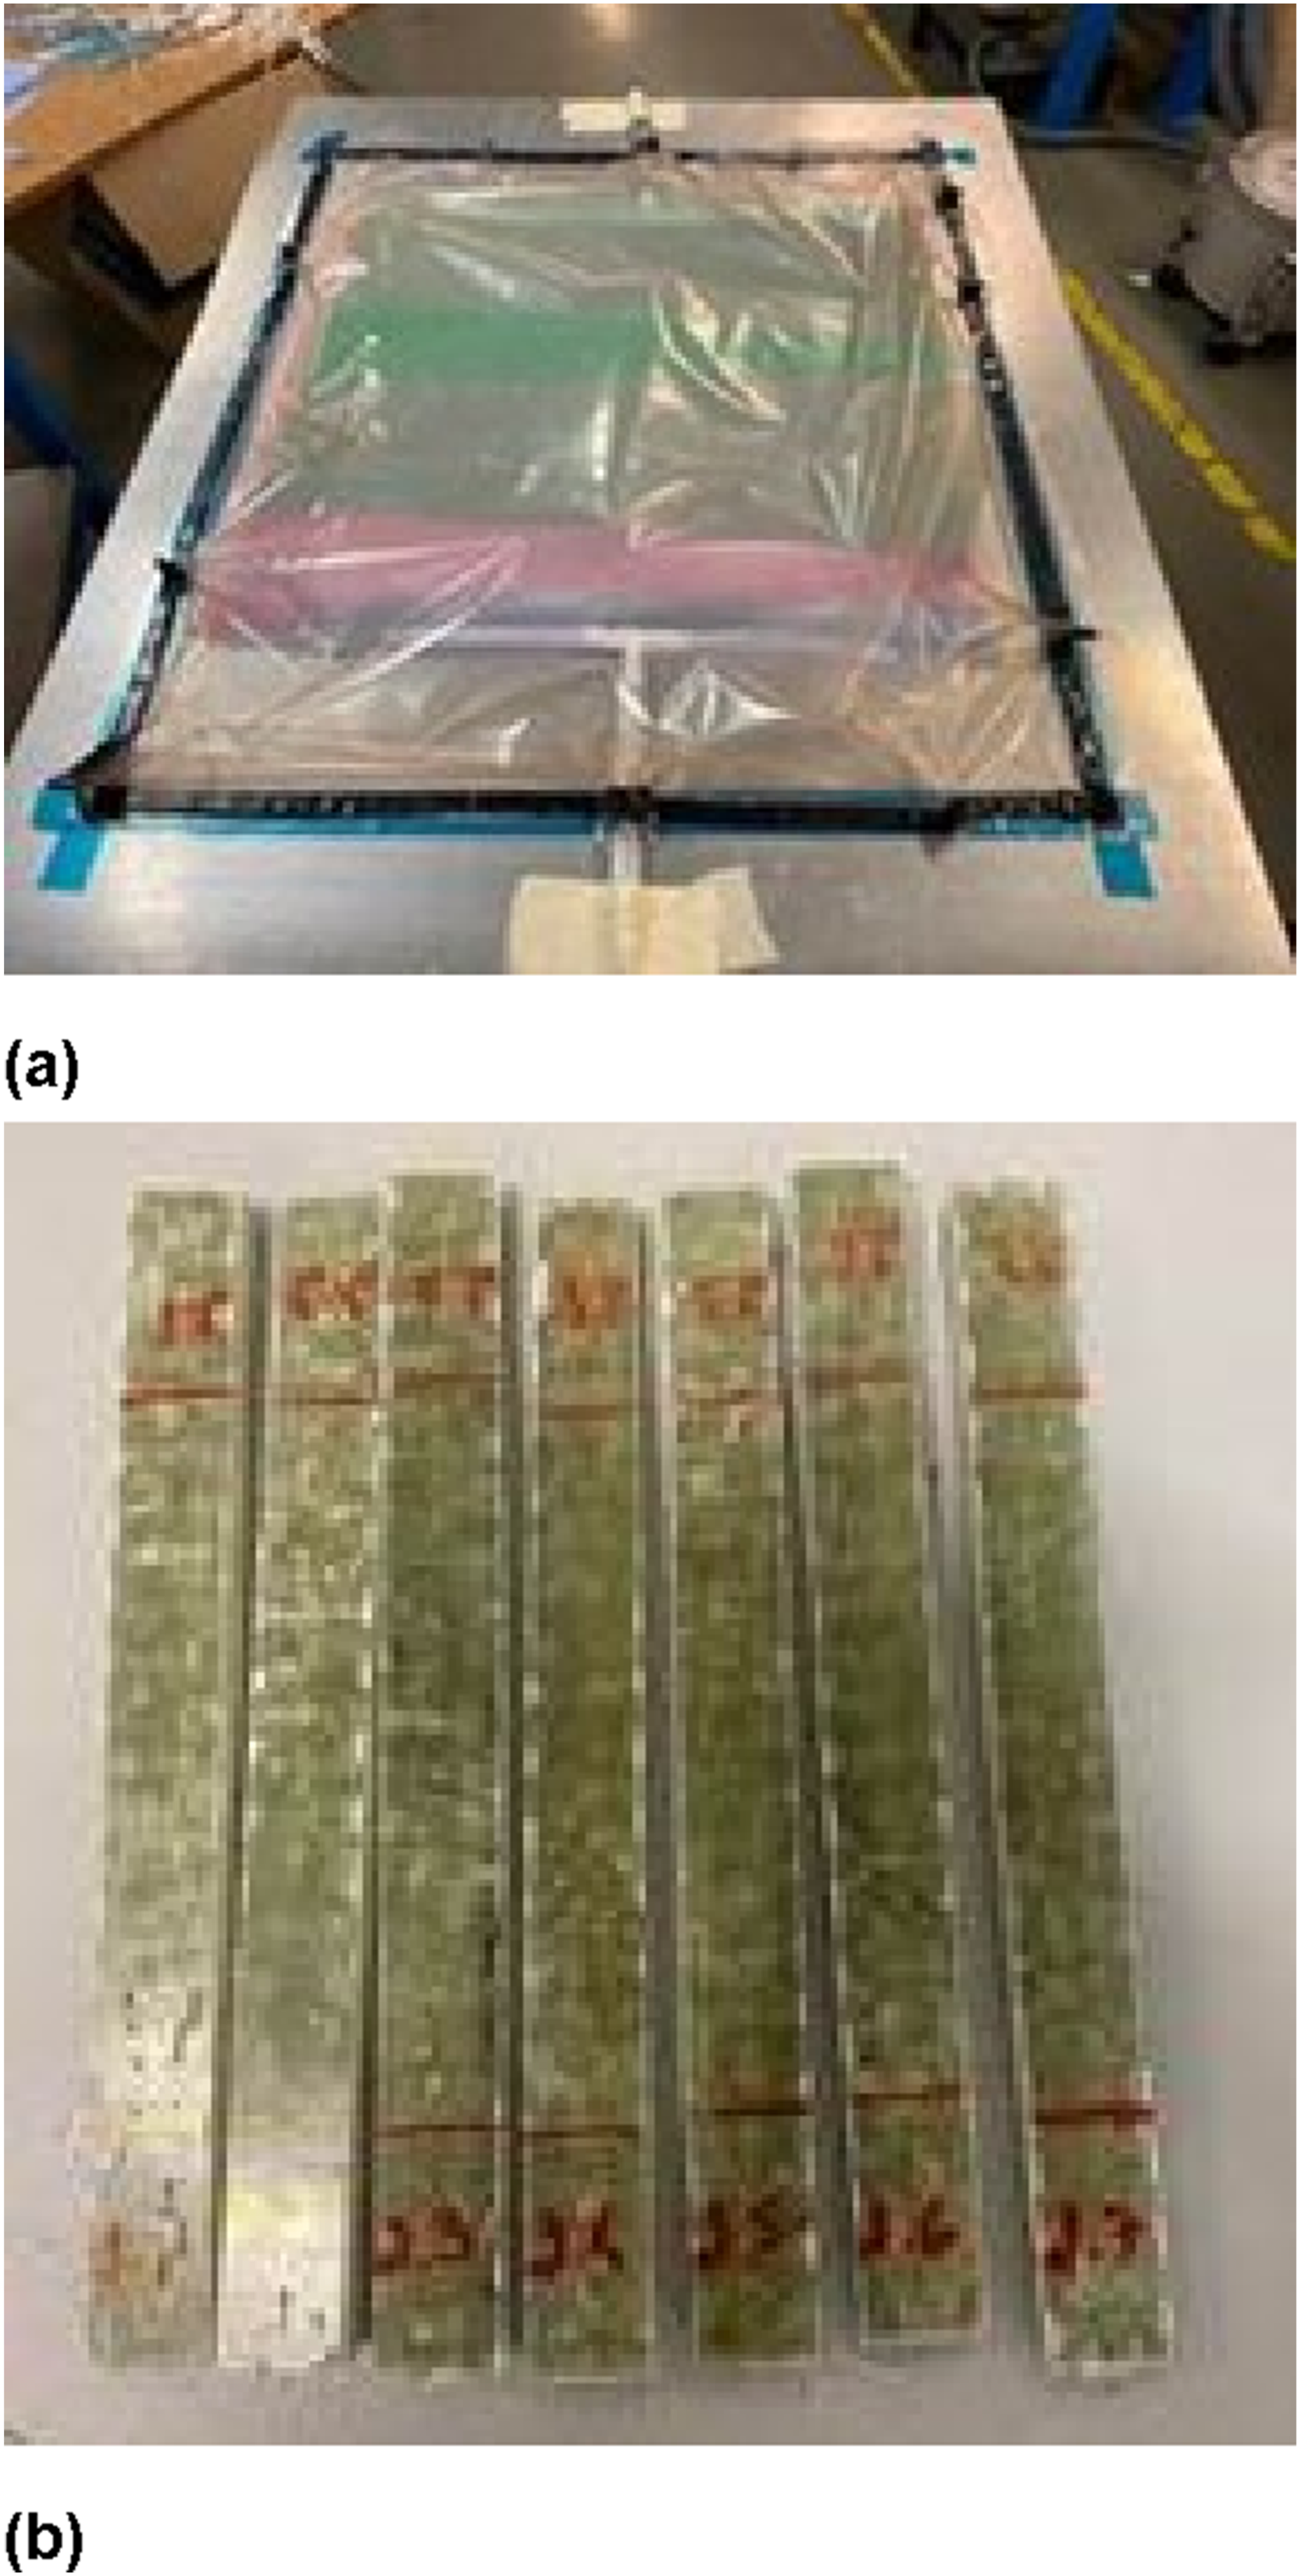
The specimens for the BS test were machined to ensure the required shape and dimensions for this type of test. For this purpose, a three-axis milling machine was used. After cutting the parallelepipeds, they were planned to ensure a uniform thickness across all samples and a surface free of irregularities. Subsequently, half of the specimen’s thickness was removed from both the top and bottom faces, leaving 12.5 mm at the centre of the specimens with the full original thickness. For all processes, a 20 mm diameter milling cutter was used at a rotation speed of 1120 r/min.
For the fabrication of the DCB and ENF specimens, a Teflon strip approximately 50 mm wide was placed at one end of each of the four plates during their preparation to create the pre-crack. For the preparation of the DCB specimens, metal hinges were glued at the cracked specimen side, which are essential to load the specimens in the testing machine. White correction fluid and a millimetric scale were also applied to enable crack length measurement during the test. Stainless steel piano hinges were glued to both sides of the DCB specimens using an adhesive suitable for composites with room temperature curing. In this case, Araldite 2015-1 was used. The final step in the fabrication of the DCB specimens consists of opening the initial pre-crack (a0) in each specimen from the four types of plates. The millimetric scale is then glued on, aligning the zero mark with the end of the pre-crack. The fabrication of the ENF specimens for Mode II fracture testing follows the same methodology. In the case of the ENF specimens, it is not necessary to glue hinges, and only white correction fluid is applied to one of the sides, along with a millimetric scale to allow crack length measurement.
Specimen testing
For all four types of tests, the Shimadzu AG-X 100 electromechanical testing machine was used, equipped with a 100 kN load cell. In the tensile tests, the rectangular specimens are fixed in the two grips in a vertical position (Figure 7(a)). The test begins when the upper grip moves away from the lower grip at a constant speed. The test ends when the specimen fails completely. For the tests conducted in this study, the test speed was 2 mm/min, and a clip-on extensometer was used. Using the extracted data, it is possible to calculate the stress (σ), strain (ɛ), and the Young’s modulus (E). In the BS test (Figure 7(b)), the maximum force (P
m
) is recorded during the test, used to obtain the maximum shear stress using the shear area. G is estimated using τ and γ during the initial loading stage. A jig is needed for this test in order to secure the specimen and apply shear loading to the overlap. All specimens were tested at 2 mm/min. After setting up the equipment and properly placing the specimens in the testing machine, P and δ were recorded throughout the test duration for further processing aiming to acquire τ, γ, and G. Tensile (a) and BS (b) test setups.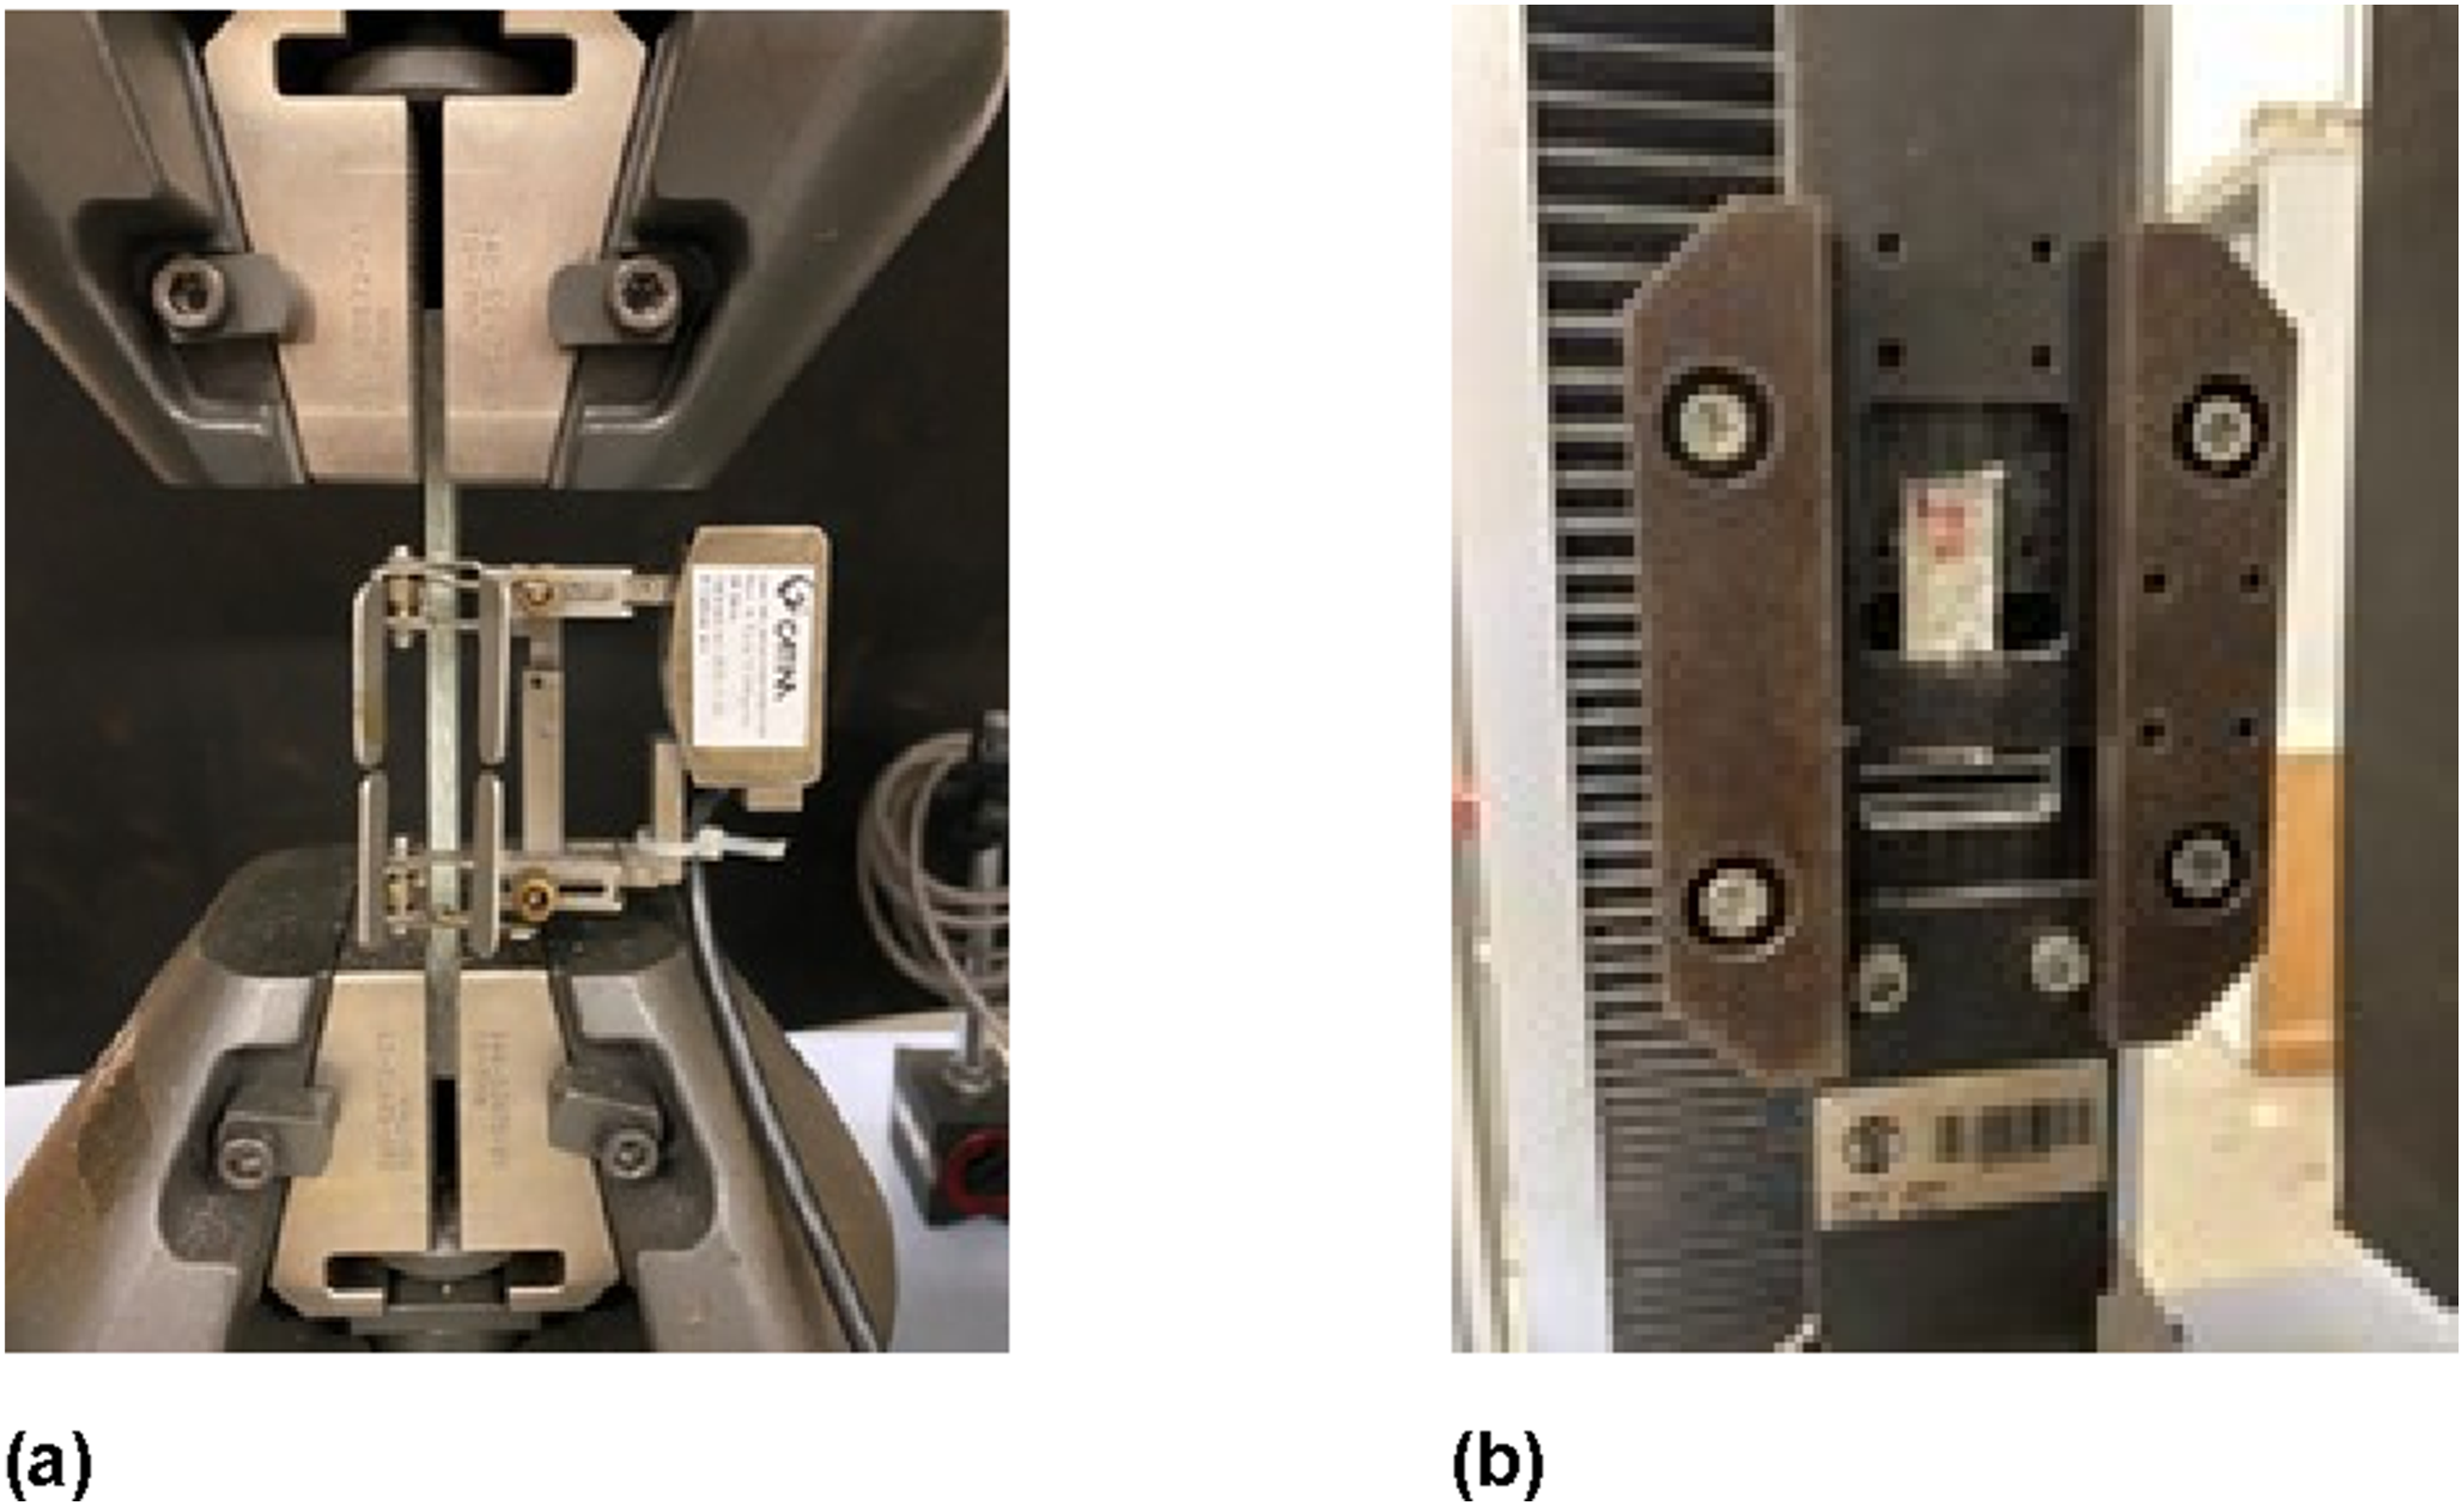
The DCB test is considered to estimate G
IC
(Figure 8(a)). This test involves applying a tensile force through the hinges at the pre-cracked end of the specimen. During the test, the crack propagates, and its growth is measured using a scale placed along the sides of the specimen. Simultaneously, P and δ are also recorded. To track the crack length (a) over time, a camera with a macro lens and a 20-megapixel resolution was used. Photographs were taken every 5 s from the start of each test until failure. The ENF test is used to characterize G
IIC
(Figure 8(b)). This test consists of a three-point bending setup, in which fracture initiates at the pre-cracked side. The load is applied at the midpoint of the specimen. In ENF tests, crack propagation tends to be unstable, and crack monitoring may be difficult since the crack propagates without a clear opening. DCB (a) and ENF (b) test setups.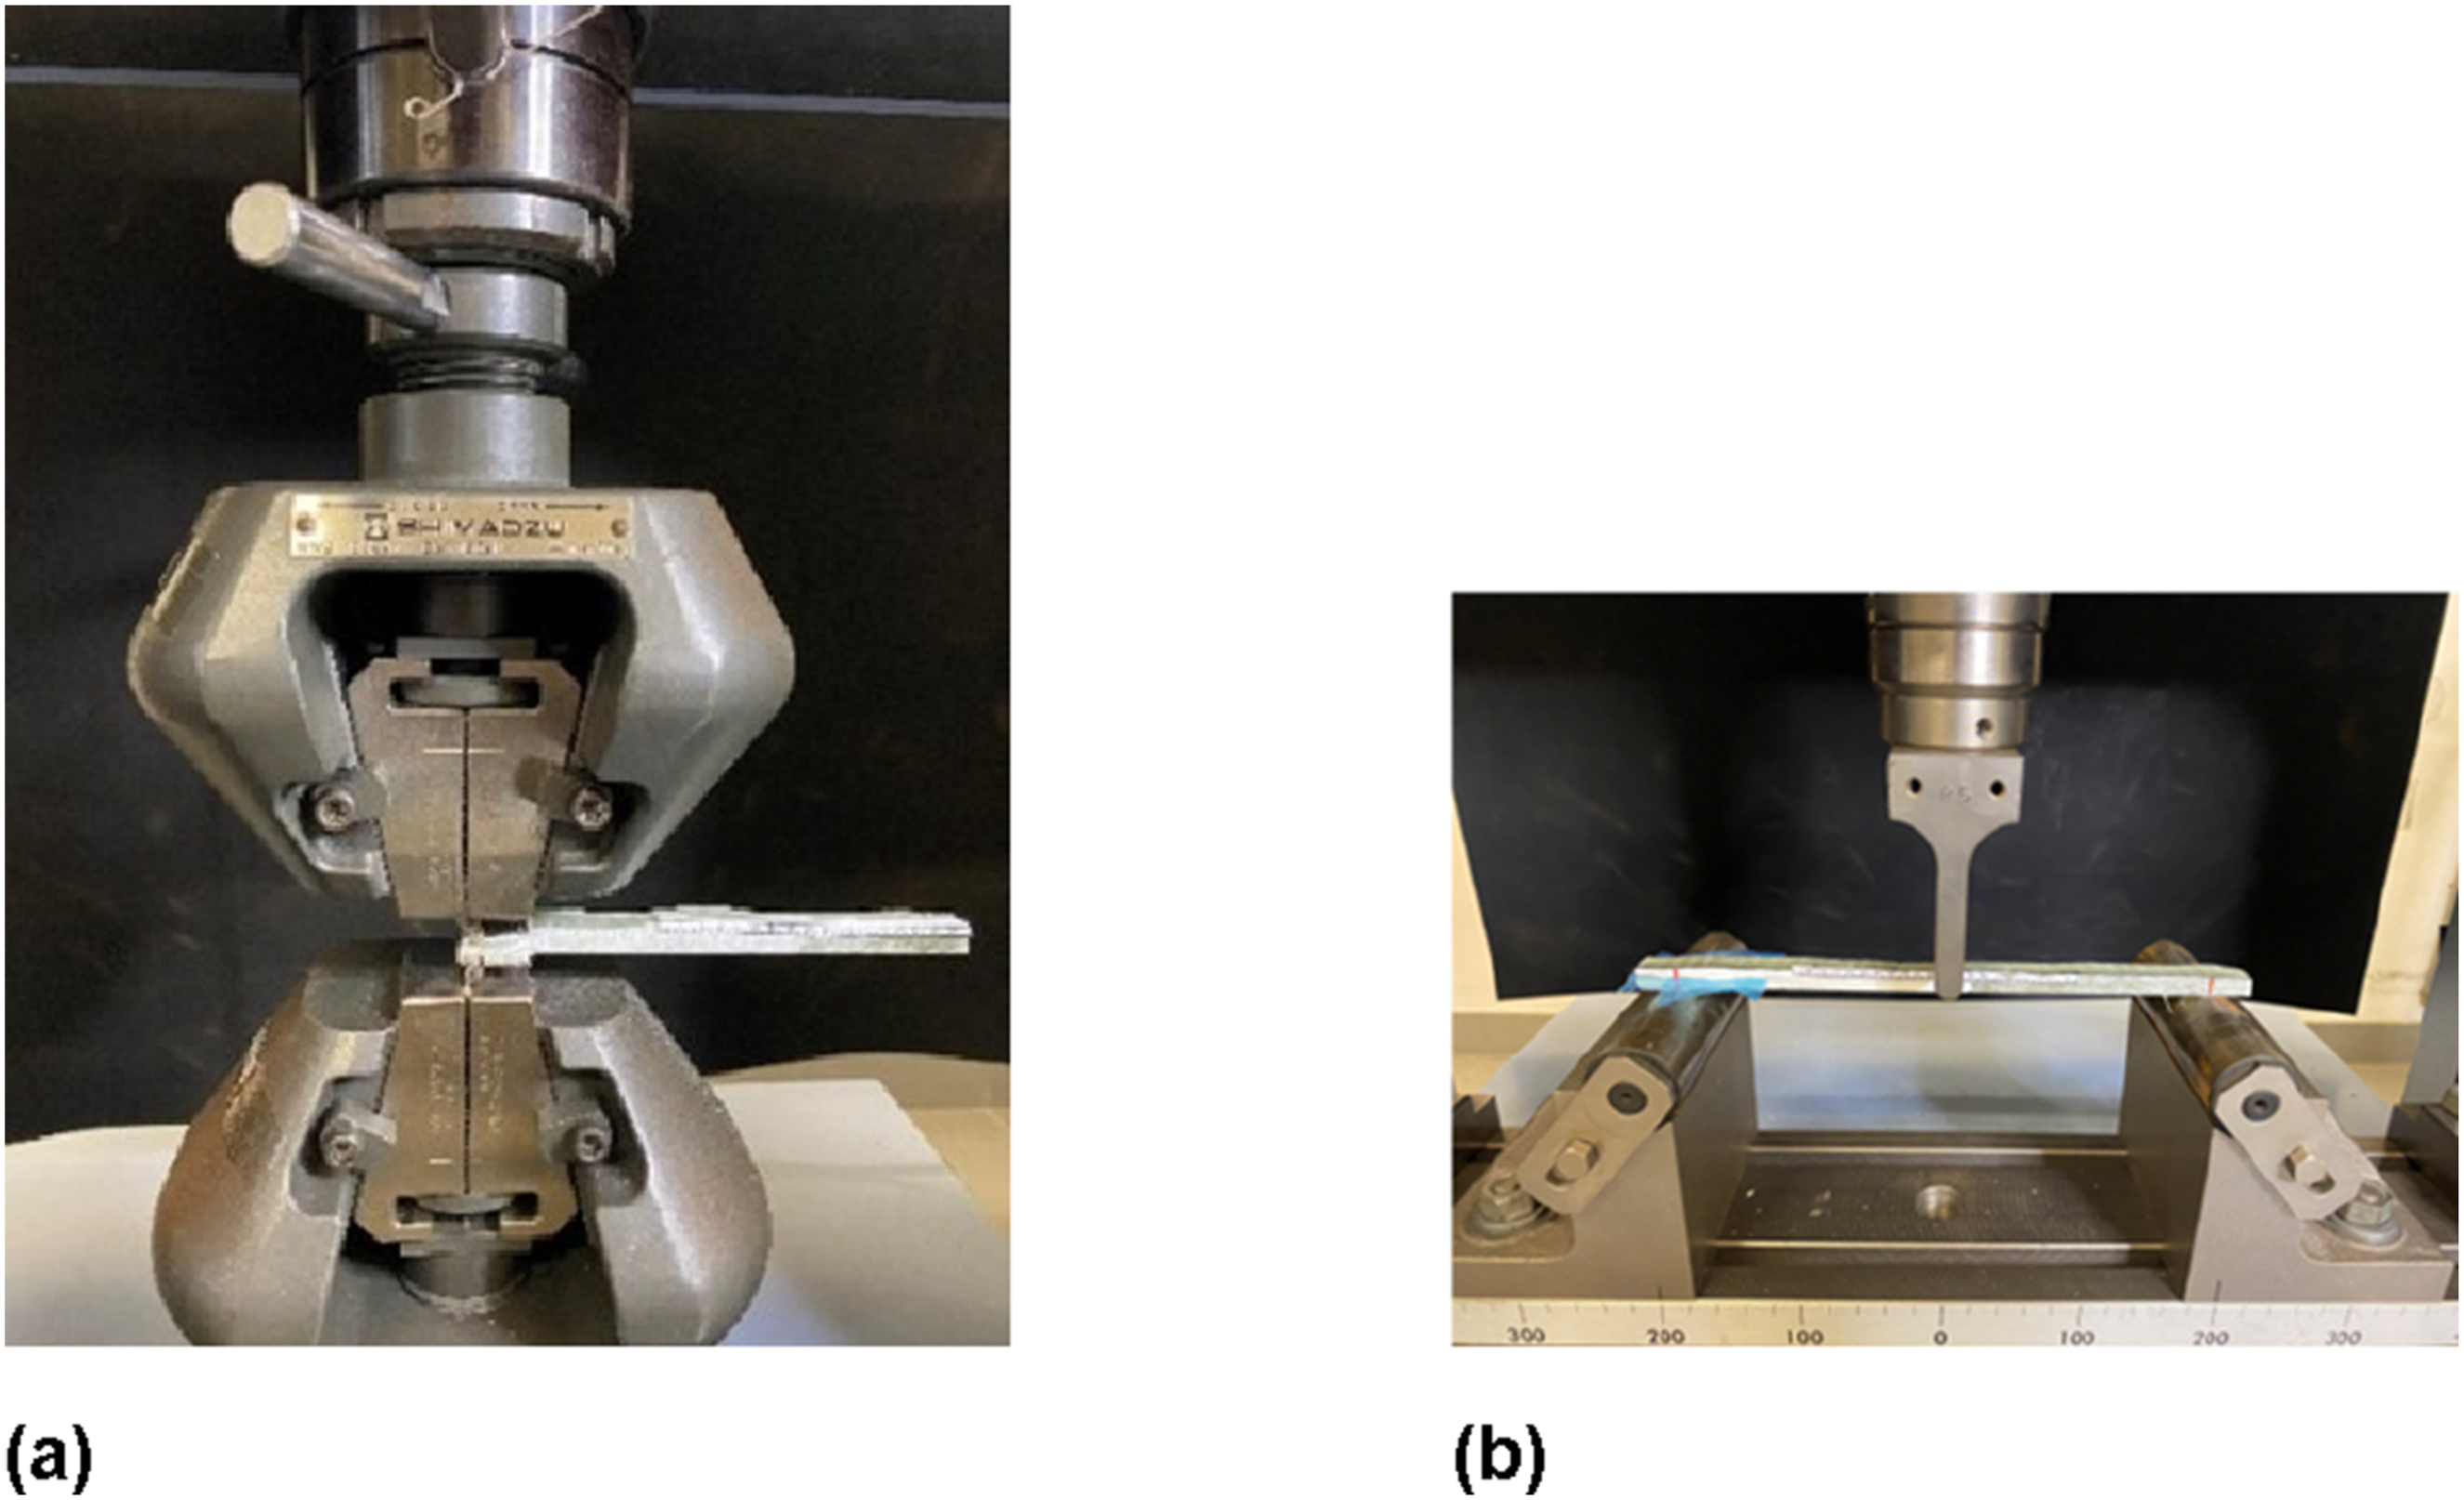
All failure modes were visually evaluated and documented to assure that all tests were valid, after failures occurring in the intended locations to accurately measure the mechanical and fracture properties of the different composites.
Results and discussions
Tensile test
The tensile tests resulted in P-δ curves for each specimen. Only specimens generating valid results were considered; outlier specimens were excluded from the tensile test analysis (Figure 9). A characteristic that can be observed out of the four tests is the consistency of the results about the stiffness of the specimens from each plate. Plate 1 has a distinct disparity in tensile strength relative to the other three plates. The highest displacement was somewhat greater in the specimens from plate 1 than in those from the other plates. P-δ plots as result of the tensile tests for: (a) plate 1, (b) plate 2, (c) plate 3, and (d) plate 4.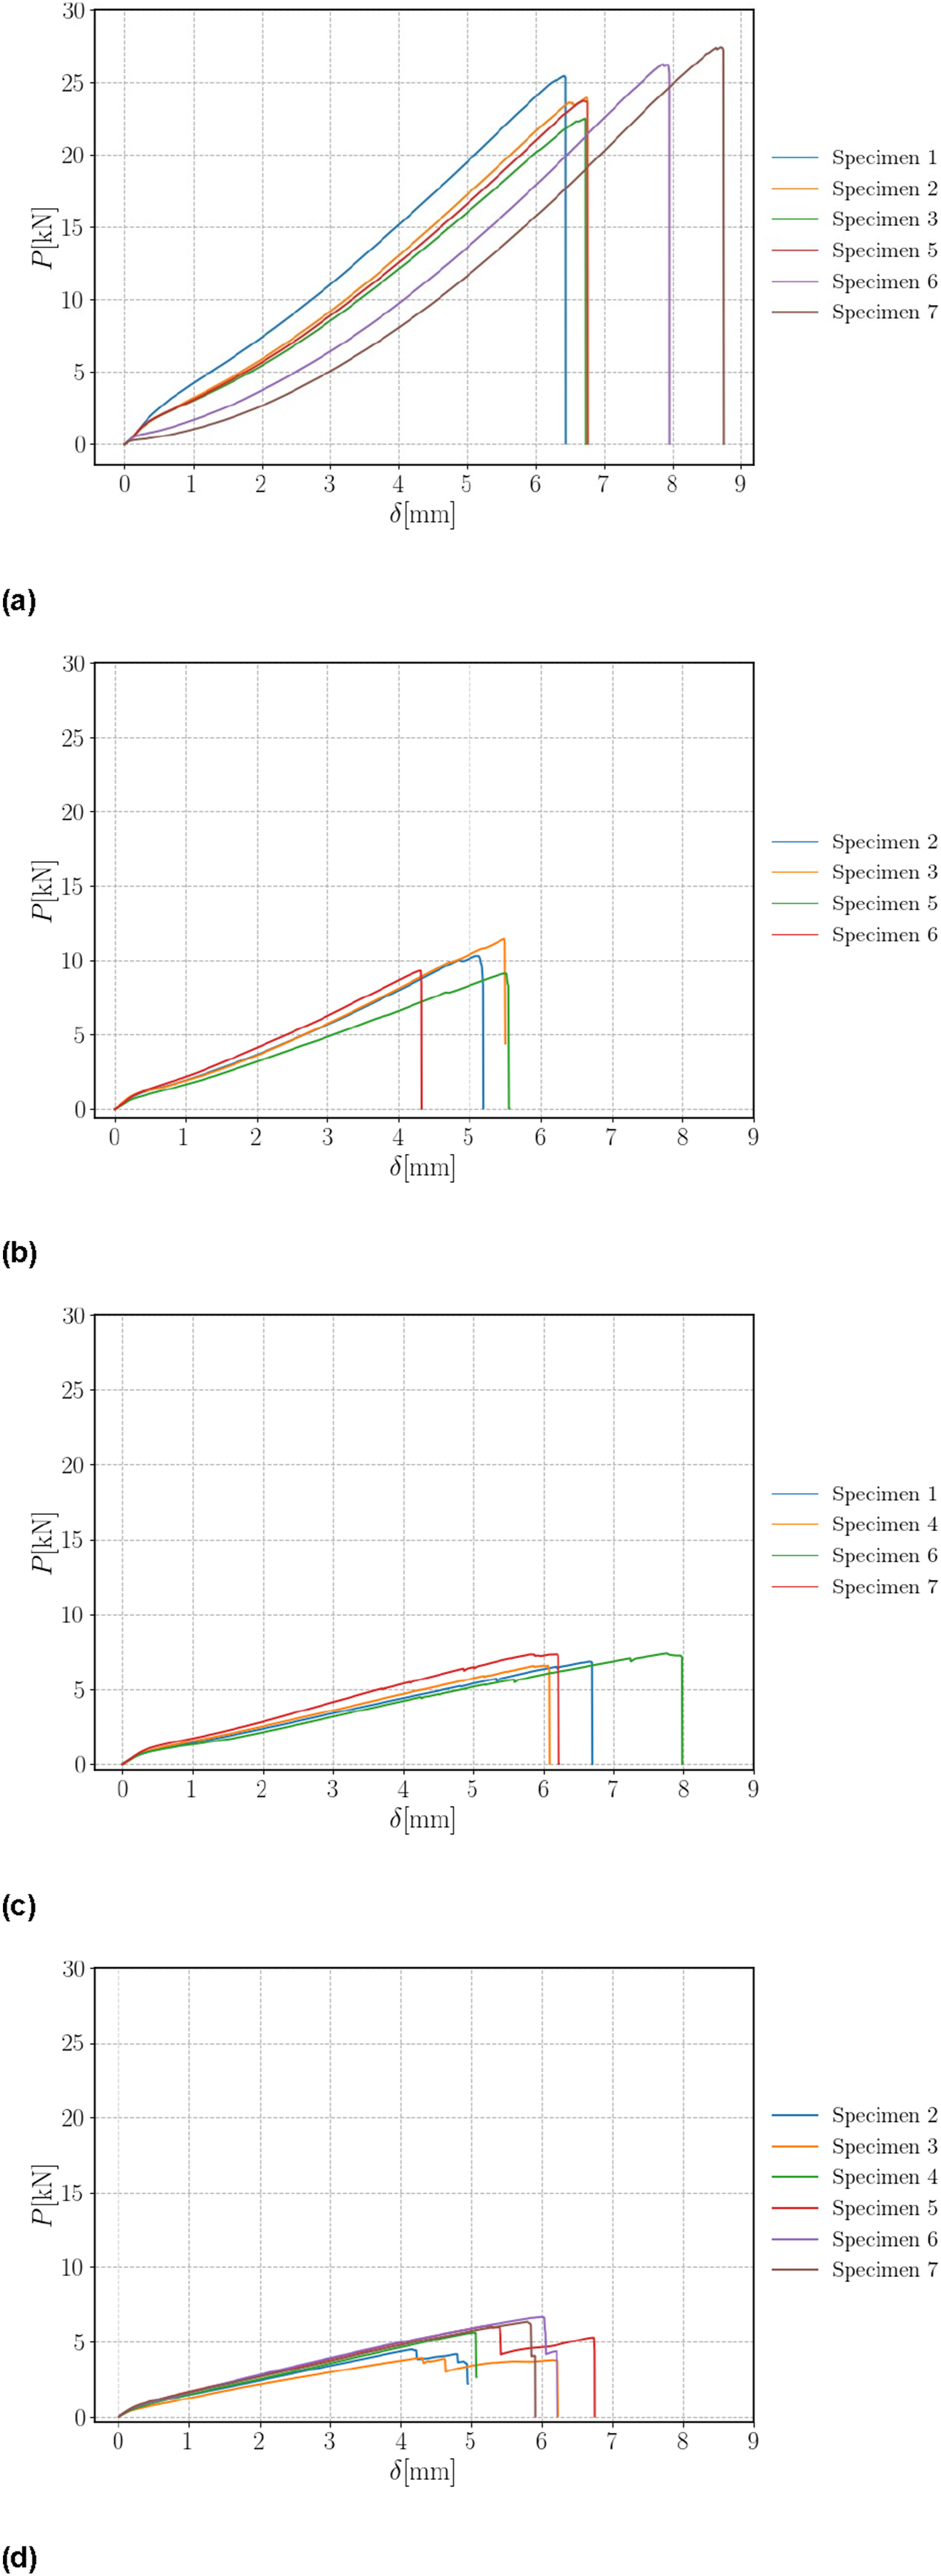
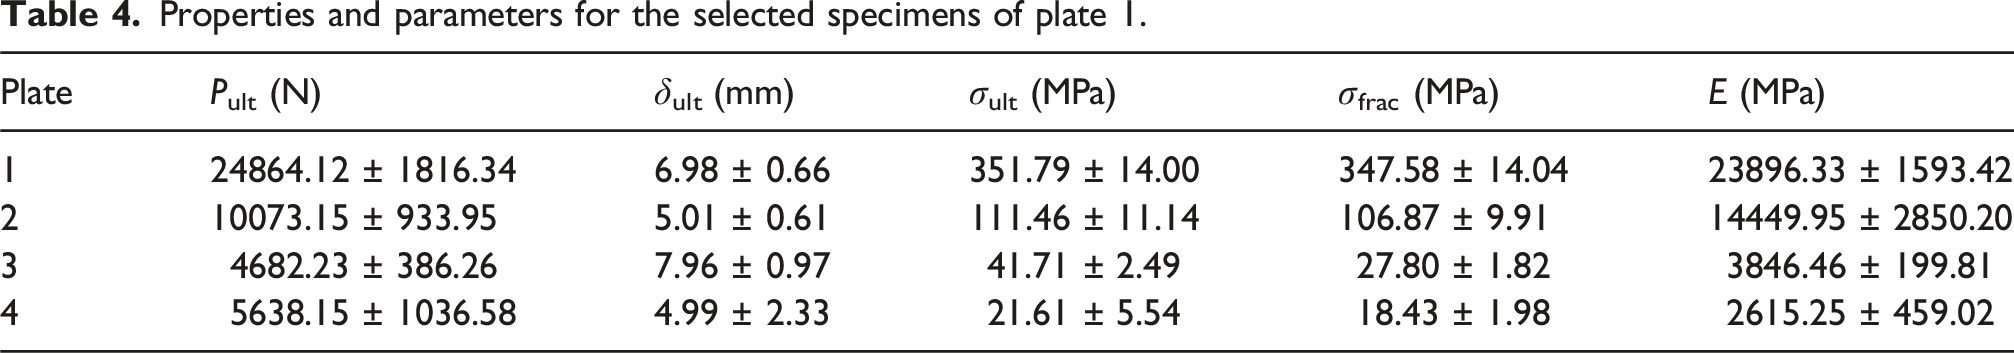
Properties and parameters for the selected specimens of plate 1.
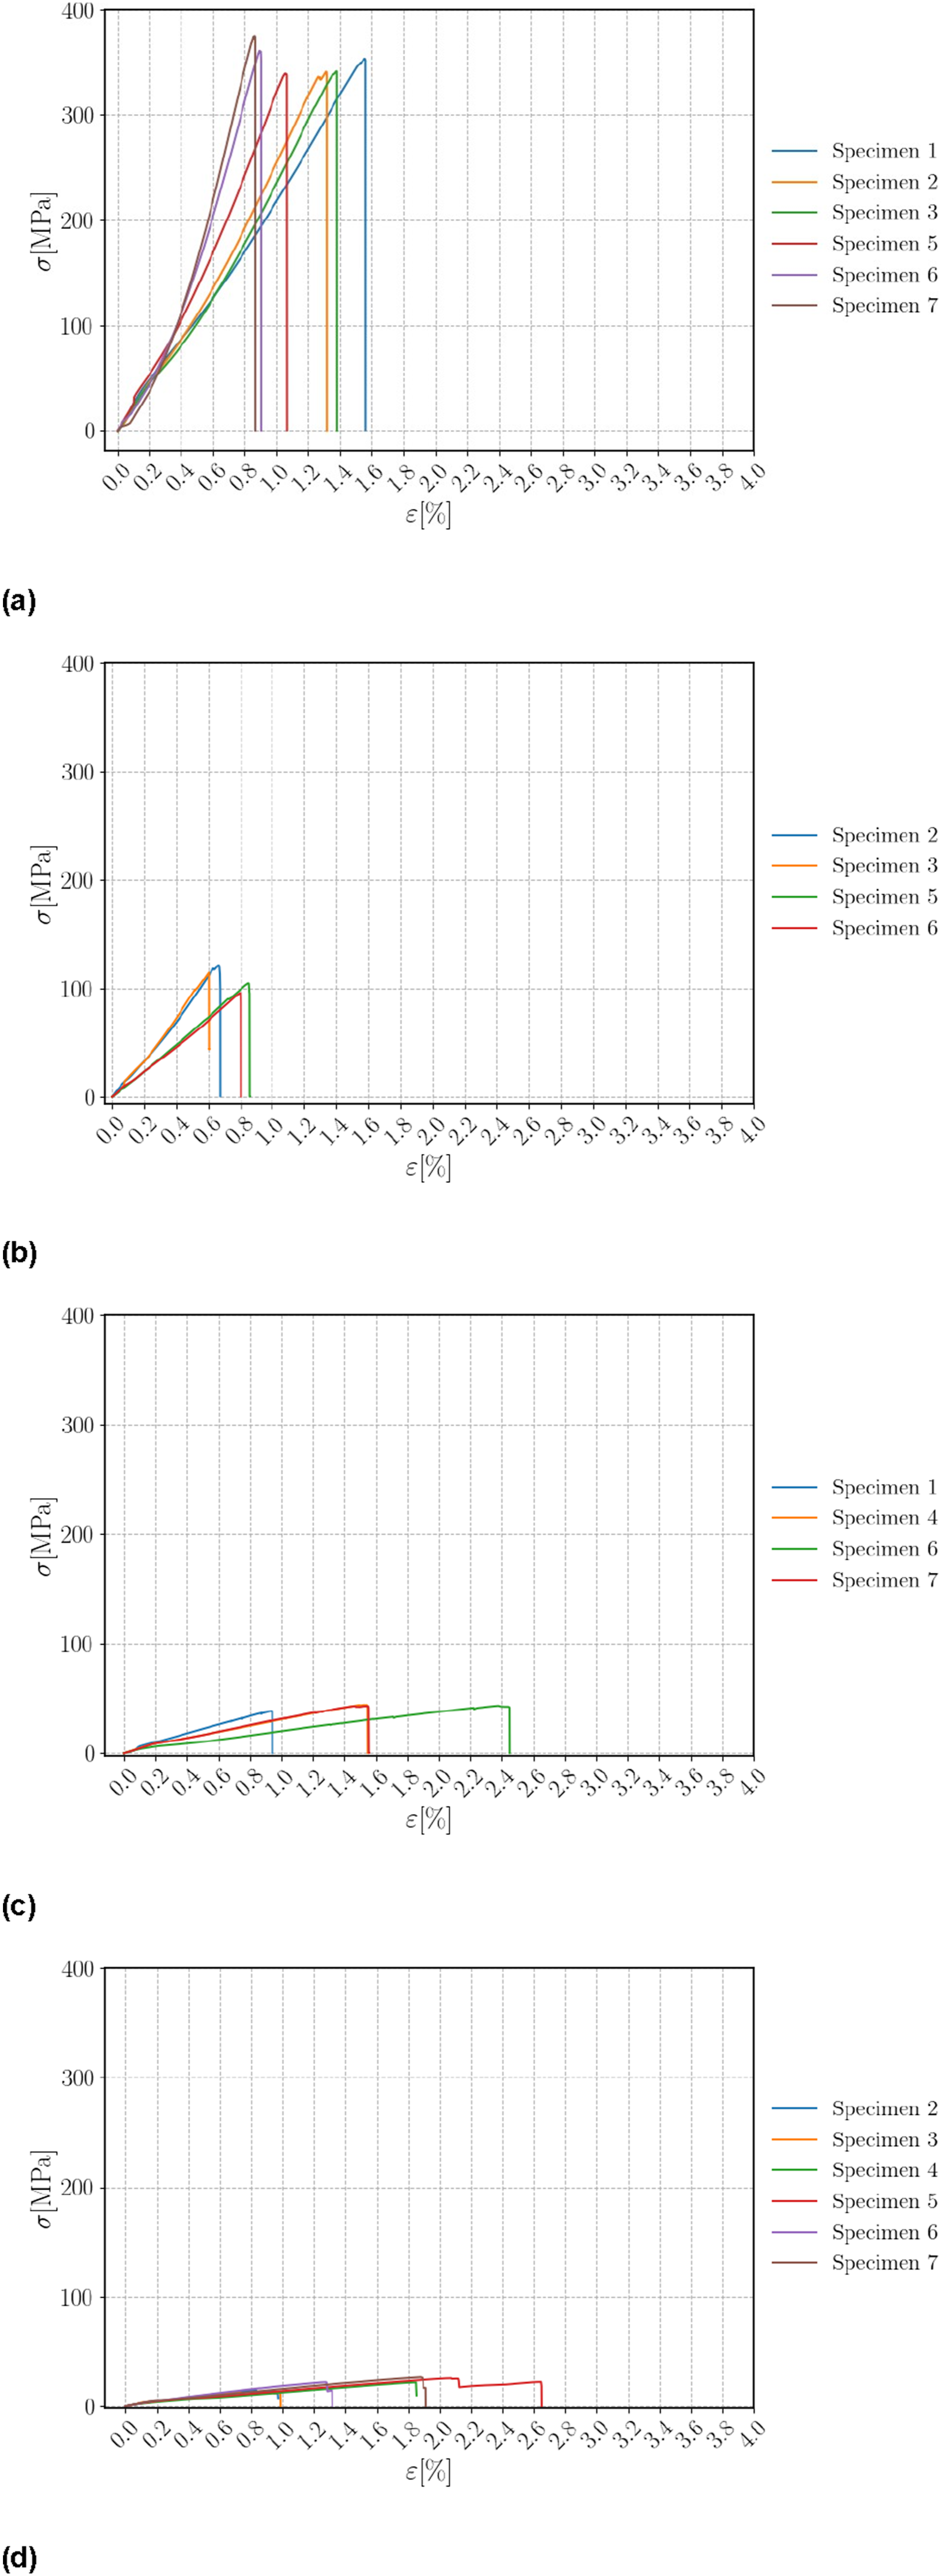
σ-ɛ plots as result of the calculations made from the tensile tests and the measurements for each specimen for: (a) plate 1, (b) plate 2, (c) plate 3, and (d) plate 4.
A significant distinction exists between the specimens of plate 1 and those of the remaining plates. The modulus of elasticity in the specimens from plate 1 is around 23 GPa, whereas in the specimens from plate 2, it decreases to 14 GPa. The results indicate a substantial disparity in tensile strength between the two composites. The variations related exclusively to the composition of the plates. Plate 2 is a reinforcement of glass fibre particles derived from the machining of this material. Nonetheless, despite the approximately 9 GPa discrepancy, the average modulus of elasticity derived from the samples of plate 2 is rather acceptable and suggests that this composite type is suitable for applications necessitating moderate tensile strength. Plates 3 and 4 are less compelling due to their exposure to tensile stresses, exhibiting only moderate elastic modulus values of 3.8 and 2.6 GPa, respectively.
Figure 11 gives a general overview of how the mechanical properties change based on the composite material reinforcement, comparing the four tested plates in terms of stress, ultimate stress, fracture stress, and elasticity modulus. This visual representation clearly highlights the differences in performance metrics, allowing for a more comprehensive understanding of how each composite material behaves under various loading conditions. Comparison of the stress σ0.2% (a), ultimate stress σ
ult
(b), the fracture stress σ
frac
(c), and the elasticity E (d) for all plates. Shear test.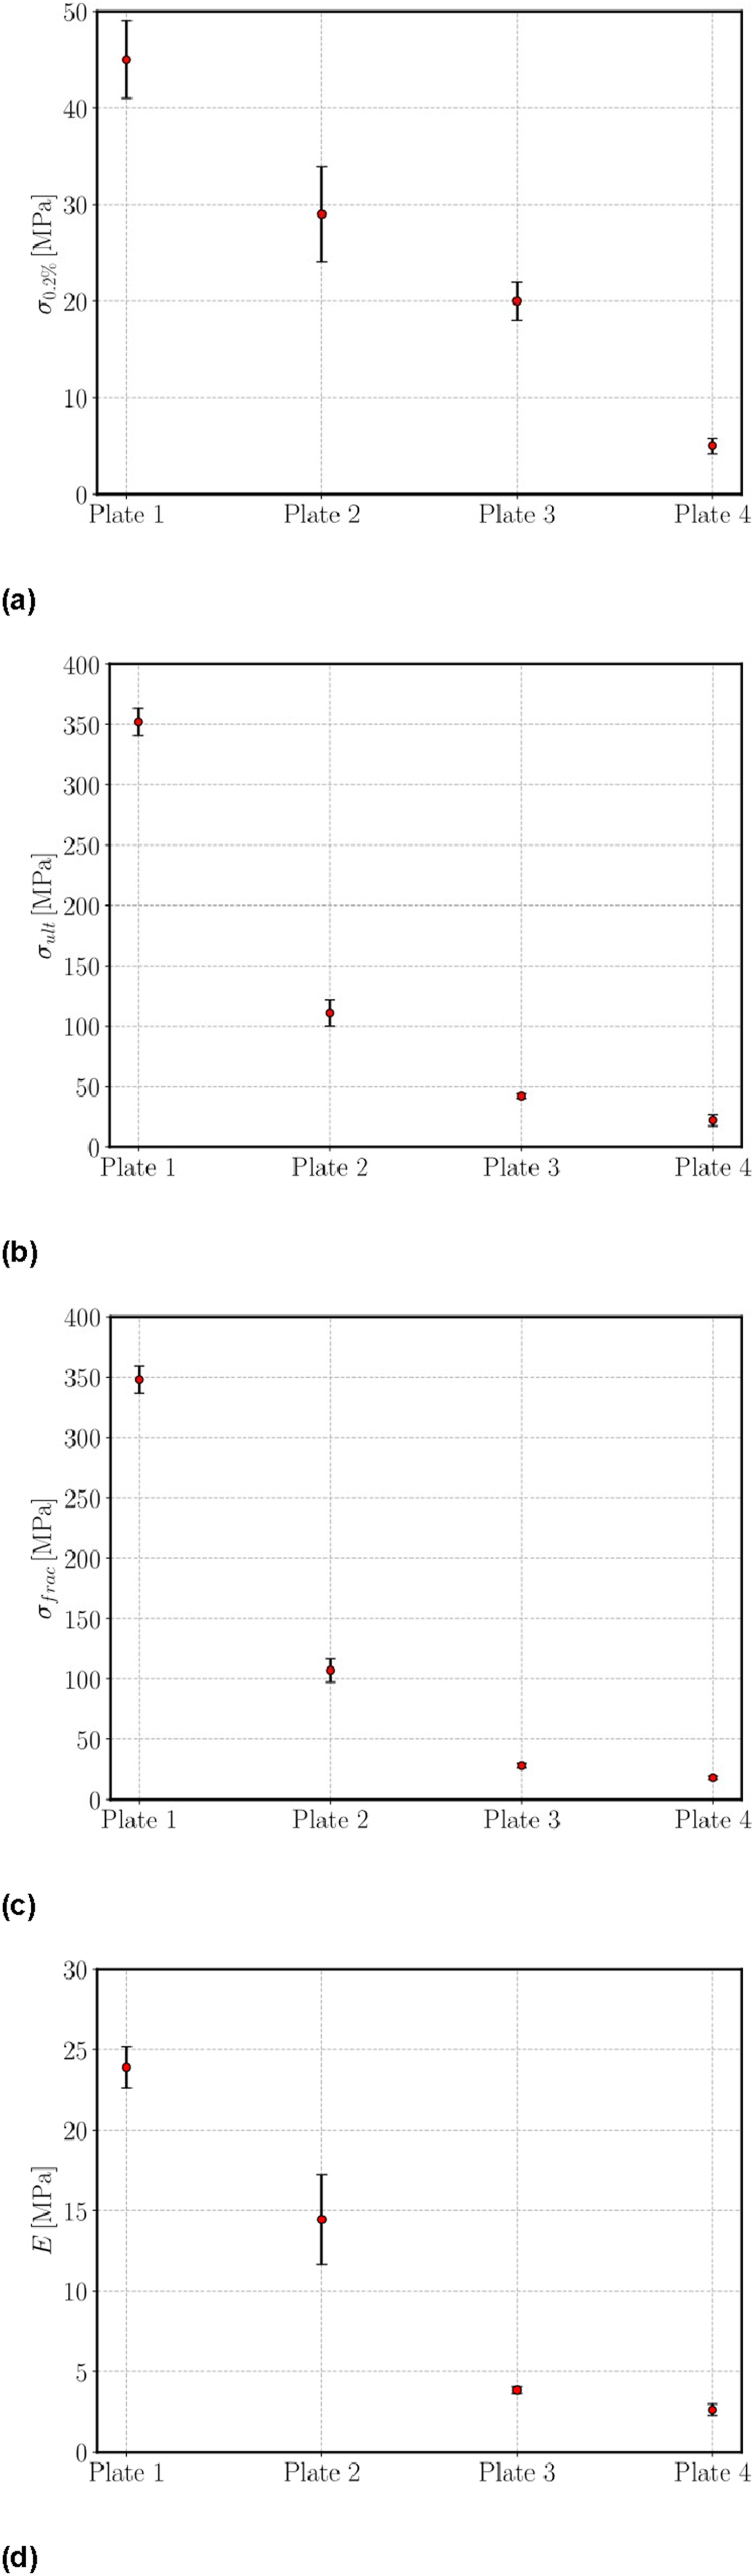
The block shear results of the tests for each specimen of plates 1 to 4 are presented in Figures 12(a)–(d), respectively. The plots of the four plates indicate that the maximum load values for the first three plates are closely aligned. However, there is a significant disparity in the maximum load values for the specimens from plate 4, whose reinforcement is composed of PP particles. The curves for plates 1, 2, and 3 indicate partial ruptures attributed to fibre bridges. In the specimens depicted in plate 4, it is observed that abrupt fractures occurred due to a rapid decrease in load value within a brief displacement range. This phenomenon suggests that the inclusion of PP particles may not provide the same level of tensile strength as the fibres used in the other plates. For this test campaign, Figures 13(a)–(d) presents the results of the shear stress as function of the shear strain for plates 1 to 4, respectively. P-δ test results for the block shear tests on plate 1 (a), plate 2 (b), plate 3 (c), and plate 4 (d). Shear stress versus strain for the tests on plate 1 (a), plate 2 (b), plate 3 (c), and plate 4 (d).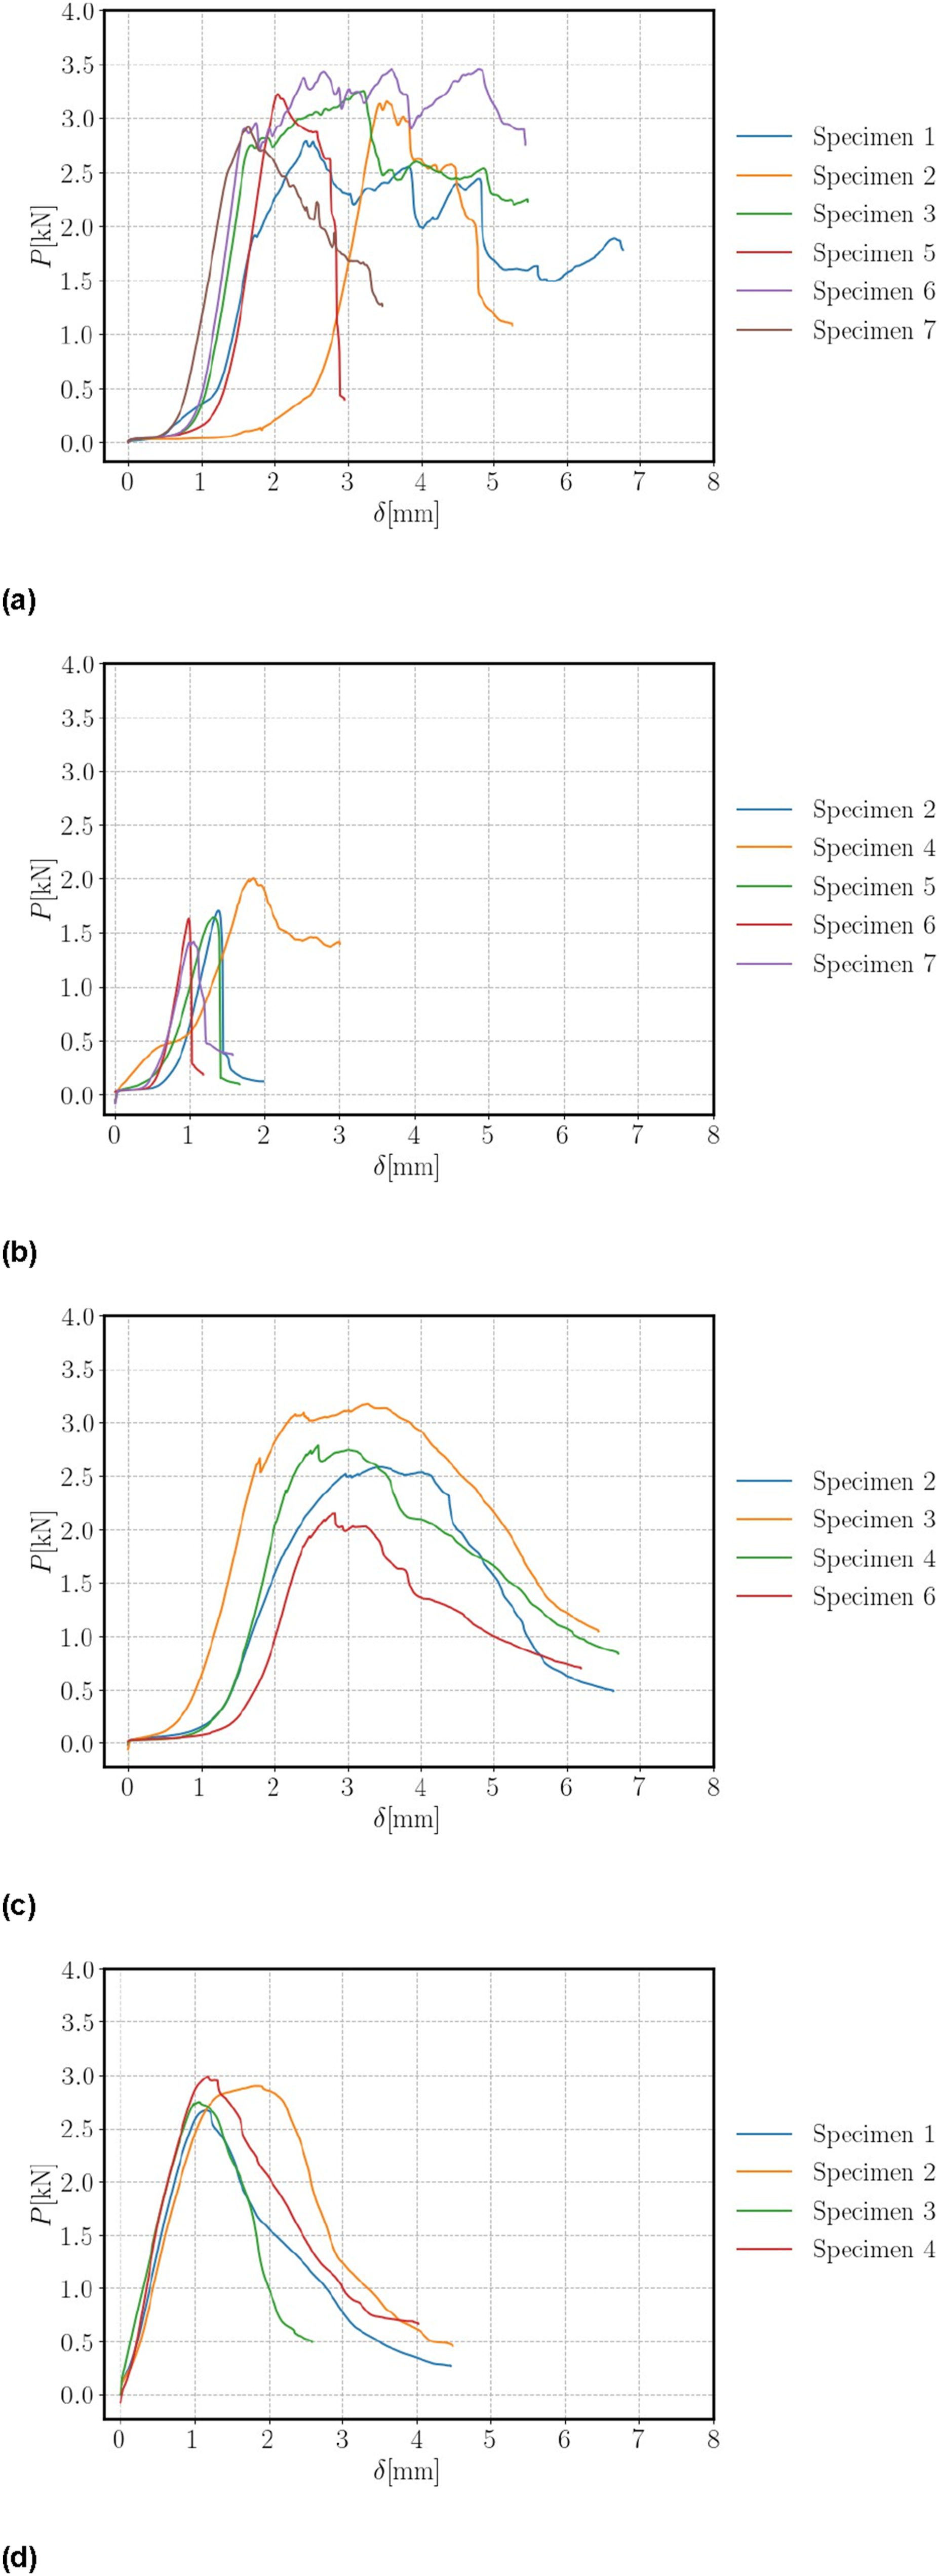
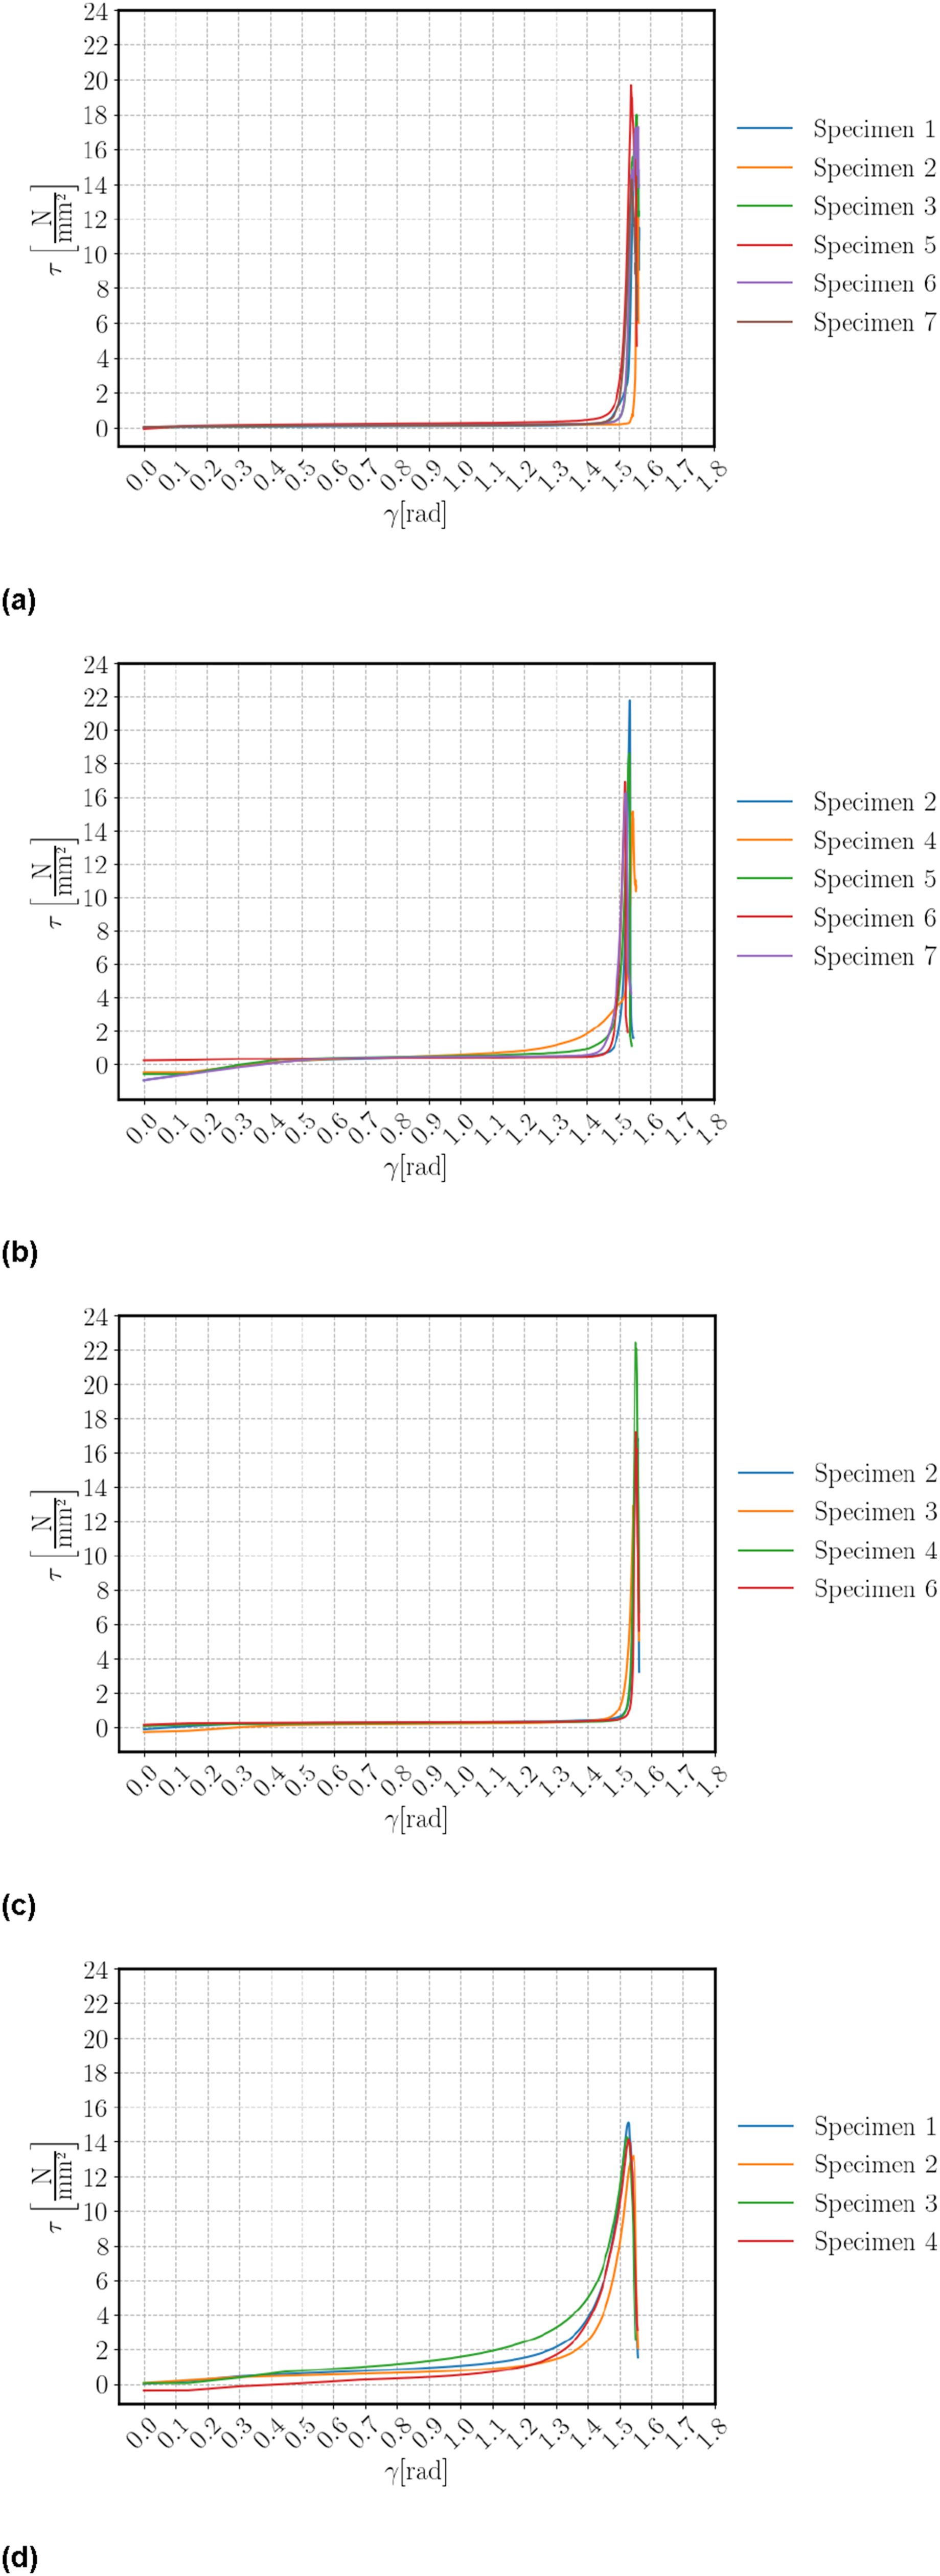
Comparison of the experimental results for the specimens of plate 1.
DCB test
During test, a tensile force is applied at the loading hinges, and crack propagation is promoted, with a being measured according to a scale placed on the sides of the specimen. The testing speed was adjusted according to the plate to which the specimens corresponded. Thus, for the specimens from plate 1, a testing speed of 10 mm/min was used; the specimens from plate 2 were tested at a speed of 8 mm/min, while for the specimens from plates 3 and 4, a speed of 6 mm/min was used, since specimens from plates 1 and 2 exhibit greater deformation and require more load cell displacement. However, these changes in testing speed do not cancel the quasi-static nature of the test, and no effect takes place on the G IC measurement. After conducting the tests, the data on P, δ, and crack length are extracted with the aim of obtaining the resistance curve (curve R). The R curve represents the evolution of G IC as a function of a. Generally, the R curve of a composite shows a sharp increase in the energy release rate at the beginning of the test due to the pre-crack and subsequently tends to stabilise at a level corresponding to G IC . The data is processed and the energy release rate in mode I (G IC ) determined. Three methods are employed: compliance-based beam method (CBBM), compliance calibration method (CCM), and corrected beam theory (CBT). Full details on these methods are given in Teixeira et al. 37
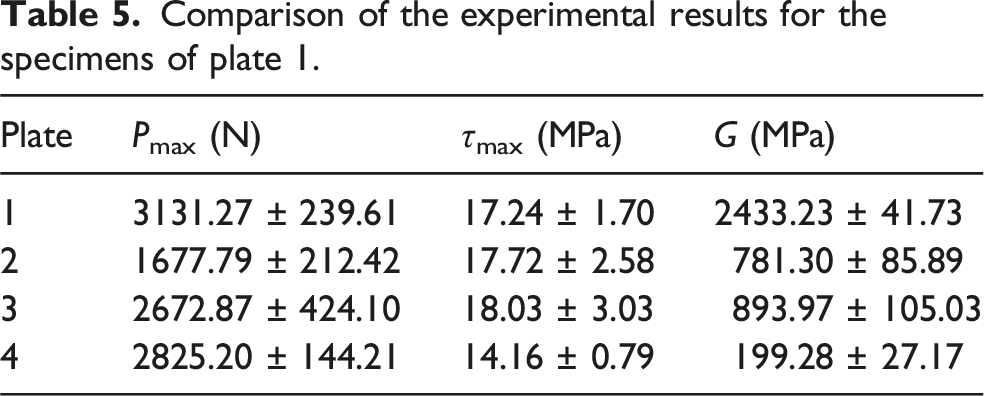
Since the composition of the four plates is different, the type of fracture that occurred in the specimens corresponding to each of them was also found to be different. In the specimens of plate 1, it is possible to visualise, through Figure 14(a), that a perfect separation of the specimens into two parts occurred, where the fracture followed the path established by the pre-notch. In the specimens from plate 2, the rupture did not propagate along the entire length of the specimen and only advanced a few millimetres relative to the pre-crack, as shown in Figure 14(b). In the specimens of plates 3 and 4, the behaviour in mode I fracture tests was very similar to that of plate 2. As previously mentioned, these specimens are reinforced with polymeric particles that are subsequently interconnected through a matrix (resin). Thus, there is a probability of microcracks existing in the specimens. These become points of material discontinuity and are prone to promote crack propagation. DCB specimen from plate 1 (a) and plate 2 (b) after testing.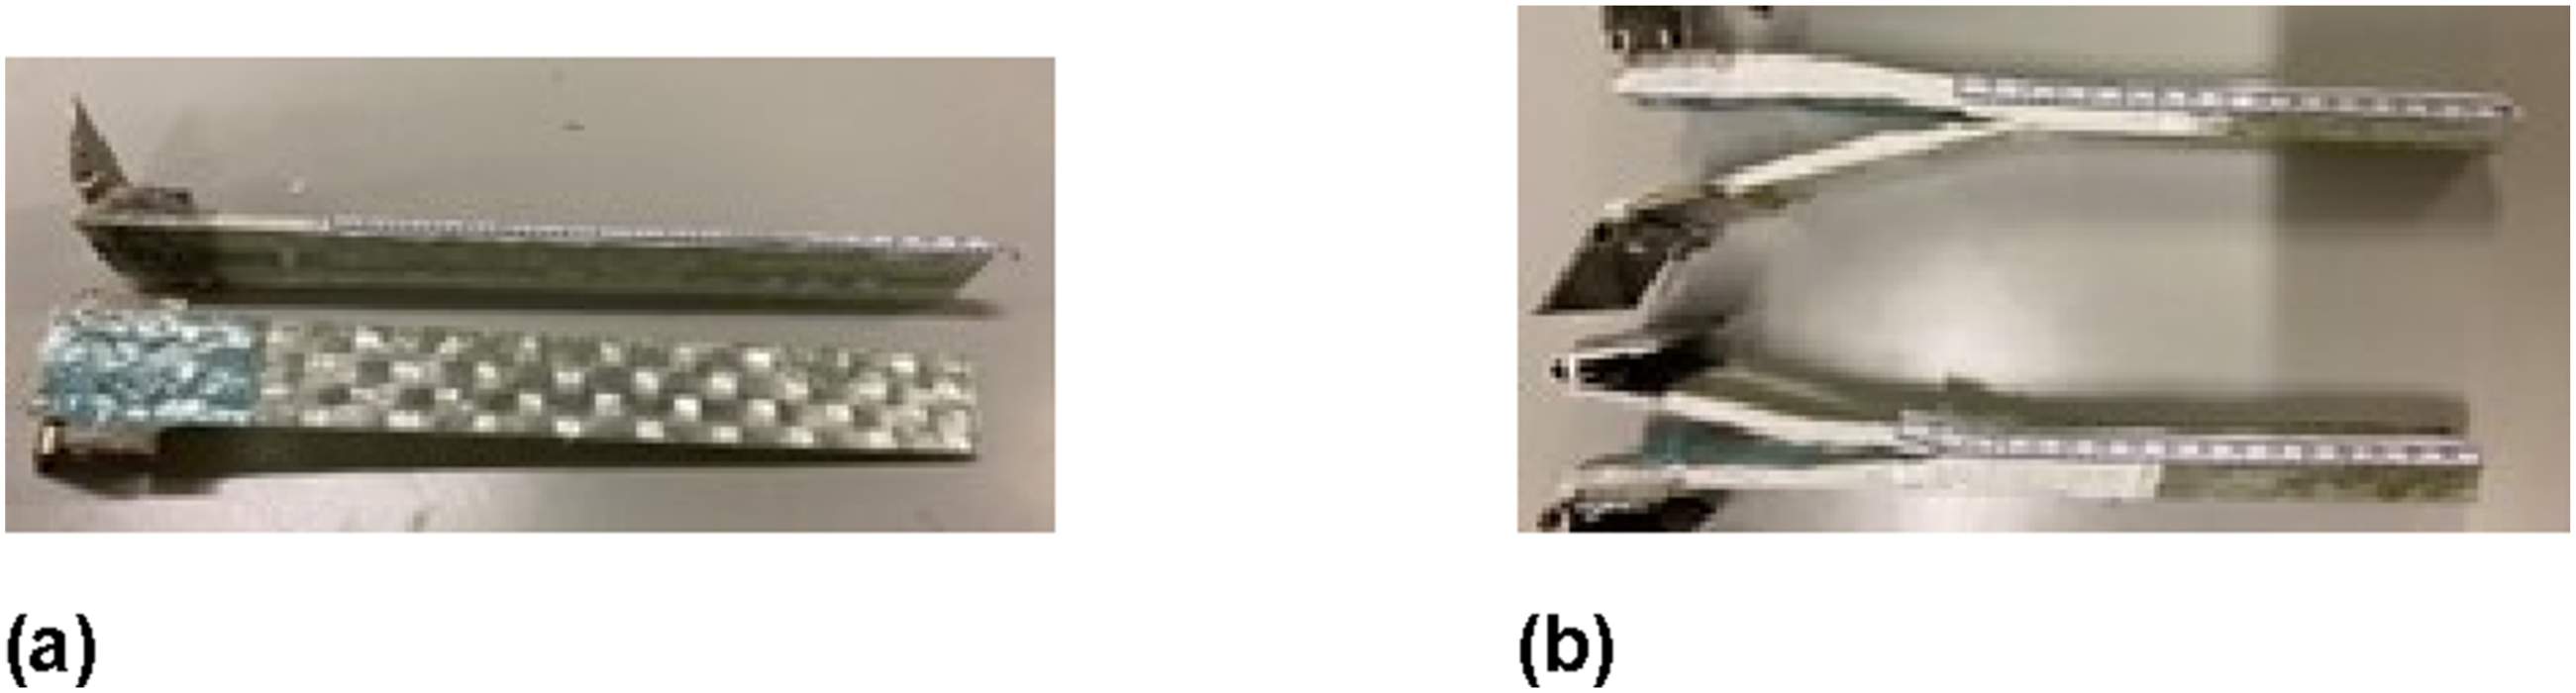
The P-δ curves of the specimens from the four plates under study can be seen in Figure 15. Analysing the P-δ curves, a significant difference is observed for the maximum force values of plates 1 and 2 compared to those of plates 3 and 4. In plate 1, the behaviour of the specimens is considered normal, despite variations in the value of P in a step effect. This fact is related to the fibre bridges during the crack propagation, whose rupture leads to a temporary relief of the stresses followed by a subsequent increase in the material’s strength. In plate 2, the behaviour of the specimens resembles that of plate 1 in an initial phase. In the specimens related to plates 3 and 4, a clear sudden rupture is observed, and the variation in the applied force is more linear until the moment of specimen rupture. P-δ curves of DCB samples from plate 1 to plate 4 (a)–(d).
As previously mentioned, G
IC
is determined using the CBBM, CCM, and CBT methods. To achieve this, the R curves of each specimen are obtained. In an ideal scenario, it is expected that the behaviour of the curves is identical, as can be observed in Figure 16(a), corresponding to plate 1. In this graph, it is easy to identify the stabilization plateau of the R curve, starting from a or a
eq
of 55 mm, which corresponds to a G
IC
of about 1.3 N/mm. In the samples of plates 2, 3, and 4, there is no such evident similarity in the R curves through the three methods. This is since a more premature and sudden rupture occurs in the specimens that exhibit lower fracture resistance, mainly due to the characteristics of the composite. In Figure reffig:subfig152, corresponding to specimen 1 of plate 2, a disparity in the values obtained by the CBBM method compared to the other two methods is observed. Sample R curves for plates 1(a) and 2(b).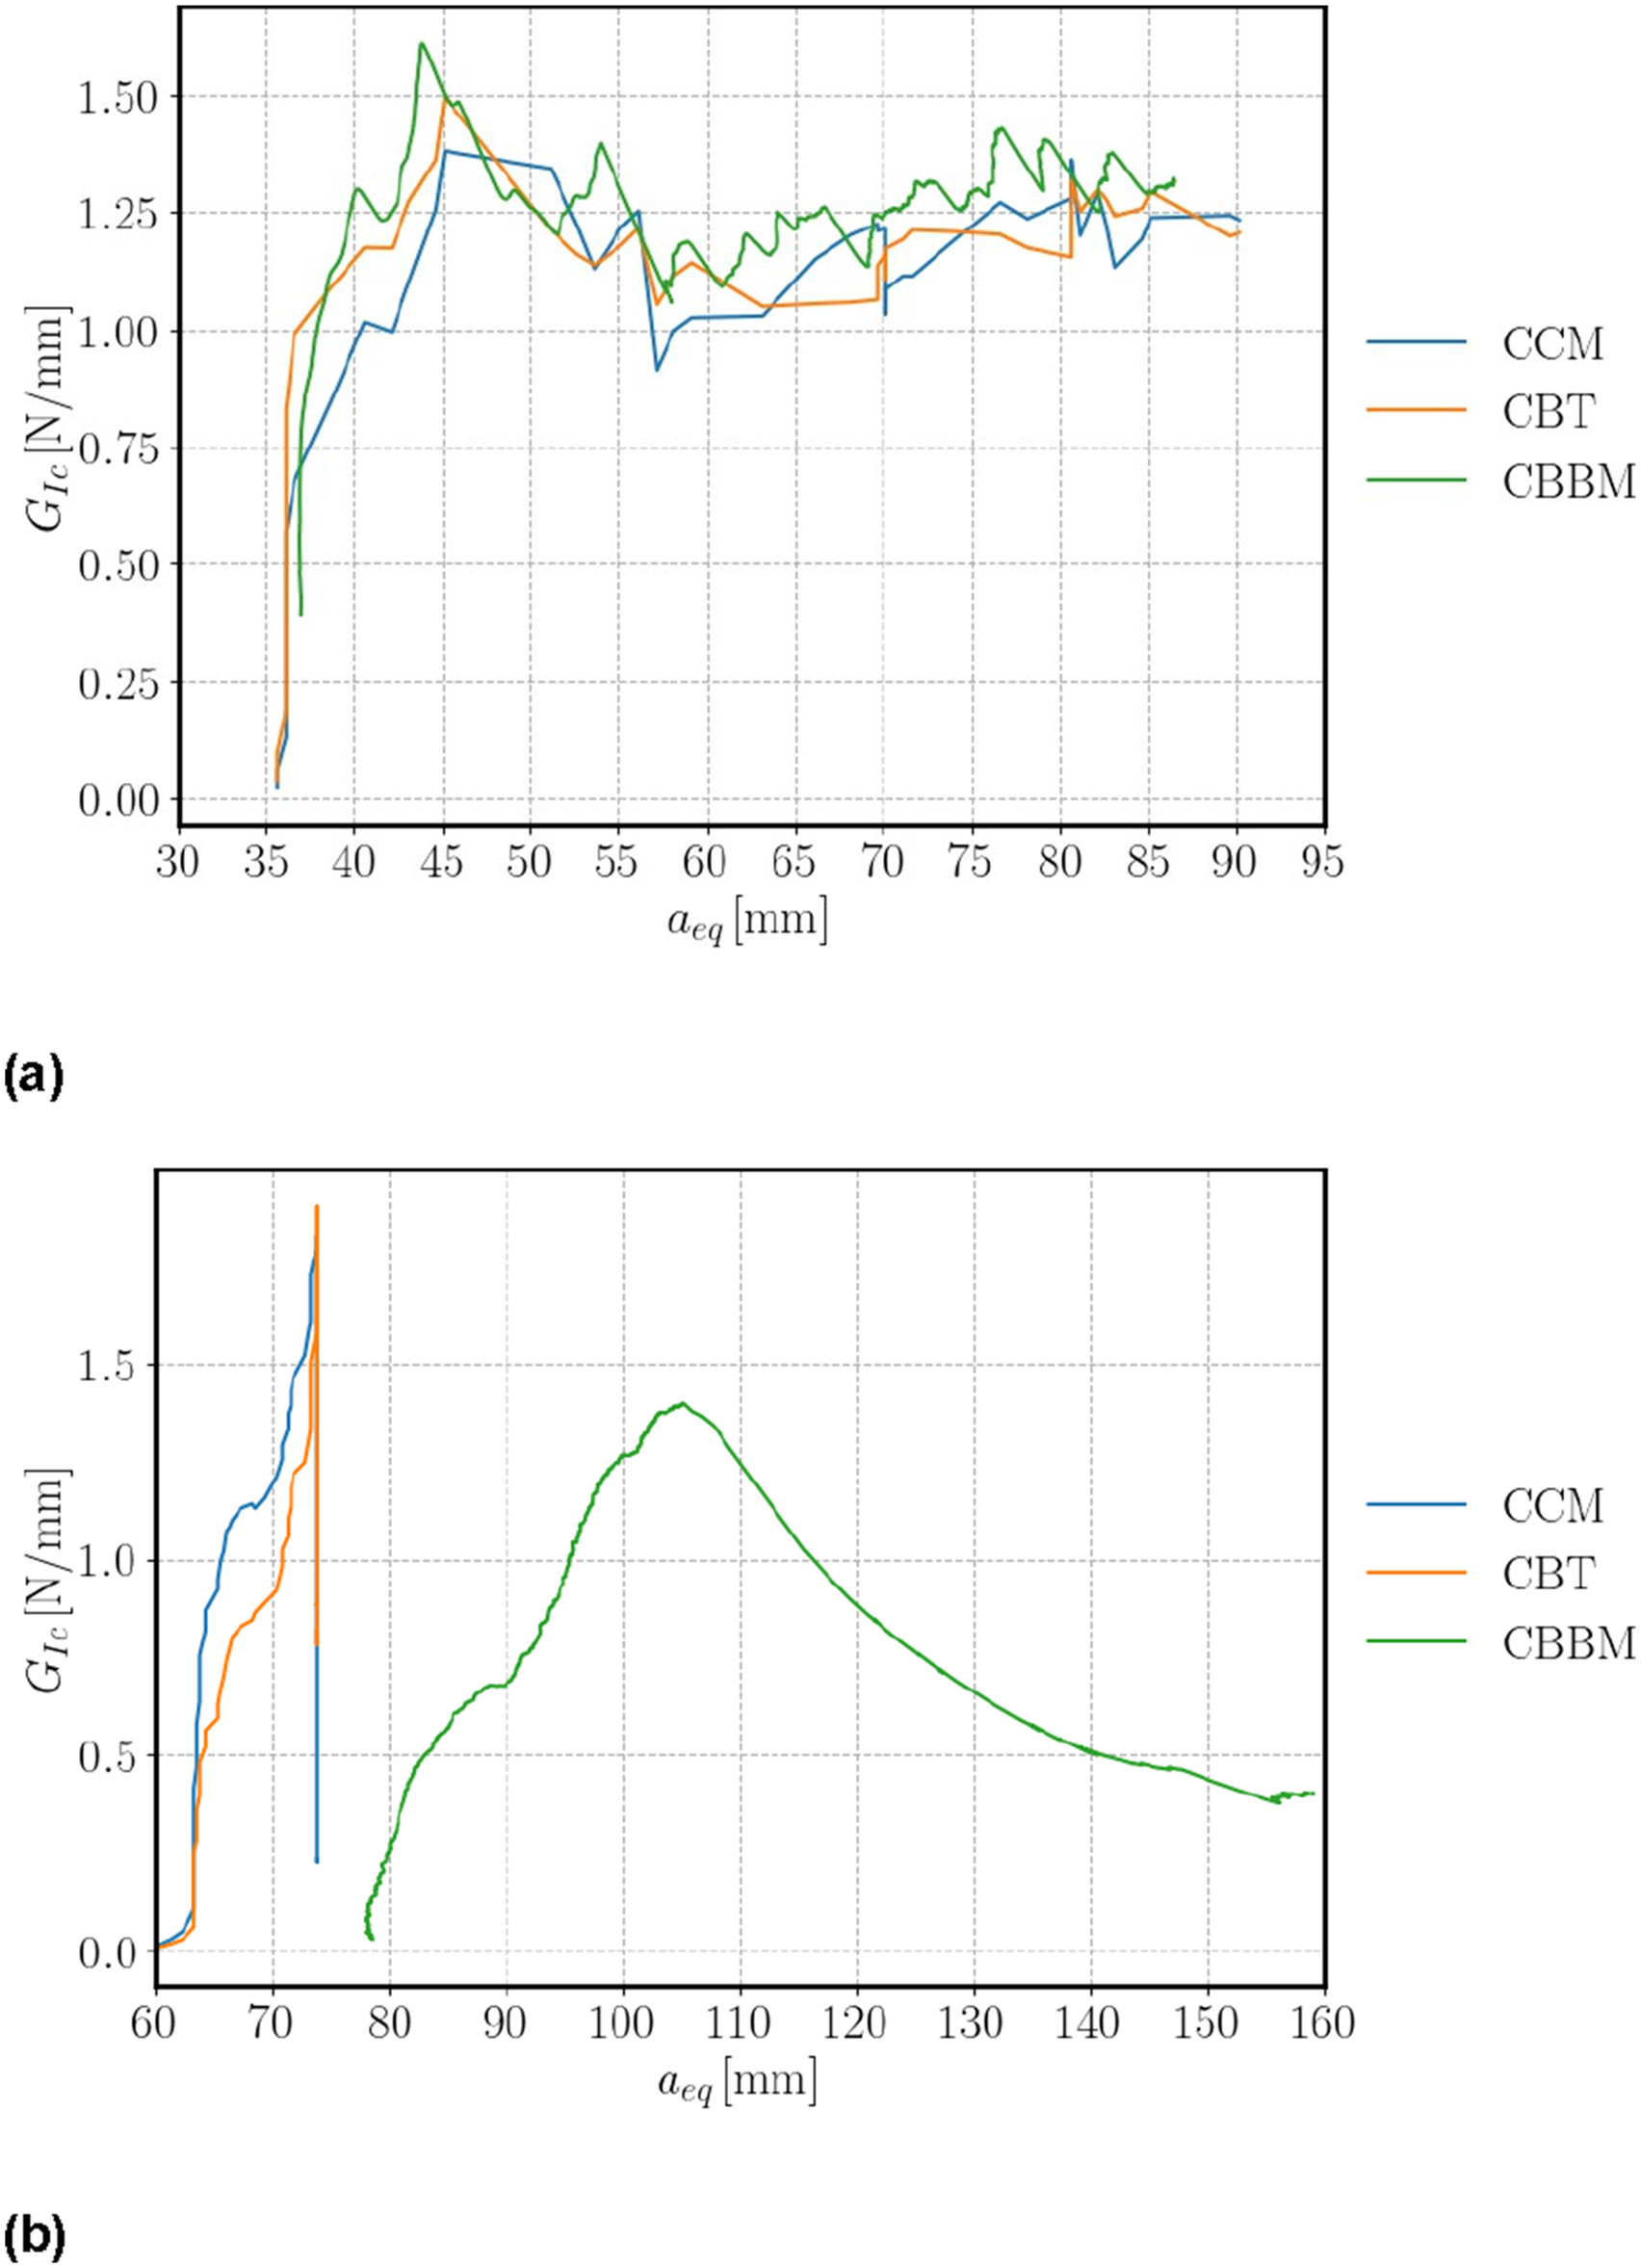
Average G IC [N/mm] values, including STD and CoV.
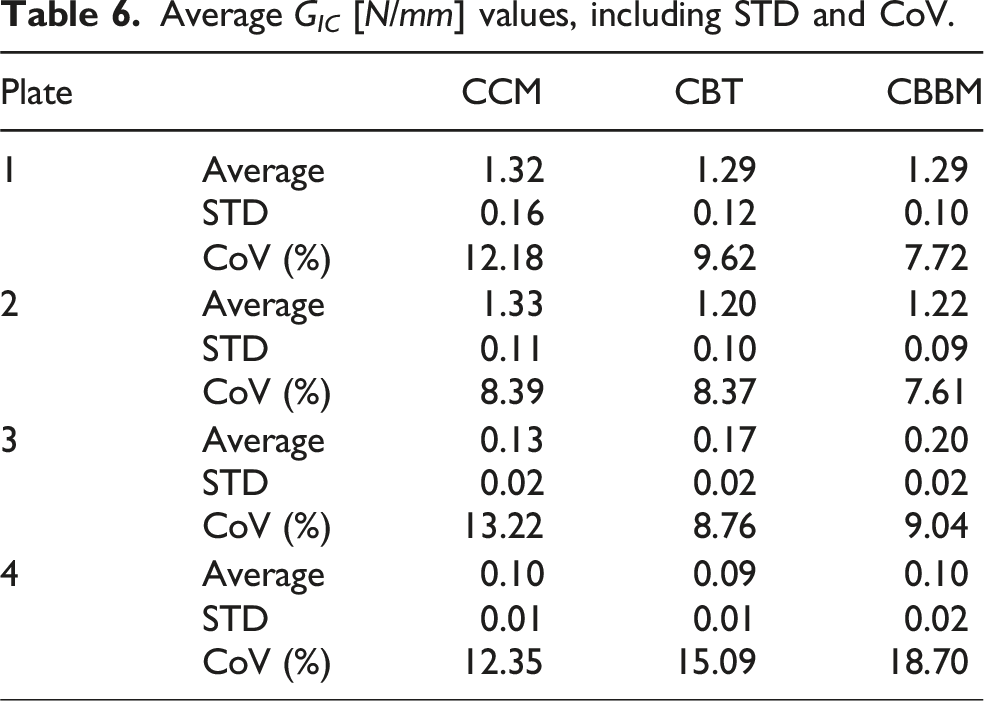
Comparative plots are presented in Figure 17, which represent the average G
IC
values of the four plates, obtained through the implementation of the three methods. There is a great similarity in the values obtained through the different methods. Another observation worth highlighting is the decline in properties from plate 1 to plate 4, as expected, since plates 1 and 2 are only made of fibreglass as provided by the manufacturer and the thermoplastic matrix, whilst plates 3 and 4 are reinforced with reused PA and PP particles, respectively. It is noted that there is a slight loss in G
IC
from plate 1 to plate 2. This fact is associated with the different morphology of the plates. Plate 1 has a uniform stacking of layers, while Plate 2 features randomly cut-glass fibres as an intermediate reinforcement of the composite. However, since the differences are not very exaggerated, it can be concluded that there are good indicators for the utilization of fibres that are normally wasted. G
IC
average values obtained using the CBBM (a), CBT (b), and CCM (c) methods. ENF test.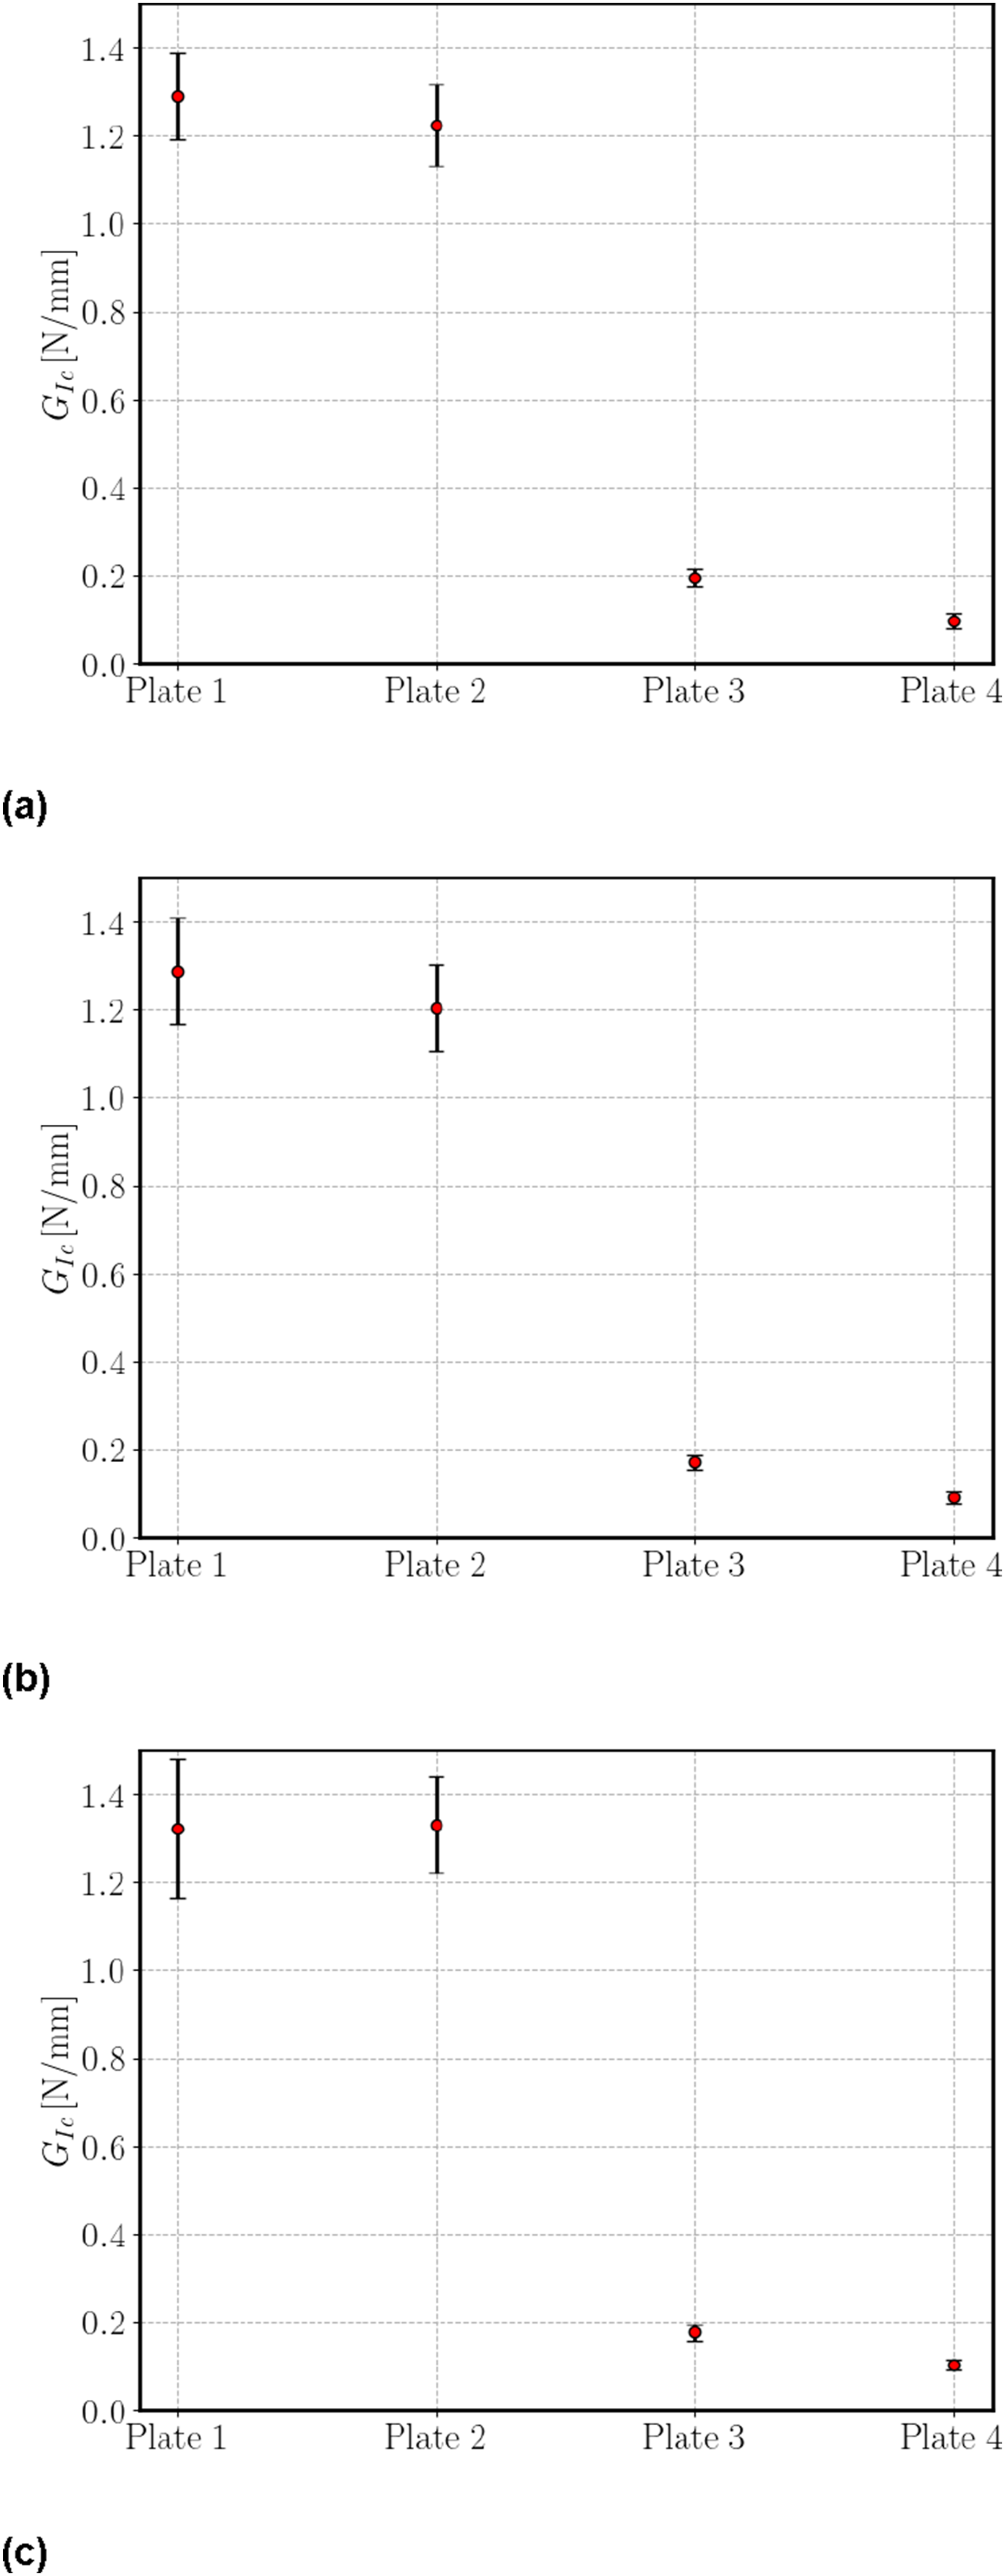
ENF test
In ENF tests, the crack propagation tends to be unstable, which makes it difficult to monitor its progression. A high-resolution camera is used to read a during the test, every 5 s. The remaining parameters, P and δ, are automatically recorded by the testing machine’s system. For the treatment of the data obtained in the tests and subsequent calculations, the following methodologies were implemented: compliance-based beam method (CBBM), compliance calibration method (CCM), direct beam theory (DBT), and modified beam theory (CBT). A detailed description of these methods is given in Azevedo et al.
38
Visual analysis of the specimens was performed after testing. It was observed that there are similarities between the behaviour of the DCB specimens and the ENF specimens in both types of fracture tests. As can be seen in Figure 18(a), during mode II fracture tests on the specimens corresponding to plates 1 and 2, the fracture followed the path defined by the pre-crack. Such behaviour had already been observed in mode I fracture tests for the specimens of these two plates. In the ENF specimens corresponding to plates 3 and 4, the crack deviation from the middle of the specimens containing PA or PP particles to one of the sides of the specimens was observed again until it stabilised the area containing the two layers of fibreglass. Such an effect is noticeable in Figure 18(b). However, there is a small length that allows the estimation of G
IIC
. ENF specimen from plate 1 (a) and plate 3 (b) after testing.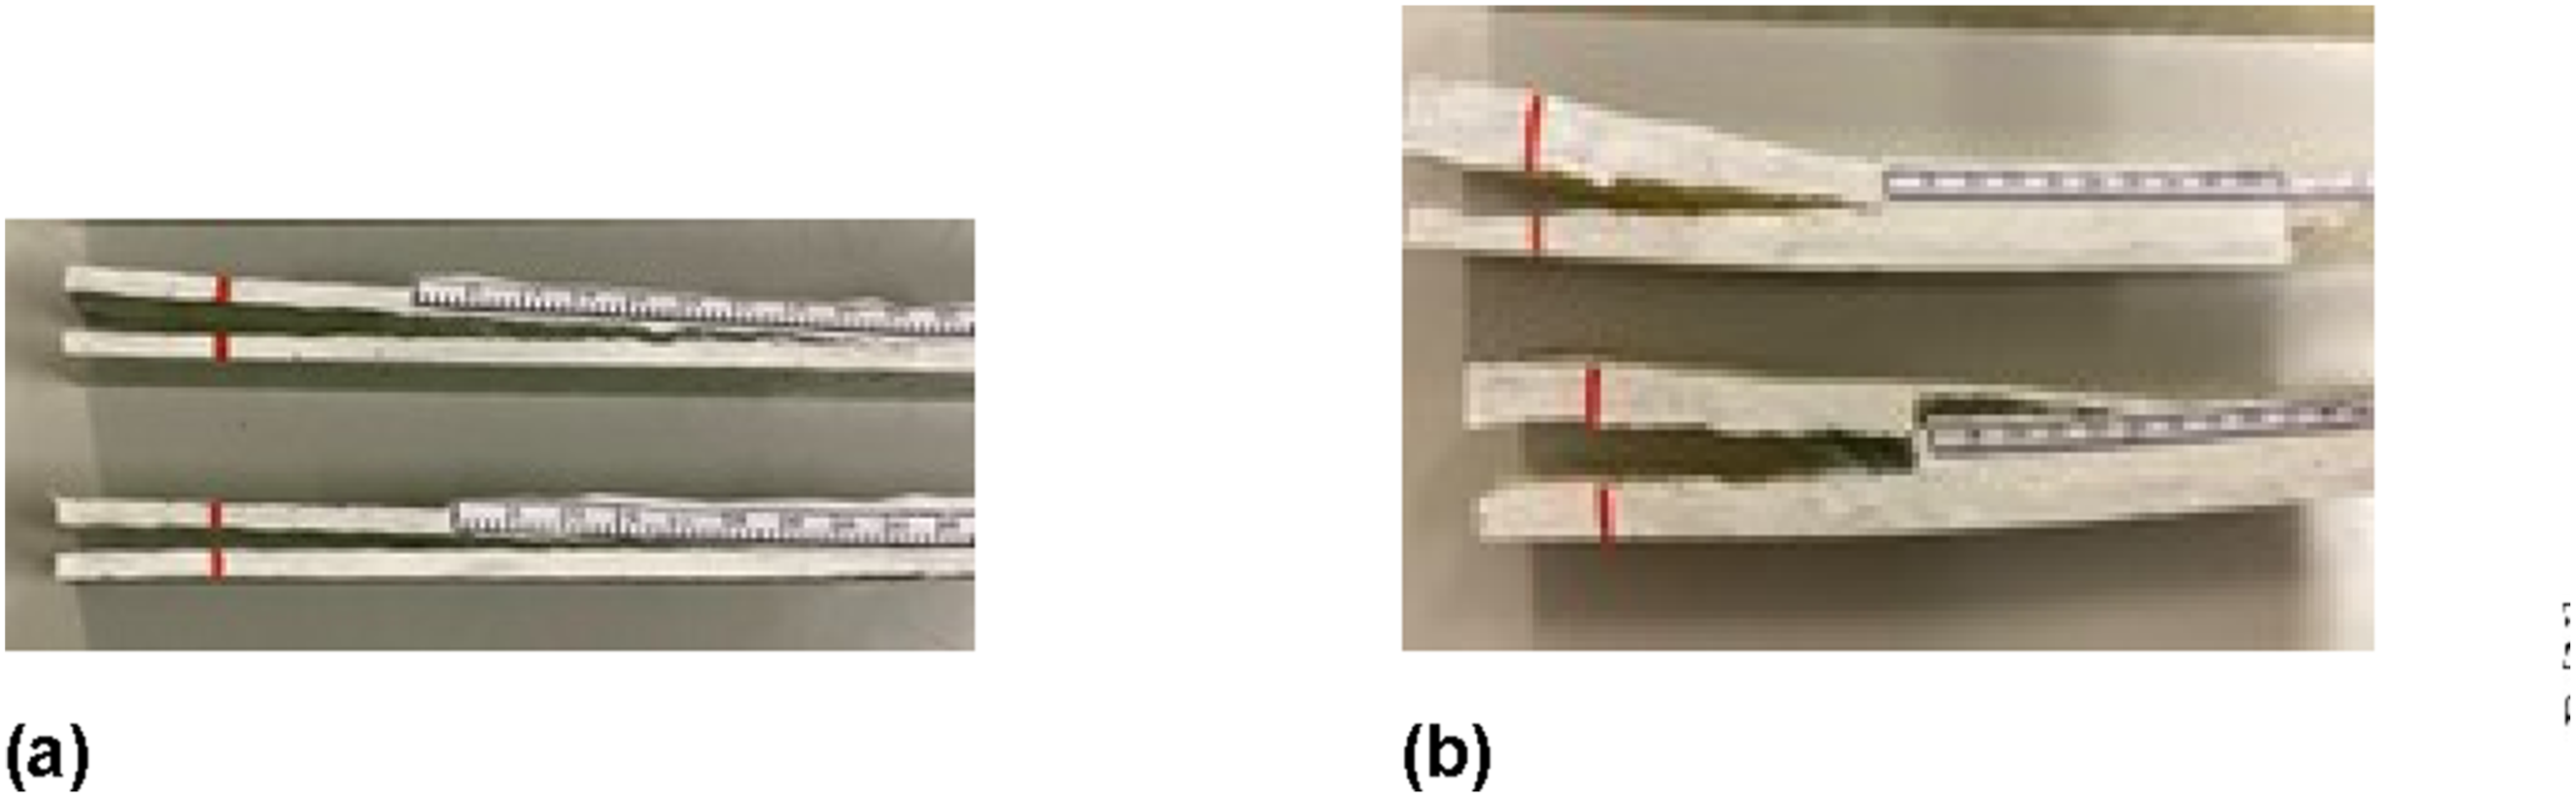
The P-δ curves were obtained for the ENF specimens. Figure 19 corresponds to the curves of all plates. These curves show that the displacement is higher in the specimens retrieved from plates 1 and 2 compared to the specimens of plates 3 and 4. It is observed that the final displacement values of the specimens from plates 1 and 2 are close to each other, as well as the specimens from plates 3 and 4. P-δ curves of ENF samples from plate 1 to plate 4 (a)–(d).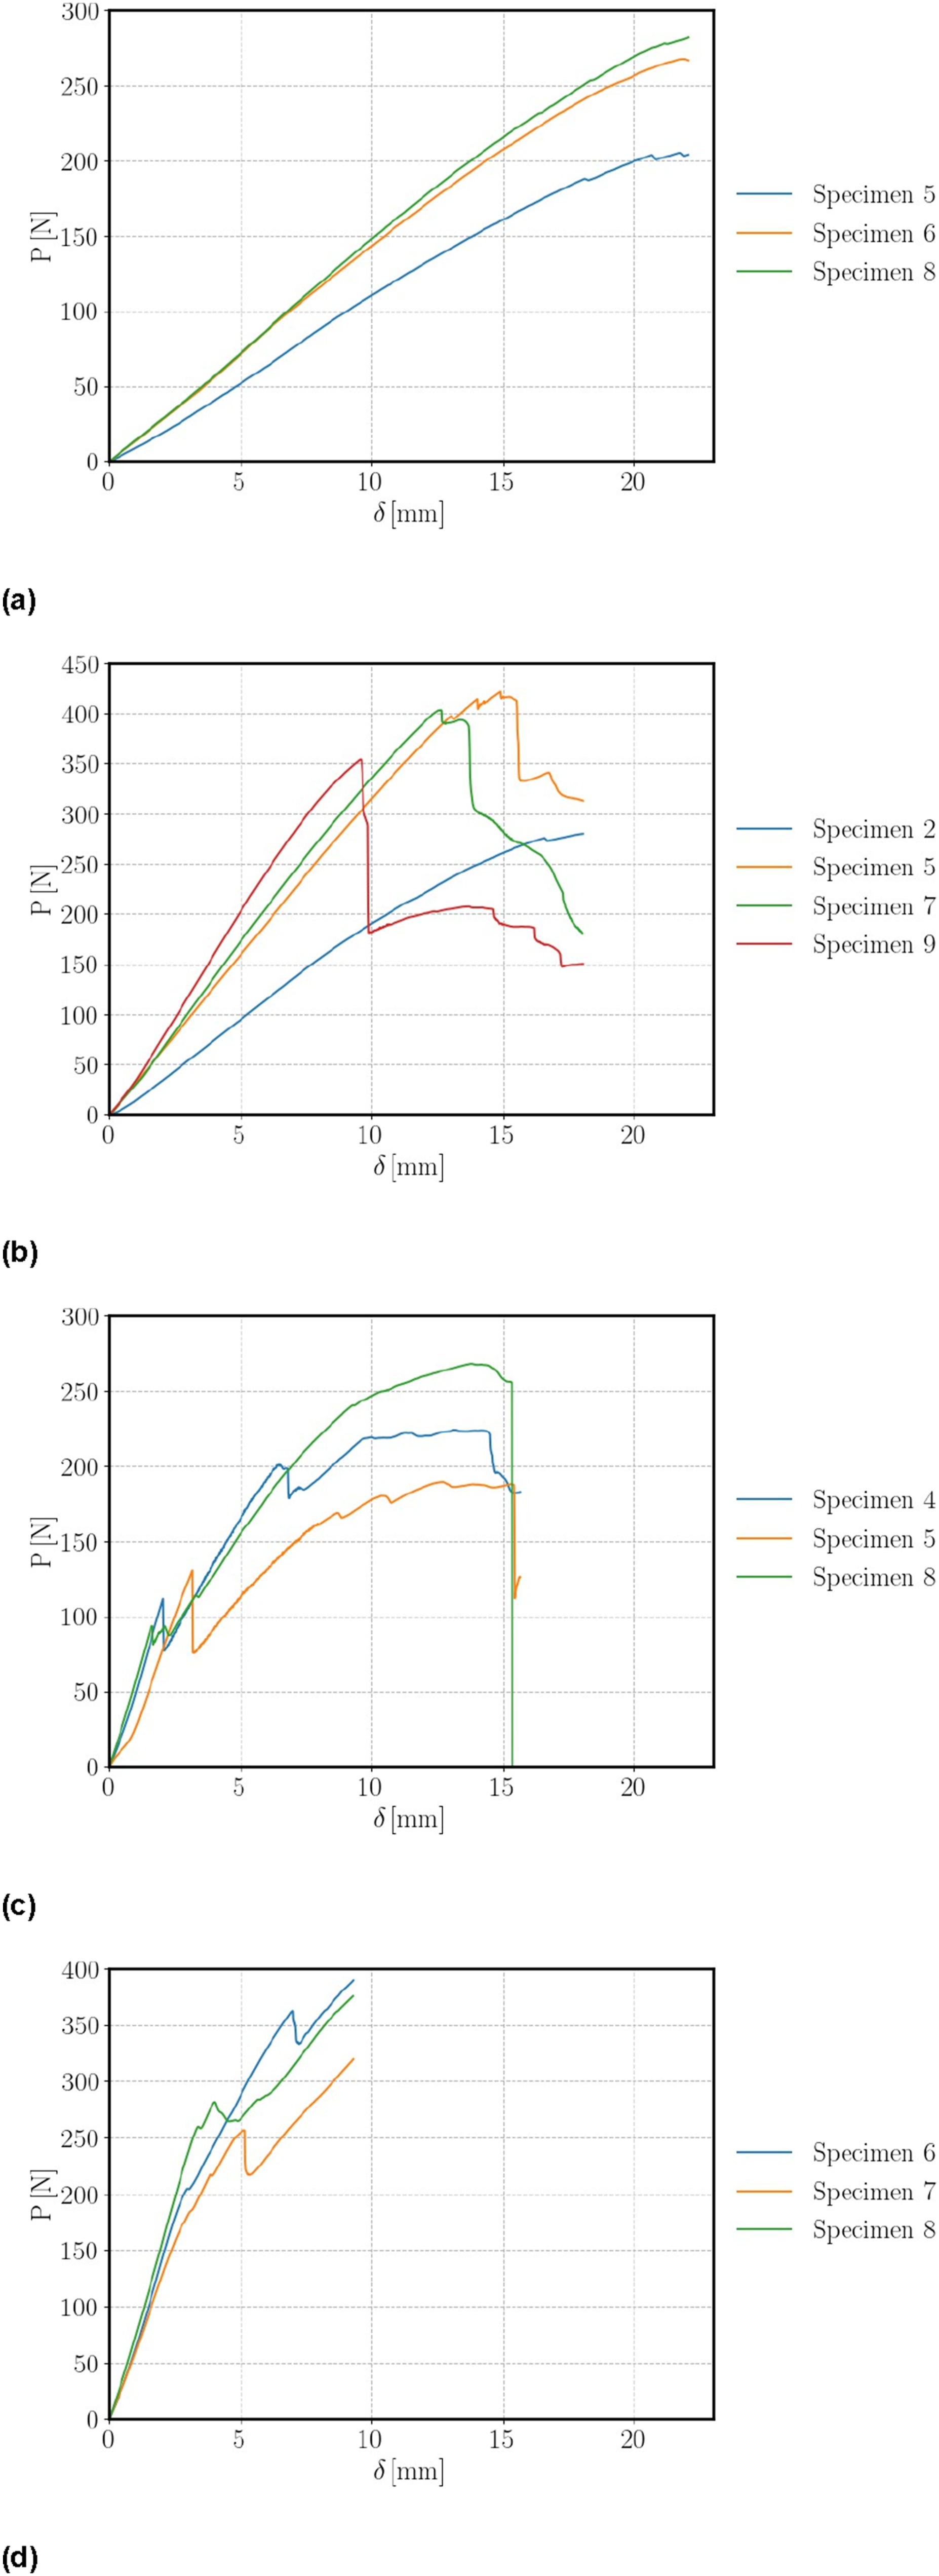
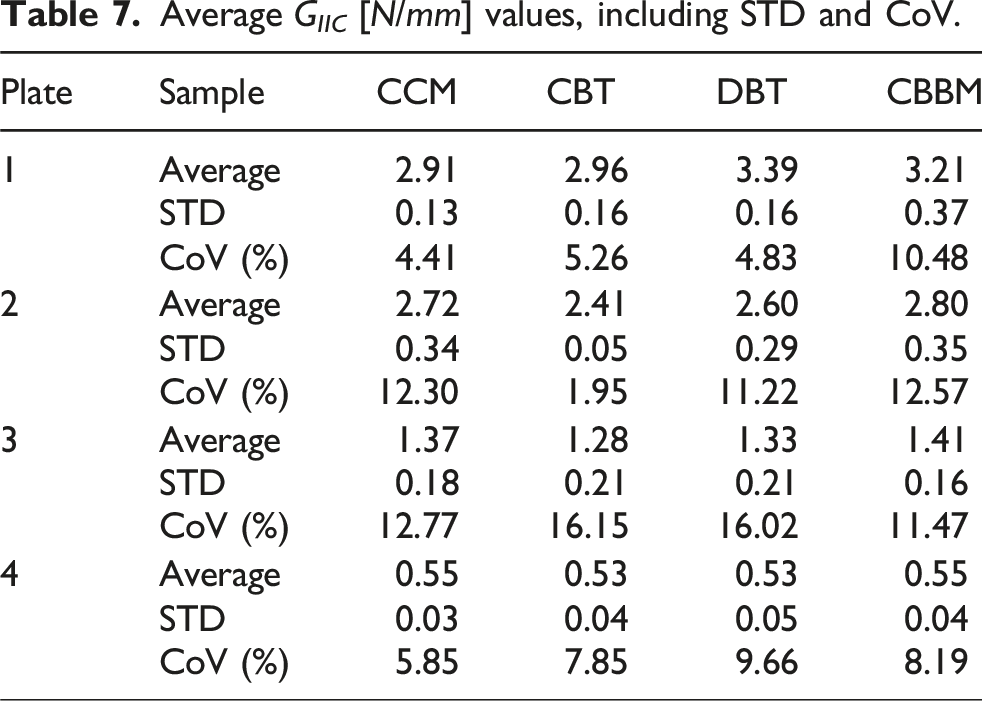
Average G IIC [N/mm] values, including STD and CoV.
Following the same method of results presentation as that of the mode I fracture tests, a more detailed analysis was conducted by plate type and fracture characterisation. Plots in Figure 20 illustrate the obtained results. There is a sharp drop in G
IIC
between the tested specimens of plates 1 and 2 and those of plates 3 and 4. It is worth to observe the proximity of the properties between plates 1 and 2, which constitutes a good indicator for the reuse of particles derived from fibreglass recycling. Regarding the PA and PP particles, it is noted that they are not good reinforcements for applications with the same requirements where fibreglass is commonly used. G
IIC
average values obtained by the CBBM (a), DBT (b), CBT (c), and CCM (d) methods.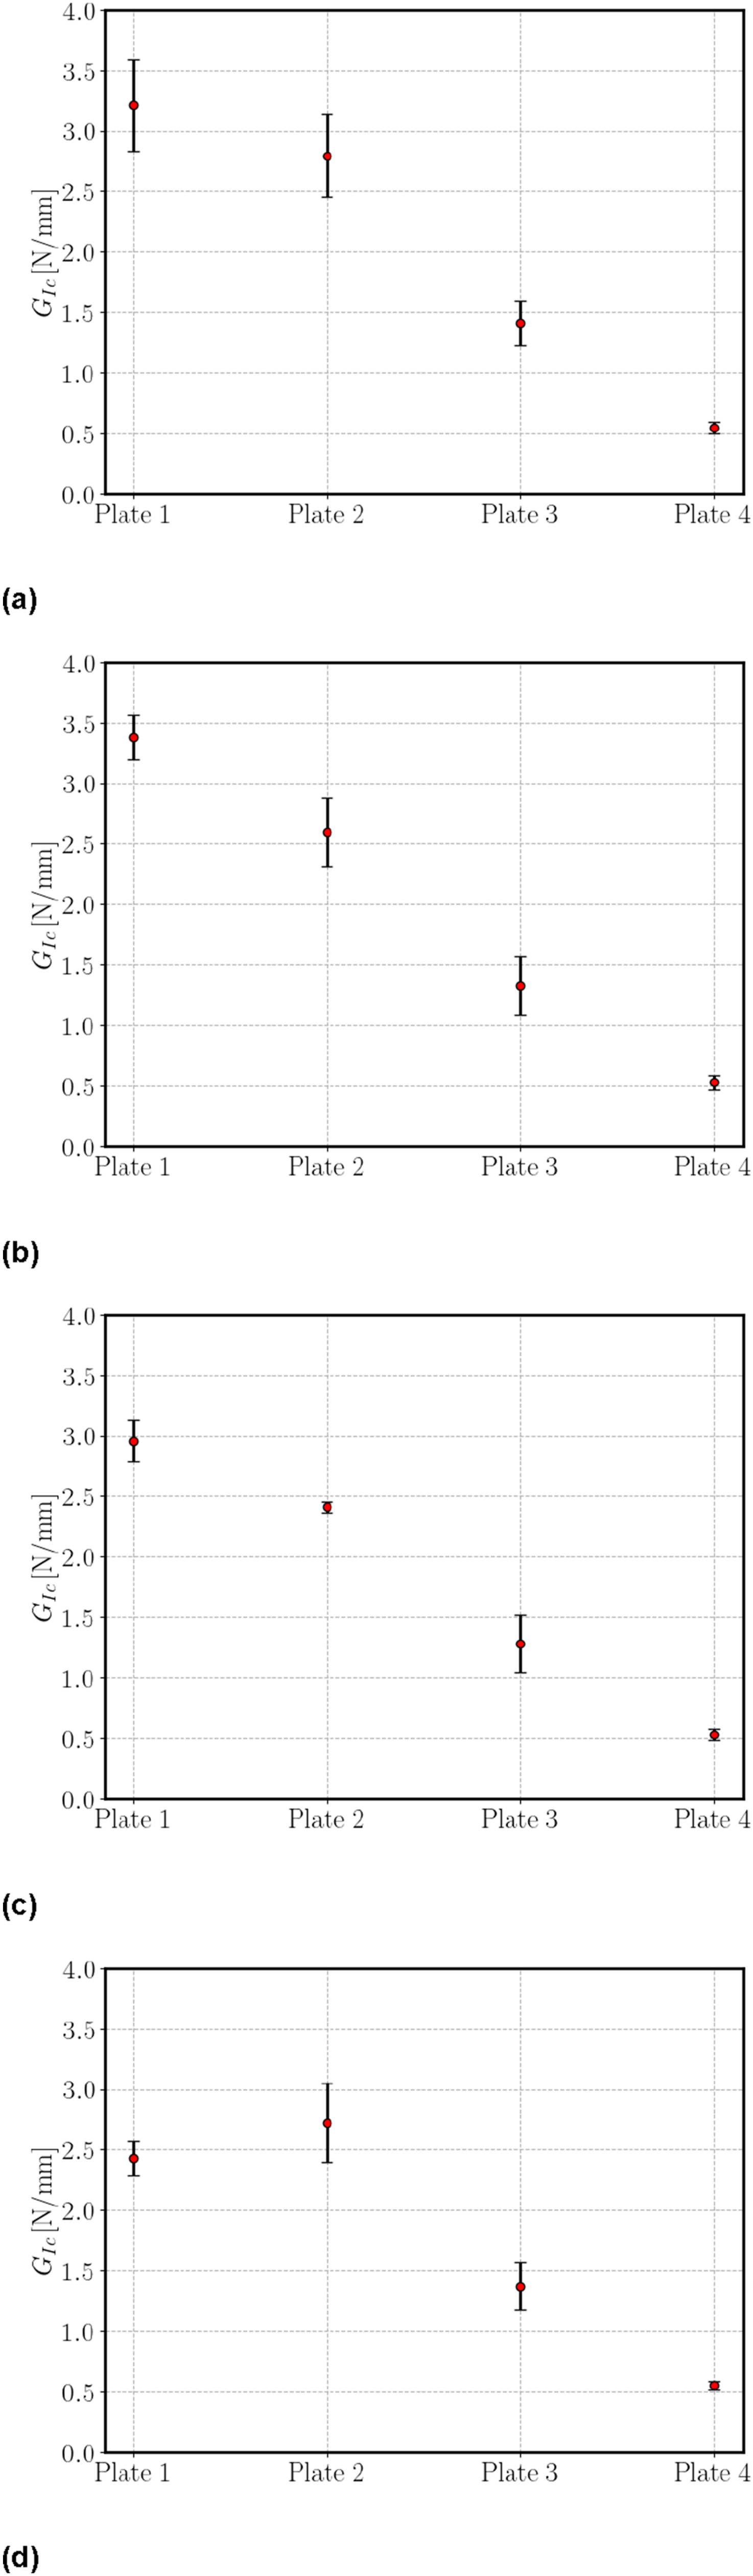
Case study
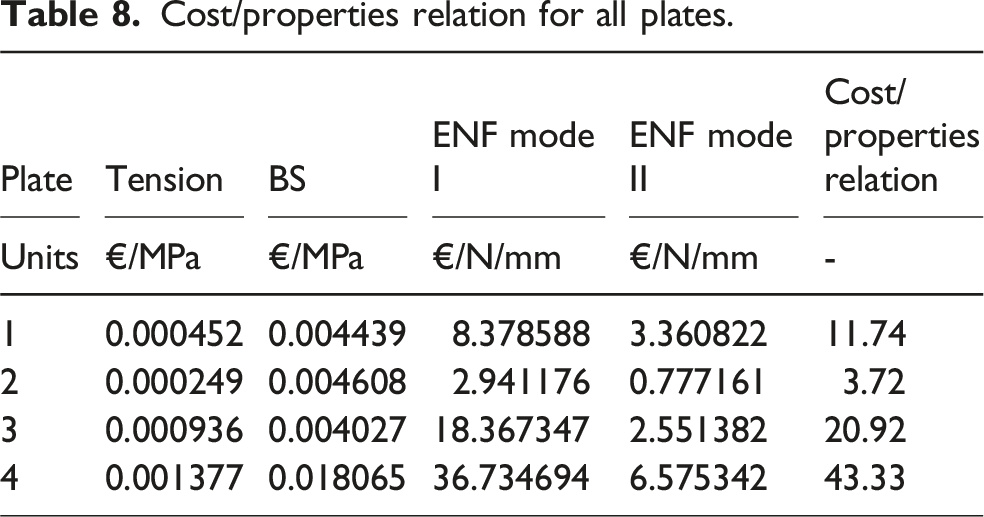
Cost/properties relation for all plates.
Wind turbine model data for the case study.
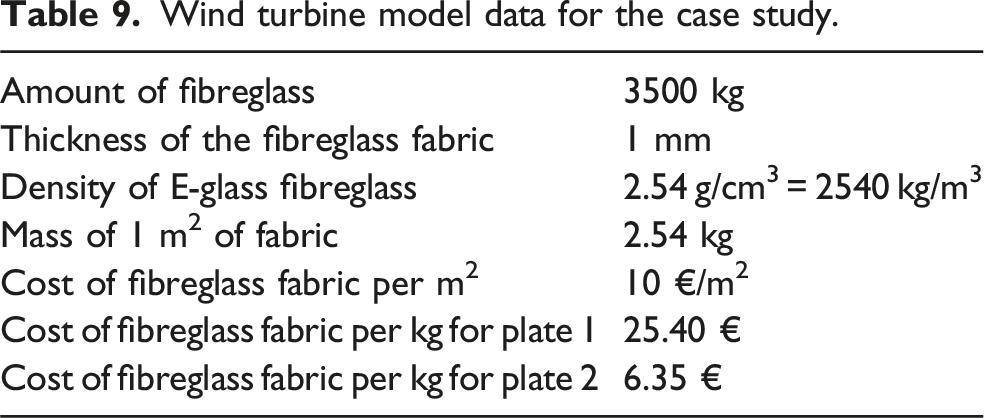
At this stage of the case study, plates 1 and 2 are of greatest interest for comparison, since the first is made entirely of new material, while the second is reinforced with recycled fibreglass fabric particles. Thus, the fibreglass mass in Plate 1 is 3500 kg, with a material cost of €25.4/kg, resulting in a total fibreglass cost of €88,900. For Plate 2, this cost is reduced to a quarter, with a total of €22,225. This represents a significant saving and can play a major role in the sustainable development of the planet and in how companies in the wind energy sector design their products.
Conclusions
This work assessed the potential of incorporating recycled materials into composite laminates, with particular focus on their tensile, shear, and fracture performance. Four different plate configurations were produced and tested, combining virgin and recycled reinforcements to evaluate the trade-off between mechanical behaviour and cost efficiency. The results showed that the reference plate reinforced exclusively with virgin fibreglass offered the highest strength and stiffness. However, the plate containing recycled fibreglass particles (plate 2) demonstrated a promising balance of properties, achieving mechanical performance levels suitable for structural applications while substantially reducing material cost. This indicates that scrap material from fibreglass cutting processes can be effectively reintegrated into new laminates, providing a realistic pathway for circular use of composites. By contrast, the plates reinforced with shredded PA (plate 3) and PP (plate 4) particles exhibited significantly lower mechanical properties. Their tensile and fracture behaviour revealed greater sensitivity to crack initiation and propagation, which limits their applicability in demanding structural contexts. Reclaimed fibreglass particles therefore provided markedly superior tensile modulus and strength compared to PA and PP particles owing to the intrinsically high stiffness and strength of fibreglass, even in discontinuous form. The polymeric particles in Plates 3 and 4 are soft, low-modulus, low-strength, low-aspect-ratio fillers that provide only marginal stiffening and almost no strengthening. No additional surface treatment was applied to any recycled particles, the original silane sizing on the E-glass fabric is largely preserved on the reused fibreglass particles, ensuring excellent chemical compatibility and strong bonding with the epoxy matrix. PA6 and PP particles, derived from automotive components, possess surfaces optimised for polyolefin or polyamide matrices, not epoxy. The superior retention of mechanical properties, and surface sizing, on fibreglass particles, combined with zero additional material cost, makes reclaimed fibreglass scraps the most promising candidate for sustainable structural composites among the solutions tested. Nonetheless, these results provide valuable information into the challenges of combining thermoplastic particles with fibreglass in hybrid laminates. The case study on wind turbine blades further emphasized the economic and environmental potential of recycled fibreglass composites. Even partial substitution of virgin fibres with recycled scraps can lead to significant cost savings and a measurable reduction in waste generation, without fully compromising the structural integrity of the components. Overall, the findings highlight that while not all recycled reinforcements are equally viable, fibreglass scraps in particular show considerable promise for reuse in large-scale applications. As future work, additional analyses such as microscopy (to assess fibre-matrix interface quality), differential scanning calorimetry or DSC/thermogravimetric analyses or TGA (to evaluate thermal stability and resin degradation), and density measurements (to quantify void content or reinforcement dispersion) would further enrich the understanding of these materials.
Footnotes
Consent to participate
All authors have agreed and worked together on the research and manuscript preparation.
Author Contributions
Funding
The authors received no financial support for the research, authorship, and/or publication of this article.
Declaration of conflicting interests
The authors declared no potential conflicts of interest with respect to the research, authorship, and/or publication of this article.
Data Availability Statement
The datasets generated during and/or analysed during the current study are available from the corresponding author on reasonable request.