
Abstract
The investigation of the mechanical properties of additively manufactured (AM) composite has been the focus of several research over the past decades. However, testing constraints of time and cost have encouraged the exploration of more pragmatic methods such as machine learning (ML) for predicting these characteristics. This study builds on experimental investigations of the flexural, tensile, compressive, porosity, and hardness properties of 3D printed carbon fibre-reinforced polyamide (CF-PA) and carbon fibre-reinforced acrylonitrile butadiene styrene (CF-ABS) composites, proposing the application of ML for predicting these mechanical properties. A comprehensive comparative analysis of various machine learning approaches was executed, with a resultant accuracy ranging between 80 and 99%. The results unveiled the superior predictive performance of ensemble tree learners and the K-NN regressor algorithms when temperature and porosity are selected (based on correlation analysis) as predictors for material hardness and strength in tension, compression, and flexion. In particular, the model built on the extra-tree regressor algorithm demonstrated a remarkably robust fit, with R-squared evaluation scores of 0.9993 and 0.9996 for CF-PA and CF-ABS, respectively. This work develops a ML model that relates porosity to the other mechanical properties of AM composites and the prediction models’ exceptional accuracy, along with their precise alignment with experimental data, provide invaluable insights for the autonomous control and data-driven optimization of the structures.
Keywords
Introduction
Over the past decades, the production and application of AM fibre-reinforced composites have seen a significant surge. This growing interest is predominantly driven by the inherent advantages of AM such as customized design, rapid manufacturing, minimal material wastage, and relatively low costs. When these benefits are paired with the high strength-to-weight ratios of fibre-reinforced composites, the result is a versatile, efficient, and cost-effective solution for various industrial applications. 1 These unique combinations have contributed to the broader adoption and continued evolution of AM fibre-reinforced composites in both research and practical settings.2–4 Despite the revolutionary capabilities of AM as a rapid manufacturing technique, the mechanical performance of the fabricated structures depends on critical materials and process factors, such as reinforcement contentment and types, matrix types, and fabrication temperature, among others.5–8 For instance, the fabrication temperature affects the degree of porosities, which in turn influences the mechanical performance of the AM fabricated composites. The assessment of these effects has been primarily through experimental analysis, which can be both time and resource-consuming to determine the extent of the effects. However, recently, the application of machine learning (ML) for predicting and better understanding composite materials performance is gaining traction. This trend can be attributed to ML’s high predictive accuracy and robustness across a diverse range of applications. 9 The use of machine learning in the AM process is showing promising results. Lu et al. 10 utilized ML for real-time defect detection in the fabrication of AM fibre composites. Also, logistics regression was adopted to delineate damaged and undamaged portions of composite structures, leading to the development of high-sensitivity damage detection models.11–15
Cai et al. 15 demonstrated ML potential when they used six ML methods to investigate the dynamic strength of AM composite materials. Their results indicated that the artificial neural network (ANN) could achieve the highest prediction accuracy with minimum computational efficiency while the support vector regression (SVR) provided satisfactory prediction with good accuracy and efficiency. The employment of ML in various facets of AM fibre-reinforced composites has been examined by several researchers, each focussing on different aspects of AM composites. Previous work has seen the successful application of different regression models in predicting and optimizing the mechanical properties and fabrication parameters of AM fibre composites. Leon-Becerra et al. 16 utilized the Gaussian process regression (GPR) to describe the principal failure mechanism and predict the tensile stiffness and strength of CF-ABS under various conditions. Zhang et al. 17 developed an ML algorithm to predict the flexural strength of AM-fabricated carbon fibre-reinforced plastic (CFRP) composites, comparing different design factors such as infill patterns, number of reinforcements, and number of concentric carbon rings. Sharma et al. 18 studied the impact of AM process parameters such as wall thickness, print speed, build plate, and extrusion temperatures on the dimensional accuracy of various shapes and compared the results between different materials. In a similar vein, Veeman et al. 9 used linear regression and ensemble tree learners to optimize process parameters and predict hardness values for Acrylonitrile Butadiene Styrene (ABS) thermoplastic. Furthermore, Vyavahare et al. 19 used deep neural network to predict the strength, stiffness, and specific energy absorption under flexural loading. While also optimizing material properties.
Although considerable progress has been made in the application of ML for predicting and understating various aspects of AM fibre-reinforced composites, existing models often do not sufficiently address the impact of porosity on the overall mechanical performance. Understanding how fabrication temperature-induced porosity affects the performance of these composites is pivotal in developing more reliable and efficient AM processes, ultimately leading to improvement in the mechanical performance of the final product. Motivated by this research gap, our study aims to contribute to the broader understanding of AM fibre-reinforced composites by incorporating the effects of fabrication temperature-induced porosity into predictive regression models. Thus, the development of an ML framework in this work could provide valuable insights for the optimization and prediction of the mechanical properties of AM fabricated fibre composites. This research is built upon the previous work of the authors, which examined the effects of process and environmental fabrication factors on the tensile, compressive, flexural, and hardness properties of AM fibre-reinforced composites.20–23 We intend to further this investigation by establishing a predictive framework utilizing several ML regression algorithms. Models demonstrating superior performance based on the assessment metrics of mean square error (MSE), mean absolute error (MAE), and coefficient of determination (R2) were adopted for this research. The selected predictive models were thereafter compared against each other and validated for their accuracy, robustness, and reliability in predicting the mechanical properties of the studied composite. In this research, strength and hardness were chosen as response variables due to their pivotal role in determining the composite’s applicability across various industrial applications. The ability of a composite to withstand mechanical stress (strength) and resist deformation (hardness) directly influences its durability and lifespan. On the other hand, temperature induced-porosity was selected as the predictor. Therefore, the application of this methodology in characterizing these properties can aid in designing more efficient and durable AM fabricated fibre-composites. The remainder of this manuscript is organized as follows: Sections 2 and 3 detail the experimental and ML methodologies, respectively, while the results are discussed in Section 4. In the conclusion, the research findings are encapsulated and their implications for AM fibre-reinforced composites are summarised.
Experimental methodology
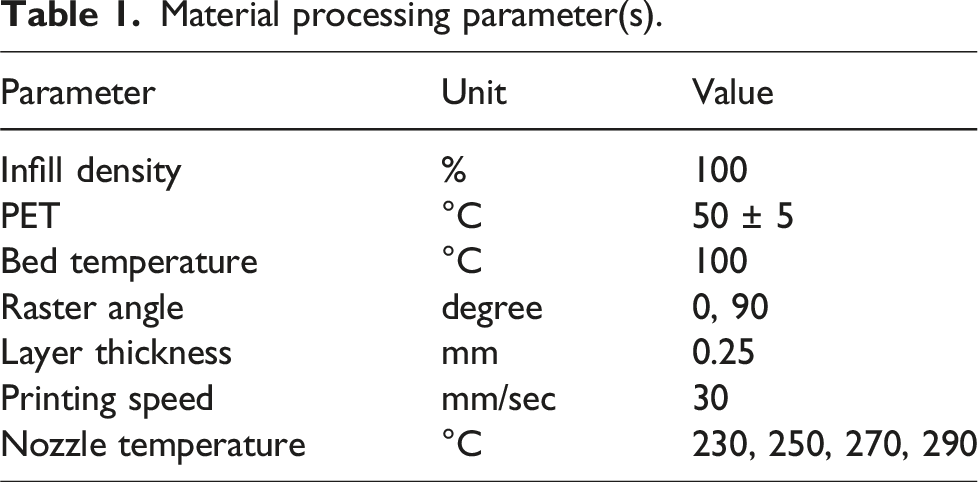
Material processing parameter(s).
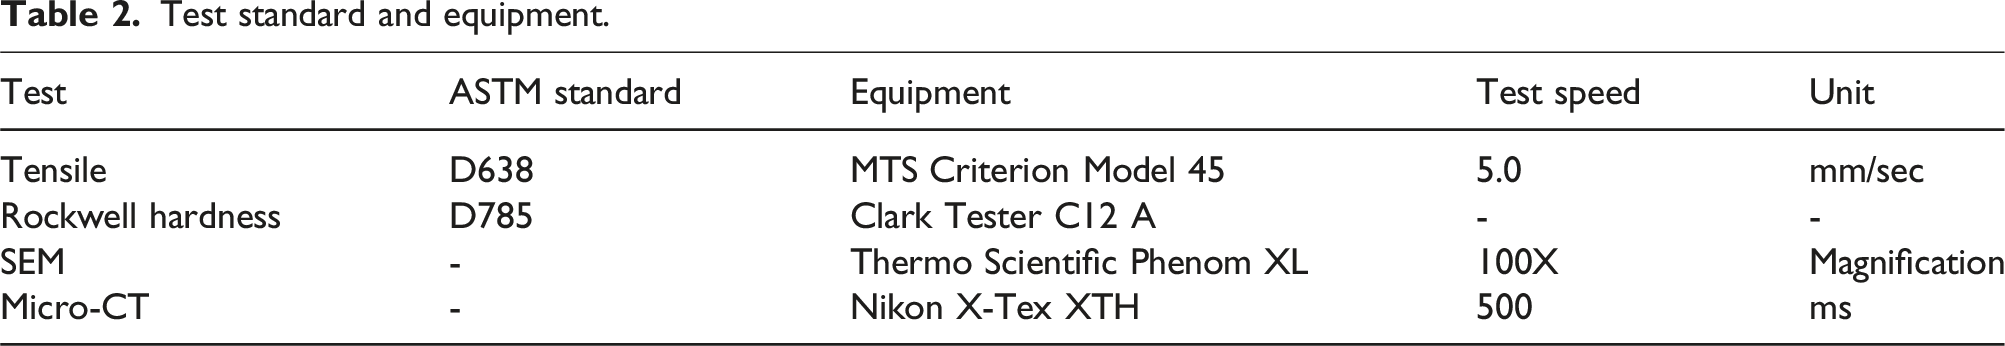
Test standard and equipment.
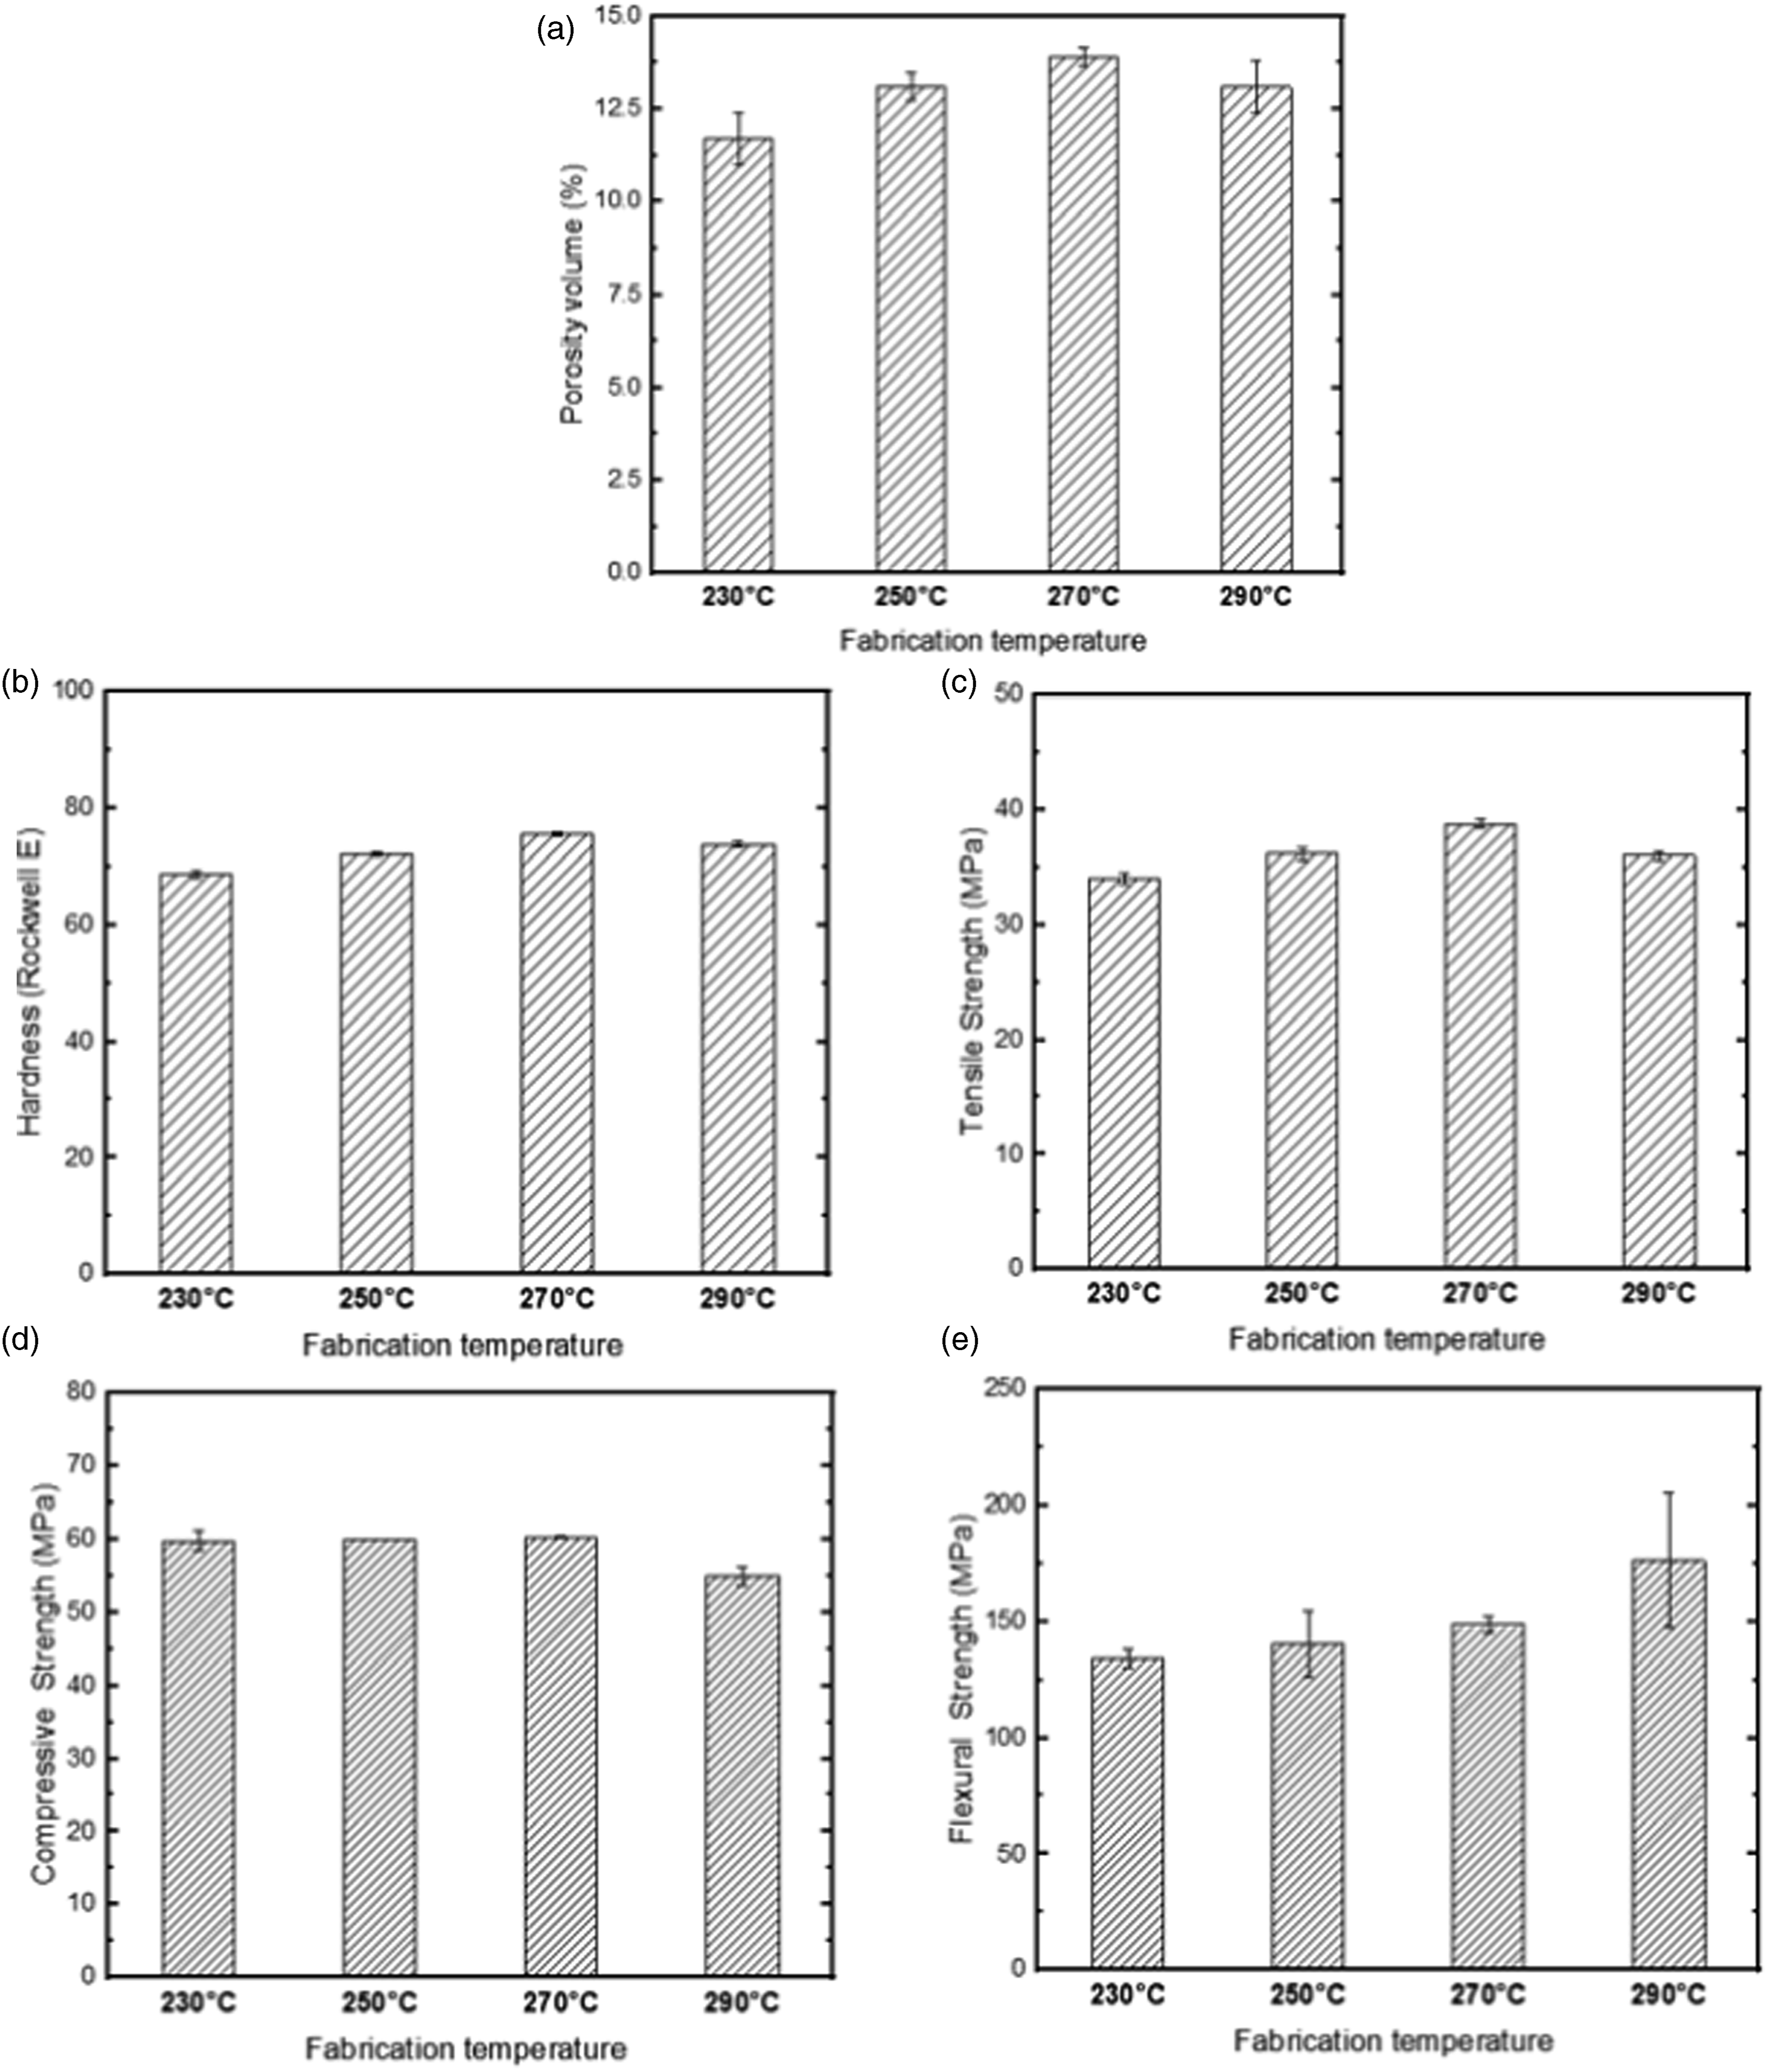
Figures 1 and 2 provide a summary of the experimental test results, specifically the impact of fabrication temperature on the properties of AM-fabricated CF-PA and CF-ABS composites, respectively. Effect of fabrication temperature on the key properties of AM-fabricated CF-PA composites: (a) porosity volumes, (b) hardness, (c) tensile strength, (d) compressive strength, and (e) flexural strength. Effect of fabrication temperature on the key properties of AM-fabricated CF-ABS composites: (a) porosity volumes, (b) hardness, (c) tensile strength, (d) compressive strength, and (e) flexural strength.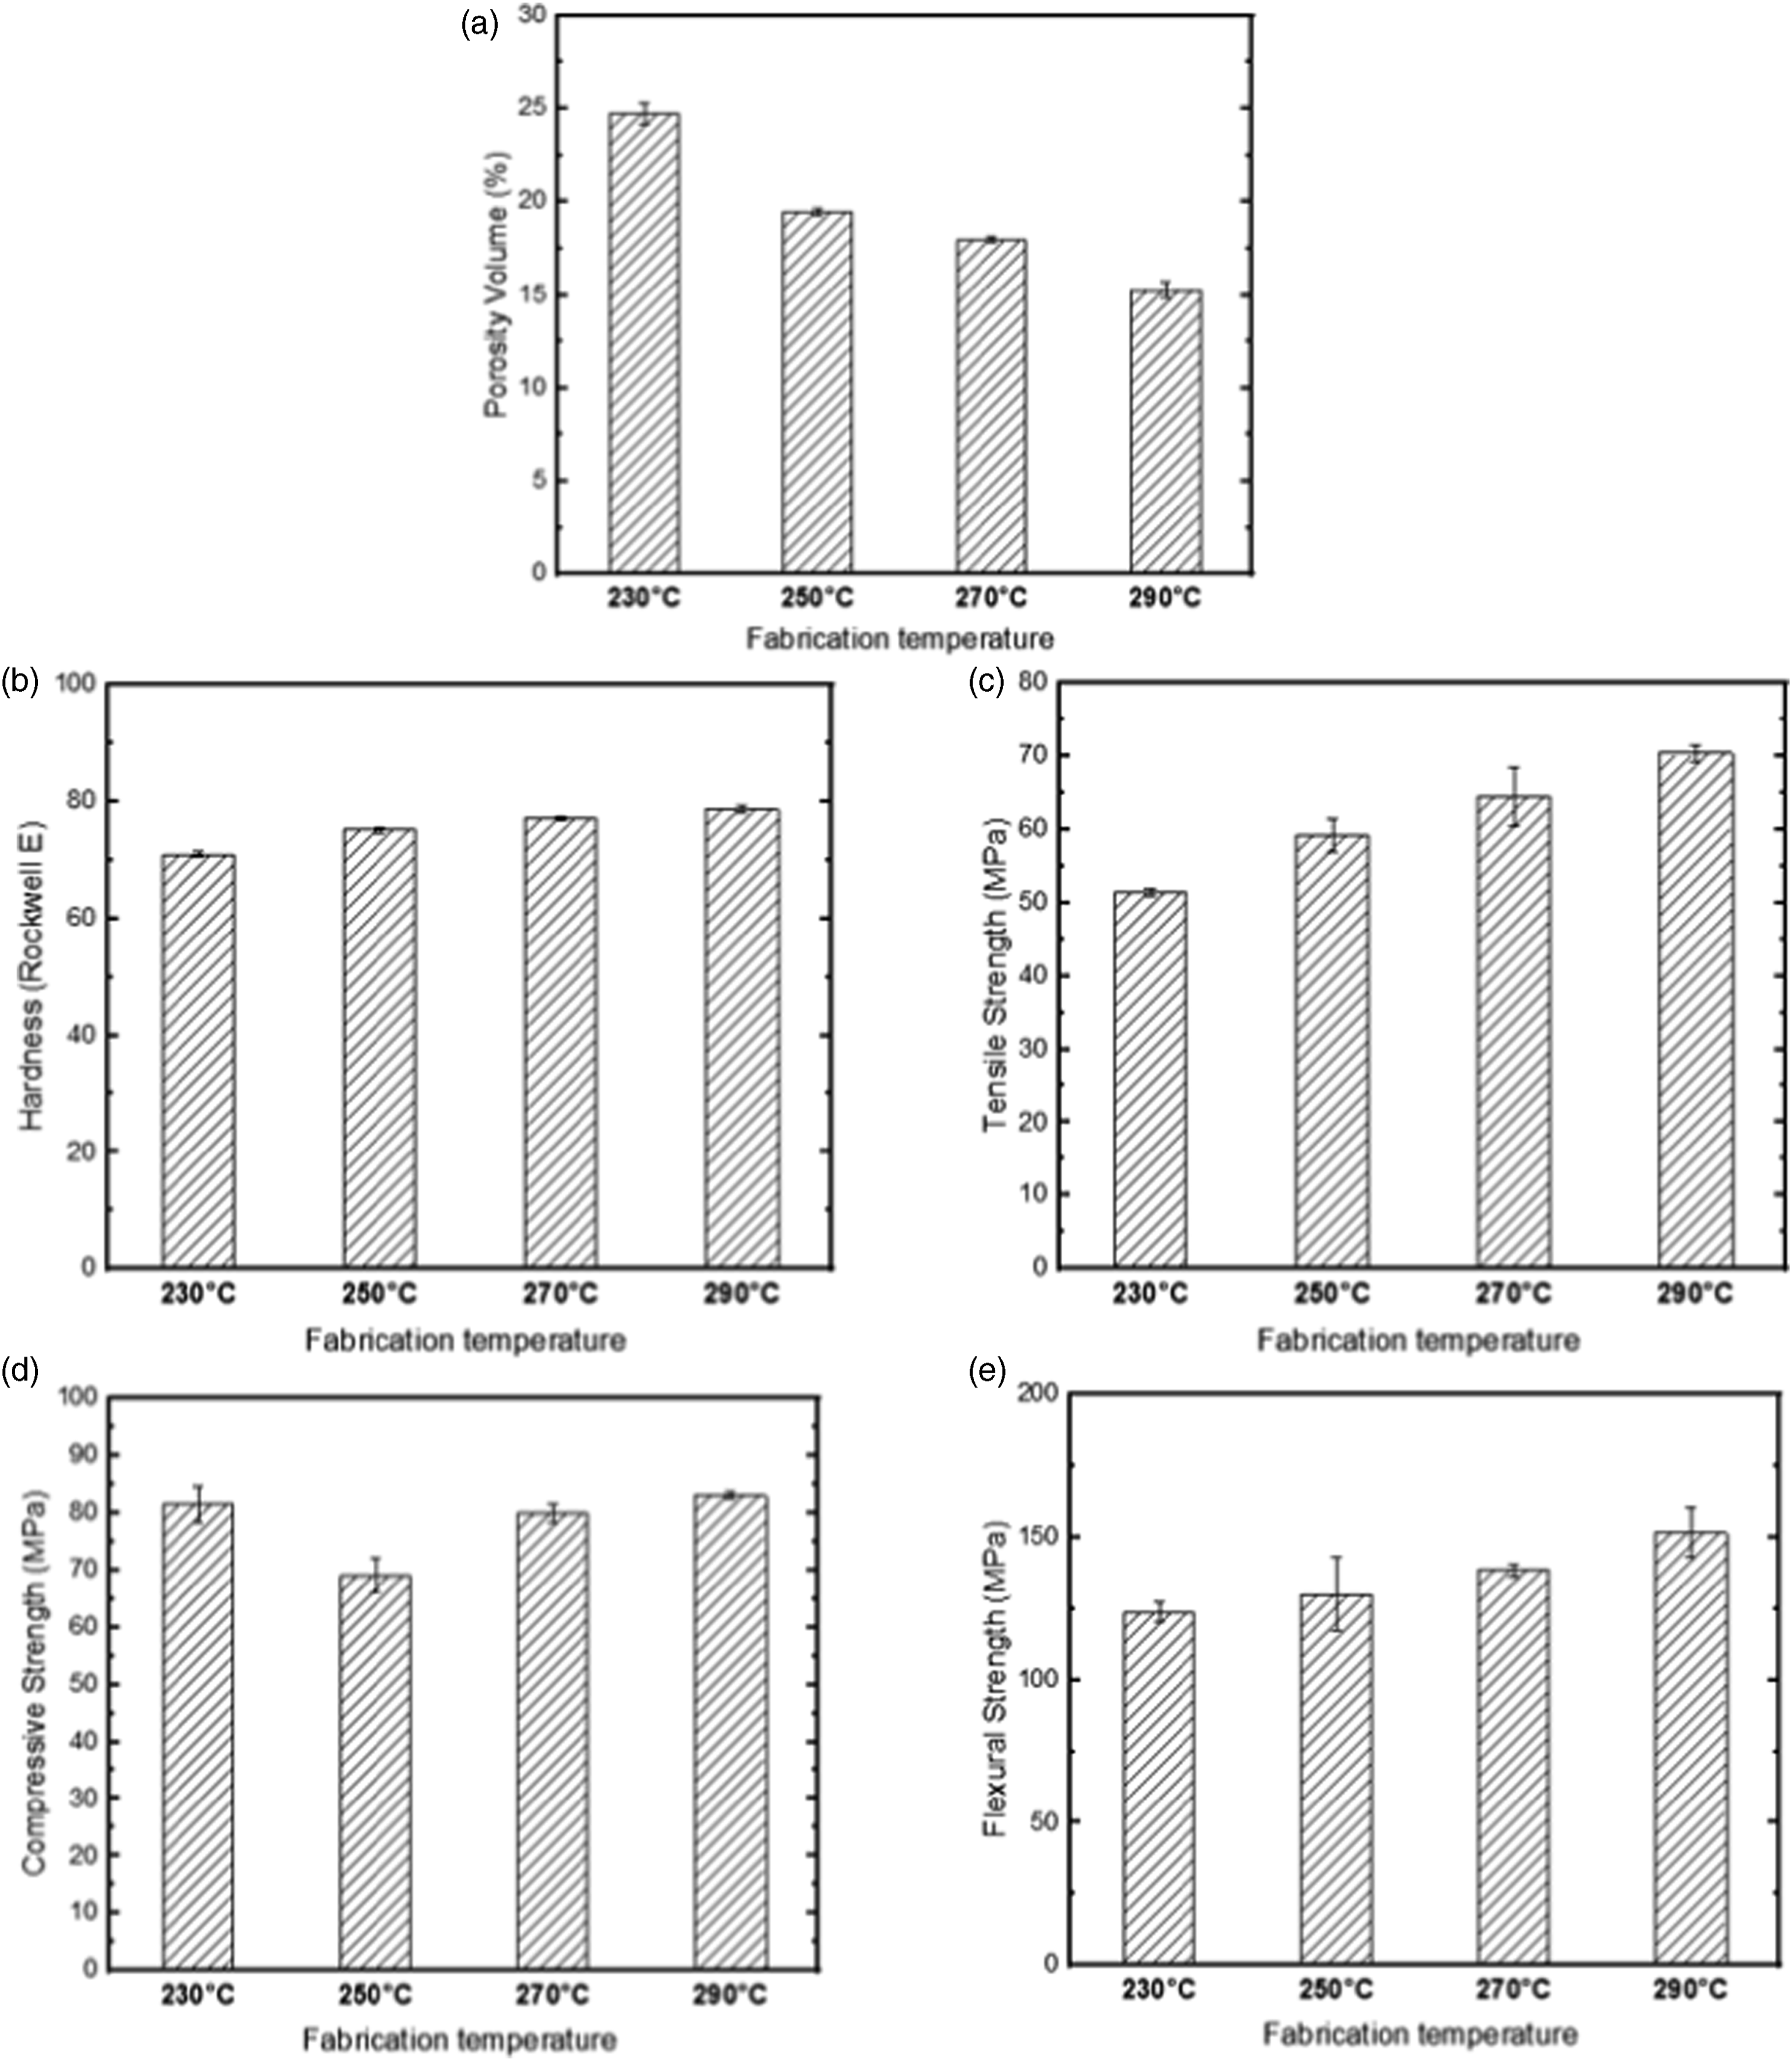
Our comprehensive experimental setup, combined with the implementation of specified processing parameters and standardized tests, enabled the generation of a robust and reliable dataset. This dataset serves as the cornerstone for the development of our machine-learning models, aiming to predict the mechanical properties of AM composite materials. To provide a holistic view of our research methodology, we refer to the comprehensive schematic (Figure 3) included in this section. The schematic illustrates the experimental setup, data collection, and subsequent application of machine learning techniques. It provides a succinct overview of our systematic approach from the initial experiment to the final prediction models, bridging the gap between practical experimentation and data-driven modelling. Schematic of the research set-up.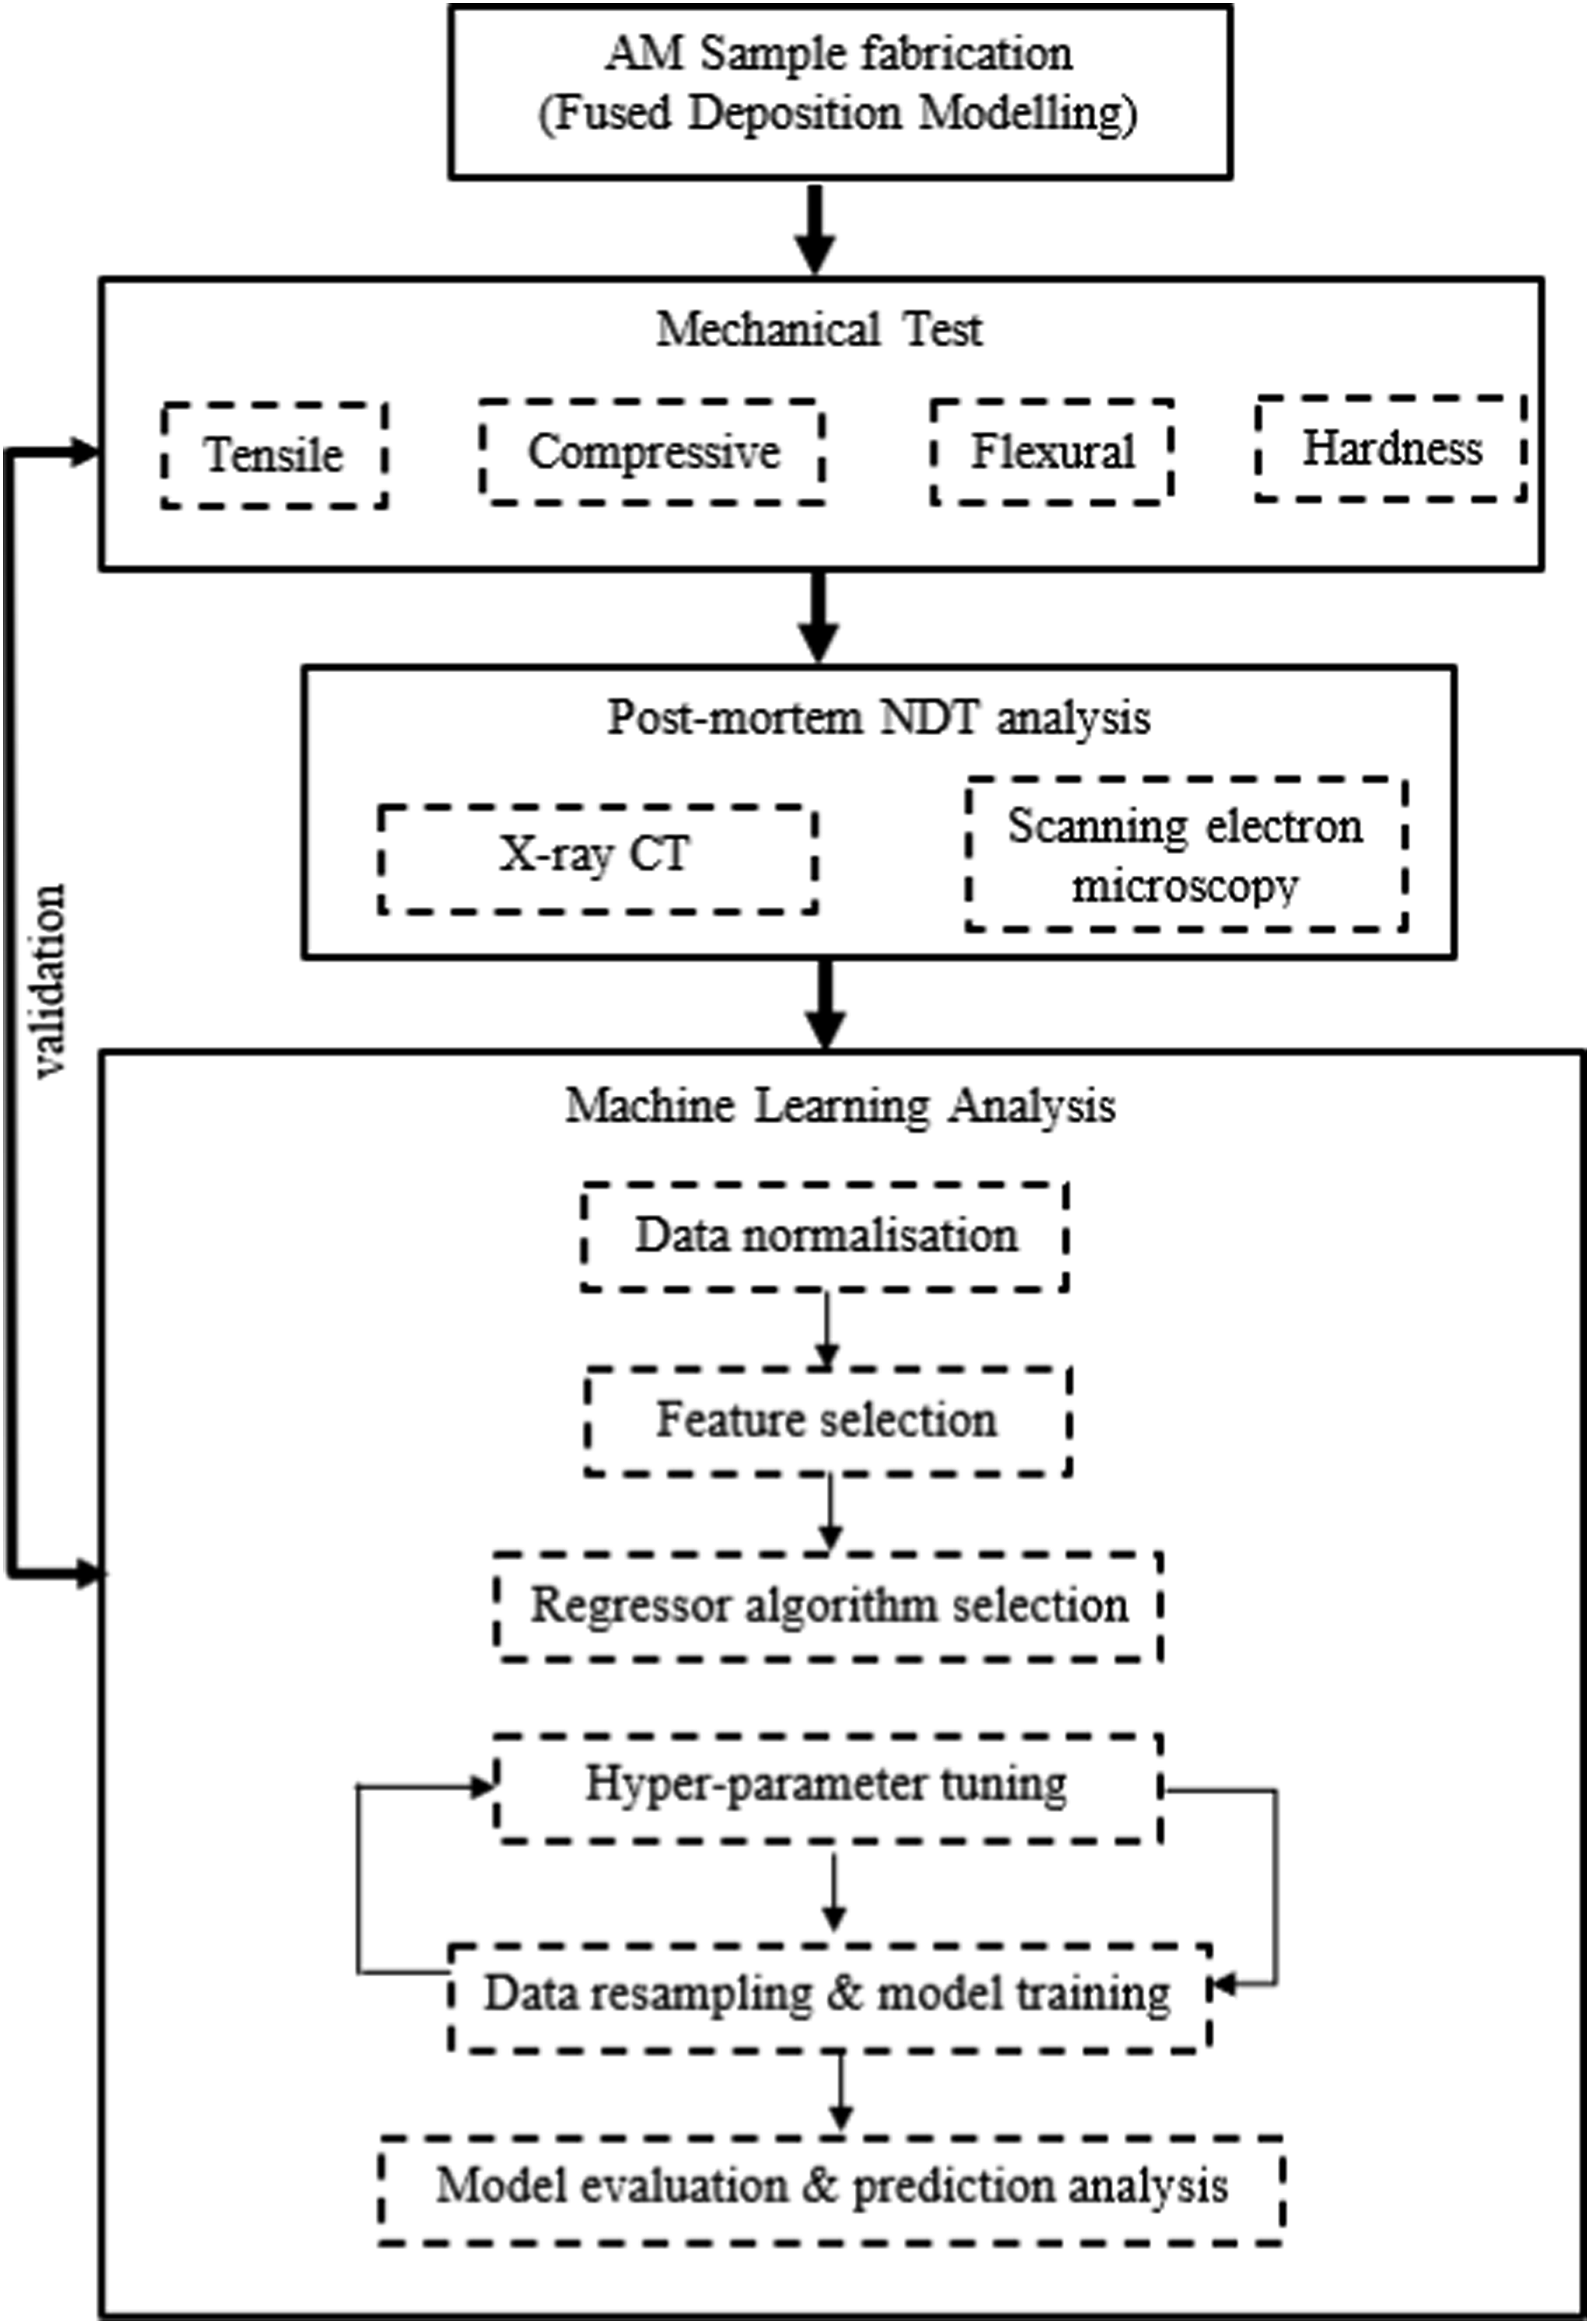
Data description
In this study, data was obtained from the porosity, tensile, flexural, compression, and hardness experiments carried out on the two AM composite. Each sample case had a total of five tests. It is worth noting that these mechanical parameters are important to adequately characterize the properties of the materials which could lead to optimization of these structures in engineering applications.24–26 Additionally, it has been established that the in-plane and out-of-plane mechanical performance of AM composites are influenced by the porosity gradient which is mainly a product of the manufacturing technique and constituents properties. 21 Furthermore, no pre-processing technique was employed because it was necessary to capture the underlying patterns in the data distributions as well as avoid influencing the outliers by any pre-processing method. Therefore, the concept adopted in this paper is to develop a predictive model that is robust to outliers.
ML methodology
The machine learning methodology, as outlined in the research schematic (Figure 3) encompasses several fundamental steps that contribute to the development of predictive models. These steps include data normalisation, feature selection, selection of regression algorithms, data resampling, model training, and model evaluation. Each of these components plays an integral role in shaping the accuracy, reliability, and robustness of our ML framework.
Data normalisation
Data normalisation, also known as feature scaling, is an essential pre-processing step in our ML framework. By rescaling the features to a defined range, any potential feature dominance is prevented, the impact of outliers is mitigated, and the convergence and compatibility of the ML algorithms are improved. In this context, the dataset features (represented as X = [x1, …, xN]T ∈ RNxM, where N is the total number of observations and M is the number of features)were transformed into a range of 0 to 1. This transformation is performed using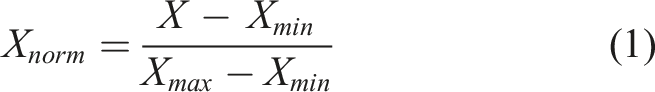
Feature selection
Before proceeding with model training, it is necessary to identify relevant and informative features for accurate prediction. This process, referred to as feature selection, aids in enhancing the model’s performance, reducing the risk of overfitting, improving interpretability, and reducing computational complexity.27–29 In this study, an integrated approach of expert judgement with Pearson’s correlation coefficient (PCC) has been utilised to identify the most informative features. PCC is a statistical measure that assesses the strength and direction of the linear relationship between features.
30
It is particularly effective in pinpointing the most informative features that contribute significantly to the target variables. The Pearson’s correlation coefficient (r) between the 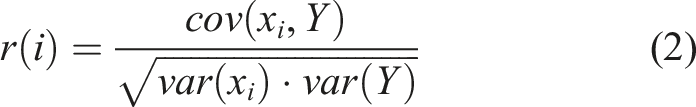
ML regressor algorithm selection
Our study utilised Lazy Predict, an intuitive Python library that facilitates efficient training and evaluation of multiple ML models using the default models’ configurations and hyperparameters. This tool enabled us to predict the hardness and strength of CF-PA and CF-ABS composites, deploying a pool of 35 ML regression algorithms. Thereafter, a majority voting system was carried out to identify and retain models that achieved a minimum of 70% accuracy in predicting the target variables for the materials investigated in the study. To ascertain that the top-performing algorithms are not a result of chance, the Friedman statistic, a non-parametric statistical test was adopted. It is expressed as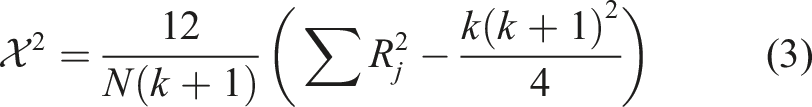
Owing to its robustness towards assumptions such as data normality, the Friedman test was adopted in this study. 31 In determining the p-value, the computed Friedman statistics is compared to the chi-square distribution. With a p-value less than the chosen significance level of 0.05, the null hypothesis is rejected and thus the regressor is concluded as being of a higher performance and not merely by chance. These selection criteria served to ensure the focus on the most promising, accurate, and reliable models in subsequent analysis and evaluations. Various model predicting algorithms that featured in this study included ensemble learners (e.g. Random Forest), support vector, and k-Nearest Neighbour regressors.
Random forest regressor
Random Forest (RF) is a robust machine learning regressor that utilises ensemble learning (a technique that combines classifiers) to solve regression and classification problems.
32
It generates outcomes based on predictions from multiple decision trees and enhances its accuracy of prediction through averaging/majority voting as illustrated in Figure 4. An illustration of regression using Random Forest.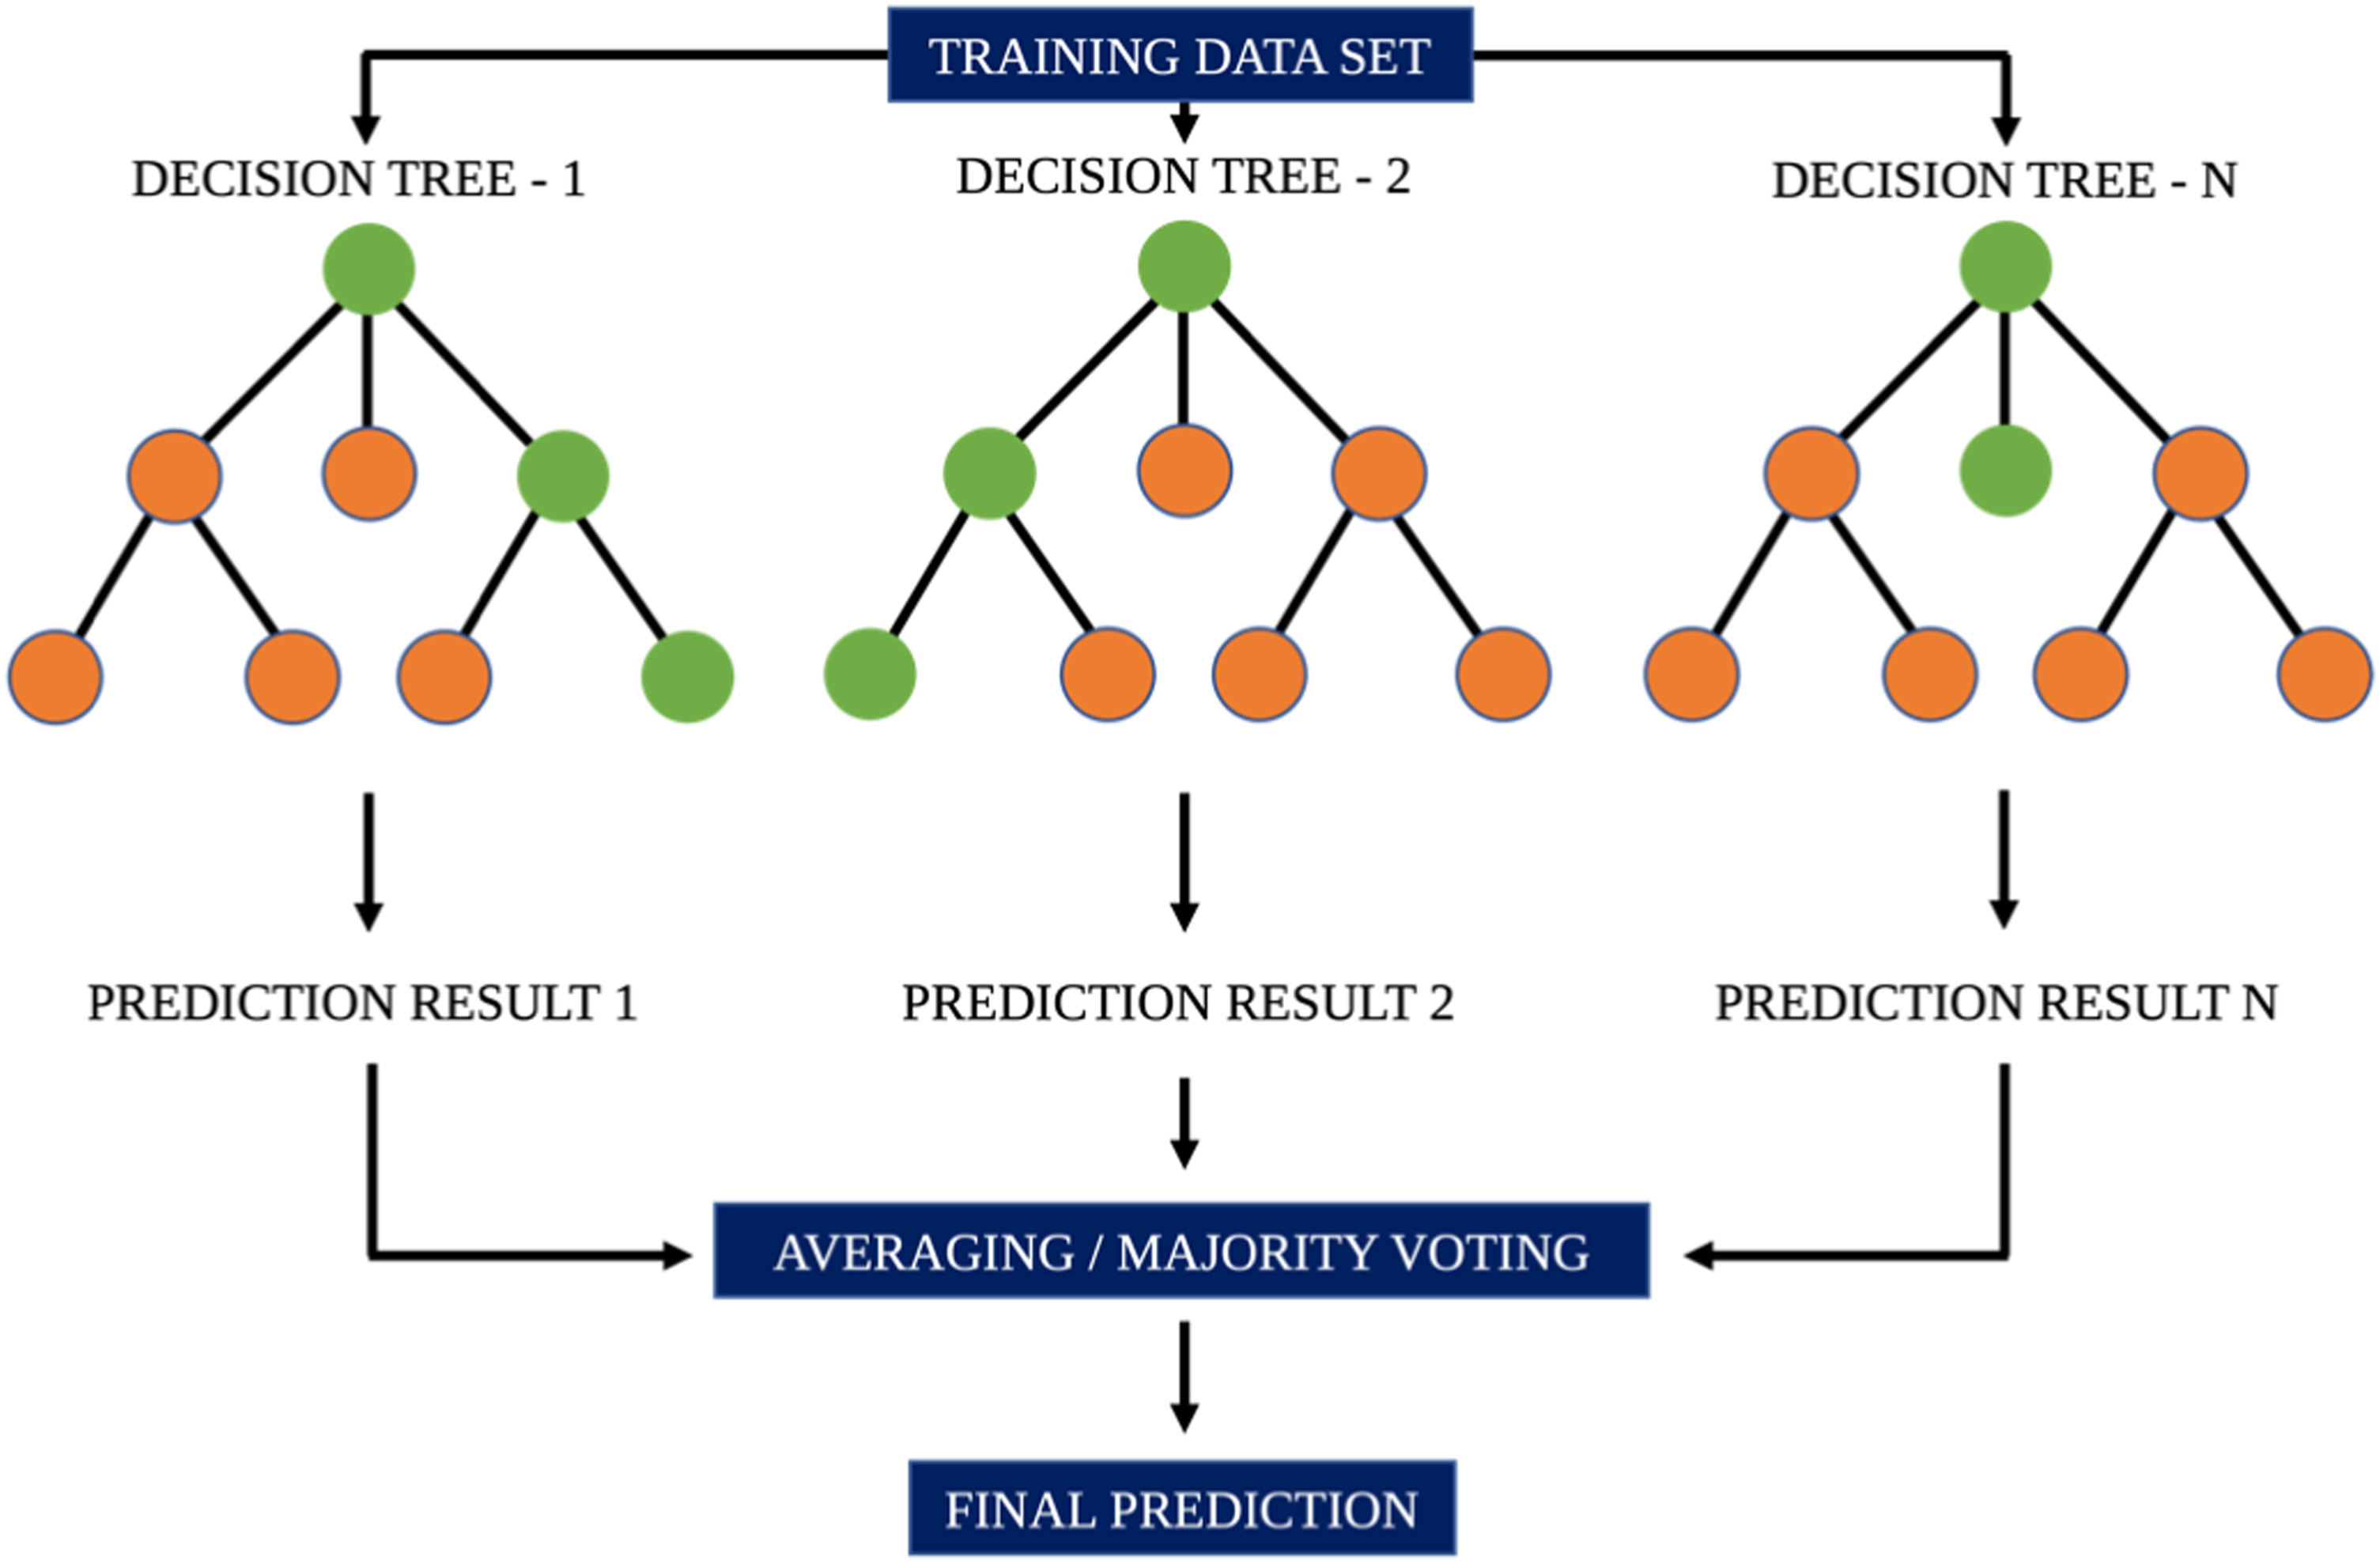
Support vector regressor
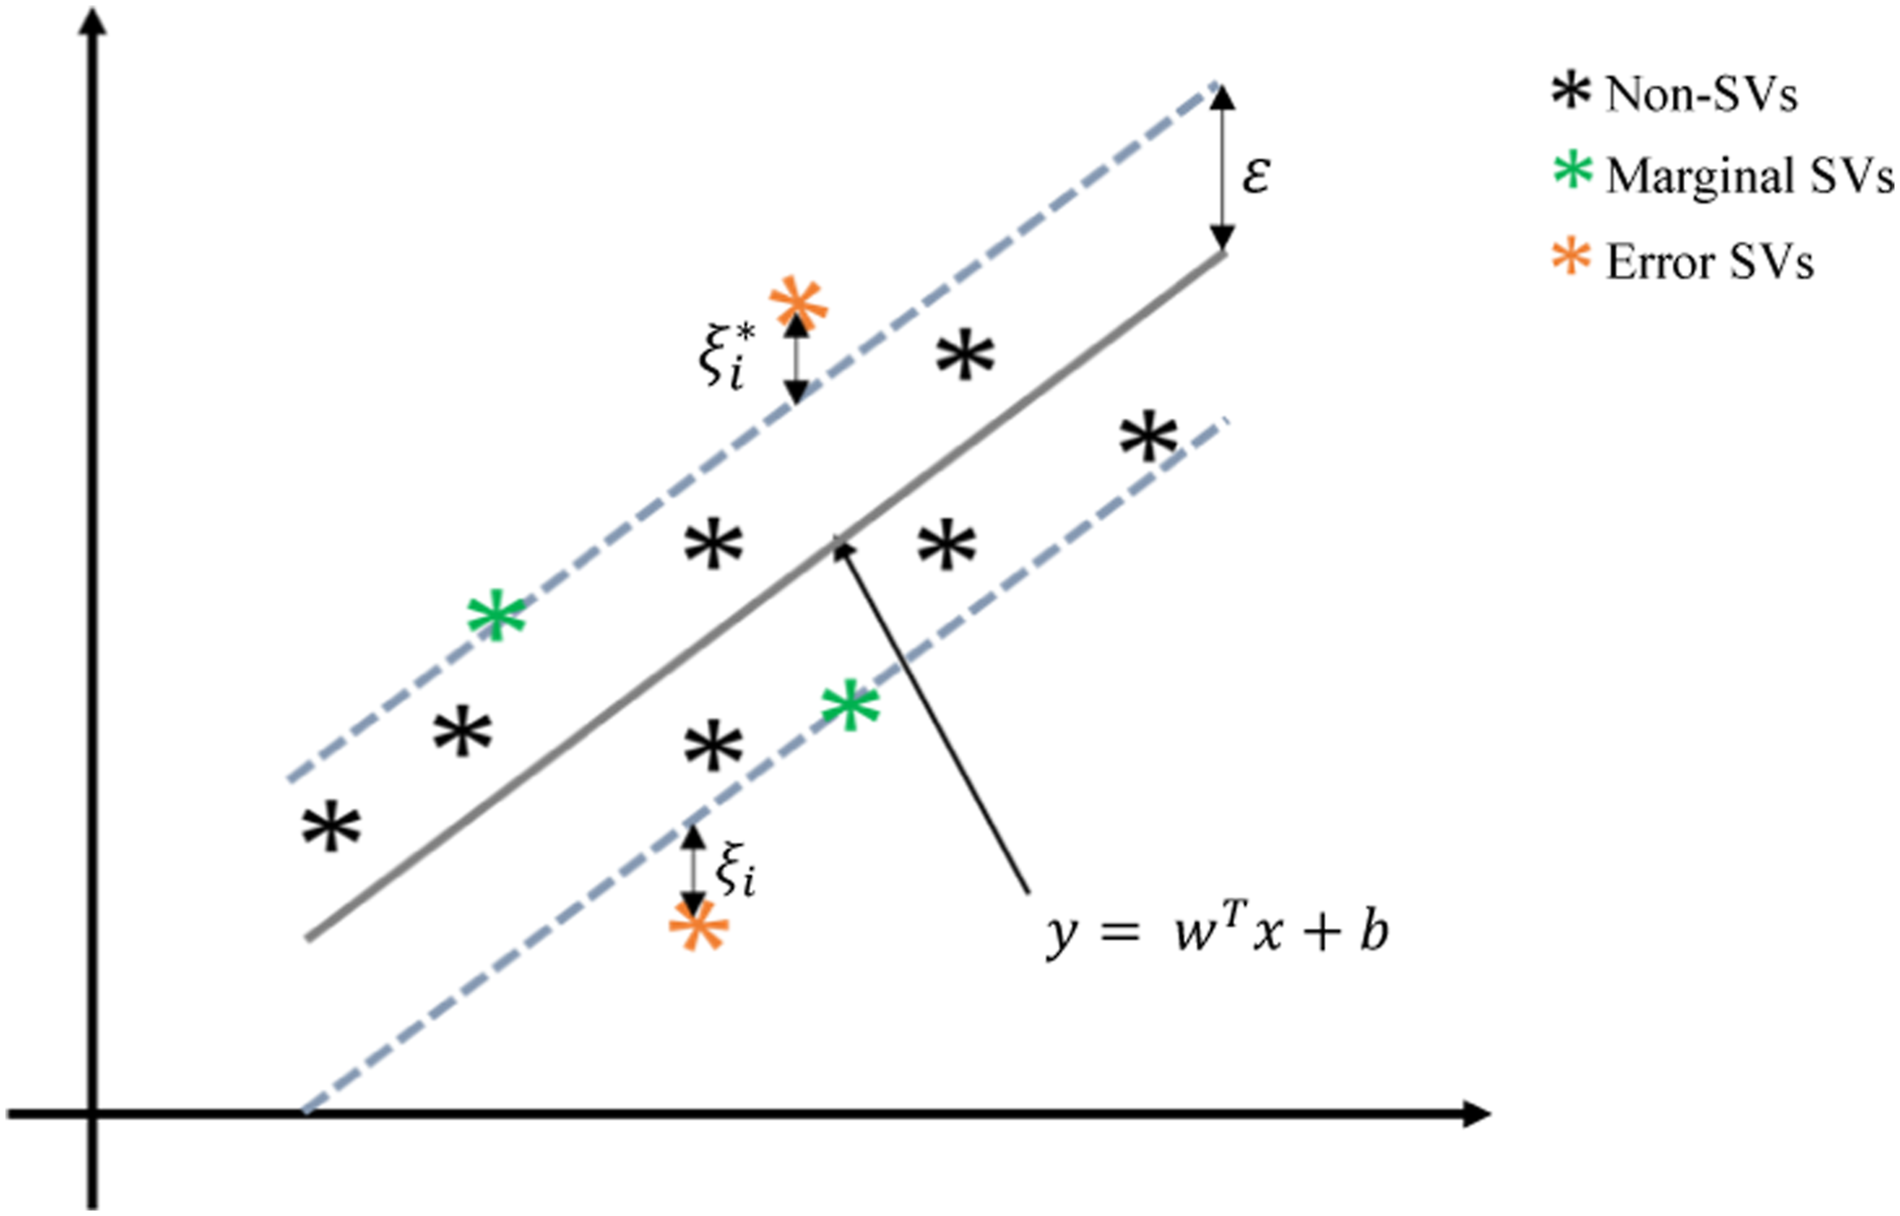
Support vector regressor adopts the principle of support vector machines. Given training data 
The objective of SVR is to minimise the L2 regularisation term L2 while satisfying the constraints Schematic of the support vector regressor.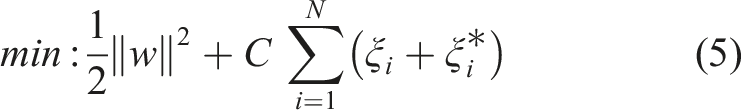
K-nearest neighbour regressor
The k-Nearest Neighbours (k-NN) regressor is a non-parametric algorithm that predicts continuous values of a target variable by computing the average or weighted average of the k-nearest neighbours in the dataset. It uses the Euclidean distance (or other matrices) to measure the distance between the data point that are to be predicted and all other data points in the training set. It then selects k data points that have the smallest distances to the target data point. Usually, the predicted value for the target data point is the weighted average of the target values of its k-nearest neighbours.
Data resampling and model training
To augment the dataset and enhance the robustness of the analysis, we implemented data resampling techniques, especially bootstrapping integrated with cross-validation. This approach enabled a thorough examination of the model’s performance and effective estimation of uncertainties. Bootstrapping is a statistical technique that involves the random selection of n samples from the original dataset, with replacement. This preserves the size of the original dataset irrespective of the possibility of duplicate instances being present. 33 By incorporating this technique, we ensured that the training process and the subsequent model evaluation were conducted on the representative set of data, thereby improving the reliability of the ML models.
Hyper-parameter tuning and model training
After selecting the regressor algorithms, hyperparameter tuning is necessary to determine the optimal set of hyperparameters for the respective ML algorithm to improve the model’s performance on unseen data. For each of the regressor algorithms, the parameters to be tuned are first identified. These could include the number of estimators, maximum depth of the tree and the number of features to consider when looking for the best fit. In this paper, the Grid Search Cross-Validation (CV) was adopted for hyper-parameter tuning. It creates grid of all possible hyper-parameter combinations with the dataset then partitioned into multiple subsets/folds (usually k = 5 folds), where k-1 folds are used to train the data with the left out used to evaluate the model. The folds are subsequently rotated to ensure that all folds are employed for both training and validation purposes. The performance of the model is then evaluated for each hyperparameter combination by averaging the performance metric across all folds. An illustration of the cross-validation process is presented in Figure 8.
Model evaluation
The effectiveness and accuracy of the models were evaluated using three metrics; the mean squared error (MSE), the mean absolute error (MAE), and the R-squared (R2). These metrics have proven to be reliable in assessing the performance of predictive models in regression analysis.34–36 MSE measures the average squared difference between the predicted and actual values of a model, while MAE measures the average absolute difference between the true and predicted values of a model. A lower value for both Mean MSE and MAE suggests better model performance. In practical terms, MSE and MAE values closer to 0 are desirable, since they suggest that the model’s predictions are very close to the actual values. Due to the squaring operation of MSE, it tends to be more influenced by large errors, making it more sensitive to outliers in the data. In contrast, MAE assigns equal weight to all errors, making it less sensitive to the impact of outliers. Accordingly, for the dataset being utilised in this study, in which the outliers are preserved to capture the underlying patterns, a better MSE value is expected than MAE. The coefficient of determination, R2, quantifies the percentage of variation of 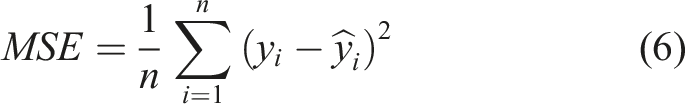
Results and discussions
Data analysis
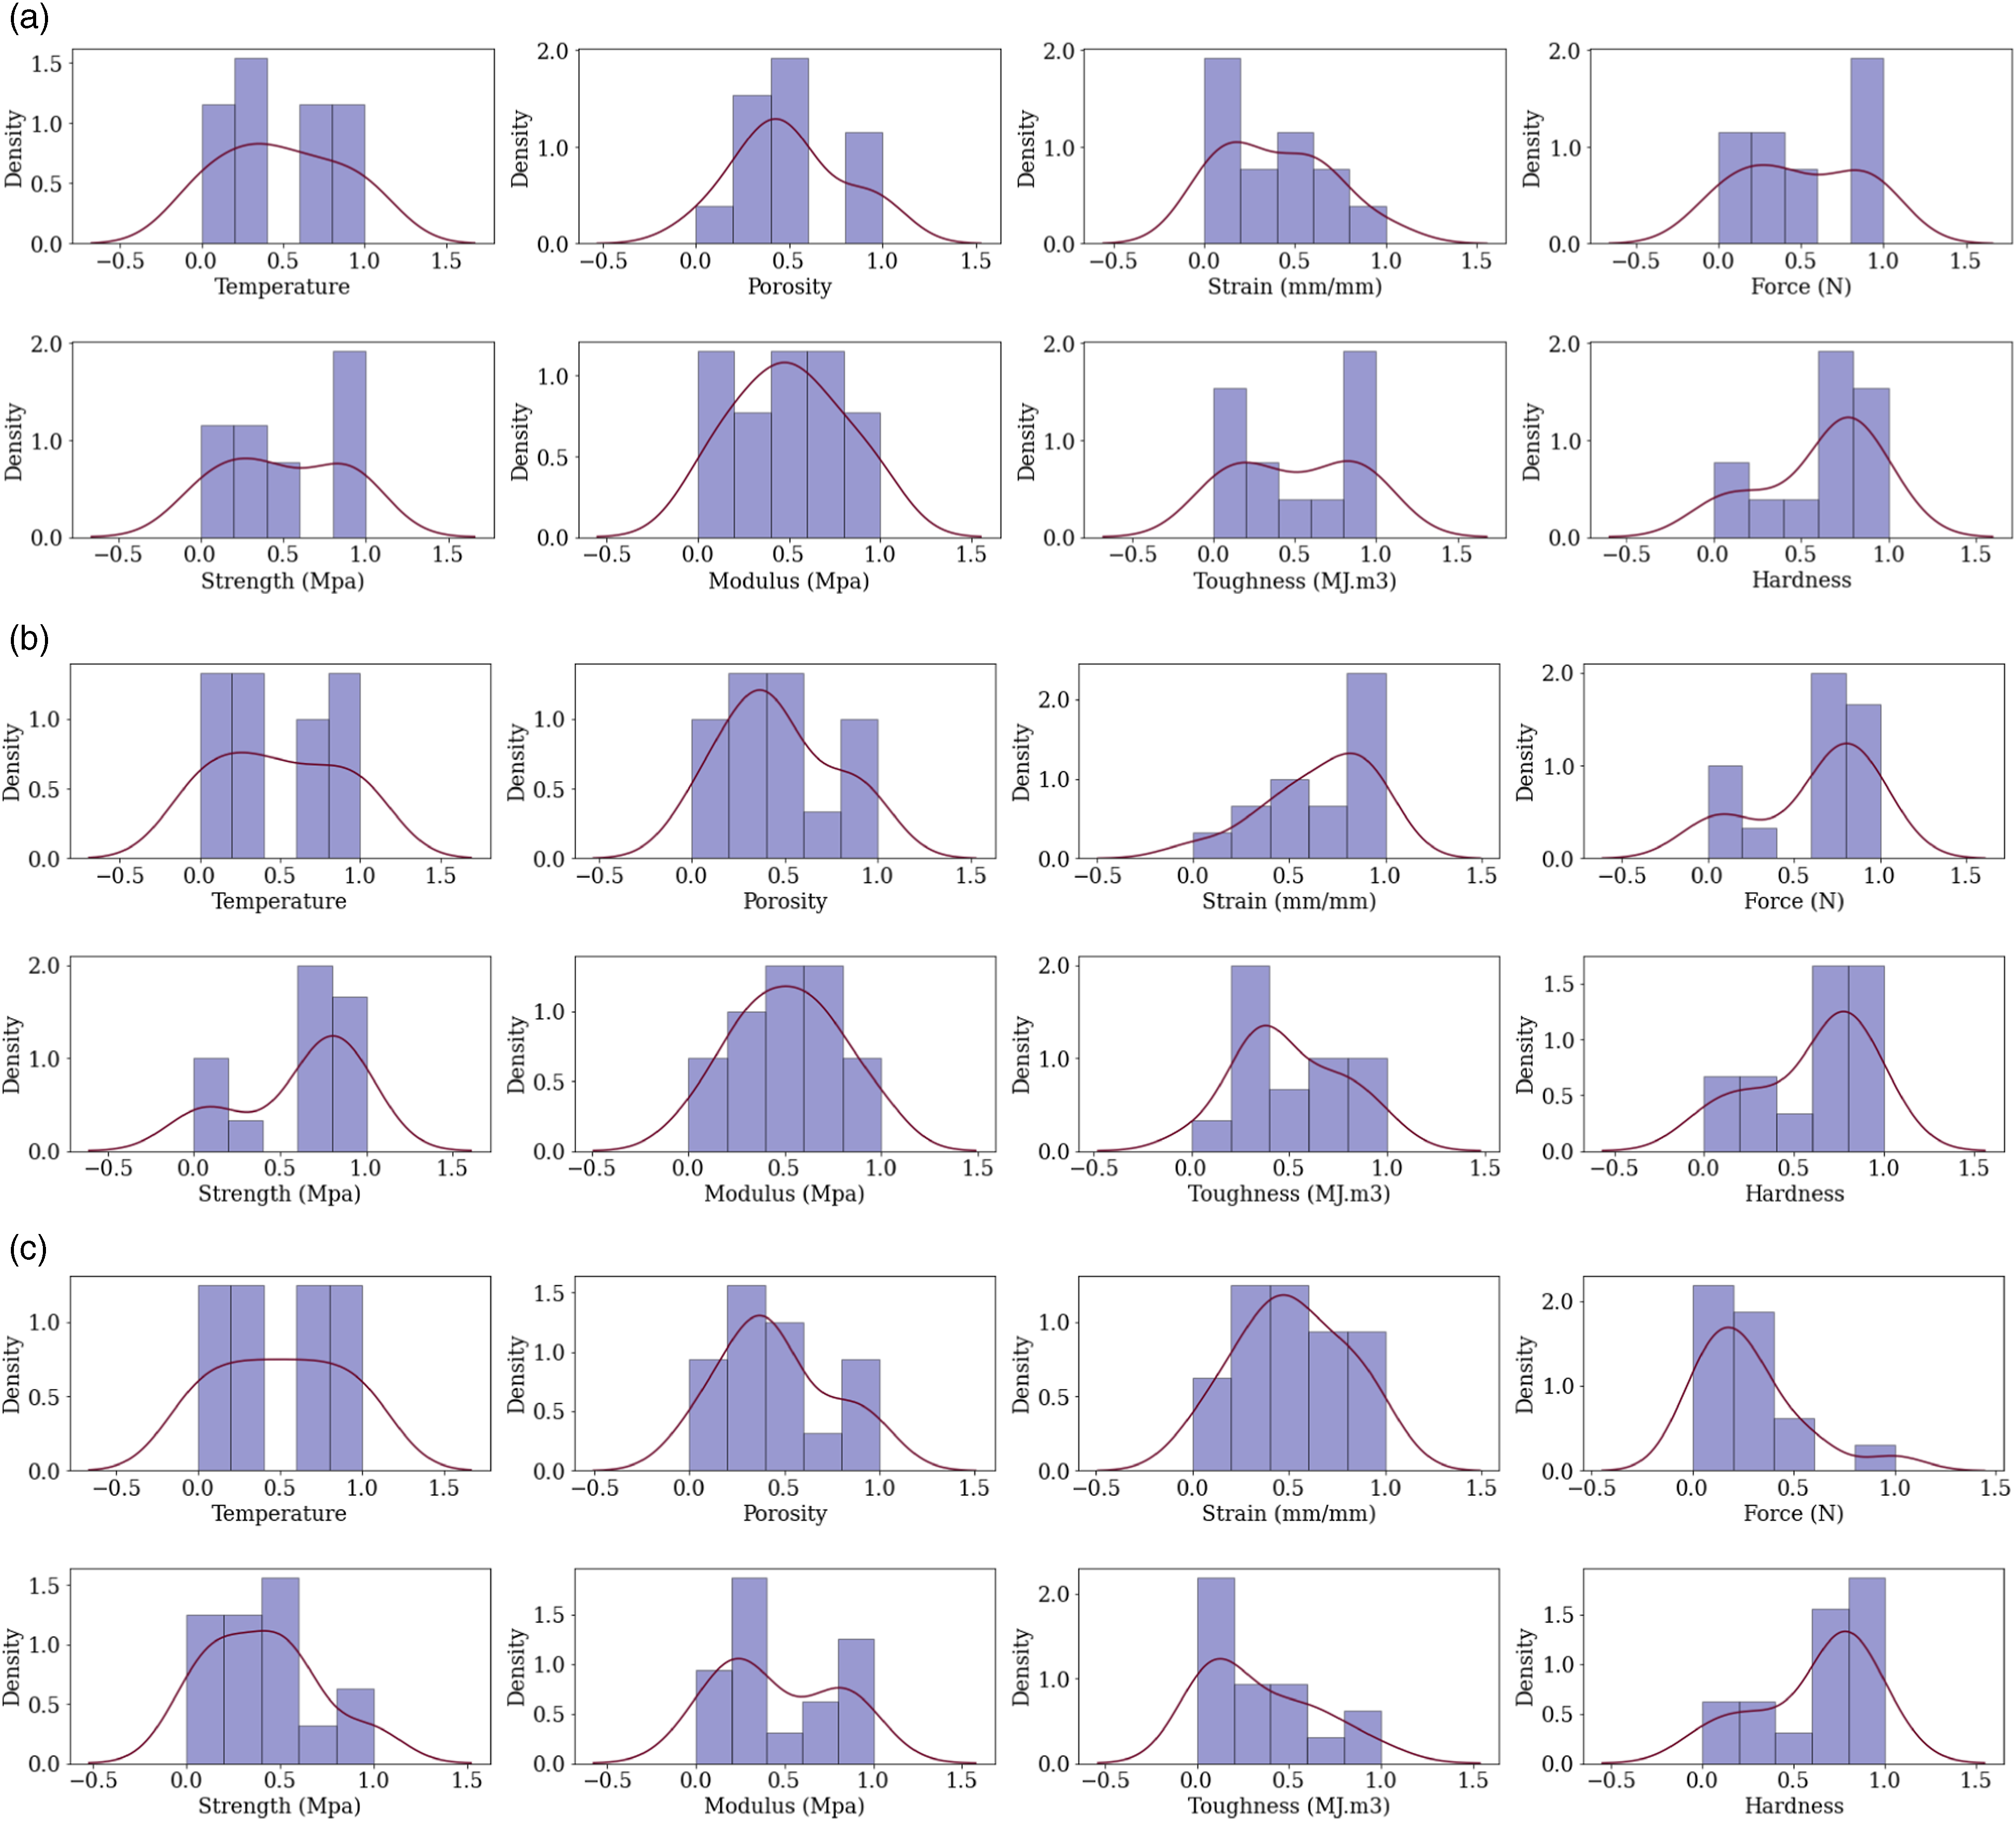
The histogram and kernel density for the CF-PA and CF-ABS material properties are given in Figures 6 and 7, respectively. Based on these results in Figure 7(a), the material properties for tensile strength do not exhibit any clear unimodal patterns, aside from hardness distribution which has a peak in the bin with a lower bound of 0.6 and an upper bound of 0.8, suggesting an unimodal pattern. For porosity, the highest density is in the bin with a lower bound of 0.2 and an upper bound of 0.4, indicating that the material is more likely to have porosity levels within this range. For Figure 8(b), porosity follows a clear unimodal pattern. Other material properties exhibit more complex distributions with multiple peaks, suggesting variability in the behaviour of the material across different ranges. In Figure 8(c), the distributions for temperature, strain, and porosity appear relatively uniform. The distributions for force, strength, modulus, toughness, and hardness are skewed towards specific ranges, which indicates that these materials could exhibit particular characteristics in those property ranges. The distribution for porosity is, however, slightly skewed towards higher porosity levels, with the highest density (0.5) evident in the bin with a lower bound of 0.8 and an upper bound of 1.0. The distribution is for strain is relatively uniform, with slightly higher density in the bins with lower and upper bounds of 0.4 – 0.6. Illustration of cross-validation process for one hyperparameter combination. Histogram and kde for CF-PA samples: (a) tensile (b) compression, and (c) flexural strength.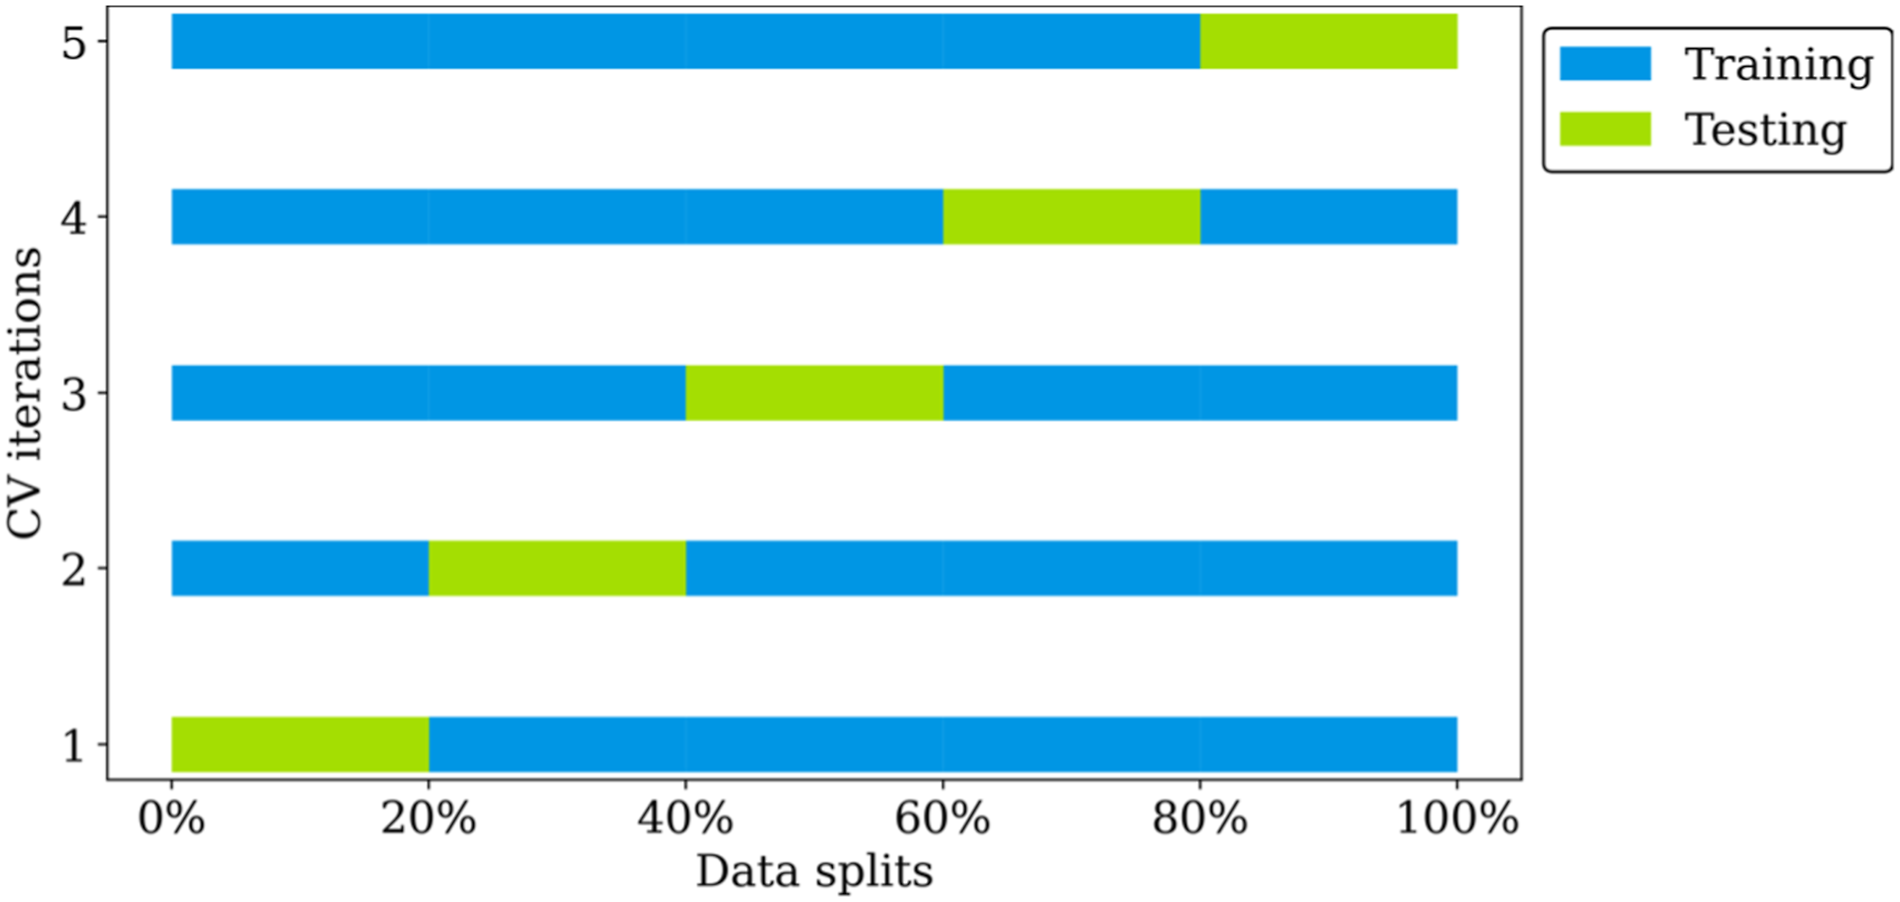
Set-up
The Python programming language, specifically libraries such as pandas, numpy, sklearn, and matplotlib served as primary tools in developing the ML framework in this study. These libraries facilitated various tasks including numerical computations, pre-processing steps, pipeline initialisation, and model development. For both CF-PA and CF-ABS material samples, the experimental data was loaded using the pandas data frame and normalisation was applied to scale each feature into a range of 0 to 1. Based on the PCC analysis, a general negative correlation was observed with the porosity volume (%) in relation to other features and thus selected as a predictor variable. Additionally, temperature, which exhibited a weak correlation across all material properties, was also chosen as a predictor variable. Accordingly, the temperature and porosity features were indexed as the predictors, while the corresponding hardness and strength (MPa) features were also indexed as the response variables. Next, the Lazy Predict algorithm was initialised to assess model performance on 35 ML regressors. For each material property prediction, the dataset was reshuffled based on the NumPy random state generator and the Lazy Prediction algorithm used for the preliminary model assessment. Thereafter, the Friedman statistics was adopted to assess the significant level of the 10 results computed by Lazy Predict. The results of the Lazy Predict model assessment led to the identification of nine top-performing regressors, based on a majority voting across the material properties to be predicted. A linear regression algorithm was also included as a benchmark algorithm to assess complex nonlinear patterns and interactions between the features.
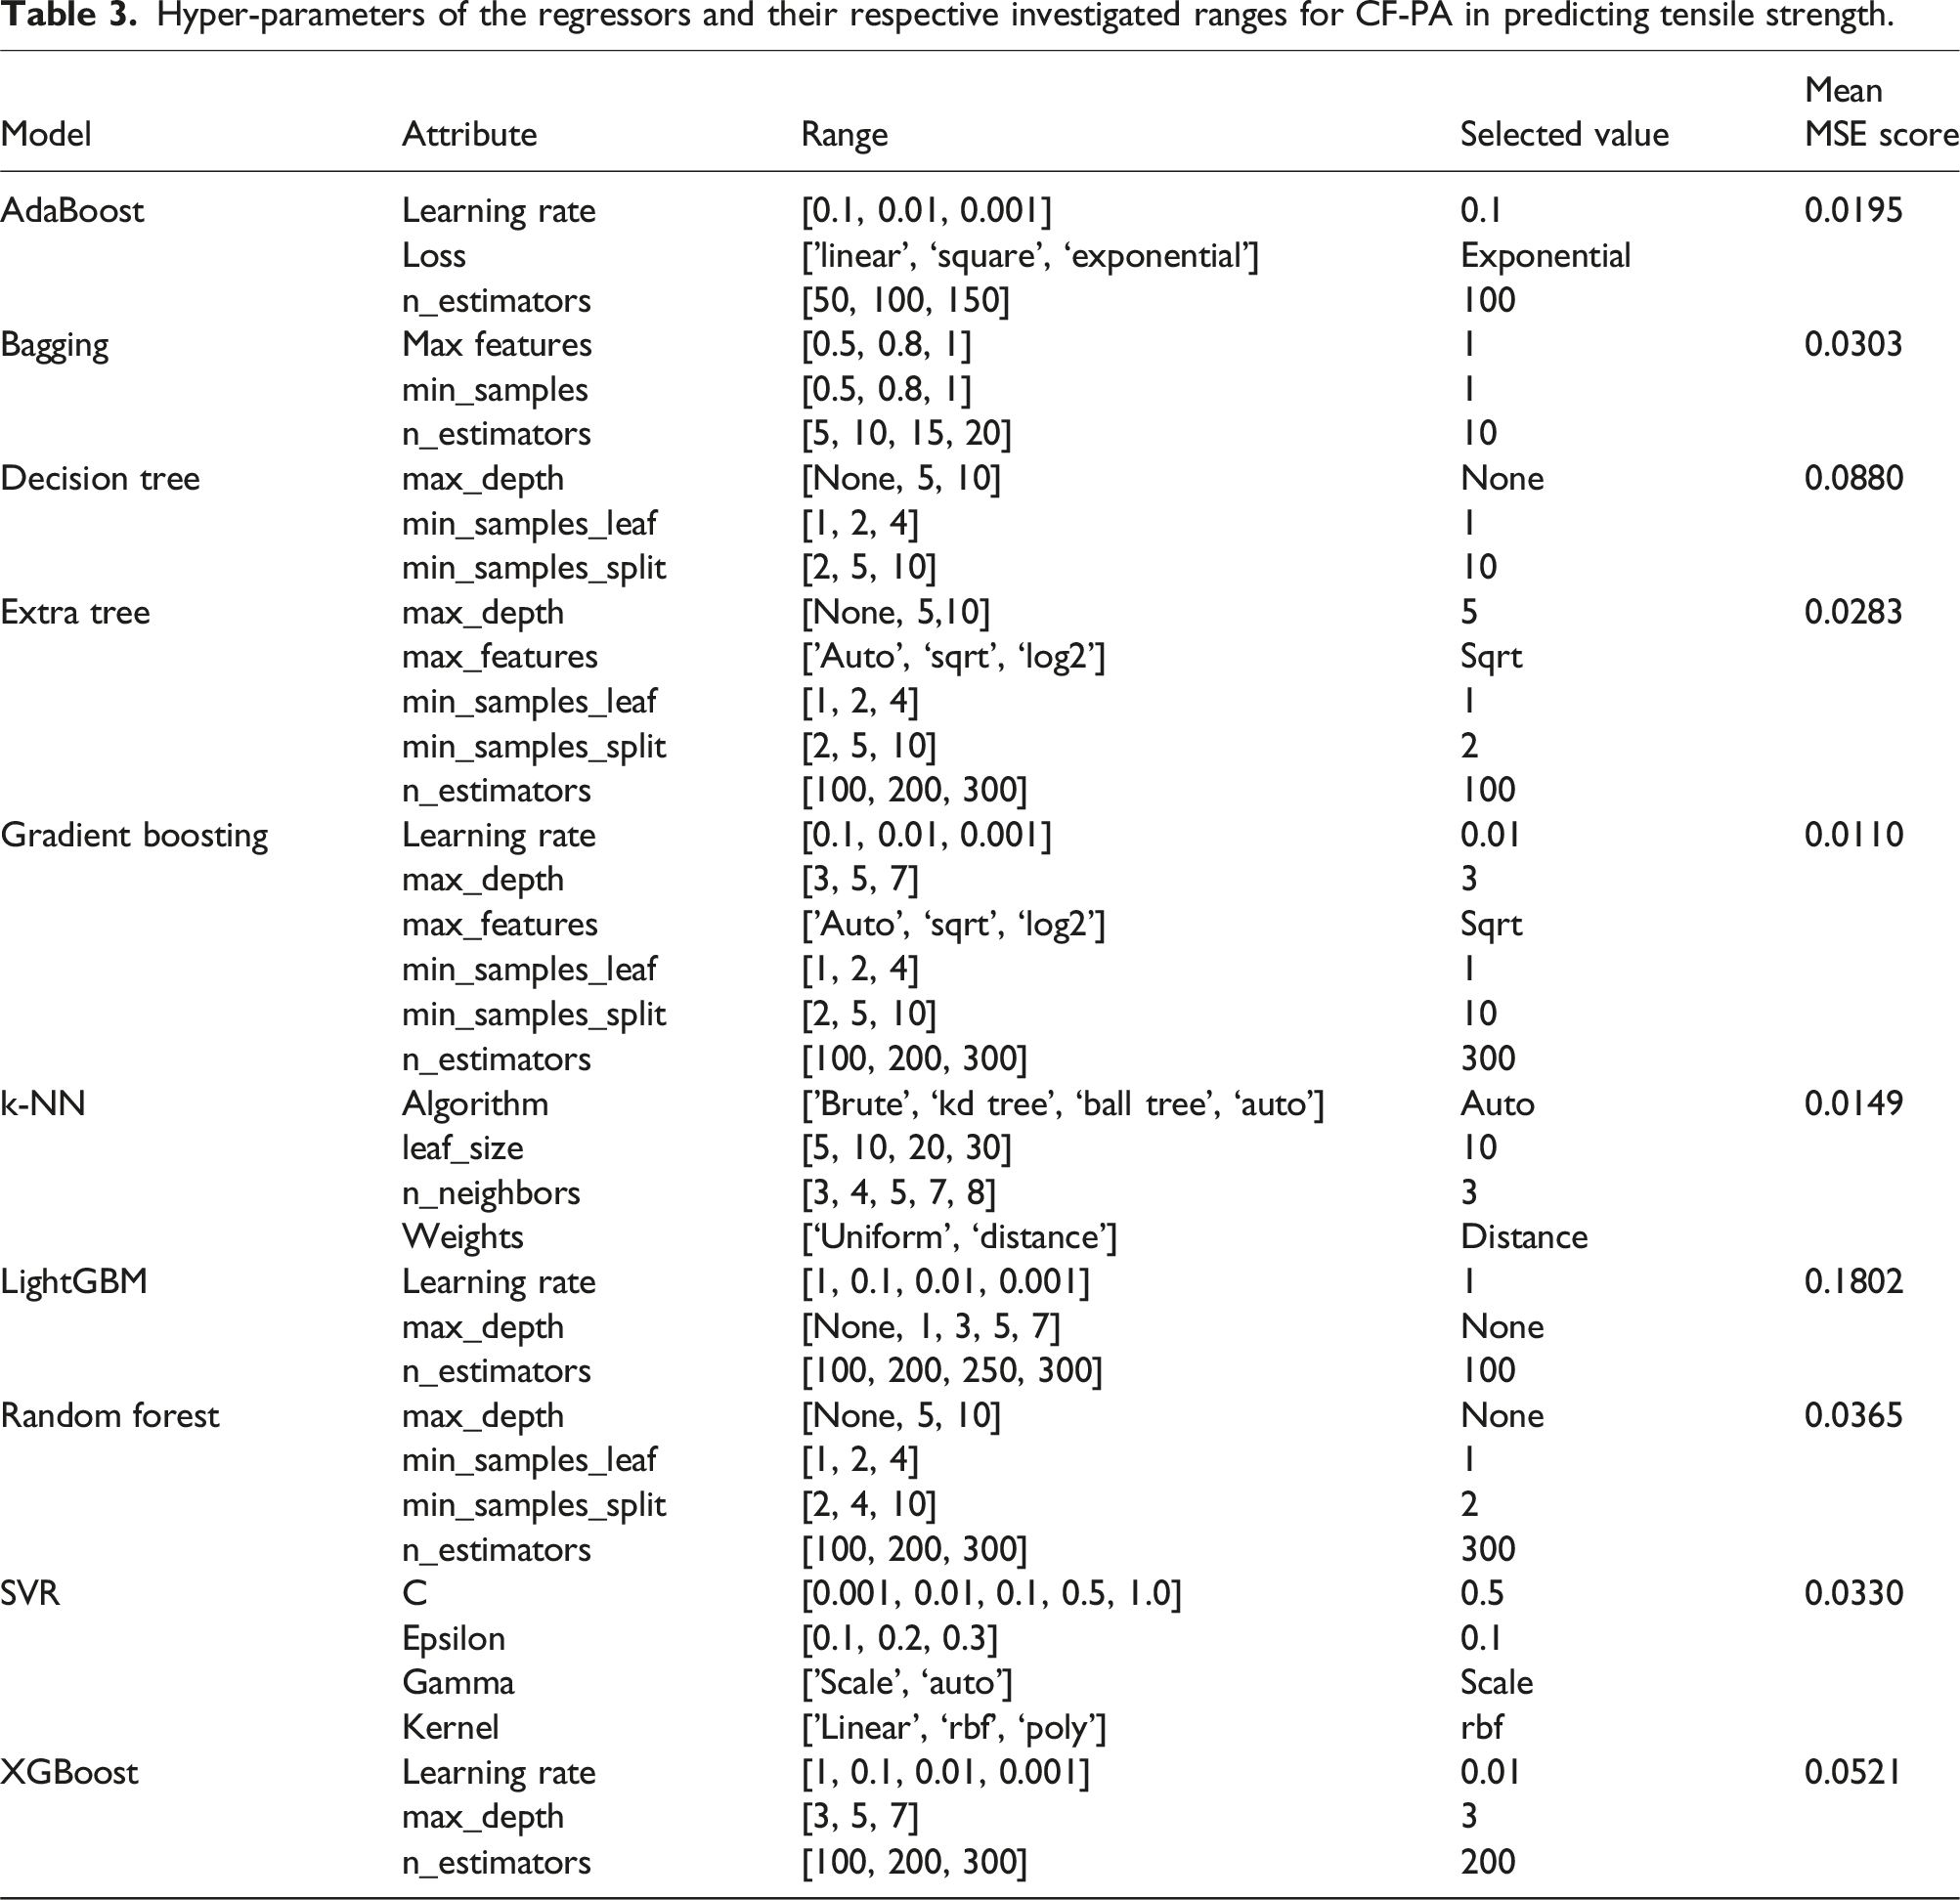
Accordingly, the 10 regressor algorithms adopted for developing the prediction models included seven ensemble tree learners (AdaBoost, bagging, decision tree, extra tree, gradient boosting, random forest, and XGBoost regressors), K-nearest neighbour (K-NN) regressor, support vector regressor (SVR), and linear regression. For regressor algorithms in which hyperparameters significantly influenced the model performance., grid search cross-validation was undertaken to determine the optimal hyperparameter values. Each dataset was randomly split into two parts (80% training and 20% testing). Grid search CV was thereafter used to determine the best hyperparameter combination that generalizes well on the regressor algorithm. It is noteworthy that Grid Search CV was undertaken using 80 % training data. The Grid Search was initialized using k = 5 CV folds with R2 set as the scoring parameter. Thereafter, data resampling and model training were conducted, with 20 bootstrap instances. Resampling was done with replacement to maintain the original dataset size. Subsequently, the trained models were evaluated using the MSE, MAE, and R2 values. The actual versus the predicted values were plotted, aiding in more intuitive understanding of the model’s accuracy.
Performance
PCC analysis
Figures 9 and 10 present the PCC for (a) tensile, (b) compression, and (c) flexural material properties of CF-PA and CF-ABS, respectively. For clarity, the features have been abbreviated as follows: temperature – Tc, porosity volume – P, force – F, strain – Sm, toughness – Tm, modulus – M, strength – Sp and, hardness – H. Based on the PCC analysis, a generally weak correlation exists between temperature other tensile and compression material properties of CF-ABS. This correlation pattern was similarly observed in compression material properties of CF-PA. Aside from the case of compression for CF-PA (Figure 9(a)), porosity generally exhibited a weak negative correlation with other features for all the samples tested (Figures 9(b) and (c), Figures 10(a–c)). The modulus feature also presented a negative correlation for the flexural material property for CF-ABS. Interestingly, a strong correlation was also observed between strain and toughness across all material properties, underscoring their interconnected roles in material performance.
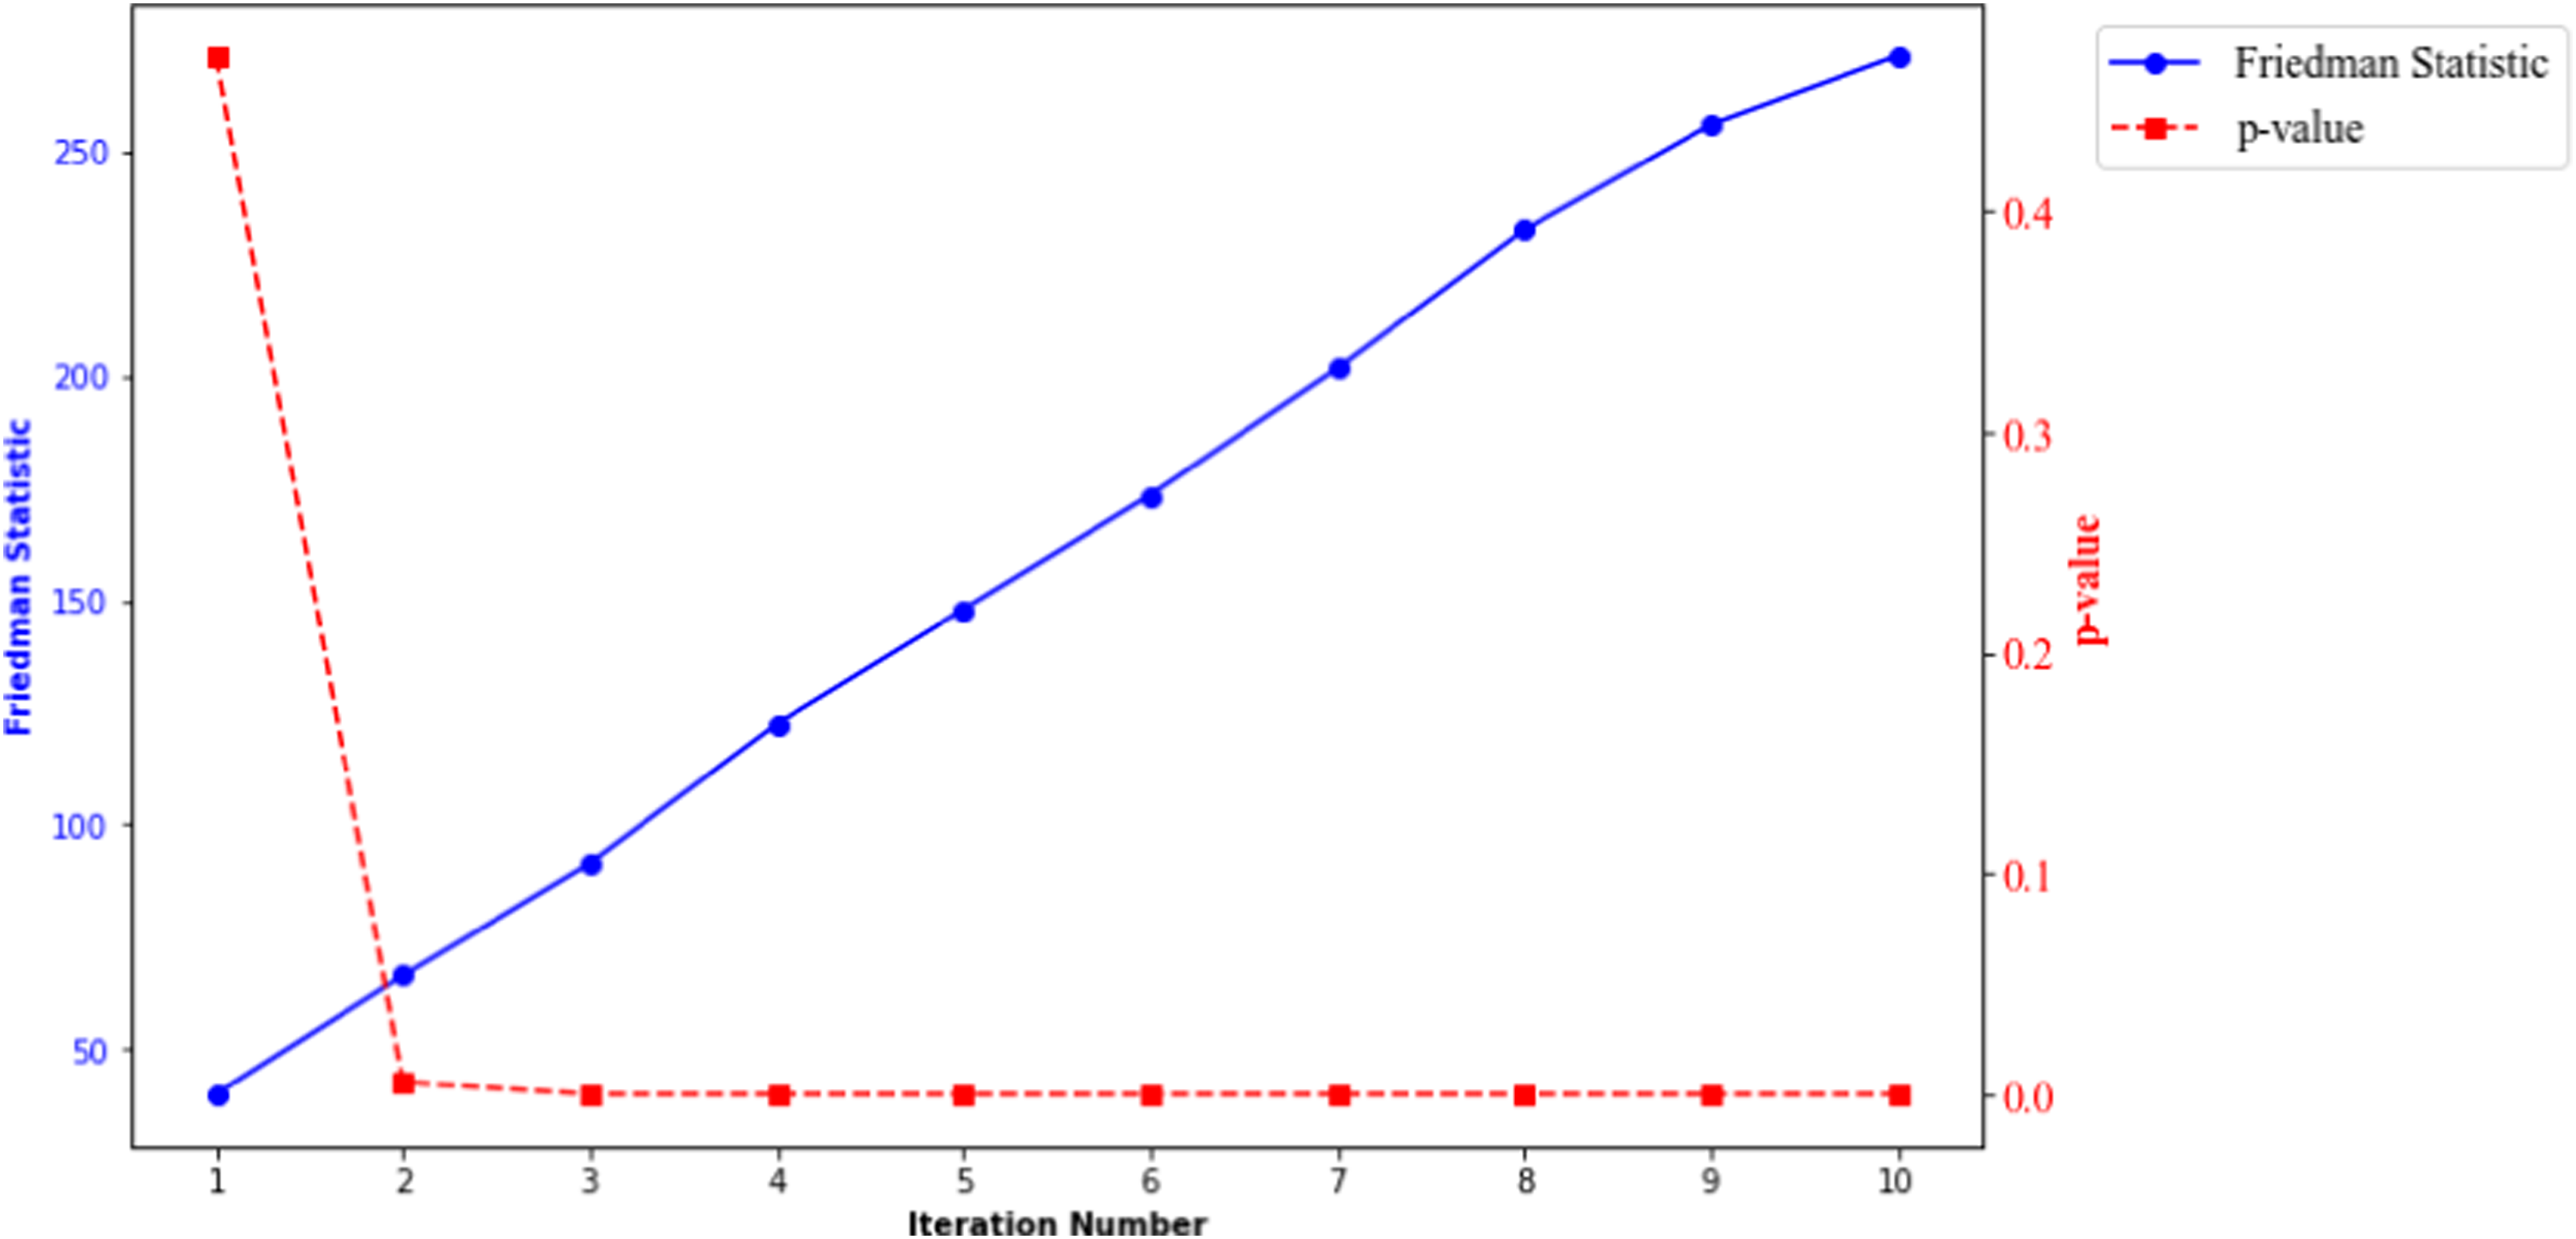
Friedman statistic results
For all the material properties prediction considered, a p-value >0.05 was realised after the second iteration, which suggested that the Lazy Predict algorithm and the majority voting system adopted in selecting the top performing model was not a result of chance. Figure 11 is a plot of the Friedman Statistic and p-value results for CF-PA, hardness prediction based on 10 iterations. The Friedman Statistic and p-value at the second iteration was 66.41 and 0.0054, respectively. Histogram and kde for CF-ABS samples: (a) tensile, (b) compression, and (c) flexural strength.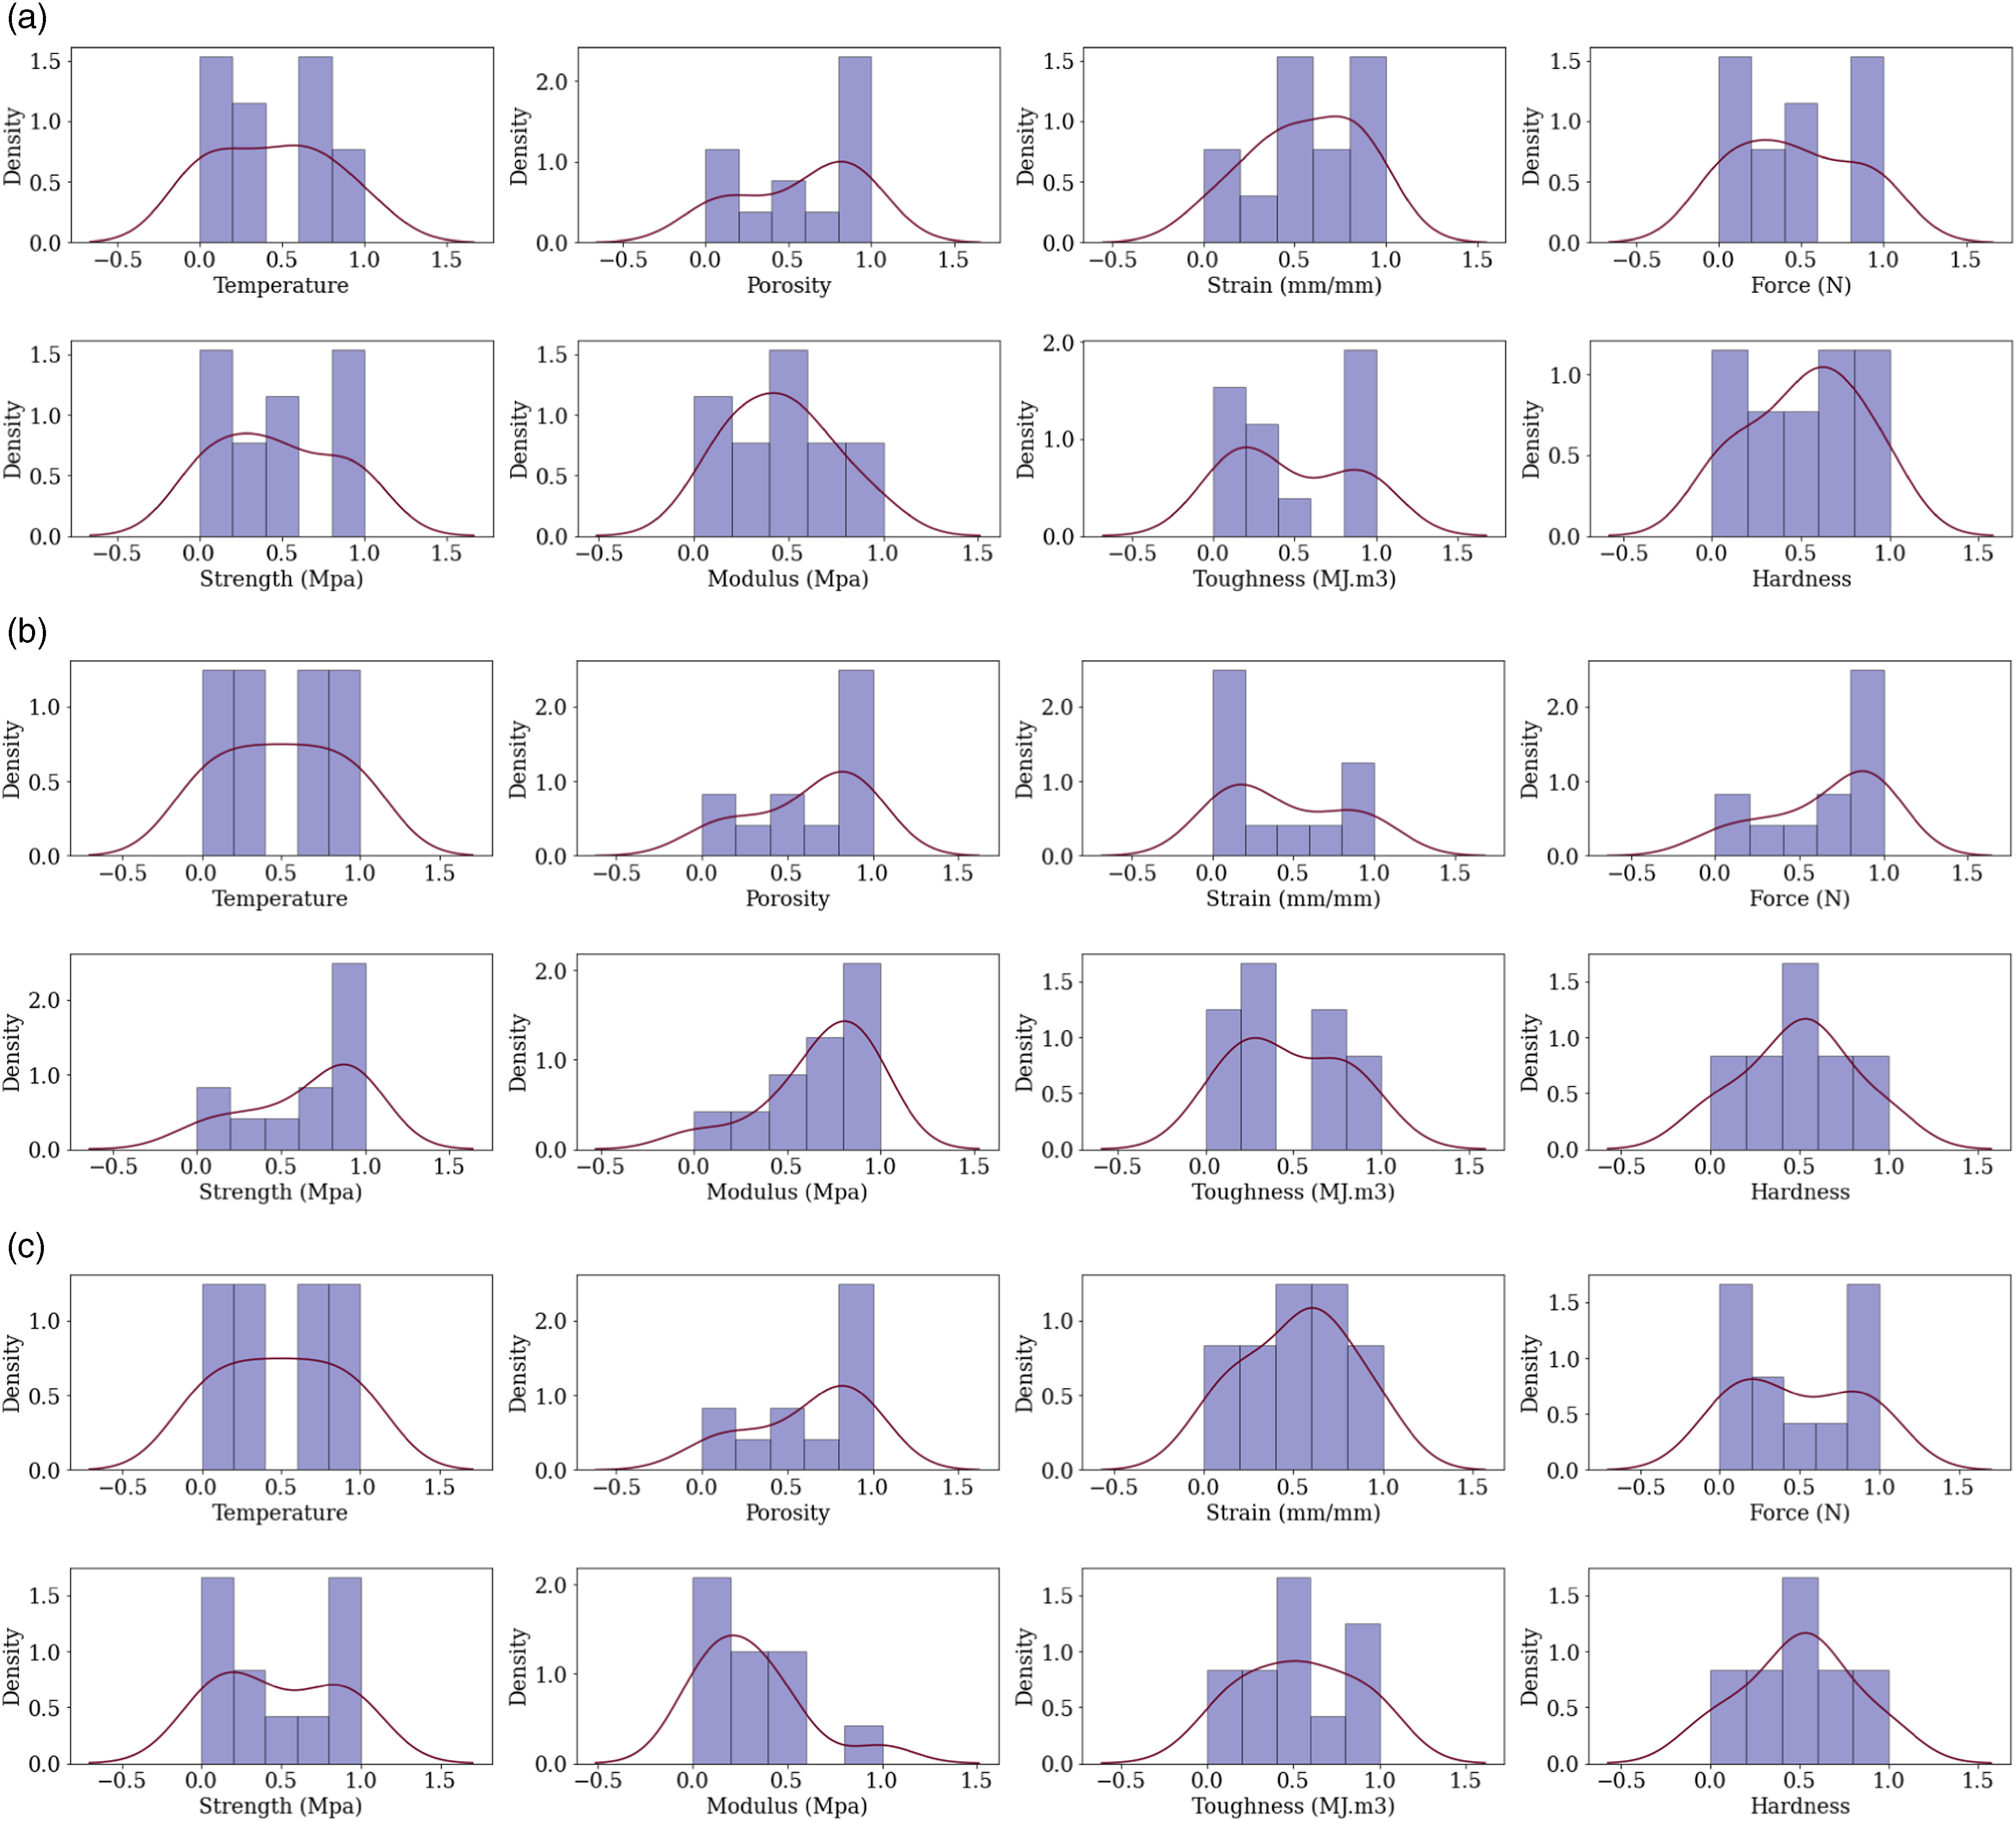
Hyper-parameter tuning results
Hyper-parameters of the regressors and their respective investigated ranges for CF-PA in predicting tensile strength.
Following this, the model underwent training using the training data, and predictions were generated for both the training and testing datasets. Subsequently, the R2, MSE, and MAE values were calculated, accompanied by plots depicting the actual and predicted values for each respective model.
Evaluation results
Model evaluation results for hardness material property prediction.
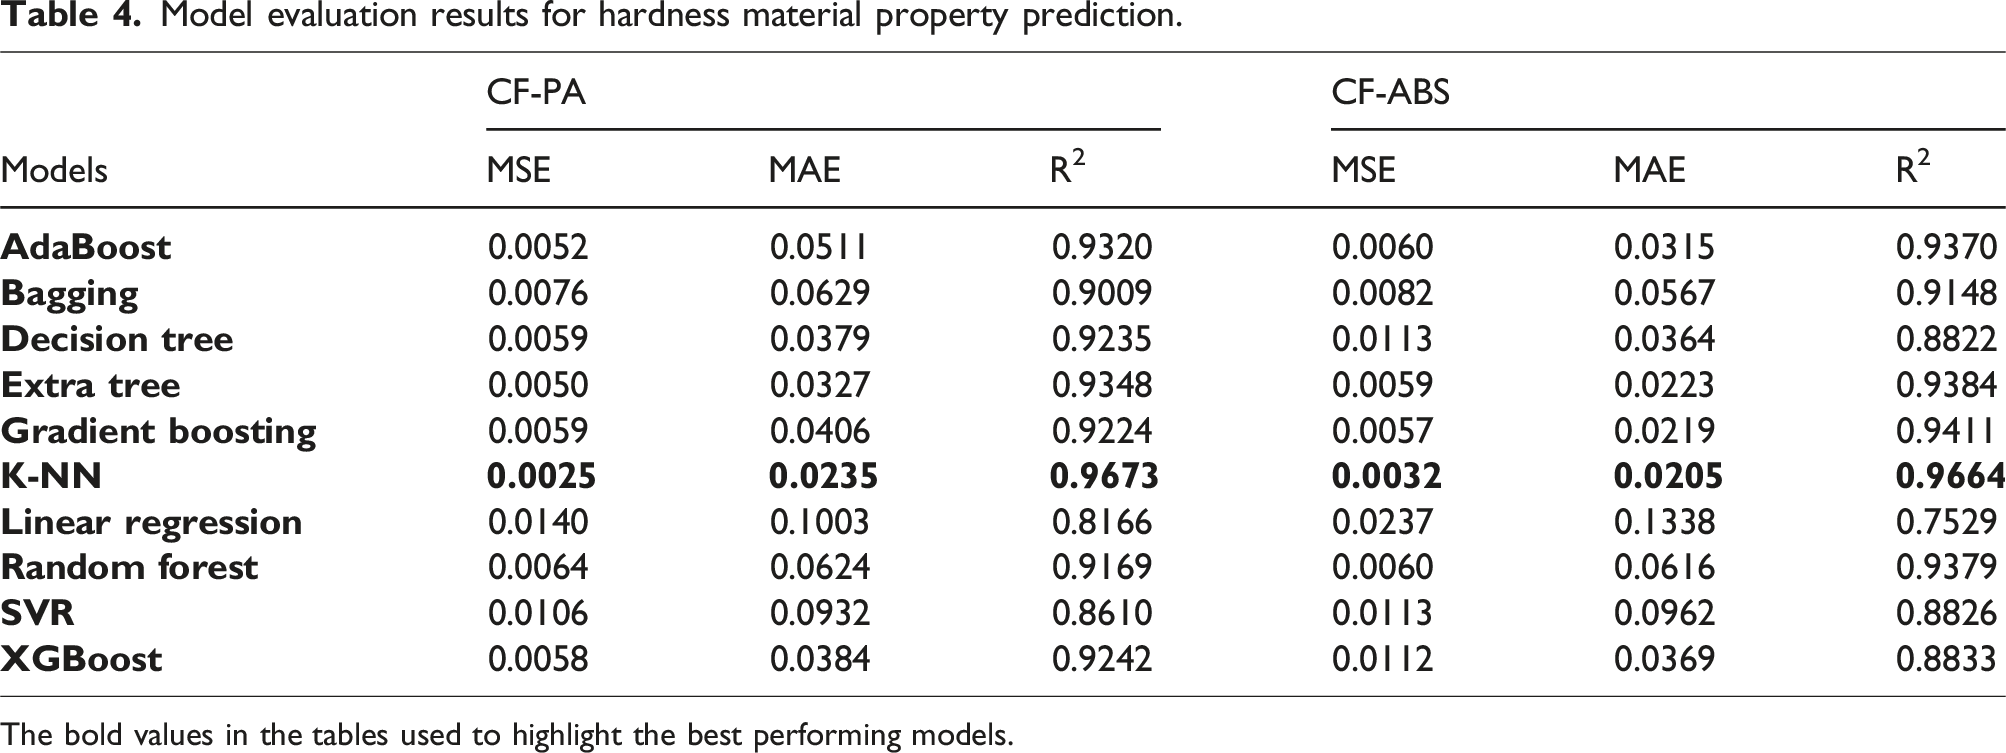
The bold values in the tables used to highlight the best performing models.
Model evaluation results for tensile strength material property prediction.
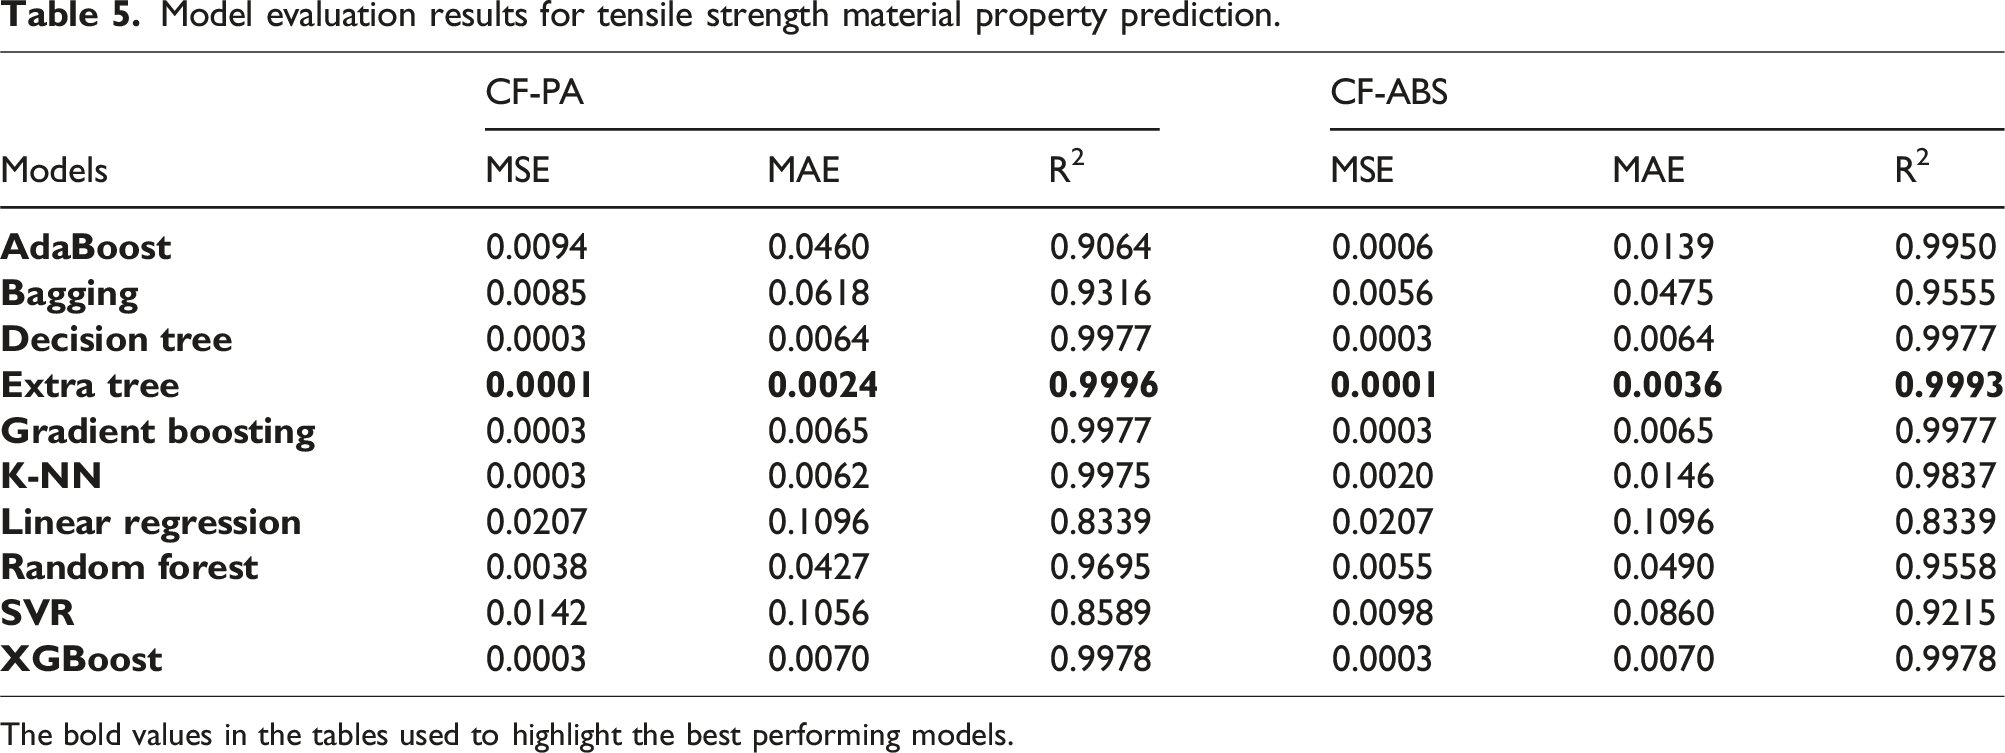
The bold values in the tables used to highlight the best performing models.
Model evaluation results for compressive strength material property prediction.
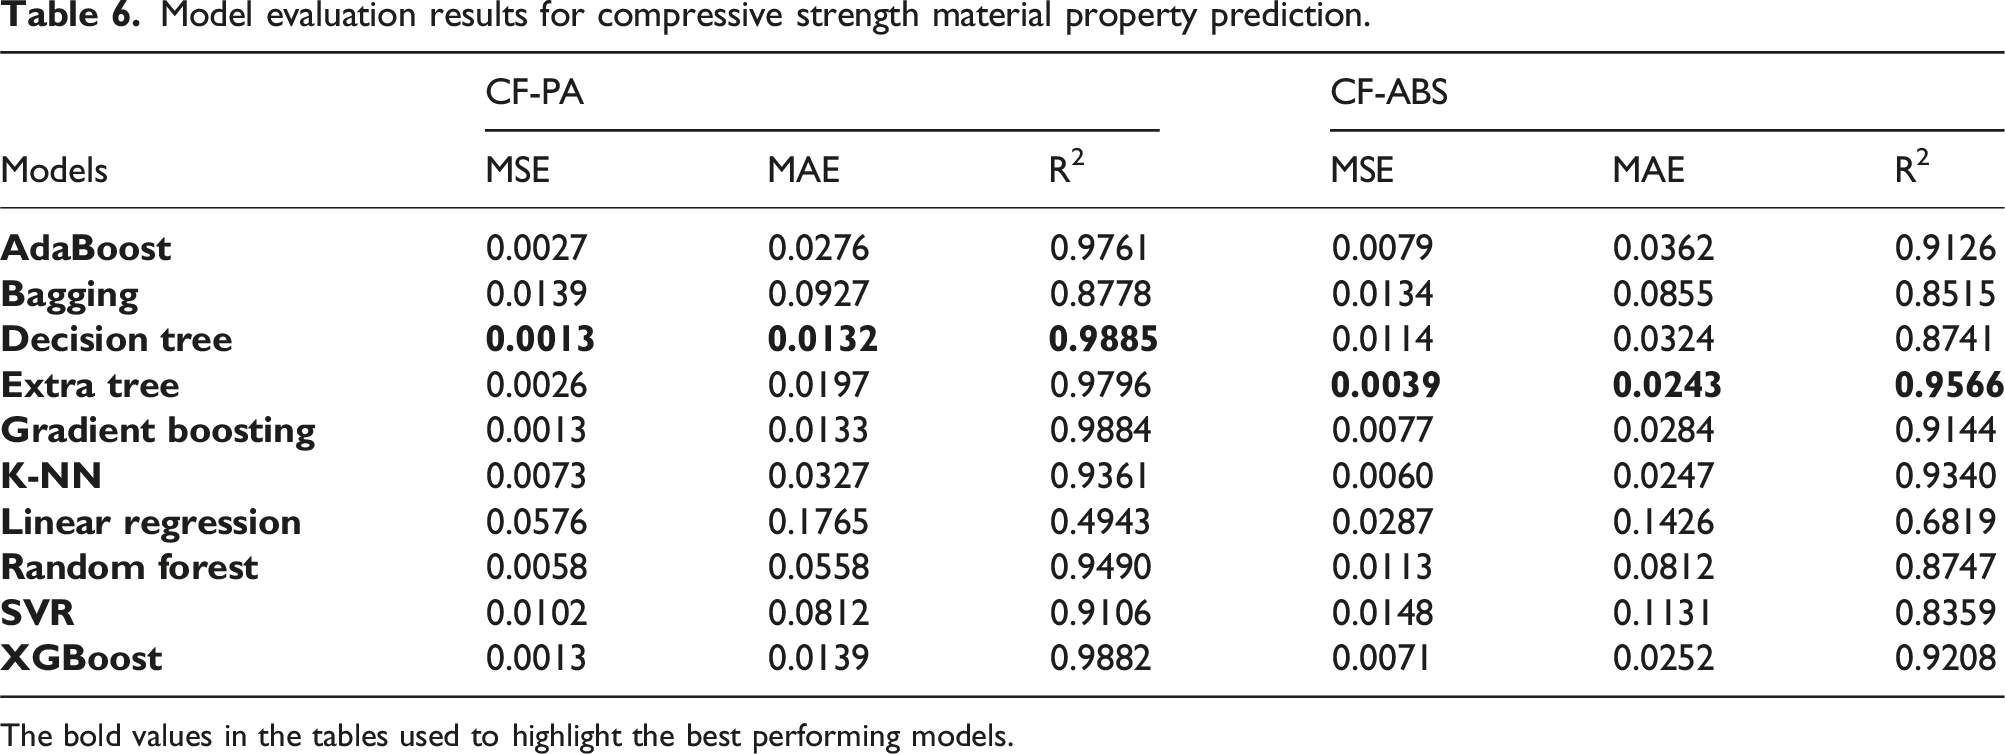
The bold values in the tables used to highlight the best performing models.
Model evaluation results for flexural strength material property prediction.
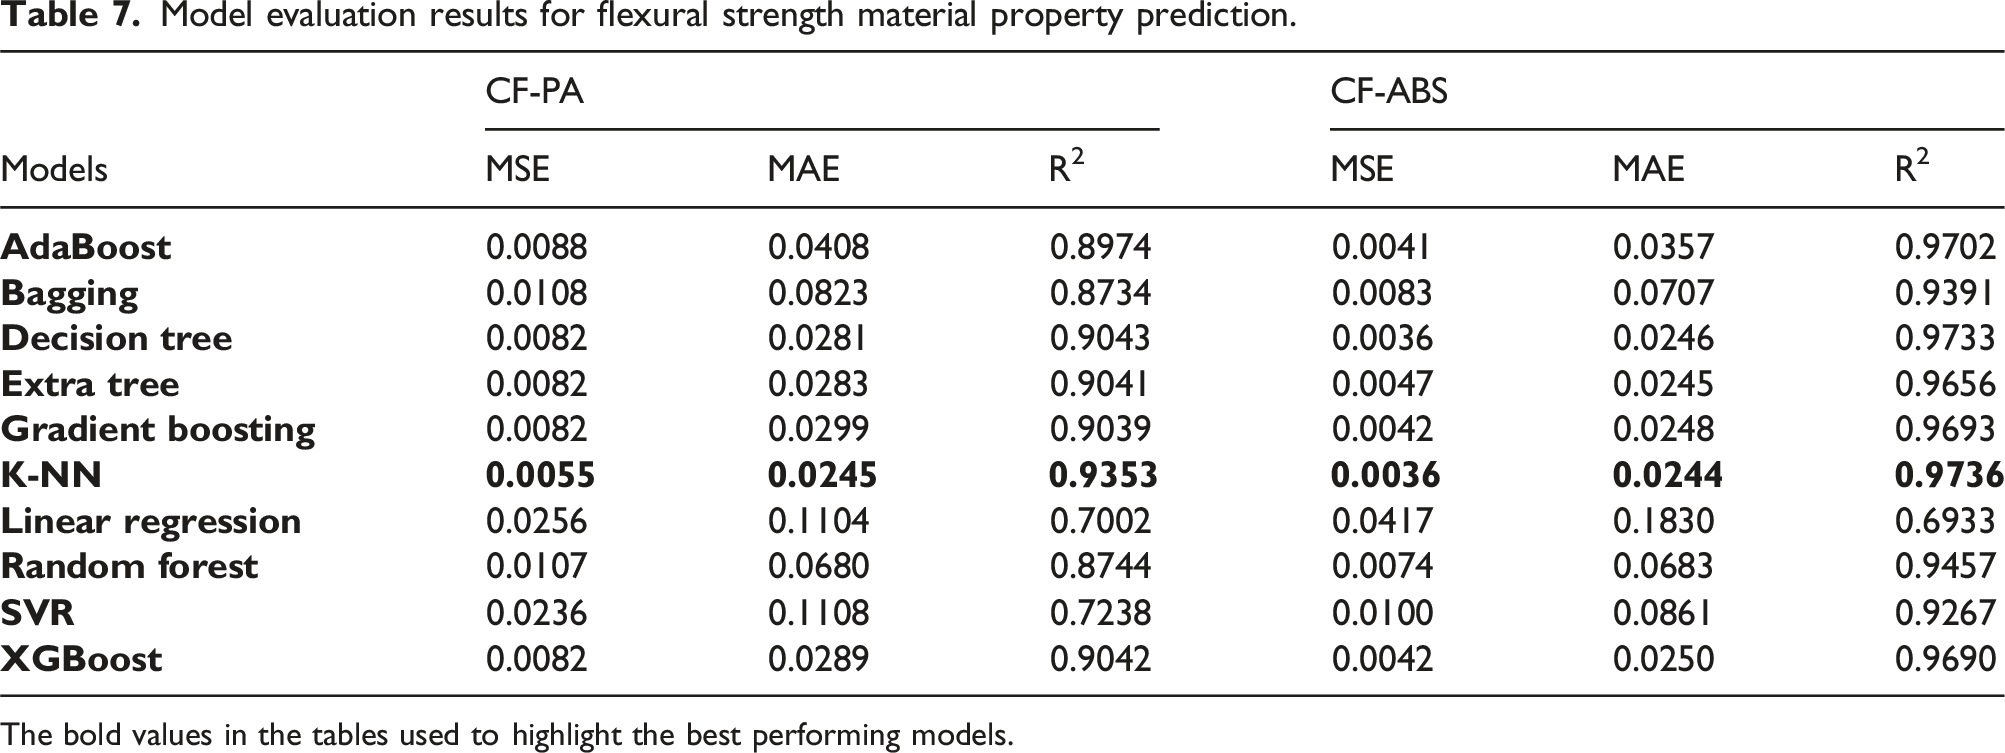
The bold values in the tables used to highlight the best performing models.
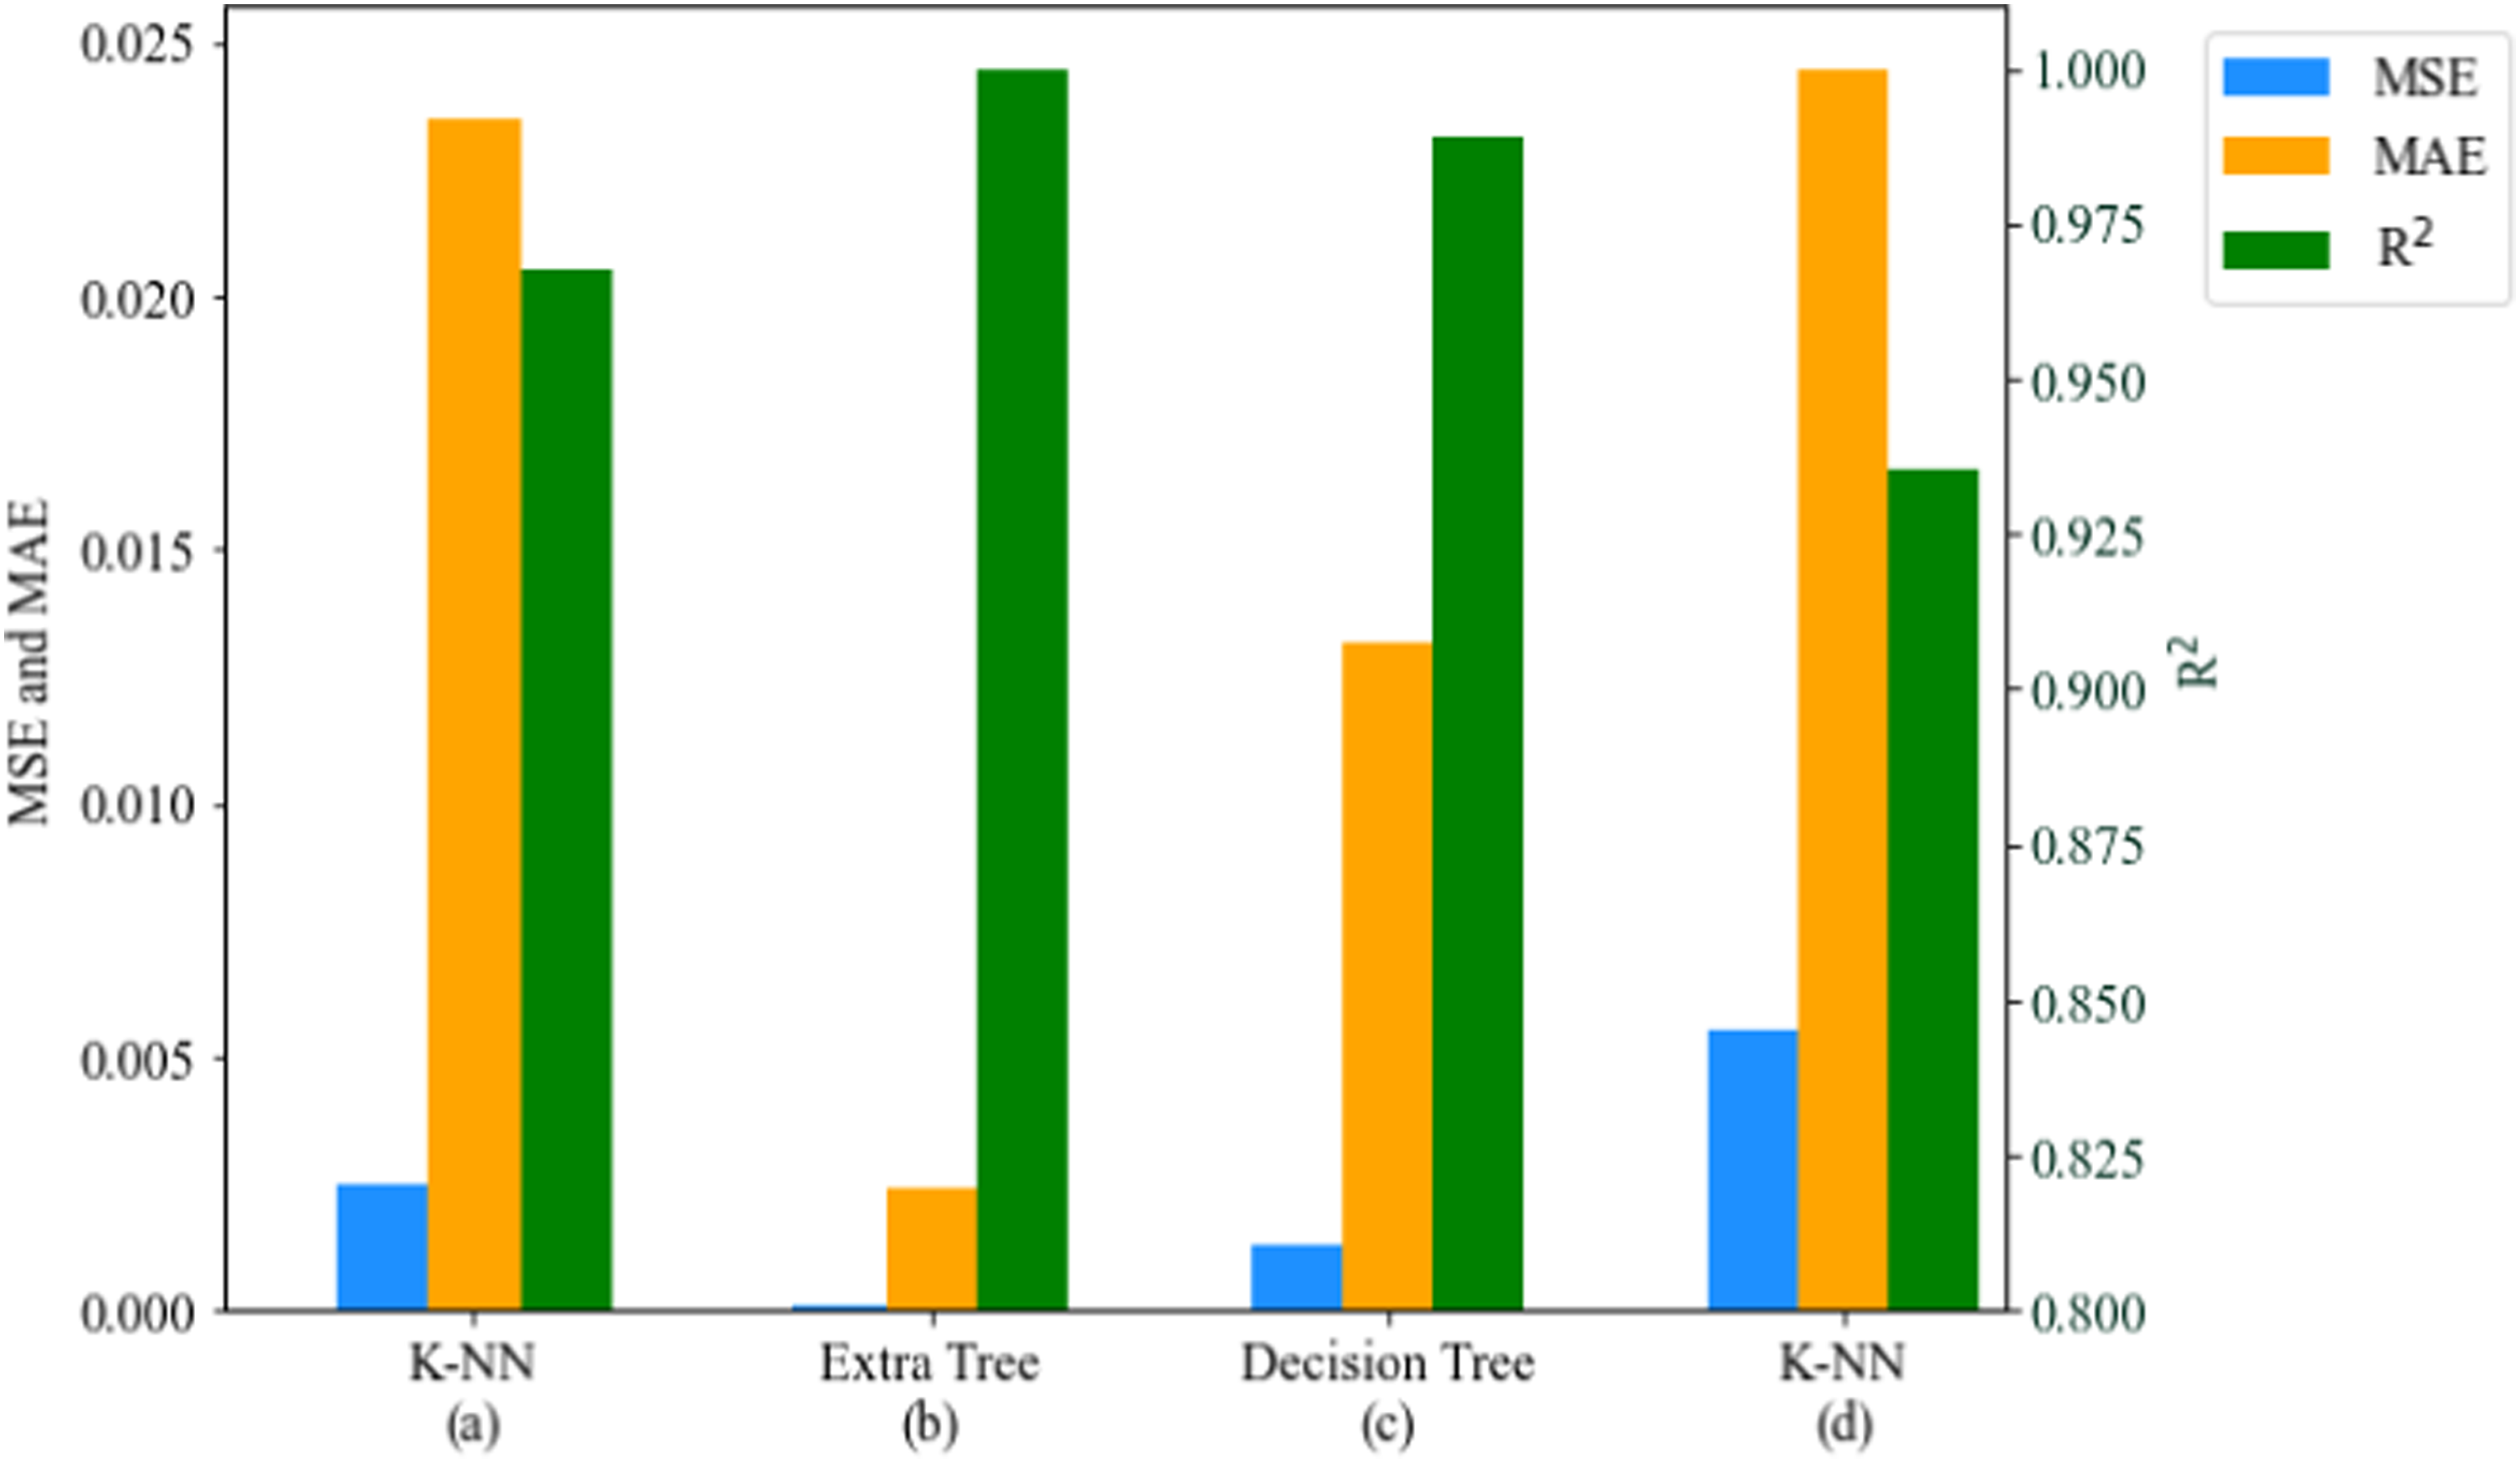
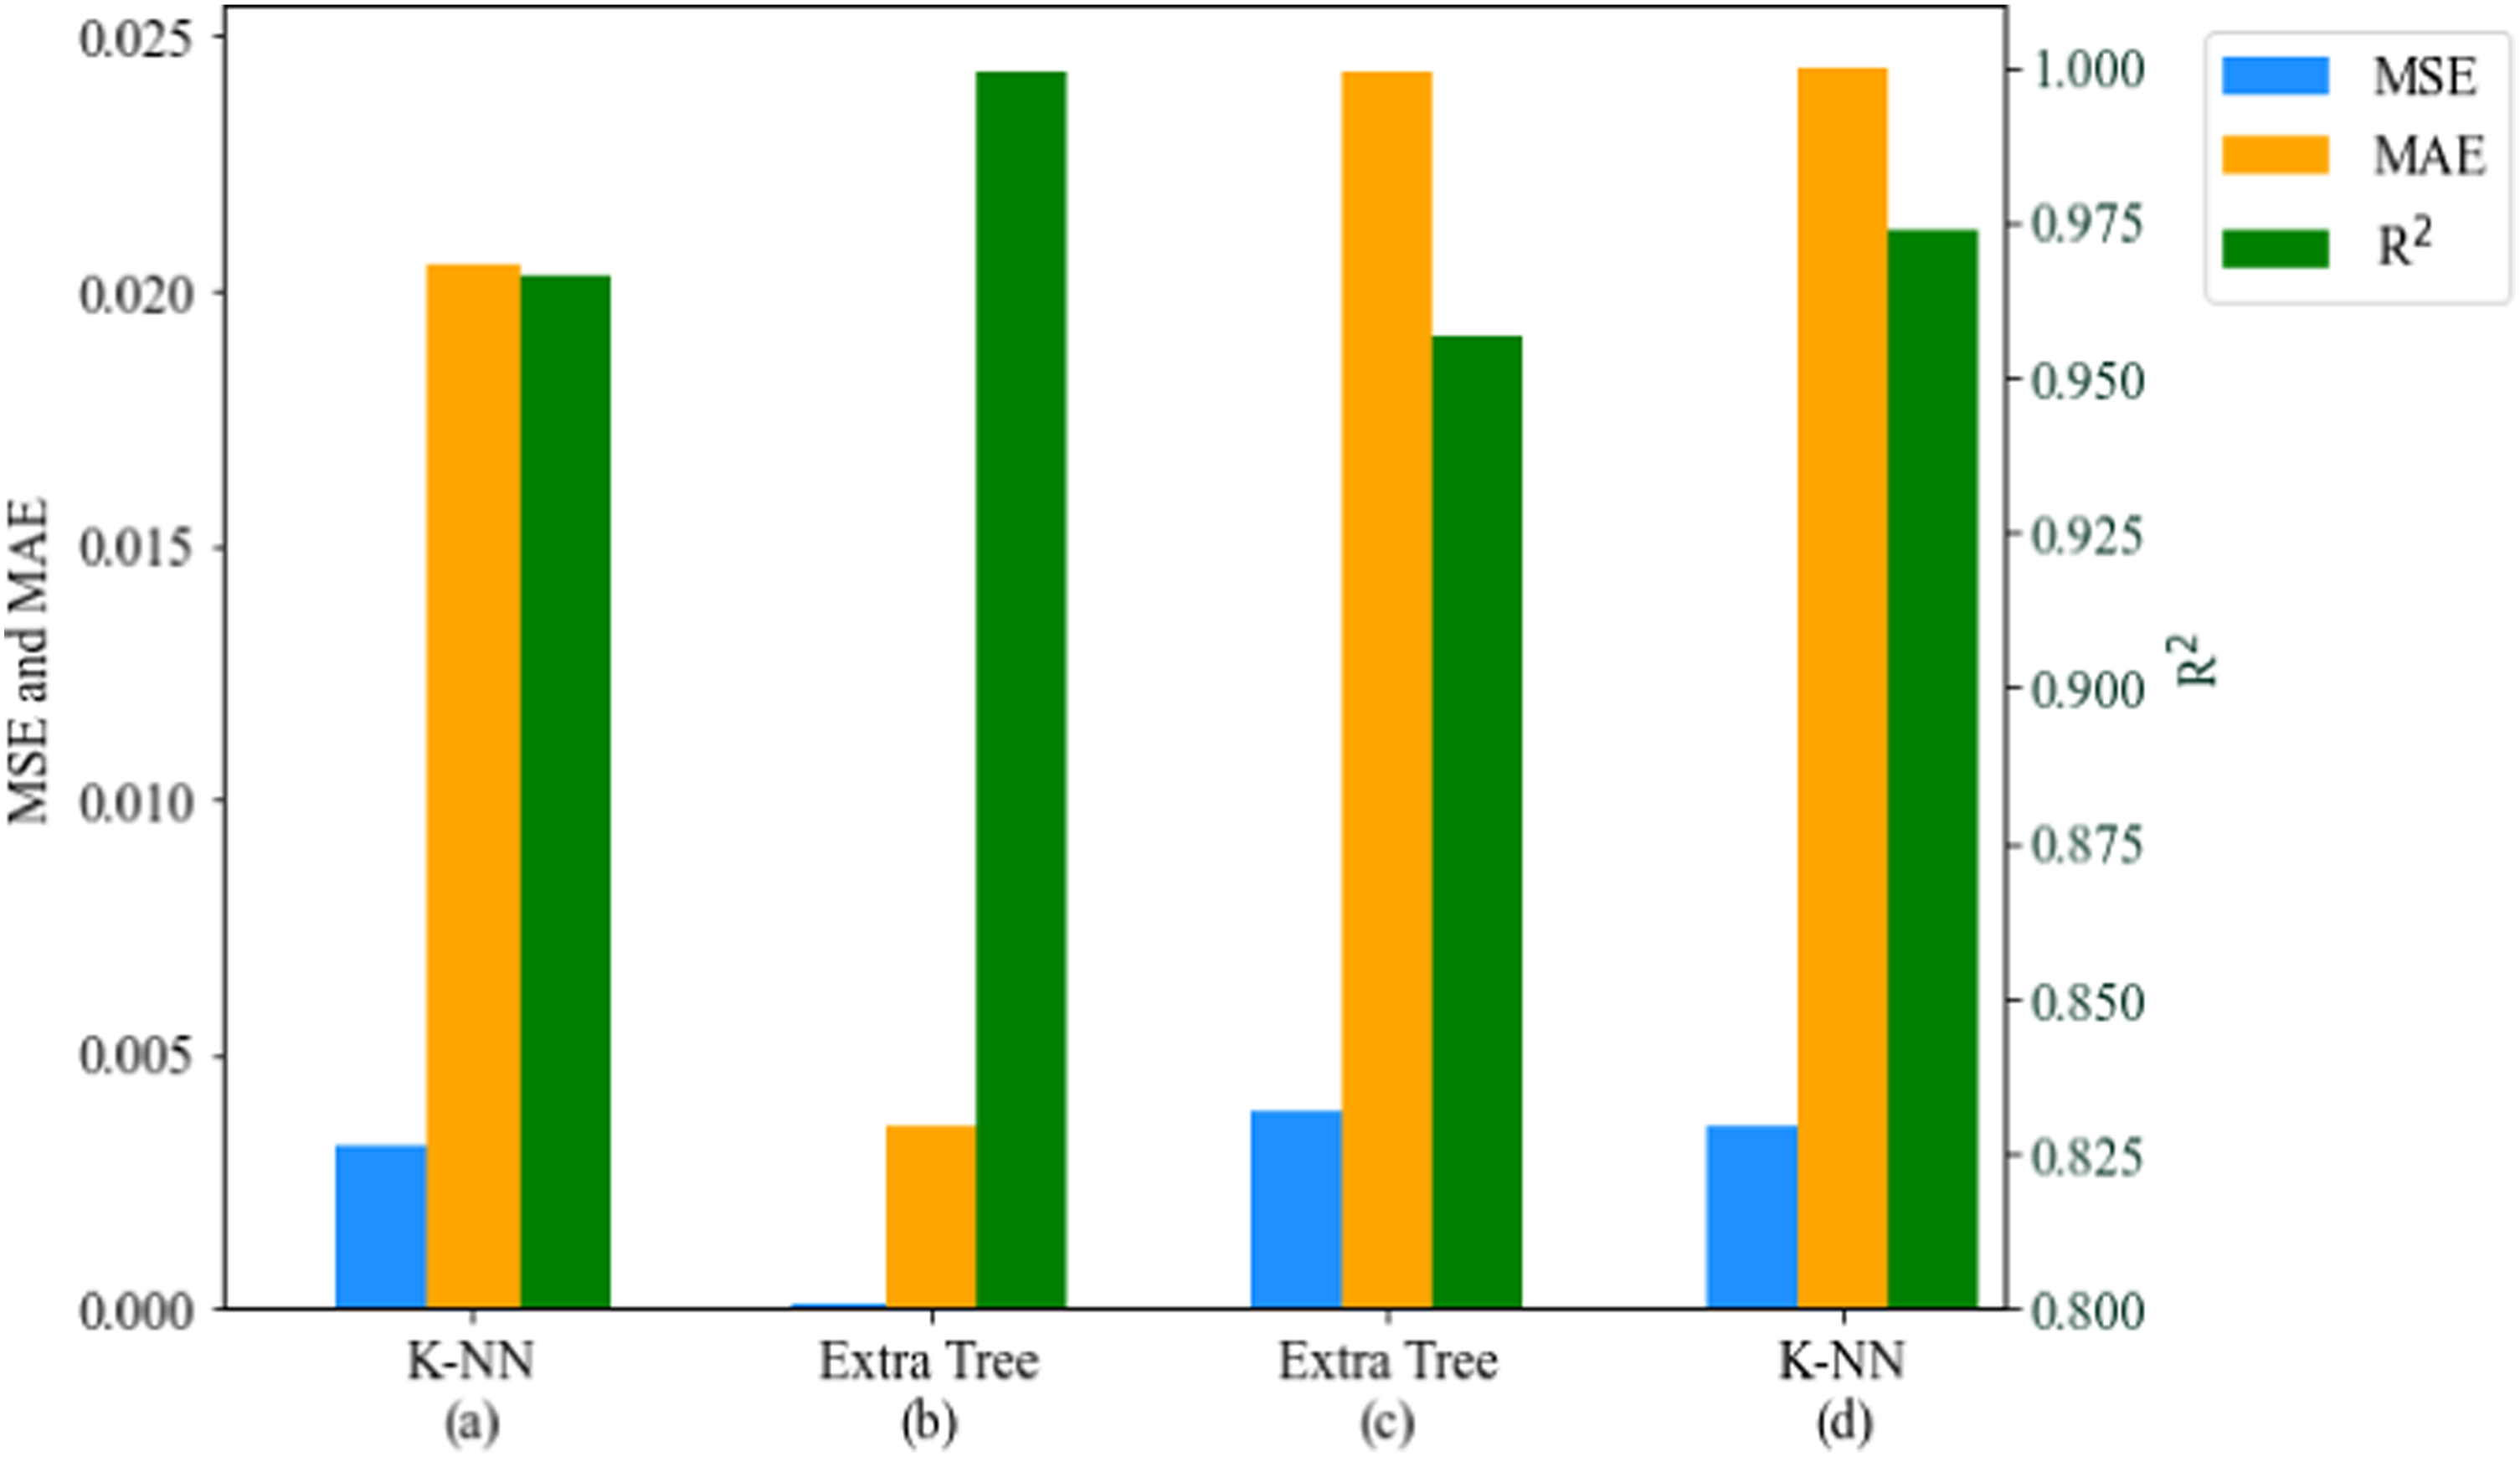
The models with the highest performance for predictions, based on the MSE, MAE, and R2 values, are highlighted in this section. Excluding the linear regression model, which was added as a benchmark, all models delivered a predictive performance between 80 % and 99 %. Owing to the sensitivity of MSE to outliers, it delivered better performance results than the MAE values, for all material properties prediction considered. This is presented in Figures 12 and 13, which are the bar charts for the best-performing models for CF-PA and CF-ABS, respectively. PCC for material properties of CF-PA: (a) tensile, (b) compression, and (c) flexural.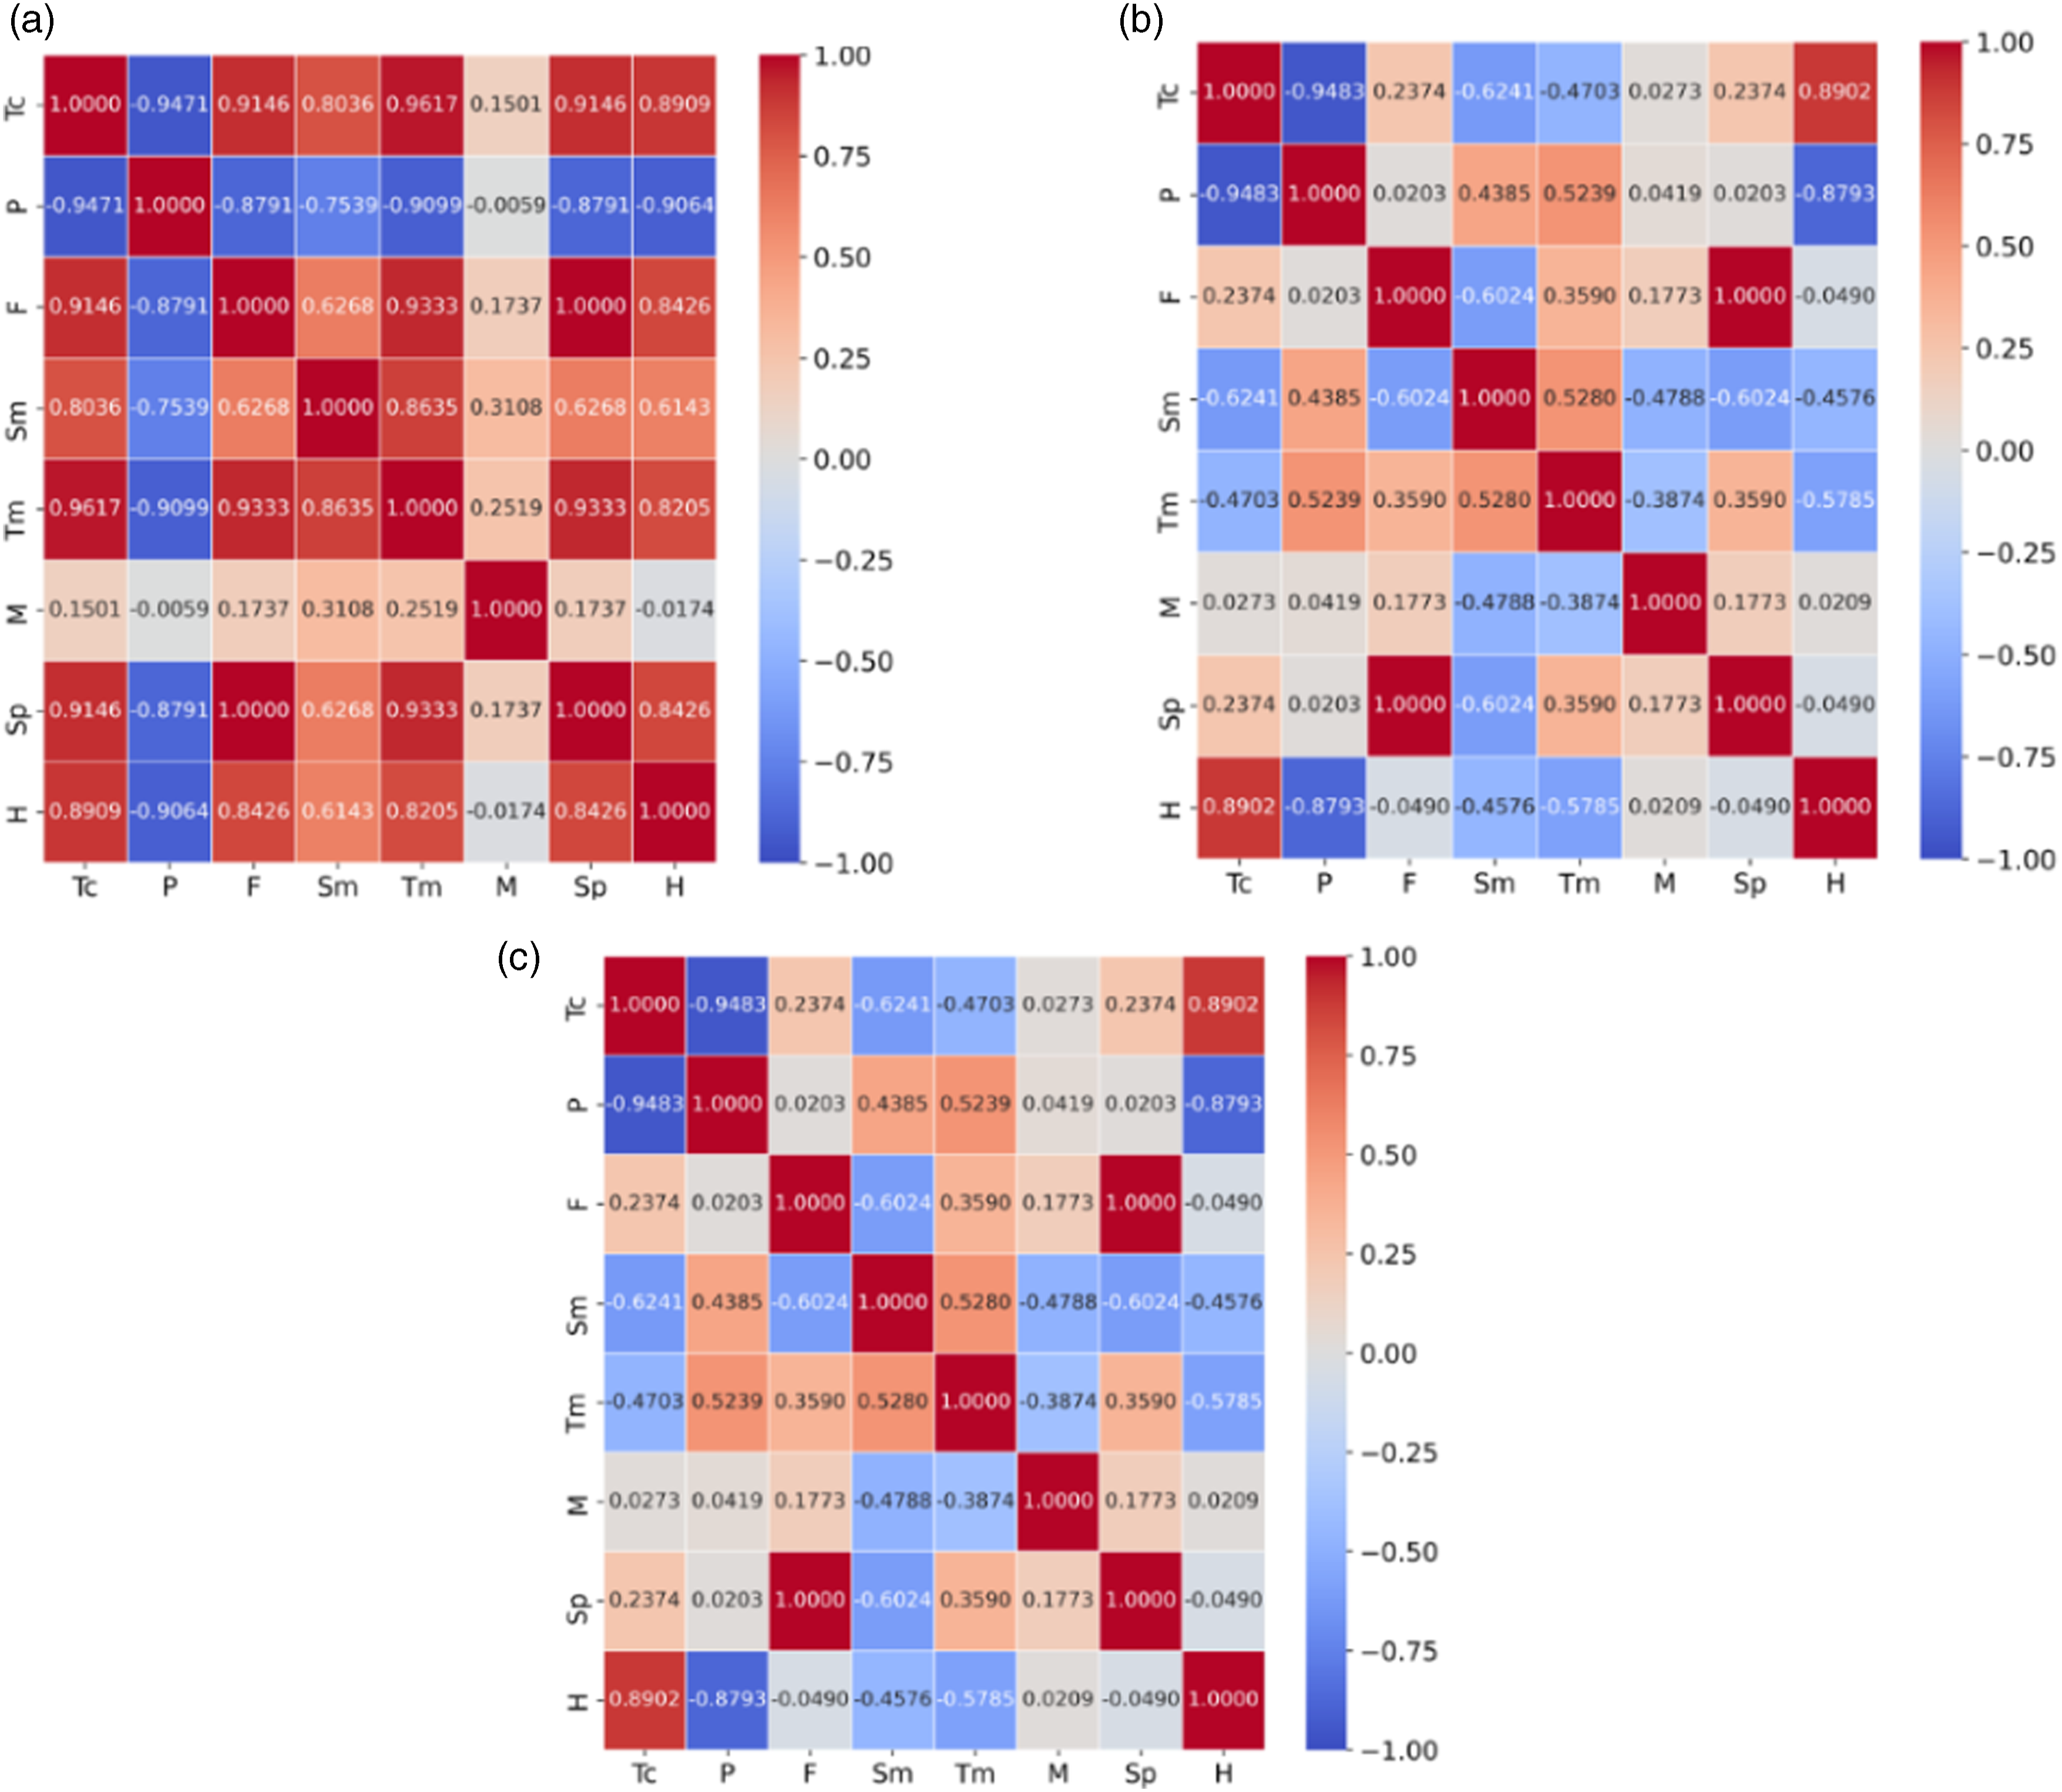
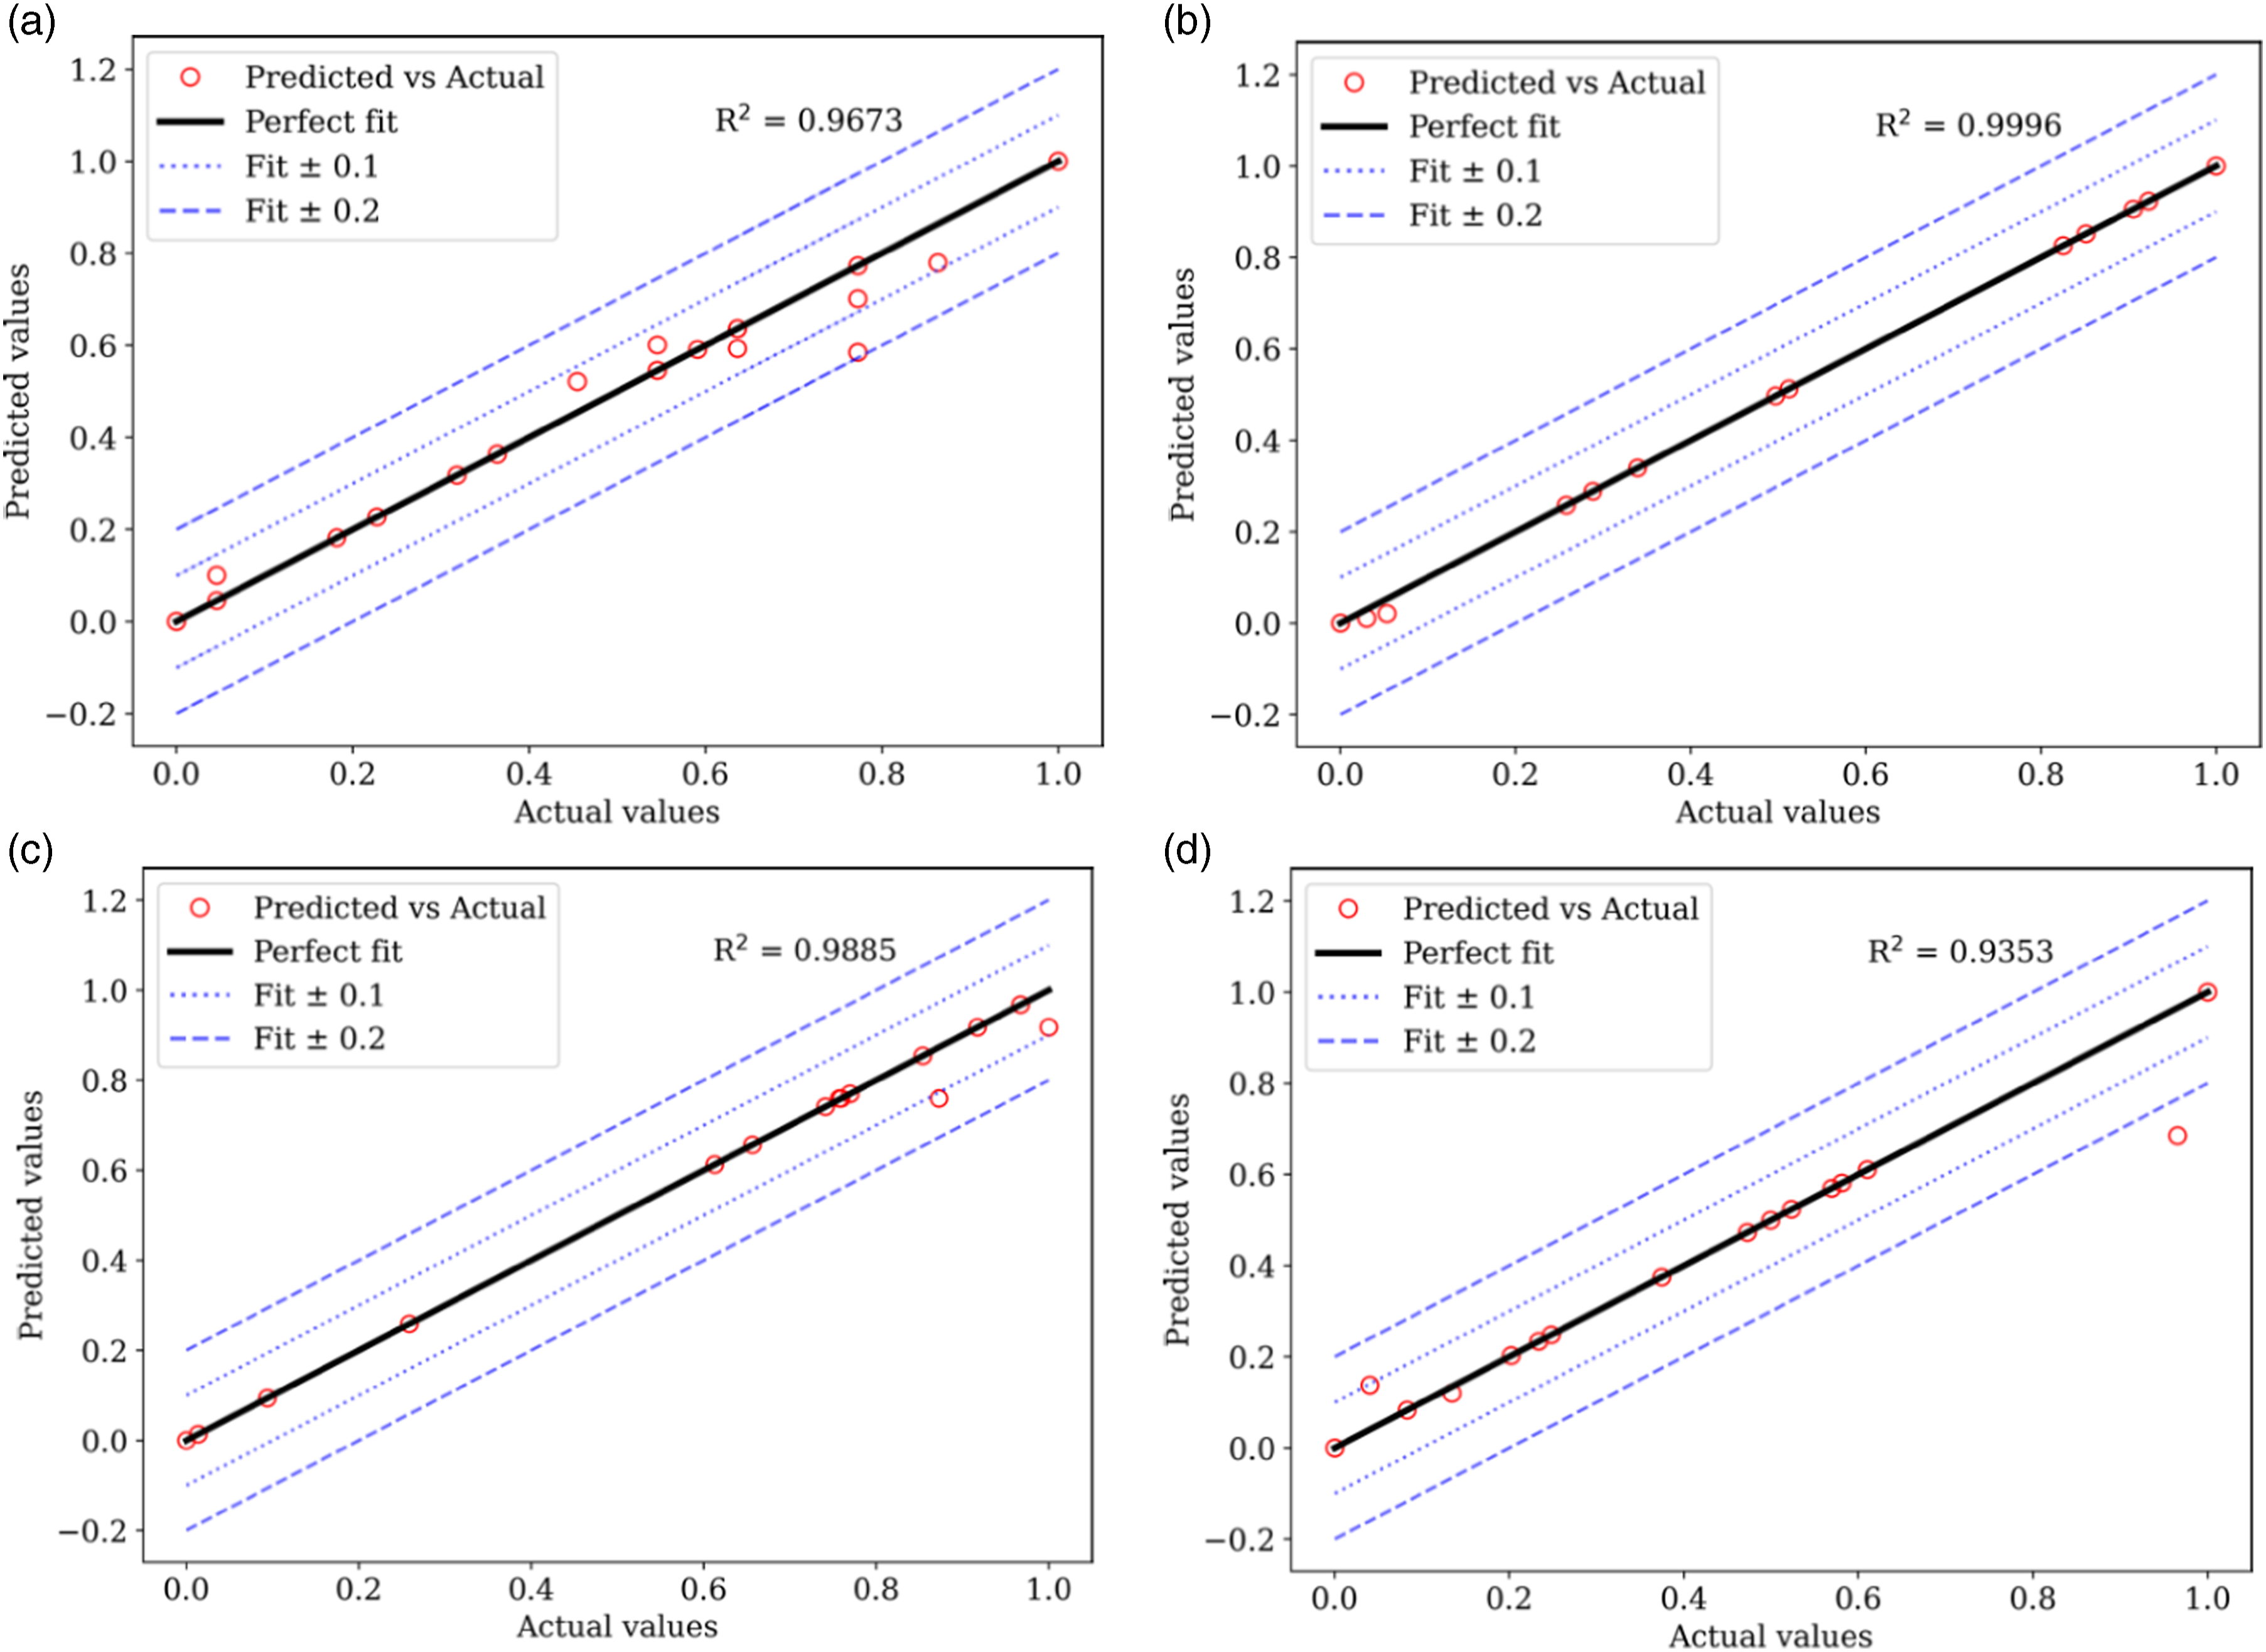
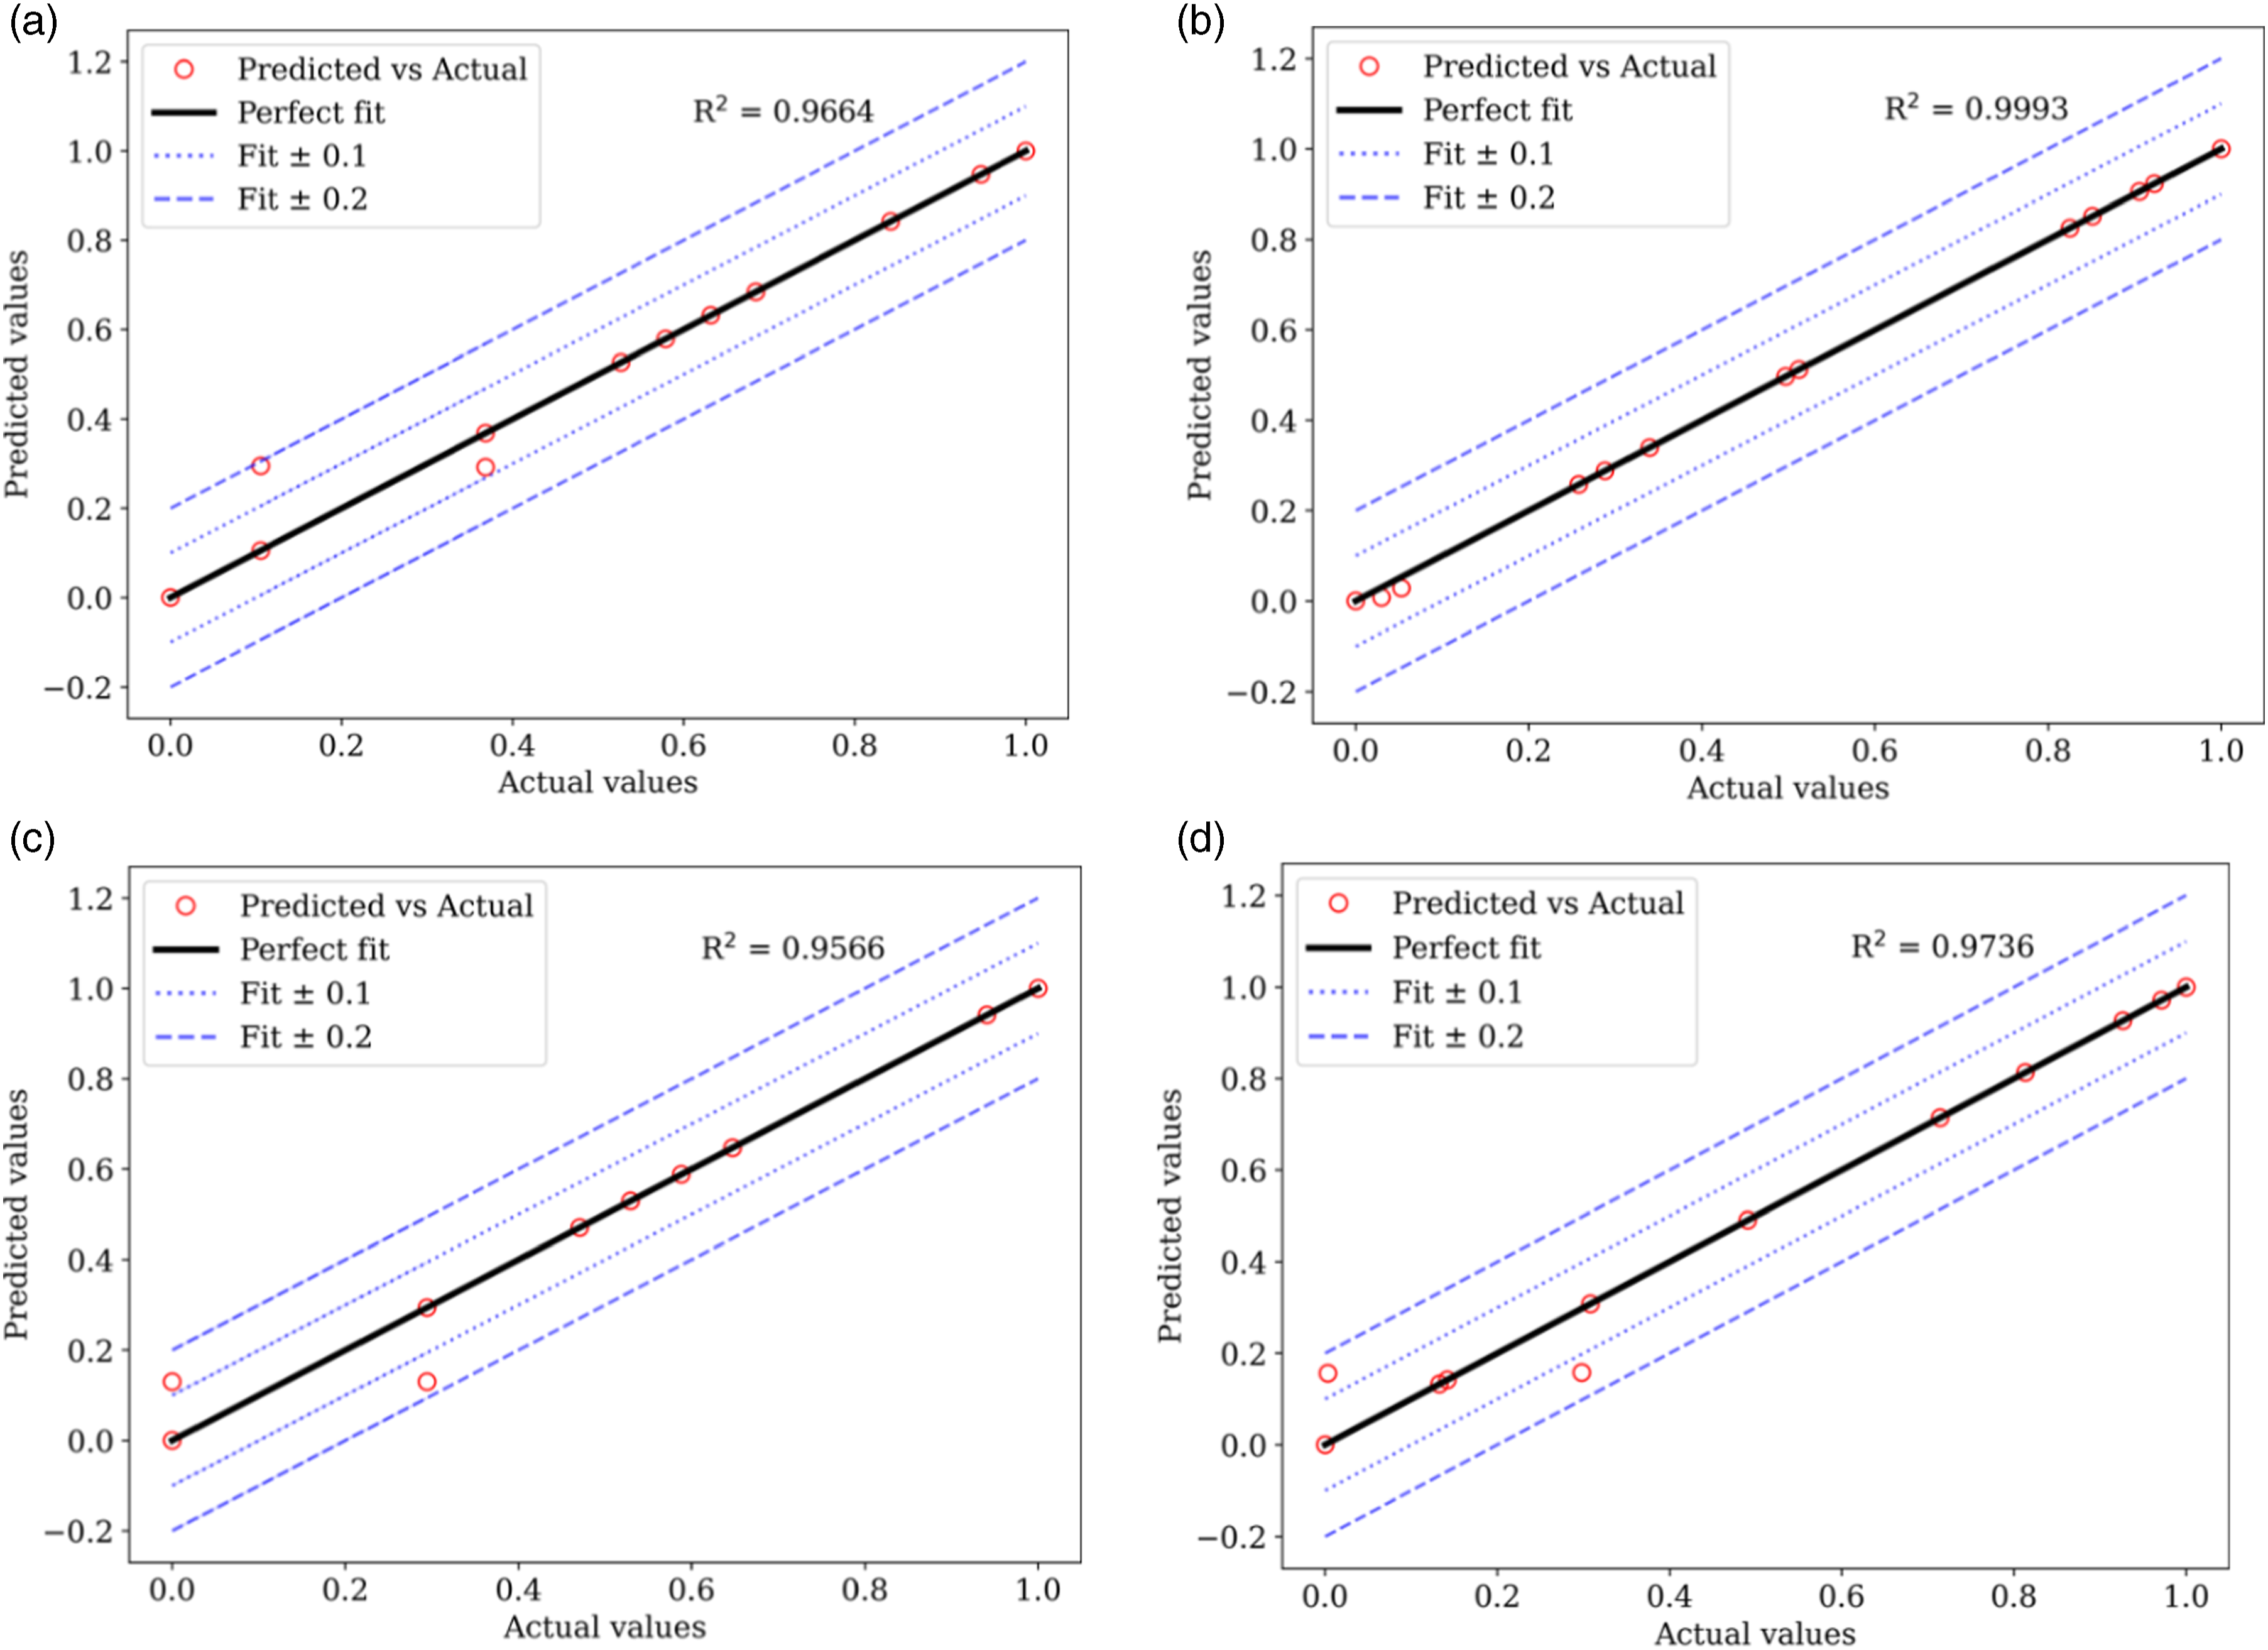
The models built on k-NN provided the optimal performance for predicting hardness and flexural strength properties for both CF-PA and CF-ABS composites. For predicting compressive strength, the models built on decision trees and extra tree regressors delivered peak R2 performances of 0.9885 for CF-PA and 0.9566 for CF-ABS, respectively. The highest accuracy was observed in the prediction of tensile strength, yielding an MSE, MAE, and R2 of 0.0001, 0.0024, and 0.9996 for CF-PA, and 0.0001, 0.0036, and 0.9993 for CF-ABS. The graphical representation of the actual versus predicted values for the highest-performing models for hardness, tensile, compressive, and flexural strengths for both CF-PA and CF-ABS are provided in Figures 14 and 15 respectively. Additional plots for the remaining models are appended in Appendix 1.
The presented plots illustrate the relationship between the actual and predicted values in relation to the ideal fit line. Specifically, the actual and predicted values for the tensile strength for CF-PA and CF-ABS, as displayed in Figures 14(b) and 15(b) respectively, are more closely aligned on the perfect fit line than any other models. Additional lines have been included in the plots to account for the deviations from the actual predictions. Dotted lines represent a range of ±0.1 deviations from the actual values and can be interpreted as a reasonable approximation to the actual values. The dashed lines, indicating a ±0.2 deviation from the actual values, represent a slightly larger, but still acceptable deviation. Points falling outside of this ±0.2 range represent significant prediction errors. Among the top-performing models, only Figure 14(d), which predicts the CF-PA flexural strength prediction, has a predicted value falling outside this range, accounting for the R2 value of 0.9353. In Figure 14(a), which shows the hardness prediction for CF-PA, three actual values were falsely predicted at various points (from 0.796 to 0.818). Hence, the model can guarantee a prediction of up to 99 % accuracy except for hardness properties with fabrication temperature-induced porosity volume within the range of 19.3 %–19.9 % which corresponds to normalized predictability values of 0.796 to 0.818, respectively. PCC for material properties of CF-ABS (a) tensile, (b) compression, and (c) flexural. Friedman Statistic and p-value results for CF-PA – hardness based on 10 iterations. Best performing models for CF-PA; (a) hardness, (b) tensile, (c) compression, and (d) flexural. Best performing models for CF-ABS; (a) hardness, (b) tensile, (c) compression, and (d) flexural. Actual versus predicted values of optimal performing models for CF-PA: (a) hardness (K-NN), (b) tensile (Extra Tree), (c) compressive (Decision Tree), and (d) flexural strength (K-NN). Actual versus predicted values of optimal performing models for CF-ABS; (a) hardness (K-NN), (b) tensile (Extra Tree), (c) compressive (Extra Tree), and (d) flexural strength (K-NN).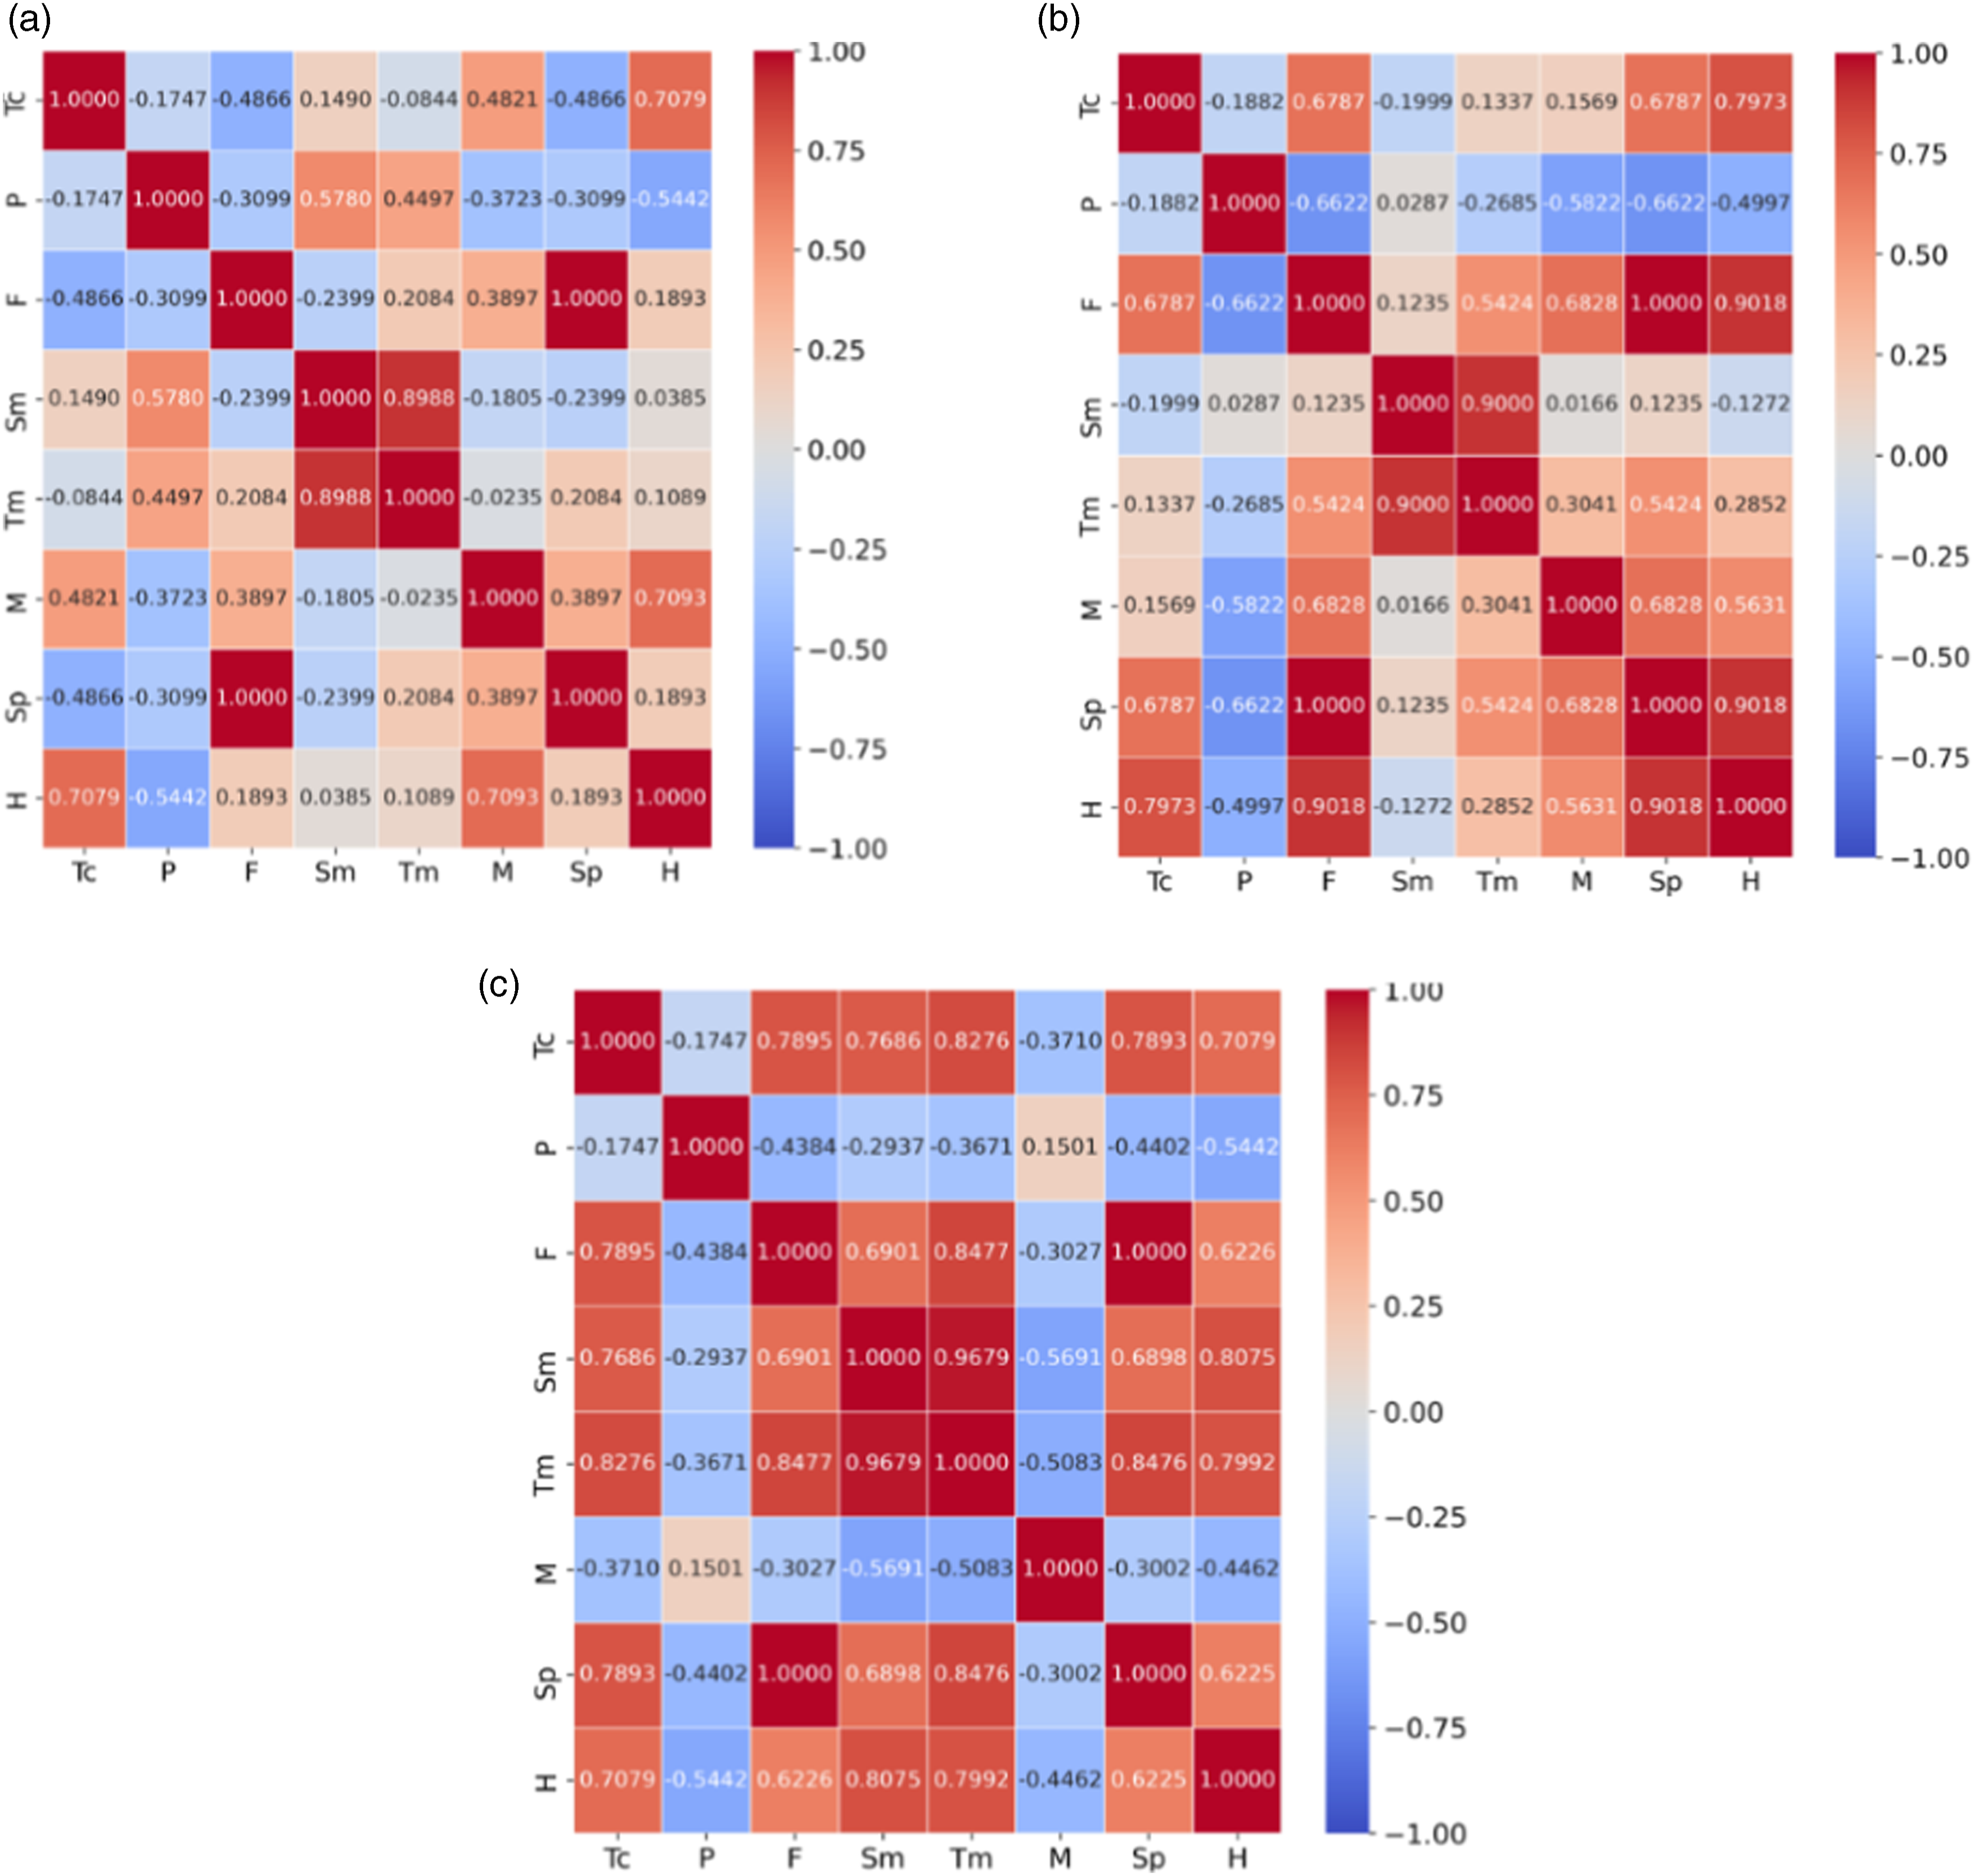
Conclusion
This study employed a ML approach to characterise the mechanical properties of AM fabricated composites. The findings reveal a generally negative correlation between porosity volume (%) and the tensile and compressive strength for both CF-PA and CF-ABS structures. A variety of ML regressor algorithms were explored in predicting the materials’ properties including hardness and strength (tensile, compressive, and flexural). In particular, the study explored the impact of fabrication temperature-induced porosity on selected mechanical properties of AM CF-PA and CF-ABS composite structures. The prediction models’ results revealed that ensemble tree learners and the K-NN regressor algorithms delivered the most accurate results when temperature-induced-porosity was selected as predictors for material hardness and strength. This demonstrated the ability of the ML algorithms to capture non-linear relationships and interactions, as well as robustness to outliers, in contrast to the lower performance of the linear regression model which was benchmarked for the study. The presented models achieved an accuracy of between 80% and 99%. The high performance of the test model can be applied to overcome the reliance on experimental and destructive techniques, as well as compensate for limitations in the technical skills of AM equipment operators in characterizing the mechanical properties and damage phenomenon of CF-PA and CF-ABS AM composite structures. Notably, the model built on the extra tree regressor algorithm delivered the highest evaluation scores for both CF-PA and CF-ABS, with R2 values of 0.9993 and 0.9996 respectively. In summary, the developed model can guarantee an accurate prediction for all samples except for CF-PA with fabrication temperature-induced porosity volume within the range of 19.3 %–19.9 %. Furthermore, this model would be valuable in enhancing control and providing autonomy while alleviating time and cost constraints in both research and industrial applications of AM structures.
Footnotes
Declaration of conflicting interest
The author(s) declare no potential conflicts of interest with respect to the research, authorship, and/or publication of this article.
Funding
The author(s) disclosed receipt of the following financial support for the research, authorship, and/or publication of this article: This work was supported by the Petroleum Technology Development Fund under grant PTDF/ED/OSS/PHD/AGU/1076/17.
Data Availability Statement
The data given in this article are available on request.