
Abstract
Injection molding is a common process for manufacturing thermoplastic polymers. Preconnected to fabrication, mechanically loaded parts are examined in structural simulation. A crucial prerequisite for a valid structural simulation for any material is the underlying material data. To determine this data, different phenomena must be considered such as influences of load type, strain rate, environmental conditions and in case of fiber reinforced materials the fiber orientation (FO) in the considered area. Because of rheological effects, injection molded parts often possess a non-homogeneous FO distribution. This makes it challenging to create testing plates for specimen extraction with a well-defined FO over thickness and width in the considered area. In this paper, a novel testing part is introduced with an unidirectionally oriented testable area. It shows a FO degree of more than 0.75, which has been validated with μ-CT measurement and two thermoplastic materials: polyamide and polybutylene terephthalate, both reinforced with 30 weight percent of short glass fibers. In order to resolve influences of the already addressed FO distribution in injection molded parts, tensile test specimens need to be extracted out of specially designed plates via milling and cannot be injection molded directly. Experiments were carried out to study possible effects of preparation on the mechanical properties of specimens with both materials and two milling parameter sets. The first milling parameter set creates reproducible surface roughnesses, whereas the second parameter set shows a correlation between FO and roughness value: when milling perpendicularly to the main FO lower roughnesses are reached than milling in fiber direction. Uncertainties of the normalized rupture strain from orthogonally extracted specimens seem to be larger than the values from those extracted in fiber direction.
Keywords
Introduction
Injection molded parts are brought to their final contour advantageously in one process step. The technique is cost and time efficient for mass production. 1 To modify the physical properties such as stiffness and strength, often short fibers of length up to 1 mm are added,2,3 denoted as short fiber reinforced thermoplastics (SFRTP). Of special benefit is the great strength-to-weight ratio, 4 which is profitable for lightweight constructions. Combining the properties of both, fibers and matrix material, allows tailoring and optimization of material properties.
Injection molded parts of SFRTP show locally inhomogeneous fiber orientation (FO) due to rheological phenomena.5,6 The anisotropic mechanical material behavior of SFRTP complicates the computational design of components.7,8 In case of planar geometries, the fibers are generally oriented multi-directionally (MD). 9 Karger-Kocsis et al. described the basic FO distribution in thickness direction as consisting of three main layers. 10
Each particular main layer has its own FO and consequently specific material properties. The edge layers show a high FO in injection direction, in the core layer orthogonal FO direction dominates. Hence, a tensile test on specimens made from MD plates will provide information on the convoluted mechanical behavior of all three layers. 11 Ideal would be a unidirectional oriented plate that provides direct information about the underlying FO.
A similar manufacturing process to injection molding is the push-pull injection molding, where the melt flow during solidification is controlled. While the melt is solidifying from the mold wall to the mold center an oscillating motion through the cavity maintains the melt flow. 11 The aim of this process is to control the orientation of the fibers. Waschitschek et al. found that the changes in flow direction show a notable influence on the orientation of the added short fibers. The FO of the three main layers is more strongly pronounced than equivalent orientation of the reinforcing fibers from injection molded parts, so the interface in between the layers is smaller. 11
Experiments with a defined FO are essential to gain material data for a valid simulation. 12 To improve the quality of design, high-quality data based on reliable and comprehensive mechanical material tests are needed. Regarding the manufacturing process and the FO dependency, a crucial difference is that real components are directly injection molded, whereas test specimens are extracted via machining from injection molded plates, which is required in order to resolve FO effects in different orientations. Mechanical machining typically induces surface damage, local heat input, and modification in the micro structure. 13
Brinksmeier et al. found that functional properties of components strongly depend on the material, the component´s geometry, and its surface integrity. Whereas the prediction of geometrical properties in prescribed tolerances is possible with sufficient reliability, a valid procedure to determine the required machining parameters for a given desired surface integrity in a knowledge-based way is still lacking. All cutting processes cause a combination of thermal and mechanical internal material loads with regard to metallic materials. 14
According to Neff et al., surface quality at additive manufacturing is an important issue as well. They compared polished and unpolished 3D-printed specimens made of the thermoplastic material acrylonitrile butadiene styrene (ABS). The strength of specimens with and without polishing is comparable, while the elongation to break value increased slightly for the polished specimens.15,16 The surface roughness has obviously an essential impact on the elongation to break.
For carbon fiber reinforced polymers, Wang et al. found out that during the cutting process temperatures beyond the glass transition are reached. This may entail irreversible chemical and mechanical degradation of the matrix material. 17
Eriksen studied short glass fiber reinforced thermoplastics and found that theory and experience from other materials cannot be directly applied. 1 Research work on the impact of the manufacturing process of specimens on the mechanical behavior of SFRTP is scarce, and guidelines are unspecific and vague. Eriksen calls for new guidelines for how to ensure a satisfactory result from machining. 18
In existing guidelines on mechanical testing, it is prescribed, that test specimens made by machining must be manufactured very carefully. DIN EN ISO 2818–2019 Plastics Preparation of Test Specimens by Machining, as well as ASTM Standard D638–2014 Standard Test Method for Tensile Properties of Plastics, point out that material cannot be tested without validating the test method itself. Regarding the surface condition both standards state that the specimen’s surface has to be free of visible flaws, scratches, or imperfections when viewed at low magnification. It depends on the observer’s point of view, whether imperfections are noticed and specimens are excluded or not. Both standards fail to meet a measurable and quantifiable criterion. According to the present standards, the status of the surface quality is not well defined but may have a significant influence on the material properties.
To fill this gap of knowledge, the investigations presented here focus on the preparation of test specimens with a high FO. A novel injection molded plate with a predefined FO is introduced. It enables the extraction of specimens with unidirectional FO. The impact of the manufacturing process of specimens out of these unidirectionally oriented plates is discussed regarding their mechanical properties.
Material
This research focusses on a representative short glass fiber reinforced thermoplastic material. Polybutylene terephthalate reinforced with 30 weight percentage short glass fibers (PBT GF 30) was chosen, as it is commonly found in automobile applications. Its trade name is BASF Ultradur® B4300 G6. In order to analyze the transferability to other materials, specific tests were performed additionally with polyamide (PA66), which is also reinforced with 30 weight percentage short glass fibers (PA GF 30) with the trade name BASF Ultramide® A3WG6. Both materials are semicrystalline.
Methodology
The BZ6 geometry is used for the mechanical tests, its dimensions are shown in Figure 1. Its geometry is based on the scaling of the BZ12 (“Becker Zugstab” = tension rod developed by Becker, with testing area of 12 BZ6 geometry of tensile test specimens.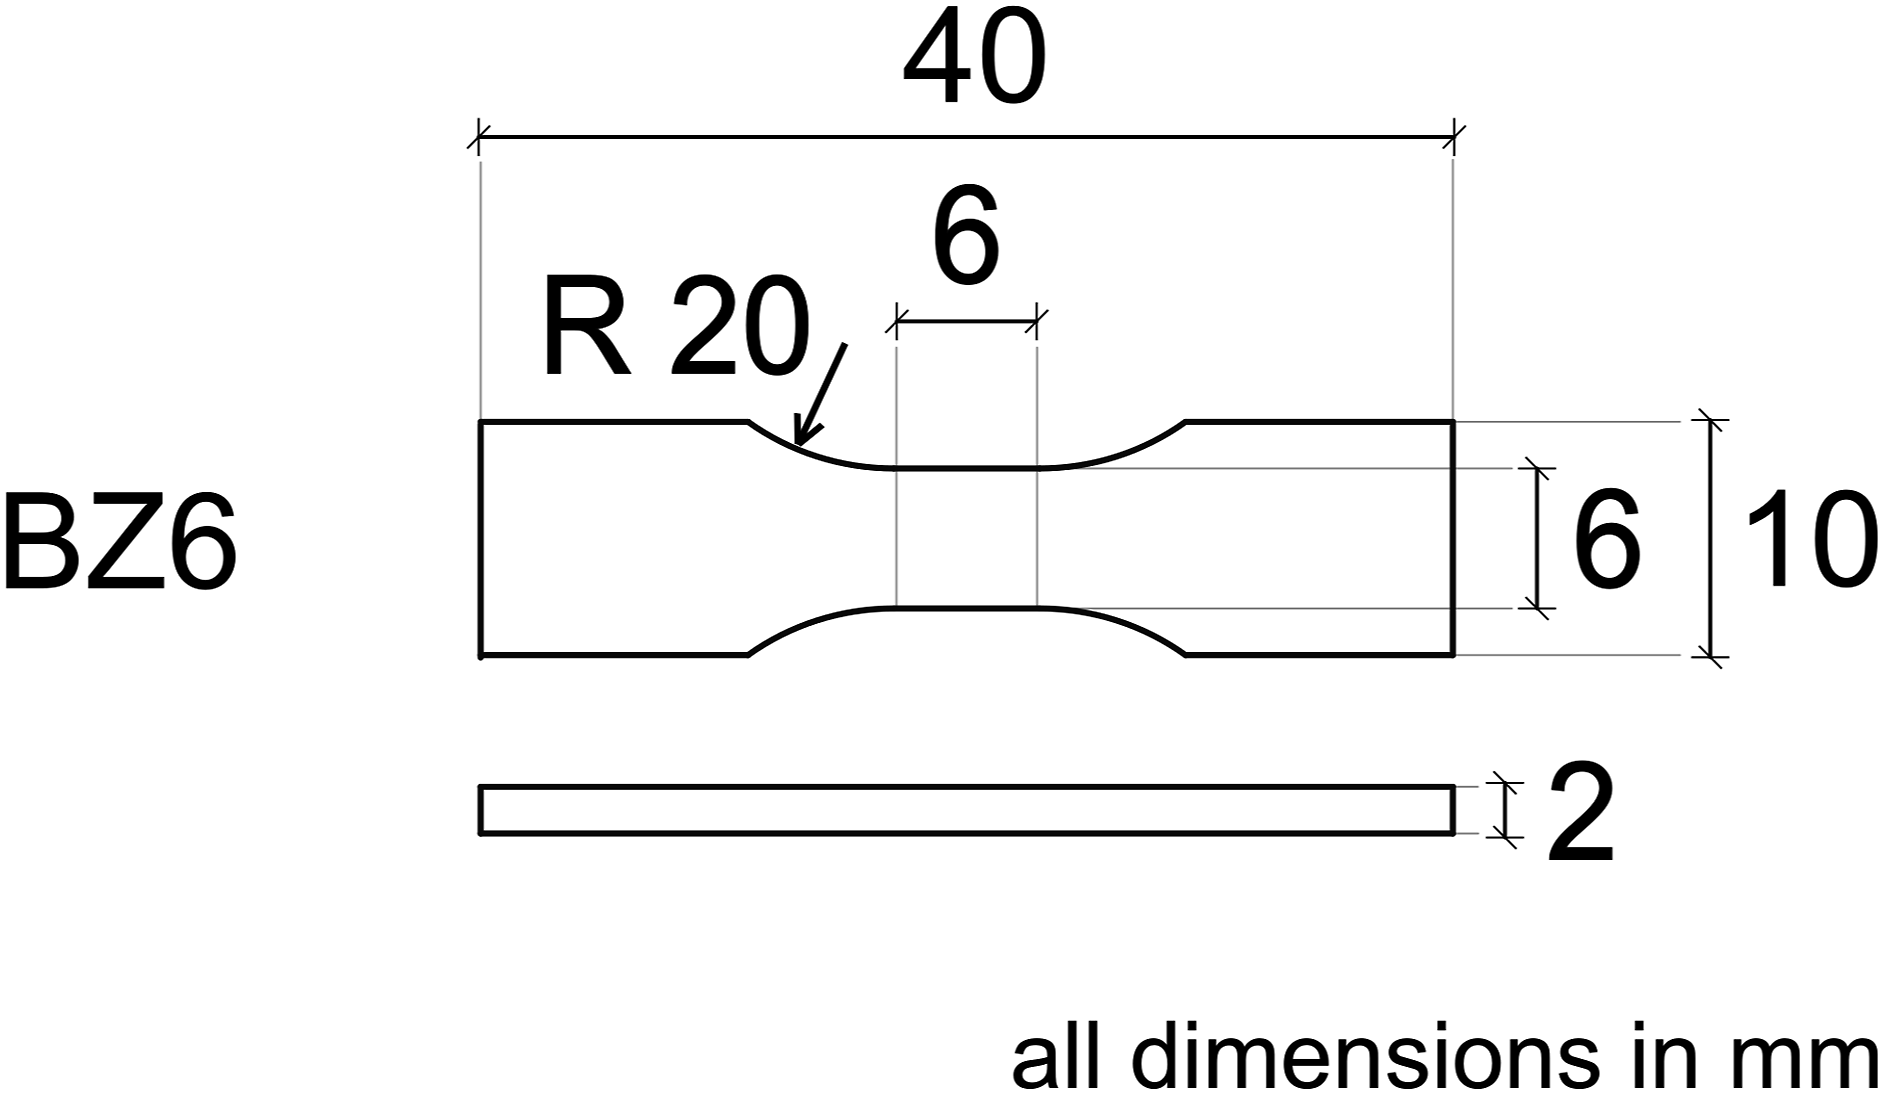
The PBT GF 30 and PA GF 30 granulate was pre-dried for the injection molding process. After manufacturing the plates, the inlet was cut off and the testing areas of the UD plates were stored in vacuumed bags until milling. After milling, the BZ6 specimens were again sealed in vacuumed bags until tensile testing.
For the description of fiber orientation distribution (FO), the second order orientation tensor is applied. 21 In the main axis system, only the principal diagonal of the tensor consists of non-zero values. The sum of these eigenvalues amounts to one. Higher values of an eigenvalue indicate a more pronounced distribution of fibers in the specific orientation. It should be remarked here that in some cases the second order tensor may be ambiguous in regard to related fiber distributions, the detailed derivation and discussion can be found in the paper of Advani and Tucker. 21
Specimens with unidirectional FO
In general, plates with a high FO made form SFRTP do exist, but none of them are suitable for tensile tests with arbitrary extraction angles. DIN EN ISO 527–2 introduces the specimen geometry A1 which possesses a high FO. Also, at the Deutsches Kunststoff Institut DKI, studies were performed regarding highly oriented specimens and injection molded plates with highly oriented areas to extract specimens. All of them have one crucial aspect in common: their width is less than 20 mm. This would lead to an orthogonal specimen´s length of 20 mm, which makes transverse tensile testing impossible.
Out of this need, we designed an innovative injection molding tool with the DKI plate serving as basis for the new design. The main requirements for optimization of the geometry are • adequate FO: first principal component of the second order FO tensor should be larger than 0.75 (currently perceived as highly oriented) o homogeneous FO across the entire thickness o homogeneous FO in the testing area o no multi directionality o no core layer • sufficient width to extract specimens o possibility of extraction under arbitrary angles o width should be as large as possible
The boundary conditions for the geometry from a processing point of view were given by the pressure constraints of the available injection molding machine with a shadow image lower than 12 000 mm2 and a closing force of maximum 800 kN.
With Moldflow® software from Autodesk, the injection molding process was simulated including various geometry elements. The simulation results were analyzed to determine whether the filling process shows a planar flow front and the simulated FO meets the required specifications.
Moldflow offers various models based on Folgar–Tucker equation 22 to calculate the FO. The reduced strain closure model (RSC) was used since according to Wang and Jin its prediction shows best agreement with experimental data. 23
To determine parameters needed in the model, a MD plate measuring 80 mm x 80 mm x 2.5 mm is used (cf. Figure 3 for the multidirectional plate made from PBT GF 30 for simulated and microcomputed tomography (μ-CT) measured FO). First, the real MD plate´s FO is measured with μ-CT. Second, the MD plate is simulated and simulation parameters are adjusted. Third, the calculated and experimentally determined FOs are compared. The simulation parameters were iteratively adjusted until the FOs were congruent. The optimized parameters serve as basis for the subsequent simulations of the novel highly oriented plate.
Figure 2 shows the novel UD plate´s geometry, which is already mentioned by van Roo
24
but not validated previously. It consists of a fan gate (not shown), an inlet area with fundamental functions (left) and the testing area for specimen extraction (right). With its triangle shape, the fan gate connects the reciprocating screw with the cavity. Geometry and functional areas of unidirectional plate. Position of specimens in 0° extraction angle (red). Centric position of microcomputer tomography specimen (blue).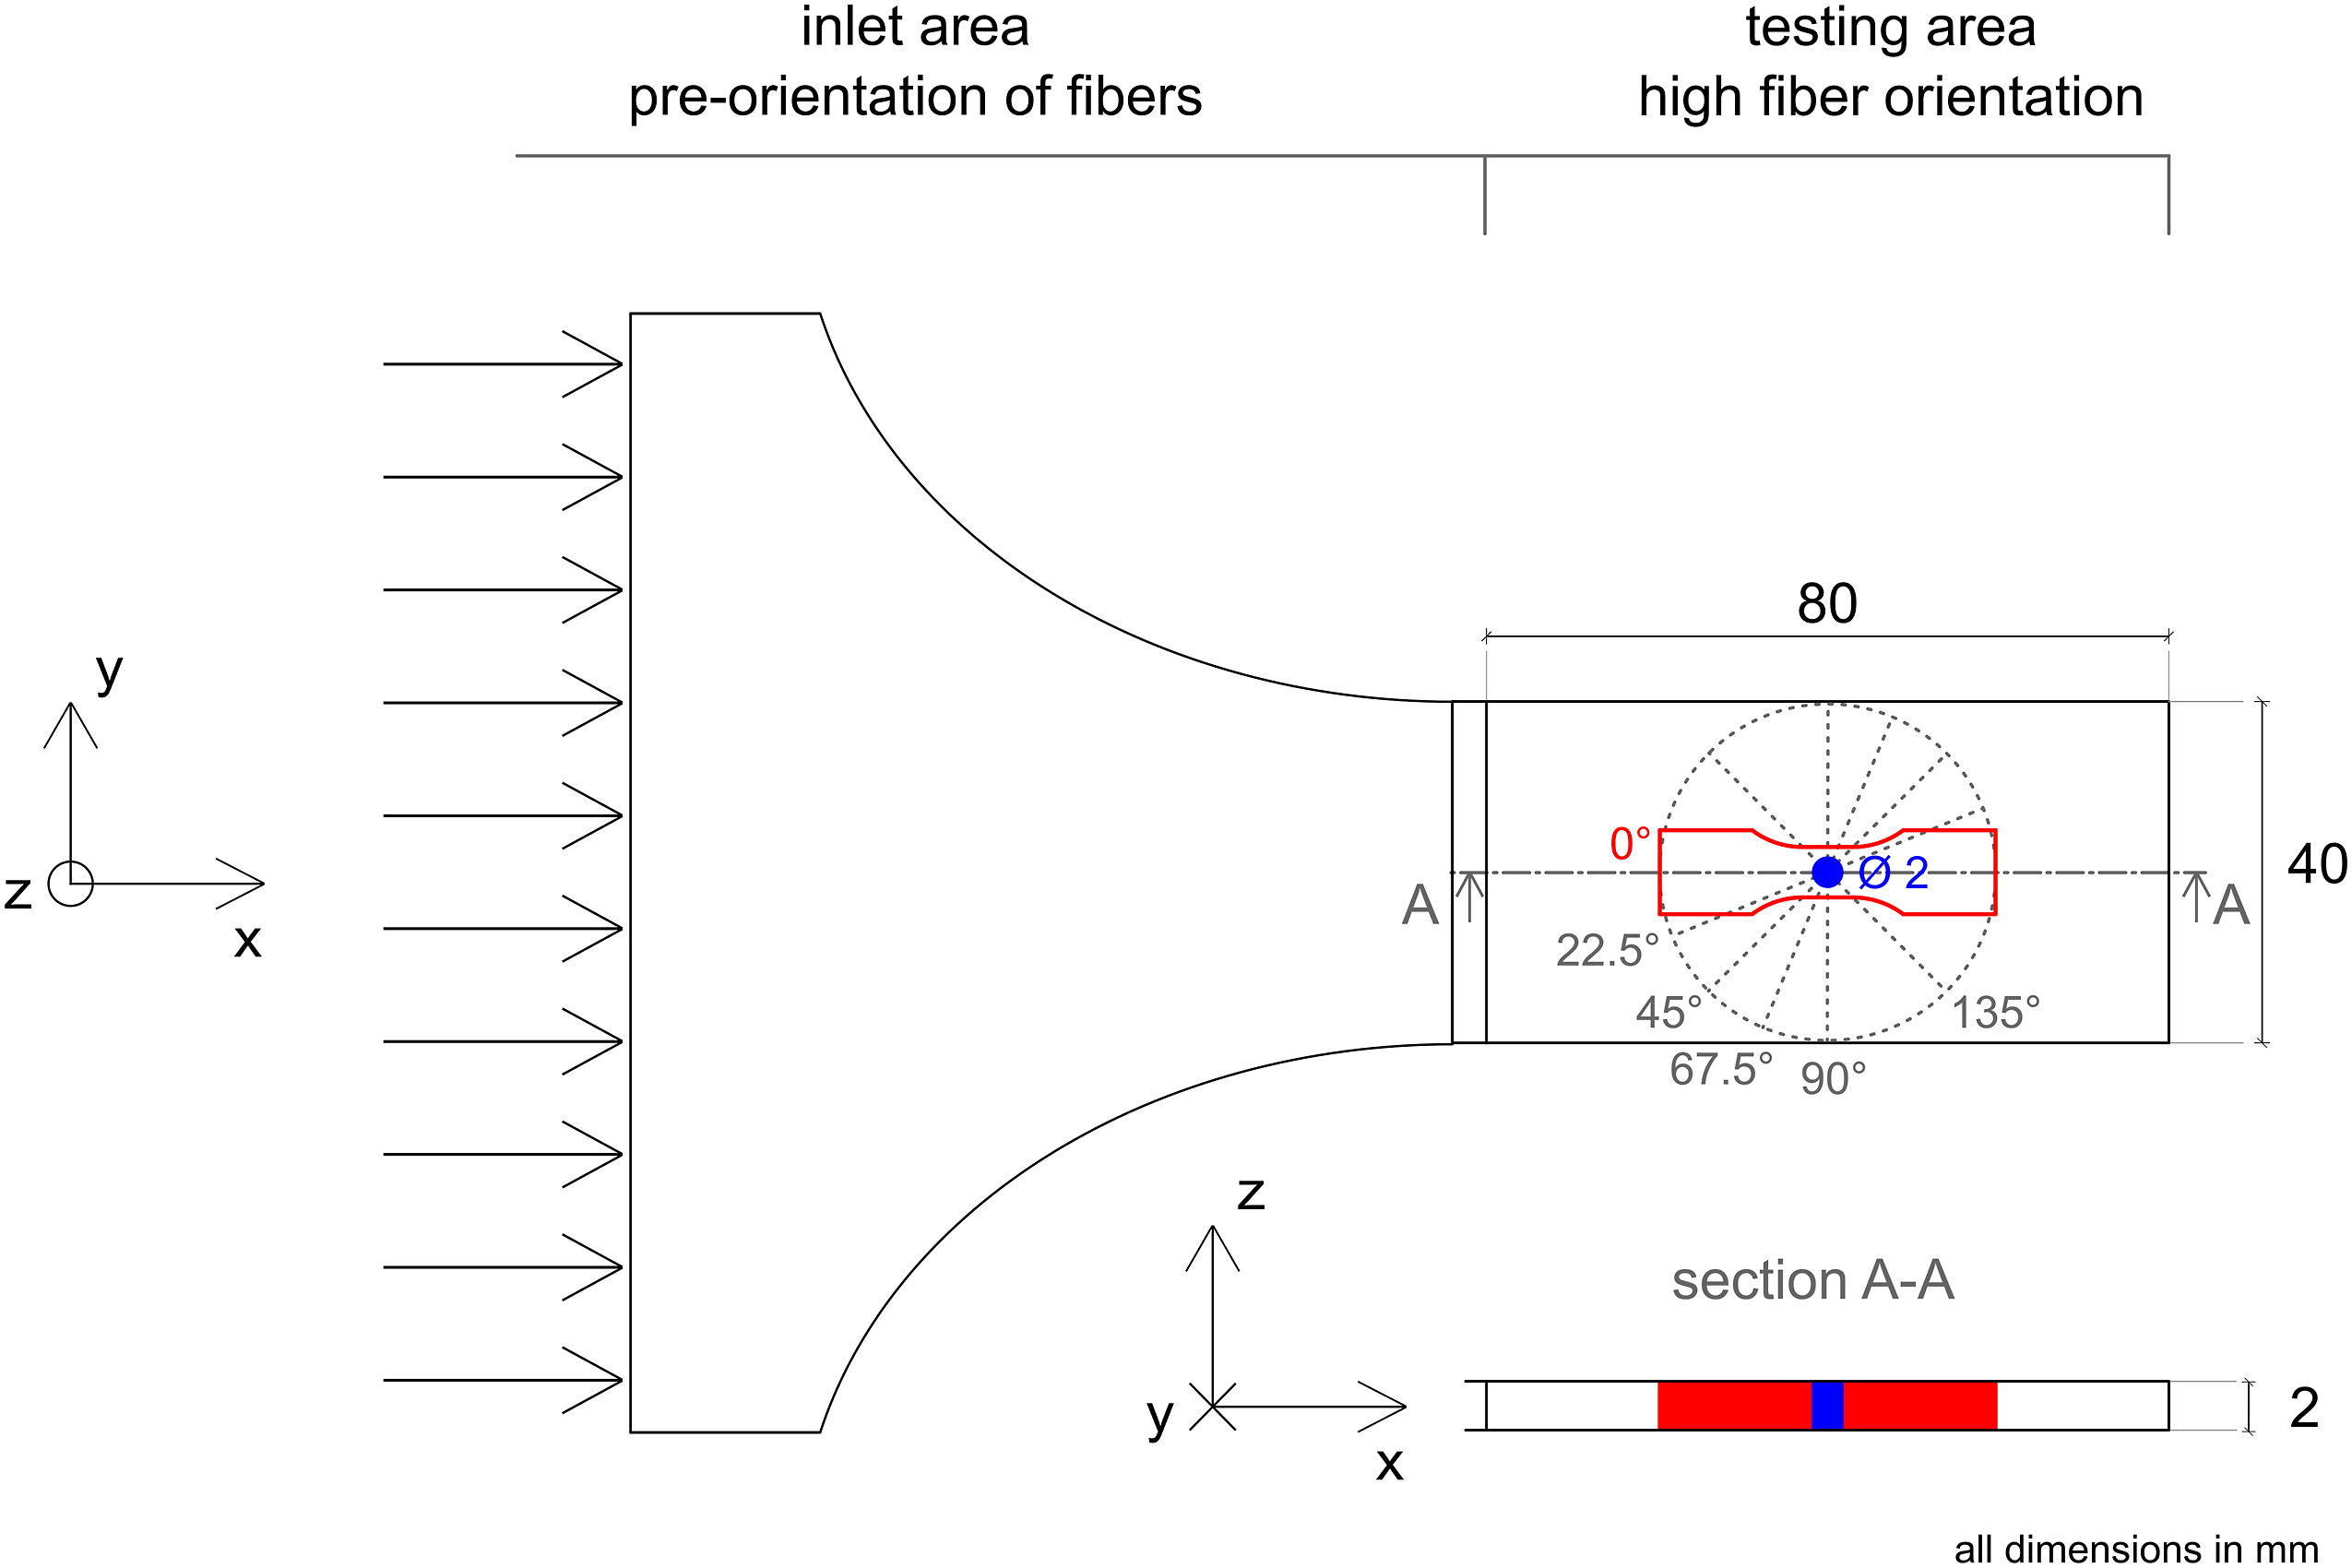
The inlet area ensures a uniform and homogeneous injection of the molten plastic mass. The channel leads to a bulky inlet, so no freezing occurs. The inlet area creates a planar flow front as preparation for a high FO.
To pre-orientate the fibers, a tapering and thickness variation accelerates the melt due to cross-section modification.
The testing area, measuring 40 mm x 80 mm, with a thickness of 2 mm and shows the final orientation of the fibers. It allows an extraction of specimens under arbitrary angles with a length up to 40 mm.
All tensile test specimens were extracted from UD plates that were injection molded on a Multi 80–310 h/200 v machine from Demag. For μ-CT analysis, specimens were taken from the novel UD plate and the standard MD plate. The CT machine is a SkyScan 1072–100, used with an acceleration voltage of 100 kV, a current of 98 μA, and a voxel size of 1.8 μm. The rotational increment amounts 0.45° for a measuring window of 180°.
For the experimental FO analysis, the X-ray images are analyzed with Monte-Carlo techniques for detection of the fibers as introduced by Glöckner et al. 25 In Figure 2, the position of a BZ6 tension rod with 0° extraction angle is highlighted in red, as well as the center lines of different extraction angles are indicated with dashed lines for 22.5°, 45°, 67.5°, 90°, and 135°. In blue, the position of the cylindrical μ-CT specimen with a diameter of 2 mm is shown.
To compare the FO distribution of various geometries, the thickness of the μ-CT specimens will be normalized. This makes it feasible to directly compare MD plates with a thickness of 2.5 mm and UD plates with a thickness of 2.0 mm.
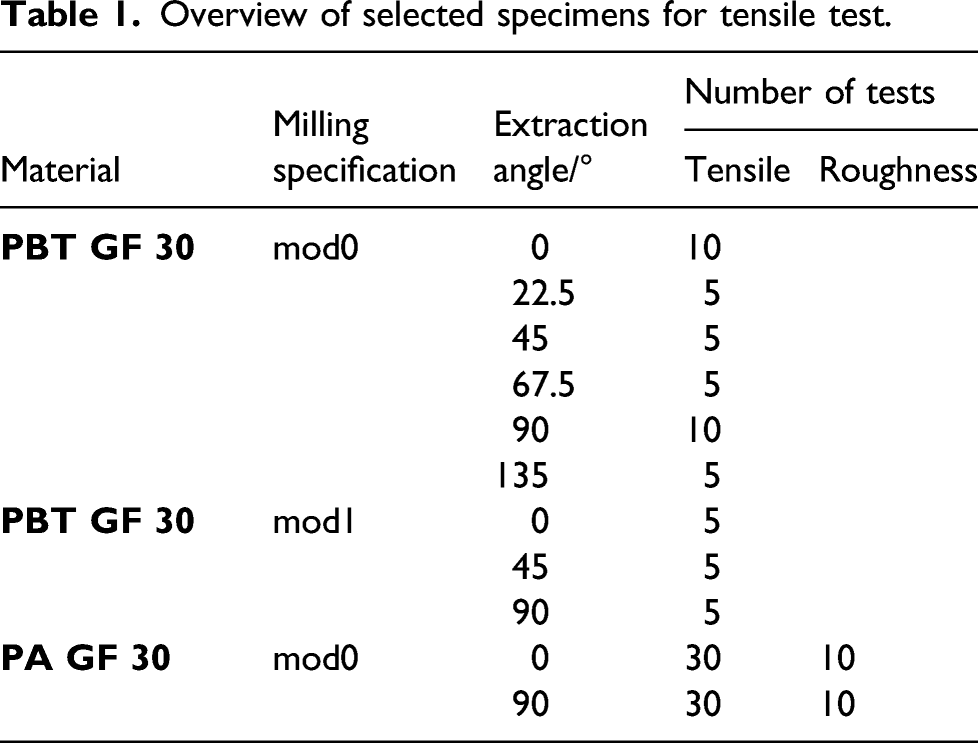
Overview of selected specimens for tensile test.
Milling process
The milling process was conducted in a machine of GMF 4433 type from ISEL, loaded with new and unused millers from Hoffmann Group. For tensile test specimens, a four teeth miller with 6 mm in diameter was used, which is a solid carbide milling cutter with a diamond-like carbon (DLC) coating according to DIN 6527. For μ-CT specimens, a DLC miller with four teeth and a diameter of 2 mm was used. For both processes, no cooling medium was used. Weather wear occurred over the entire process should be addressed in further studies, as well as the question if the roughness changes with increasing number of machined specimens.
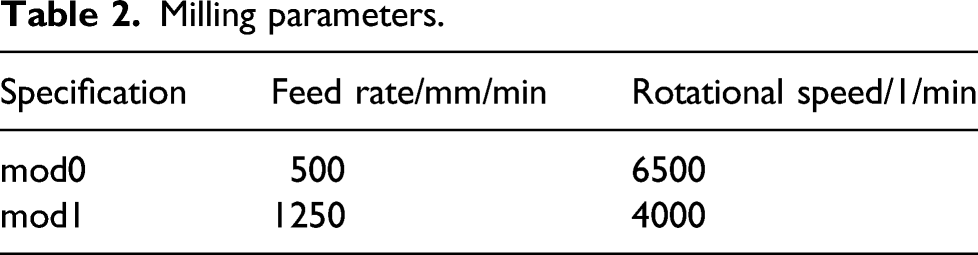
In preliminary milling studies rotational speed and feed rate were consecutively variated and the resulting surface roughnesses were analyzed. Results of those studies are summarized as follows. Keeping rotational speed constant and increasing the feed rate, average roughness and roughness depth are rising. On the contrary, increasing rotational speed and keeping the feed rate constant, average roughness and roughness depth both decrease. The effects of varying every single milling parameter are not subject of this study.
Milling parameters.
The BZ6 specimens were milled one-at-a-time. The UD plates were inserted with limit stops to ensure the same position of the plate relatively to the milling bed. Loose chips were removed manually, no blade was used to keep the surface and edges unchanged.
The milling process was partially monitored by a thermal camera (FLR Thermal CAM E45) in order to study the temperature development in the milling zone. The highest recorded temperature was 110.9 °C, which is far below the critical melting temperature (datasheet of BASF with the test standard ISO 11357–1/-3: 223 °C) and the temperature of defection under a load of 1.8 MPa (datasheet of BASF with the test standard ISO 75–1/-2: 215 °C). Due to these results, it is planned to evaluate the effect of local temperature increase on possible thermal degradation of the polymer matrix in further studies.
Surface roughness measurement
Topography assessment is essential for gaining information about surface conditions, which was obtained here with optical triangulation method.
The sample roughness is deduced from 2D-scans with a scan length of 6 mm and the measurements for this work are recorded with a profilometer FTR MicroProf CWL 600. The scanning direction is longitudinal on the machined surface. The scan position was set to one third of the thickness to avoid possible inhomogeneities in the core, such as potential core layers with transversely oriented fibers. To avoid possible edge effects, special care was taken that the determined scan position was not too close to the edge. For the UD plates, preliminary studies showed that the roughness profile over thickness is homogeneous.
The average surface roughness 
The total height of the roughness profile is defined as roughness depth 
Local effects cannot be adequately resolved by the average roughness, whereas the roughness depth only shows those localities. Both roughness values are included in the discussion of results.
Uniaxial tensile test
The quasistatic tensile tests were executed on a servo-hydraulic Zwick Roell testing machine equipped with a 20 kN load cell at a constant velocity of 0.5 mm/min. Strain informations during tensile tests are evaluated with the optical gray scale correlation software VIC2D from Correlated Solutions®.
The strain correlation is based on the evaluation of subsequent deformation images of a gray scale pattern on the specimen. This random speckle pattern was applied on a black water-based primer coating with white spray paint. Its thickness is 10–20 μm. Images are recorded with 10 frames per second to determine characteristics such as break. To compare the mod0 and mod1 specimens, the following mechanical quantities are considered: true stress, logarithmic Hencky strain, and true rupture strain.
True strain values were extracted as the average logarithmic Hencky strain from the strain field of 6 mm x 6 mm on the specimen surface as evaluated by the VIC2D Software. This averaged evaluation method of the strain field does not precisely resolve local effects as failure. Alternatively, maximum strains could be evaluated, however, these would only determine effects on the specimen surface not necessarily corresponding to a possible crack initiation on the back side of the specimens or even inside the specimen. Alternative methods to evaluate failure strains and a detailed account on the homogeneity of the strain distribution on the specimens extracted from the UD plate should be considered in future.
True stress values were calculated with force data from the load cell and the present cross section.
Evaluation of failure
During tensile tests, the sample elongates until the failure point is reached, characterized by an instantaneous drop of force. We defined the rupture point as follows: The corresponding data to the last picture where no crack is seen. Bearing in mind that failure is controlled by localities, the maximum stress of the tension test is analyzed too.
To analyze the influence of surface roughness on rupture strain, the considered rupture strains are normalized by the average rupture strain of each extraction angle series.
Calculation of the normalized rupture strain 
Taking the addressed averaged strain field sears the local effects, but is nevertheless used. In case of crack initiation on the back side or even inside the specimen, there is no option with 2D gray scale correlation. So, using different methods to calculate the strain field should be considered in following research as well as the homogeneity of the considered strain field.
Results and Discussion
In the following, the novel UD plate´s FO is validated with the materials PBT GF 30 and PA GF 30 and compared with a MD plate´s FO made from PBT GF 30. Specimens for FO analyzes are extracted at the center point of both plates. To gain information about the FO distribution in the testing area of the UD plate, different positions are defined and analyzed for PBT GF 30 and PA GF 30. The average surface roughness parameters, calculated according to equation (1) and the roughness depth, calculated according to equation (2), as well as the mechanical parameters, calculated from equation (3), are compared for different extraction angles of unidirectionally oriented specimens.
Validation of Fiber Orientation
To examine whether the UD plate has a satisfactorily high FO in the testing area, the injection molded plates of both materials, PBT GF 30 and PA GF 30, are studied. Additionally, a MD plate made with PBT GF 30 is analyzed.
As a measure of the FO, the diagonal elements of the second order tensor of the FO distribution in the plate´s reference system are shown in Figure 3. The two diagonal elements Comparison of simulated and μ-CT–measured fiber orientation for PBT GF 30 for the multi-directionally plate (green) and UD plate (pink). For PA GF 30, tensor components are shown for the UD plate. All plates are represented with their second-order fiber orientation tensor component 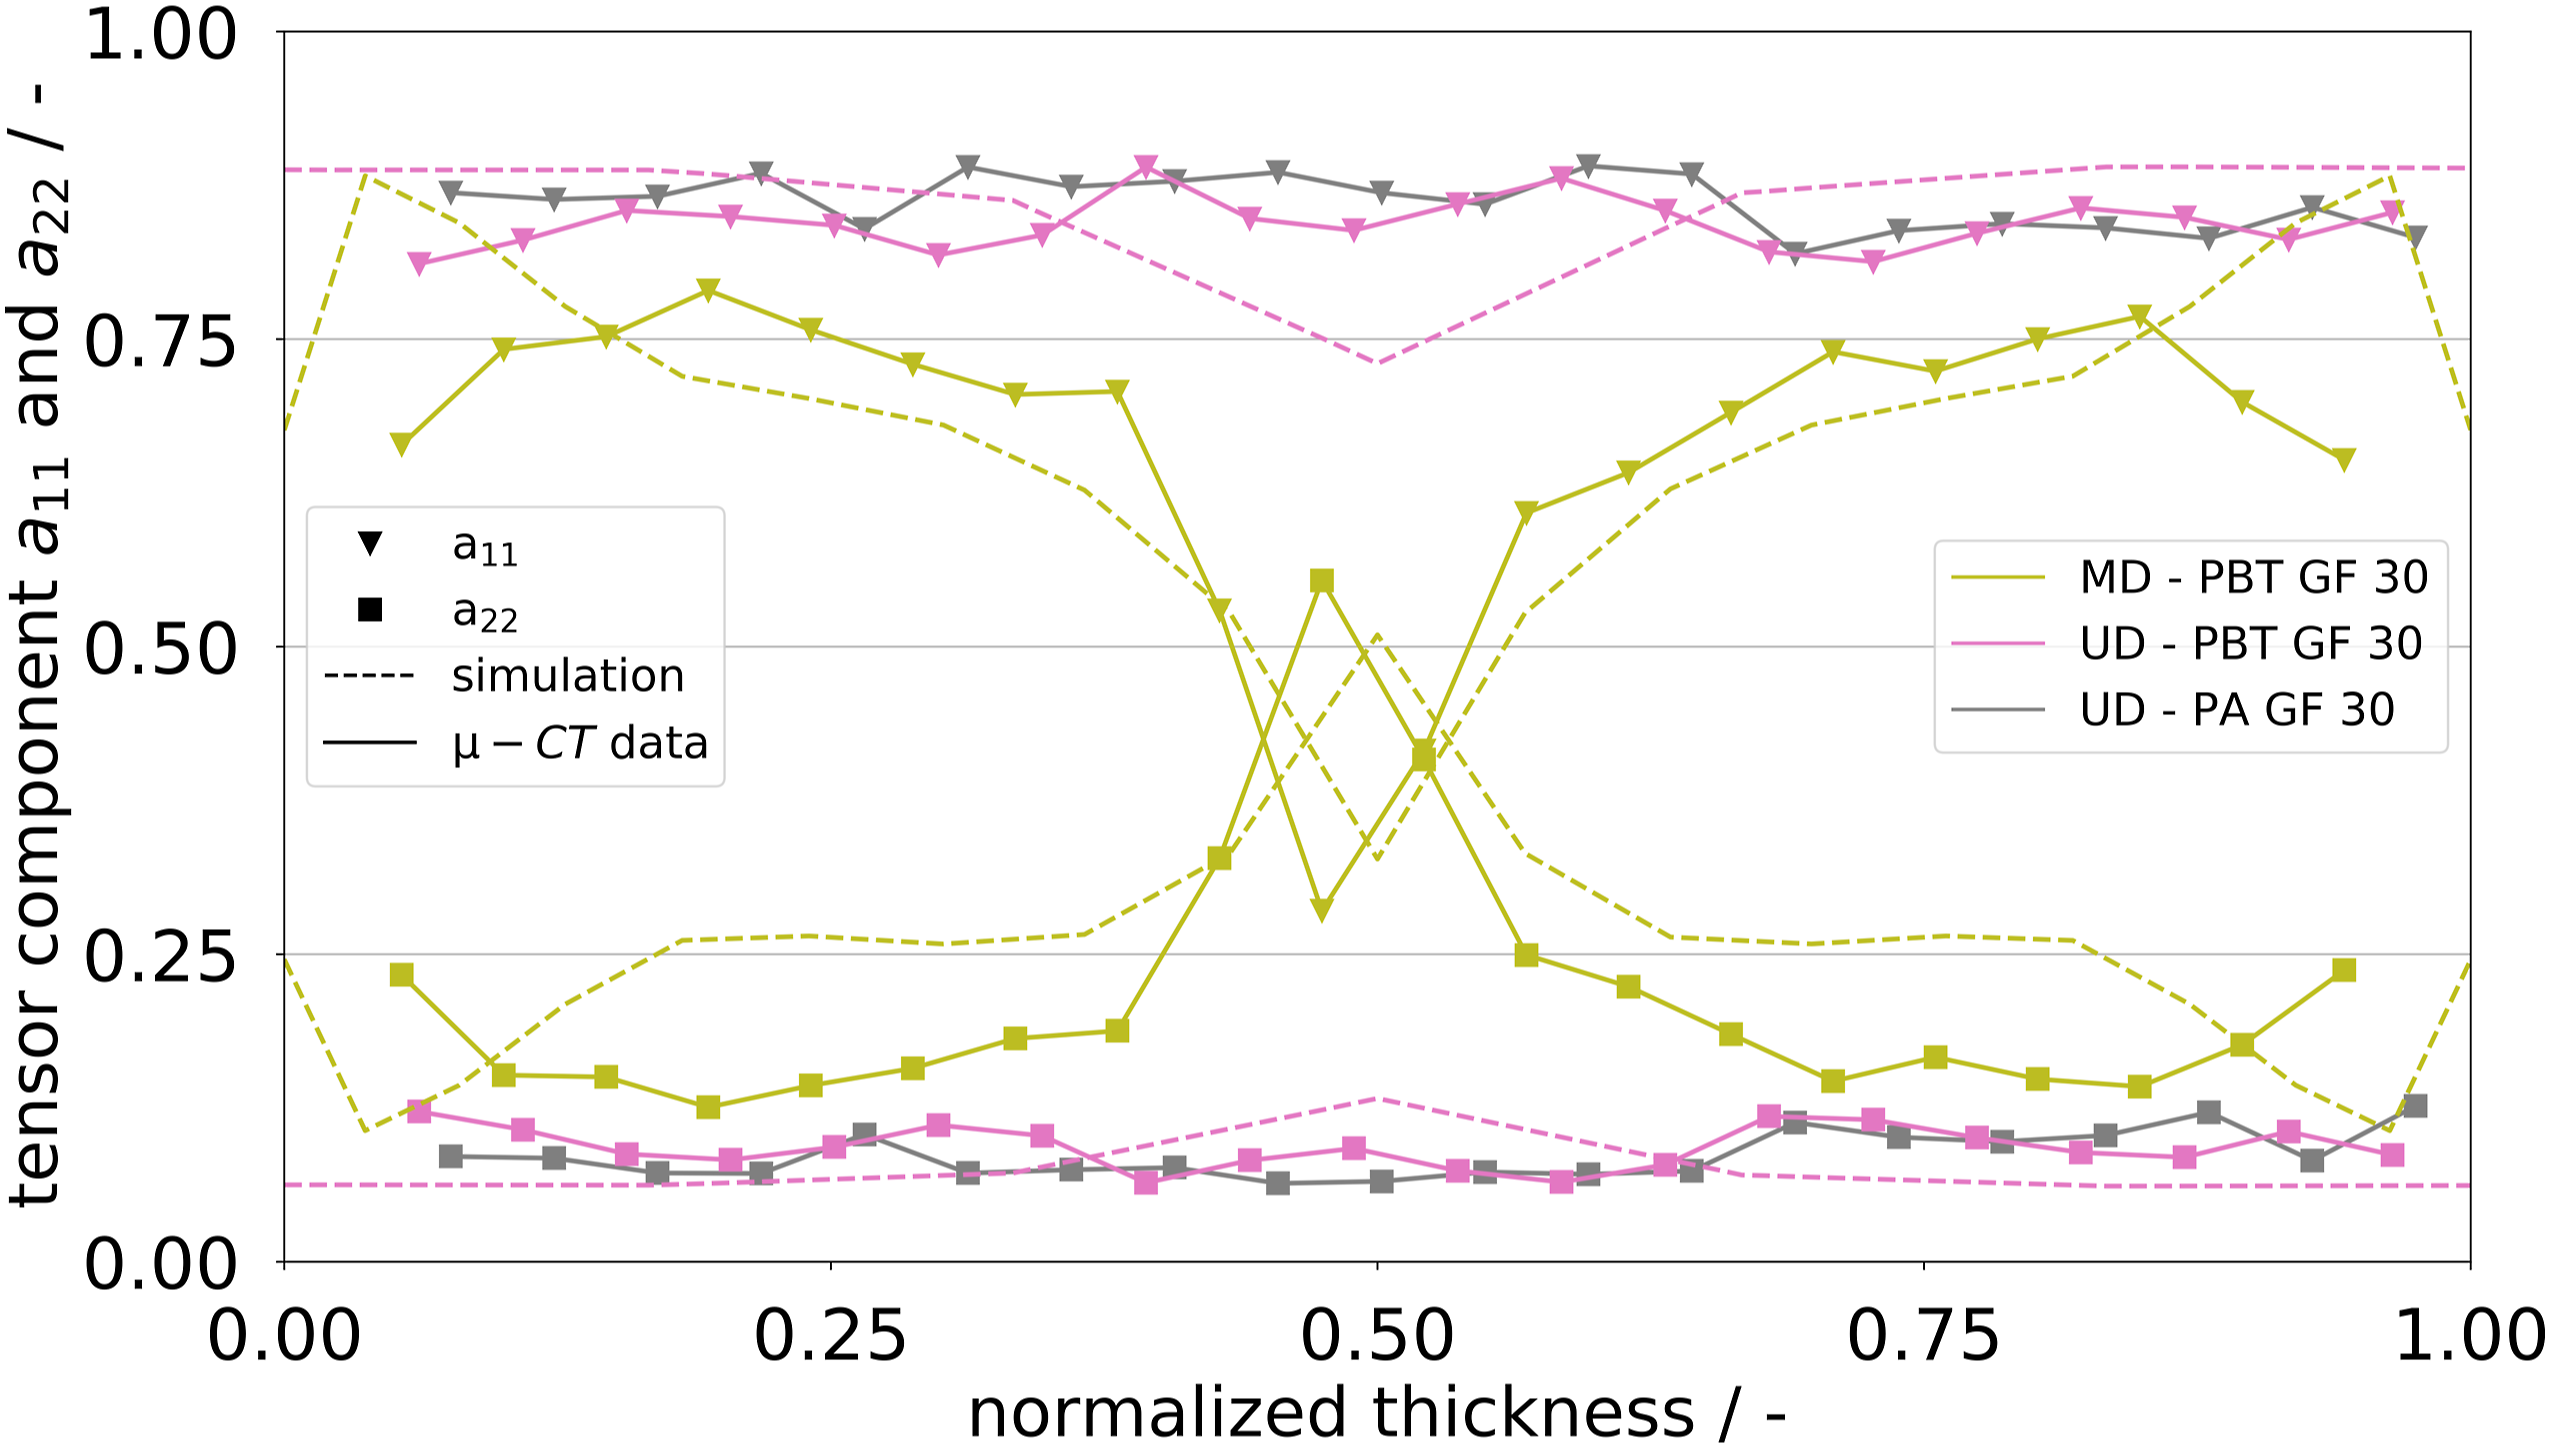
The component
Figure 3 shows both, the measured μ-CT data and the simulated data for the center point. The experimental results correspond to the simulated FOs. For the MD specimen (green), the fibers are oriented in layers (thickness ∼ 30 % each) toward the specimen surface, while in the core layer an orientation predominantly orthogonal to the filling direction, corresponding to y-axis, occurs (
To prove unidirectionality across the entire region, four representative regions in the testing area were additionally defined and evaluated with μ-CT (cf. Figure 4). The positions P1 and P2, located halfway of the testing area, show very similar FO to the center point. The eccentric positions P3 and P4 show low losses in FO ( Comparison of μ-CT measured FO for PBT GF 30 and PA GF 30 at four representative positions.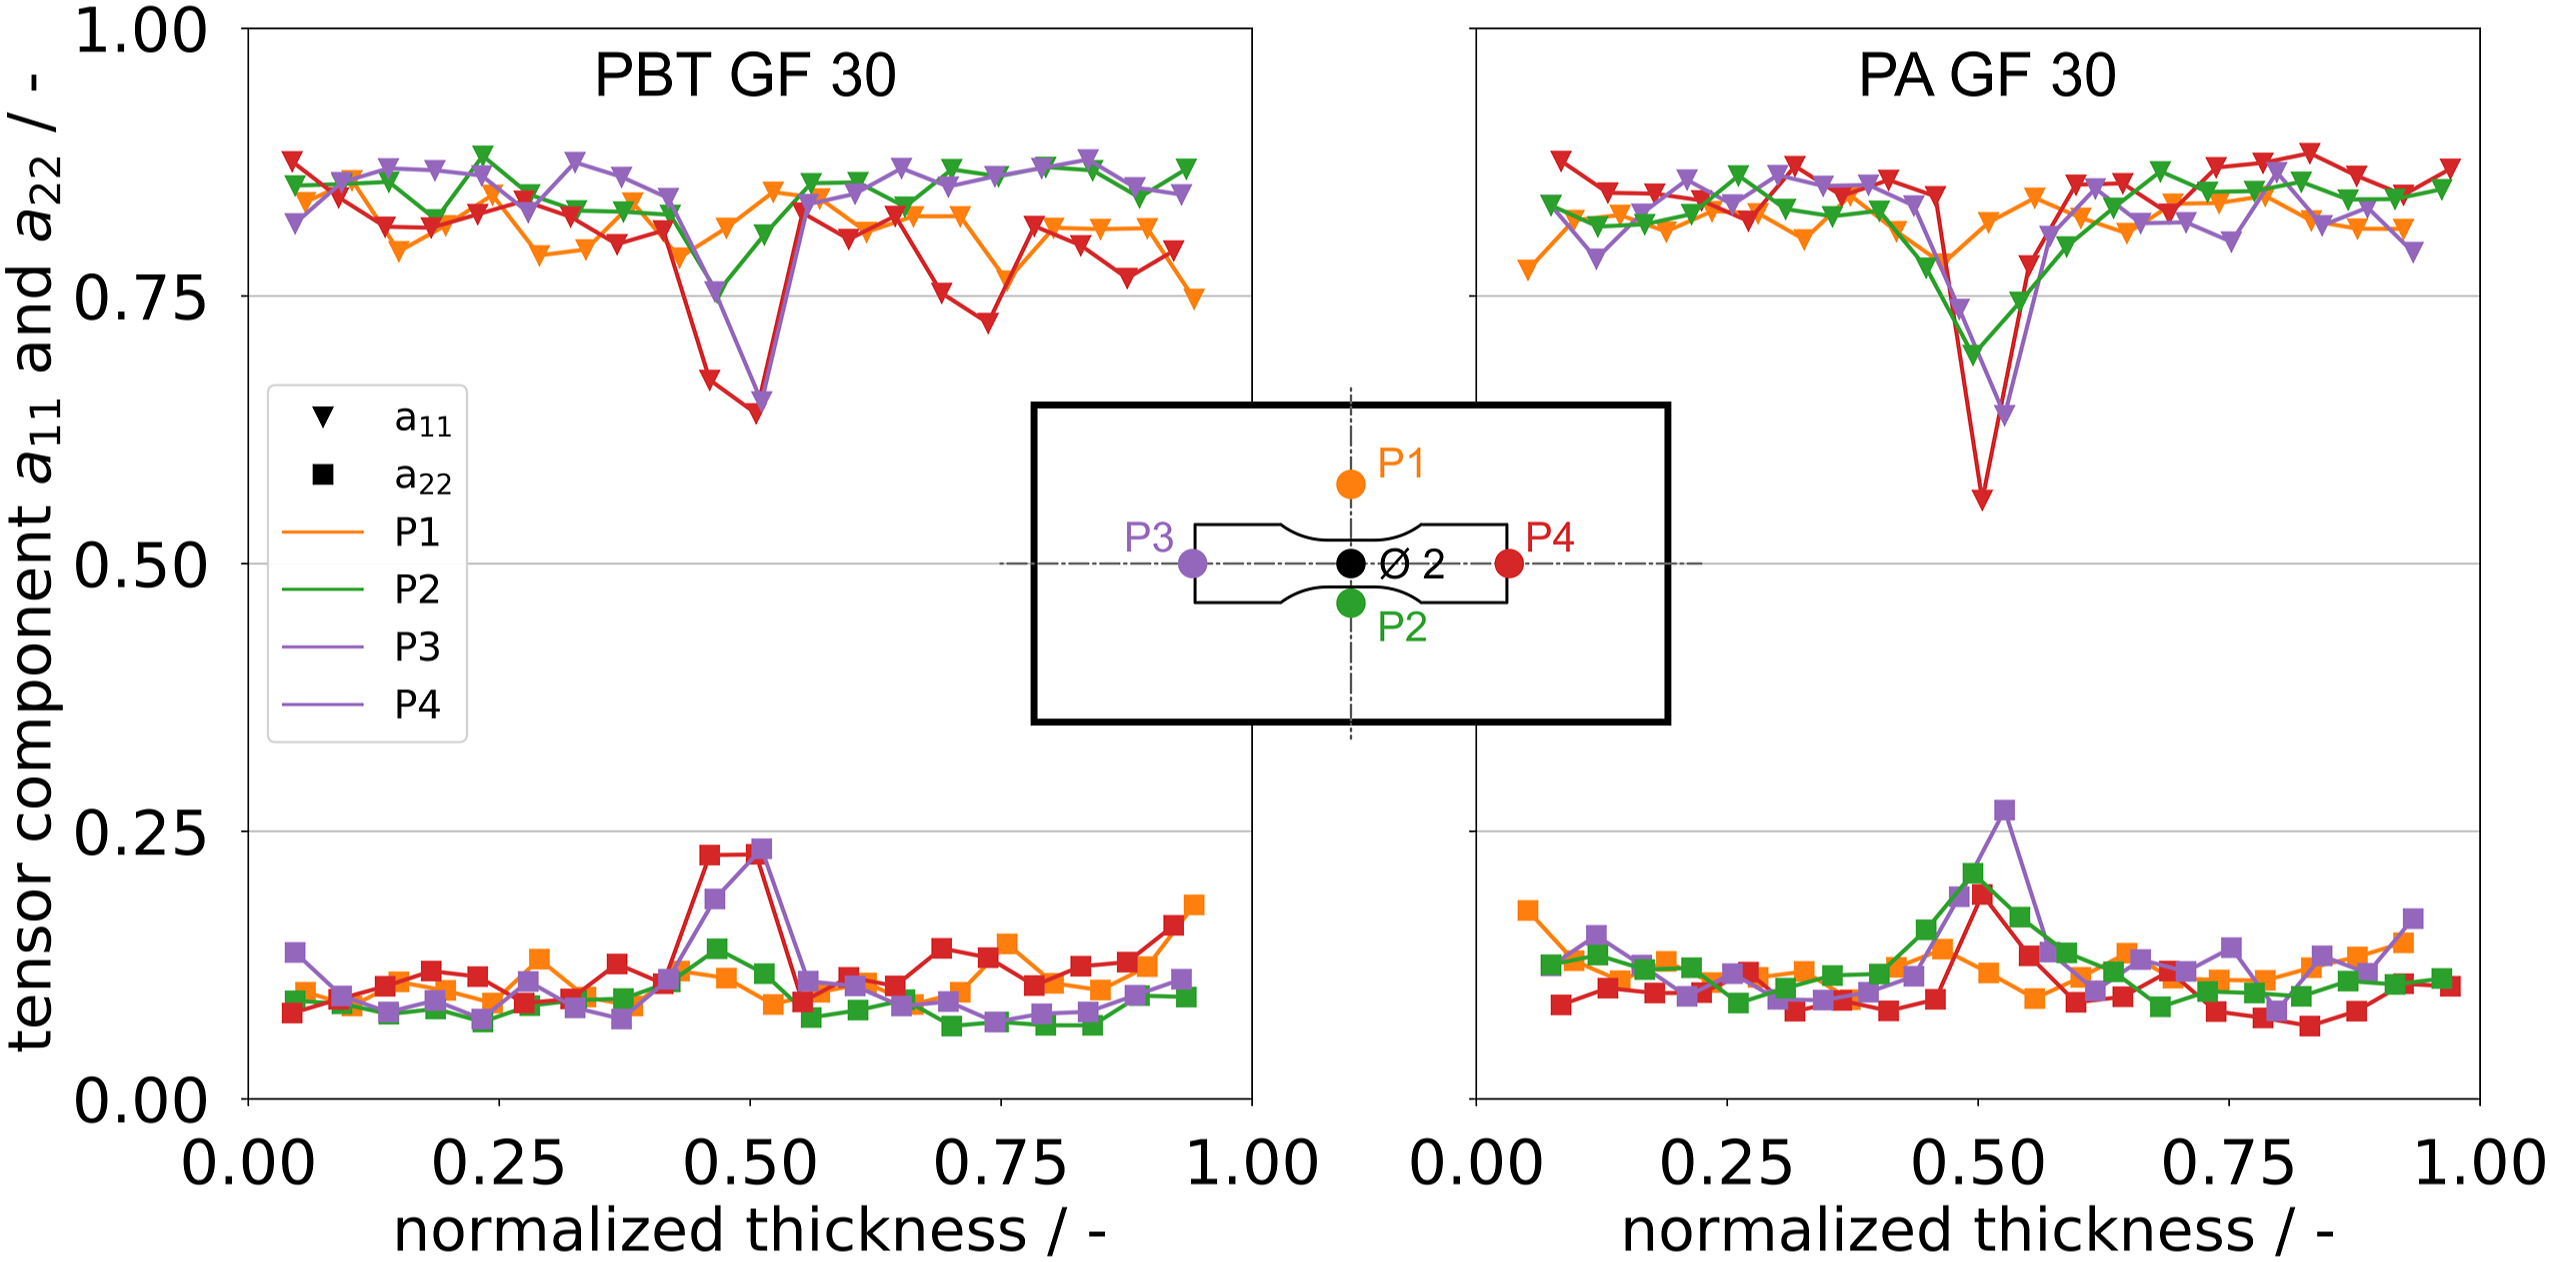
It can be stated that the core layer is absent in the testing area of the samples extracted from the UD plates. These results clearly illustrate that our new injection molded plate meets the requirements discussed above.
Surface roughness
To identify a suitable parameter set for a rough sample surface, we compared the topography of the mod0 specimens and samples produced with our new mod1 parameter set.
Figure 5 shows the average roughness and roughness depth of mod0 and mod1 specimens made from PBT GF 30 for various extraction angles of the respective specimen. Average surface roughness and roughness depth for various extraction angles of PBT GF 30 for mod0 and mod1 specimens.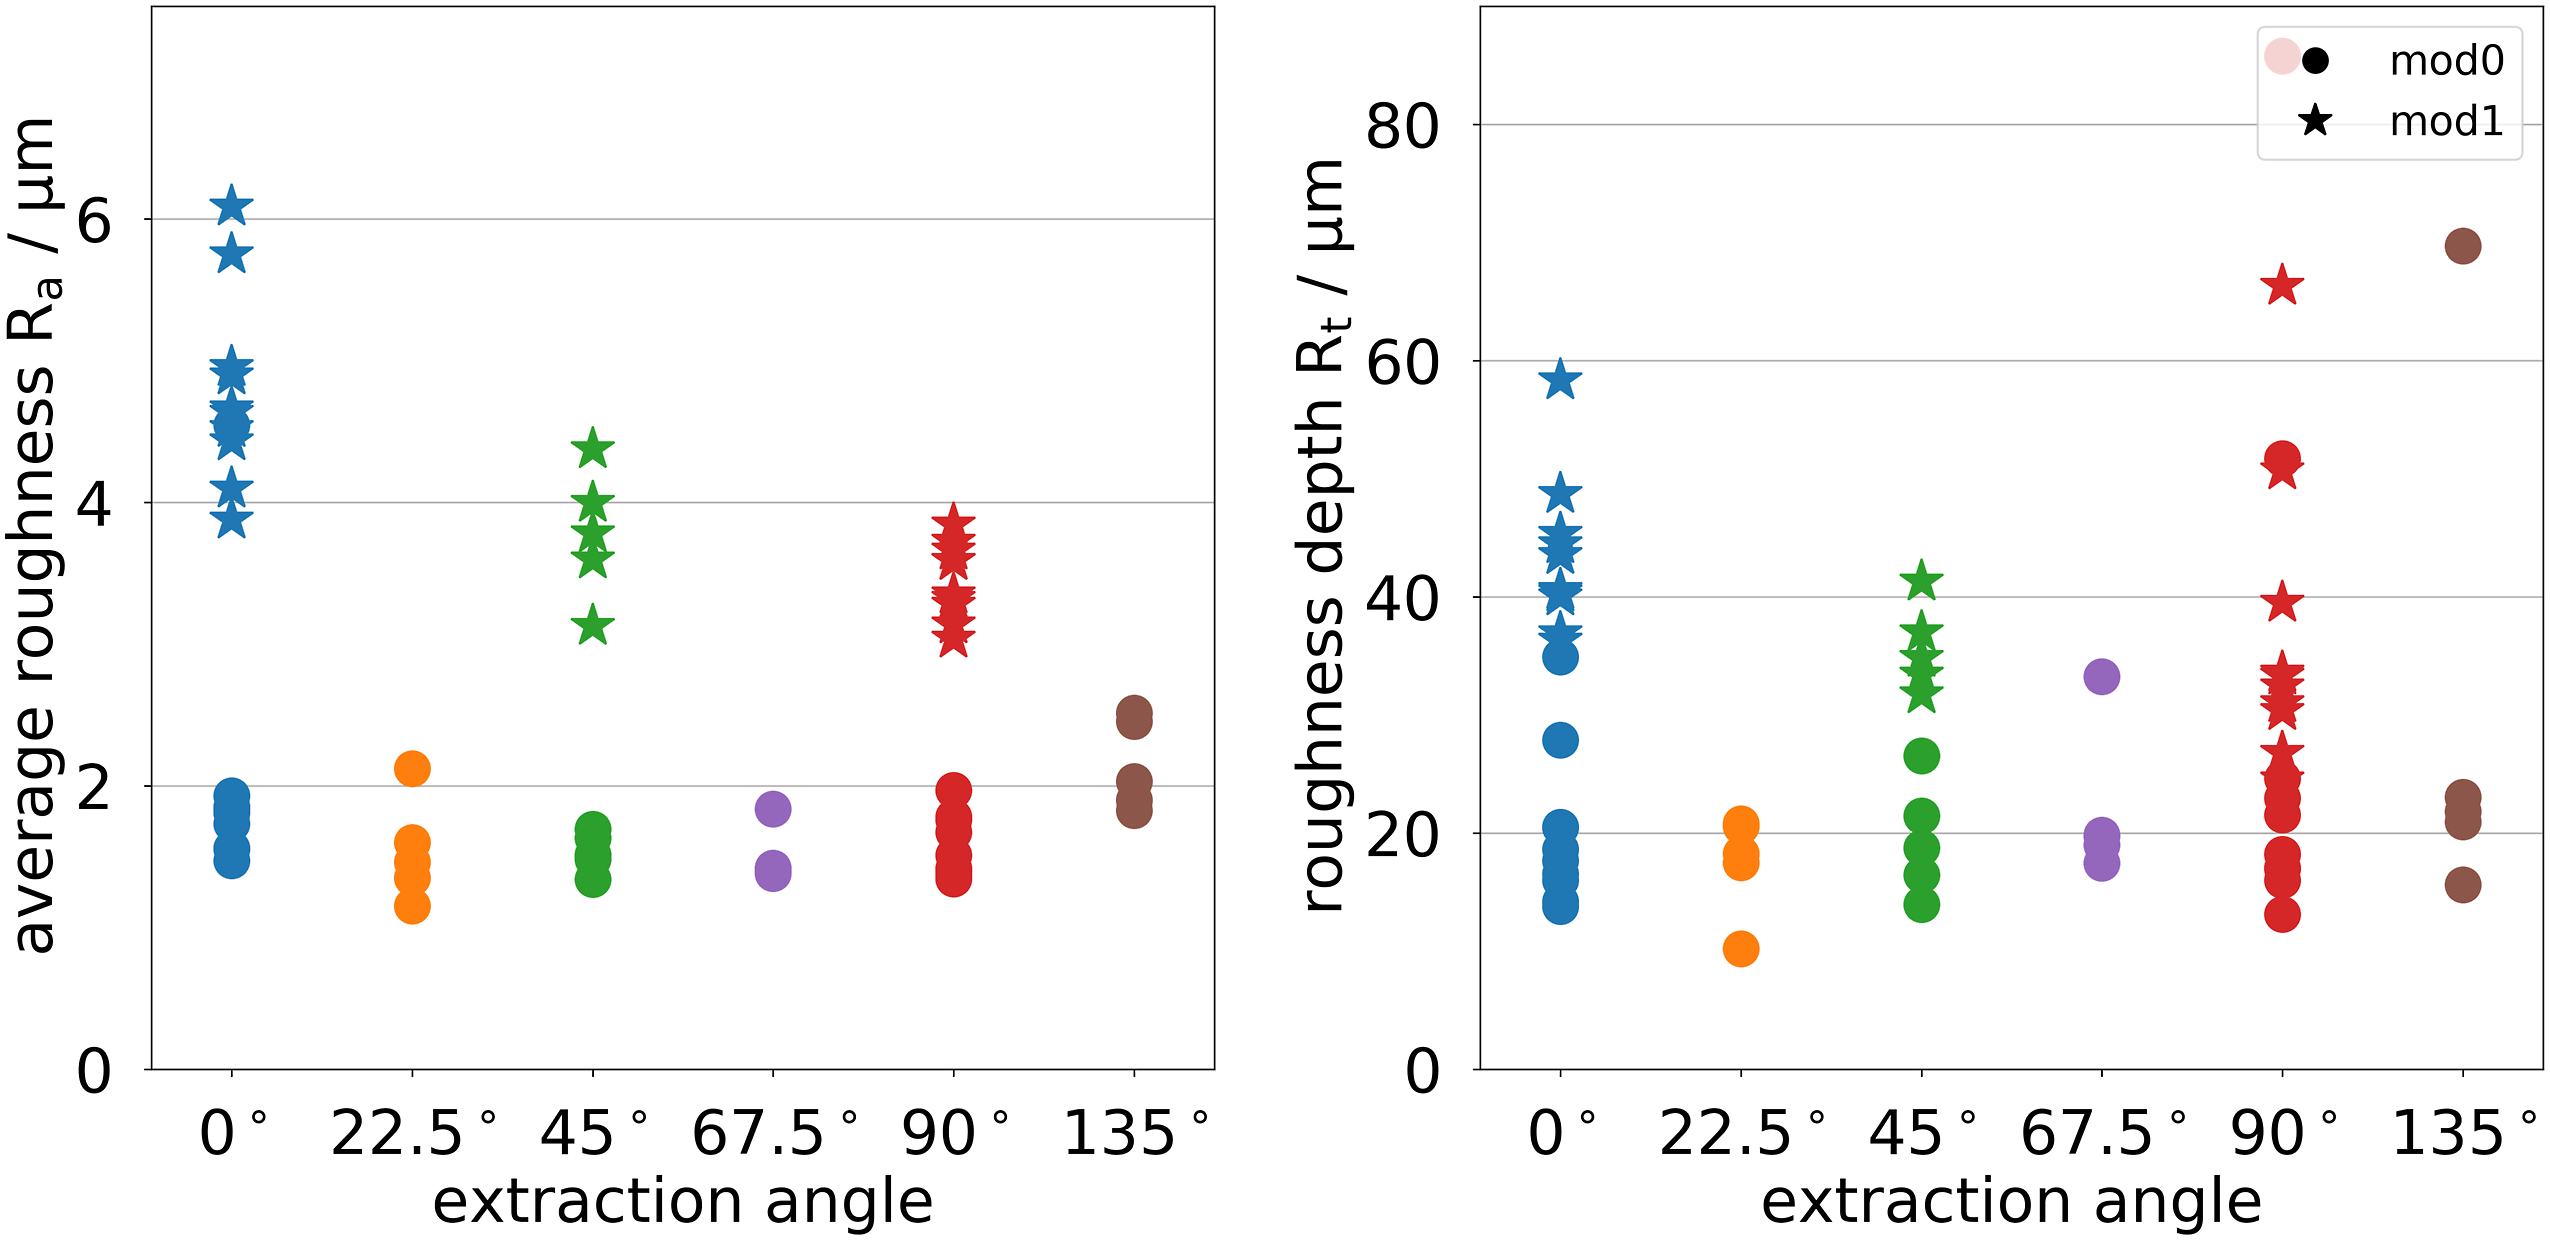
Considering the average roughness, for mod0, the mean roughness for all extraction angles ranges between 1 and 2 μm, only for 135° values are slightly higher. In contrast, the roughness of mod1 specimens shows a clear dependence on the extraction angle. The average roughness of mod0 specimens seems not to depend on the extraction angle, whereas the average roughness values of mod1 specimens seem to decrease with rising extraction angle. Comparing the average roughness for 22.5° and its symmetry partner 67.5°, the roughnesses are in the same range. In contrast to this, the 45° specimens show lower average roughnesses for mod0, than its symmetry partner 135°. This could result from the reversed rotation of the cutter relatively to the specimen´s FO, which should be taken into account in further studies.
Considering the roughness depth for mod0, the mean depth for all extraction angles ranges between 15 and 25 μm. The mean depth for mod1 specimens is generally higher. Moreover, the mean roughness depth for mod1 specimens seems to be highest for 0° specimens. For 45° and 90° specimens, both are at the same height and statistically indistinguishable.
For both roughness values it can be noted that mod1 surface roughness is relatively higher than mod0 surface roughness.
Figure 6 shows the average roughness values and the roughness depth of PA GF 30 specimens, indicated with color code for the main extraction angles and milled with mod0 parameters. In this figure, the scatter of the average roughness values for 0° is clearly higher than the scattering for 90°. The mean average roughness and mean depth for 90° specimens seem to be lower than the mean depth for the 0° specimens. Average surface roughness and roughness depth for the main extraction angles of PA GF 30 for mod0 specimens.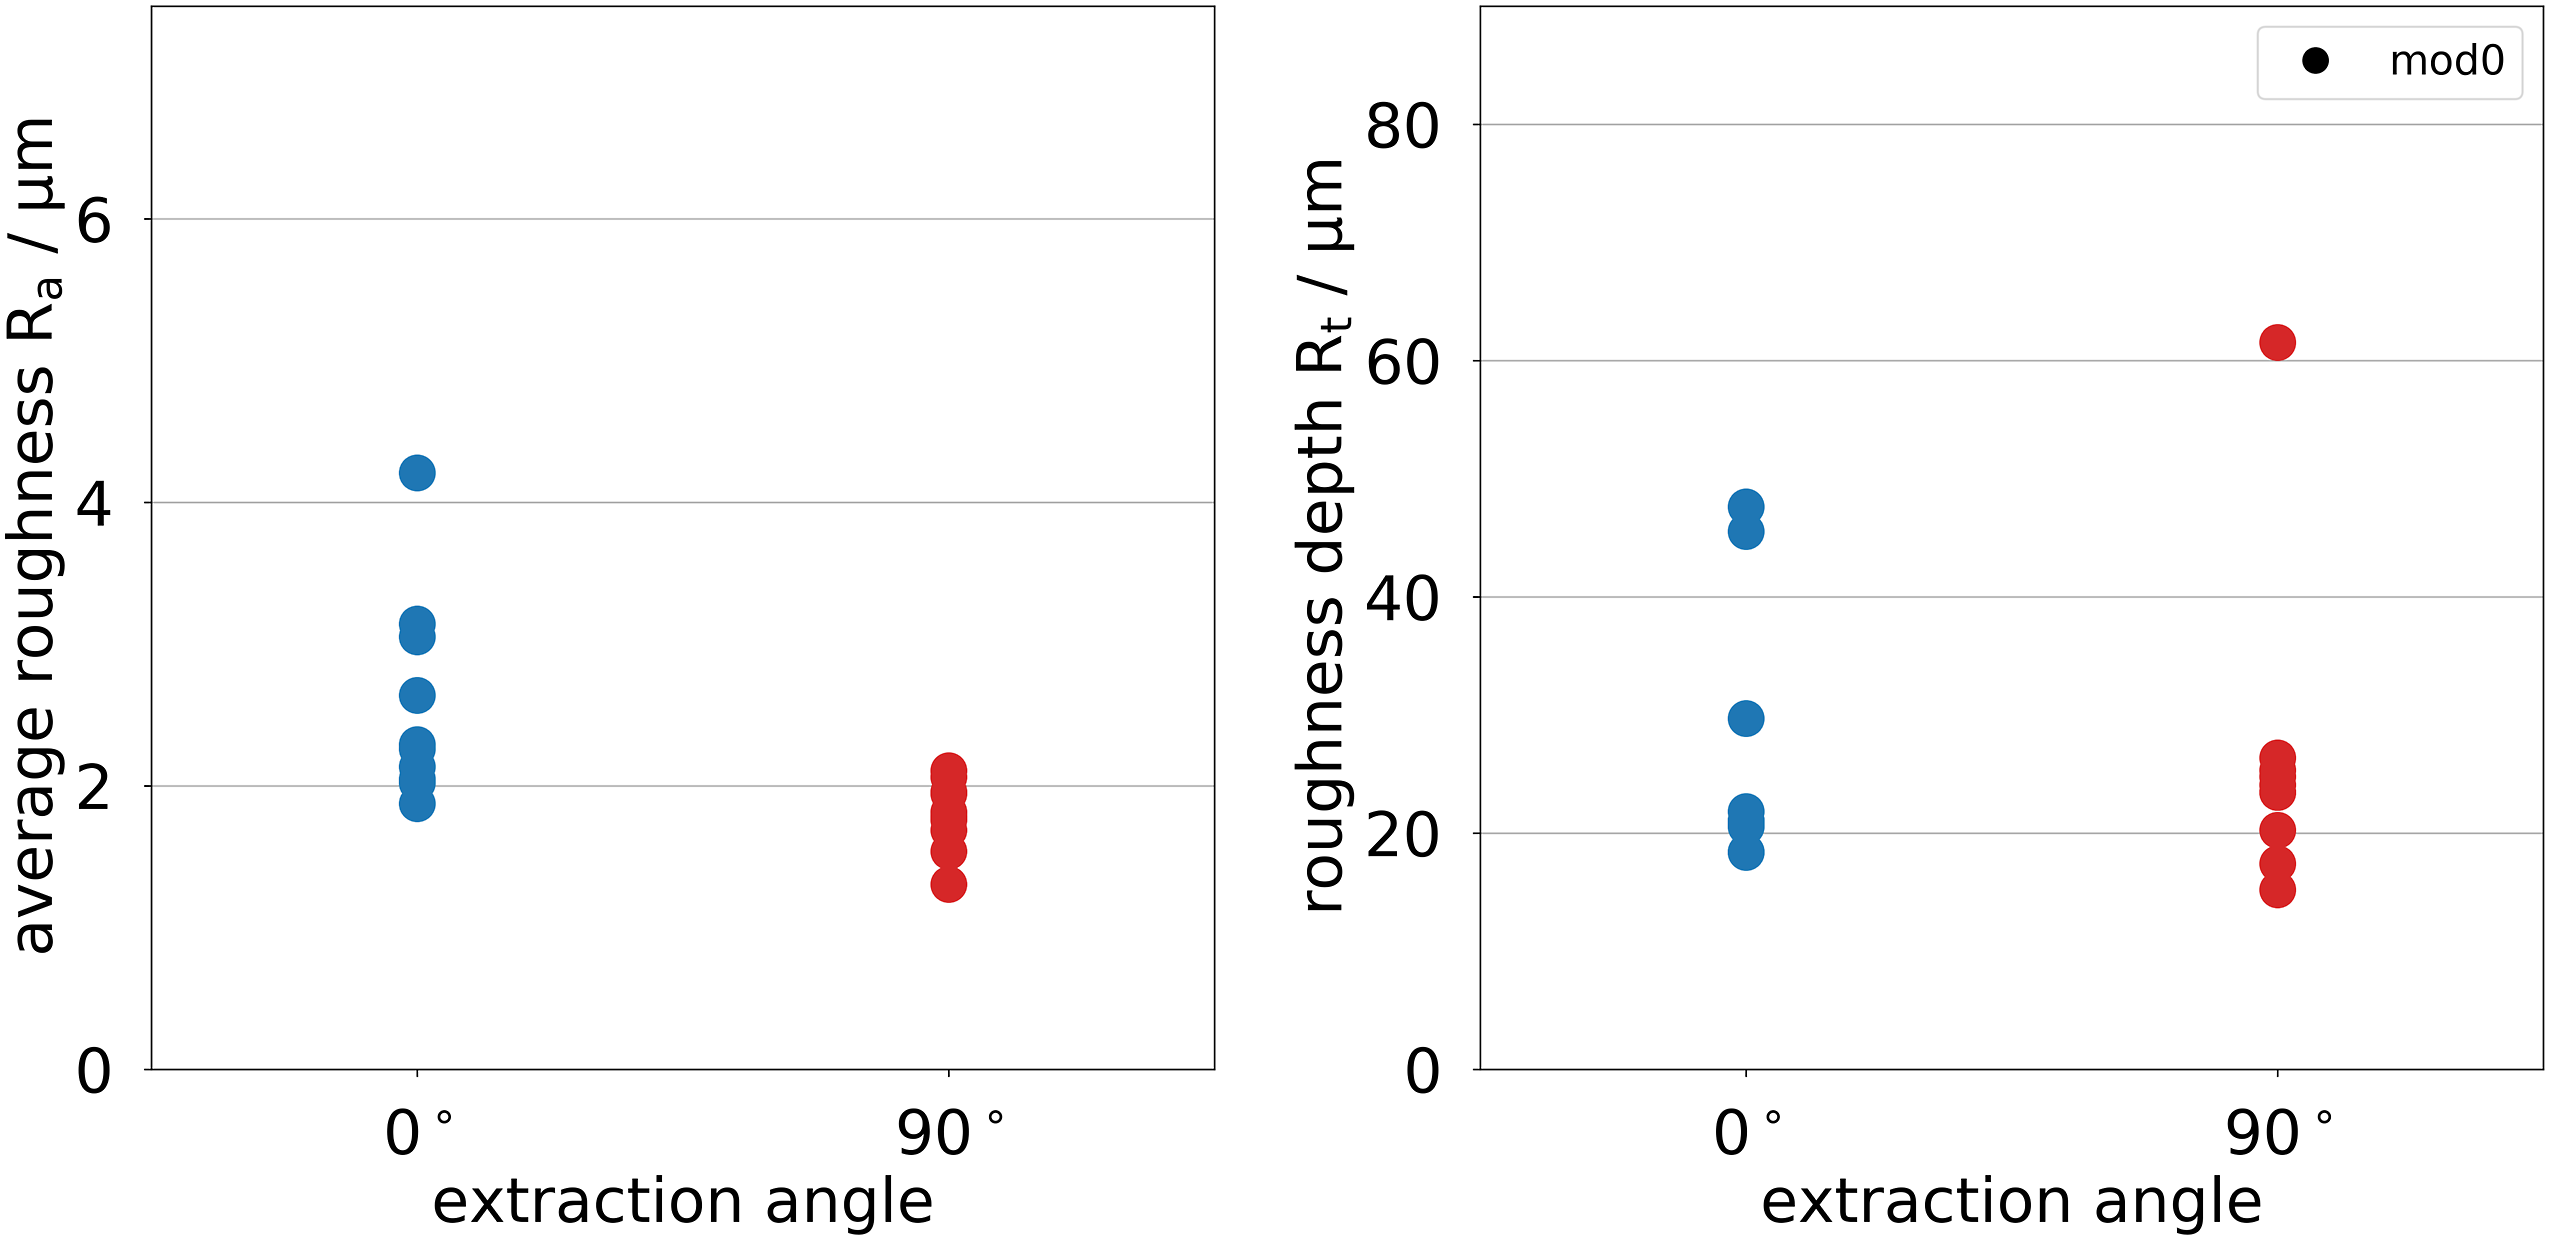
Comparing the average roughness values of both materials, differences can be found for the extraction angle of 0°. The roughnesses of PA GF 30 are between mod0 and mod1 values of PBT GF 30. For 90°, both roughness values are in the same range. Considering the roughness depth for both materials, both seem to be comparable. Both average roughness analyzes have in common that 0° specimens show a generally higher surface roughness than the 90° specimens.
By adjusting the milling parameters as feed rate and rotational speed, different roughness levels for PBT GF 30 can thus be achieved. The influences on the mechanical response are studied in the following.
Mechanical response
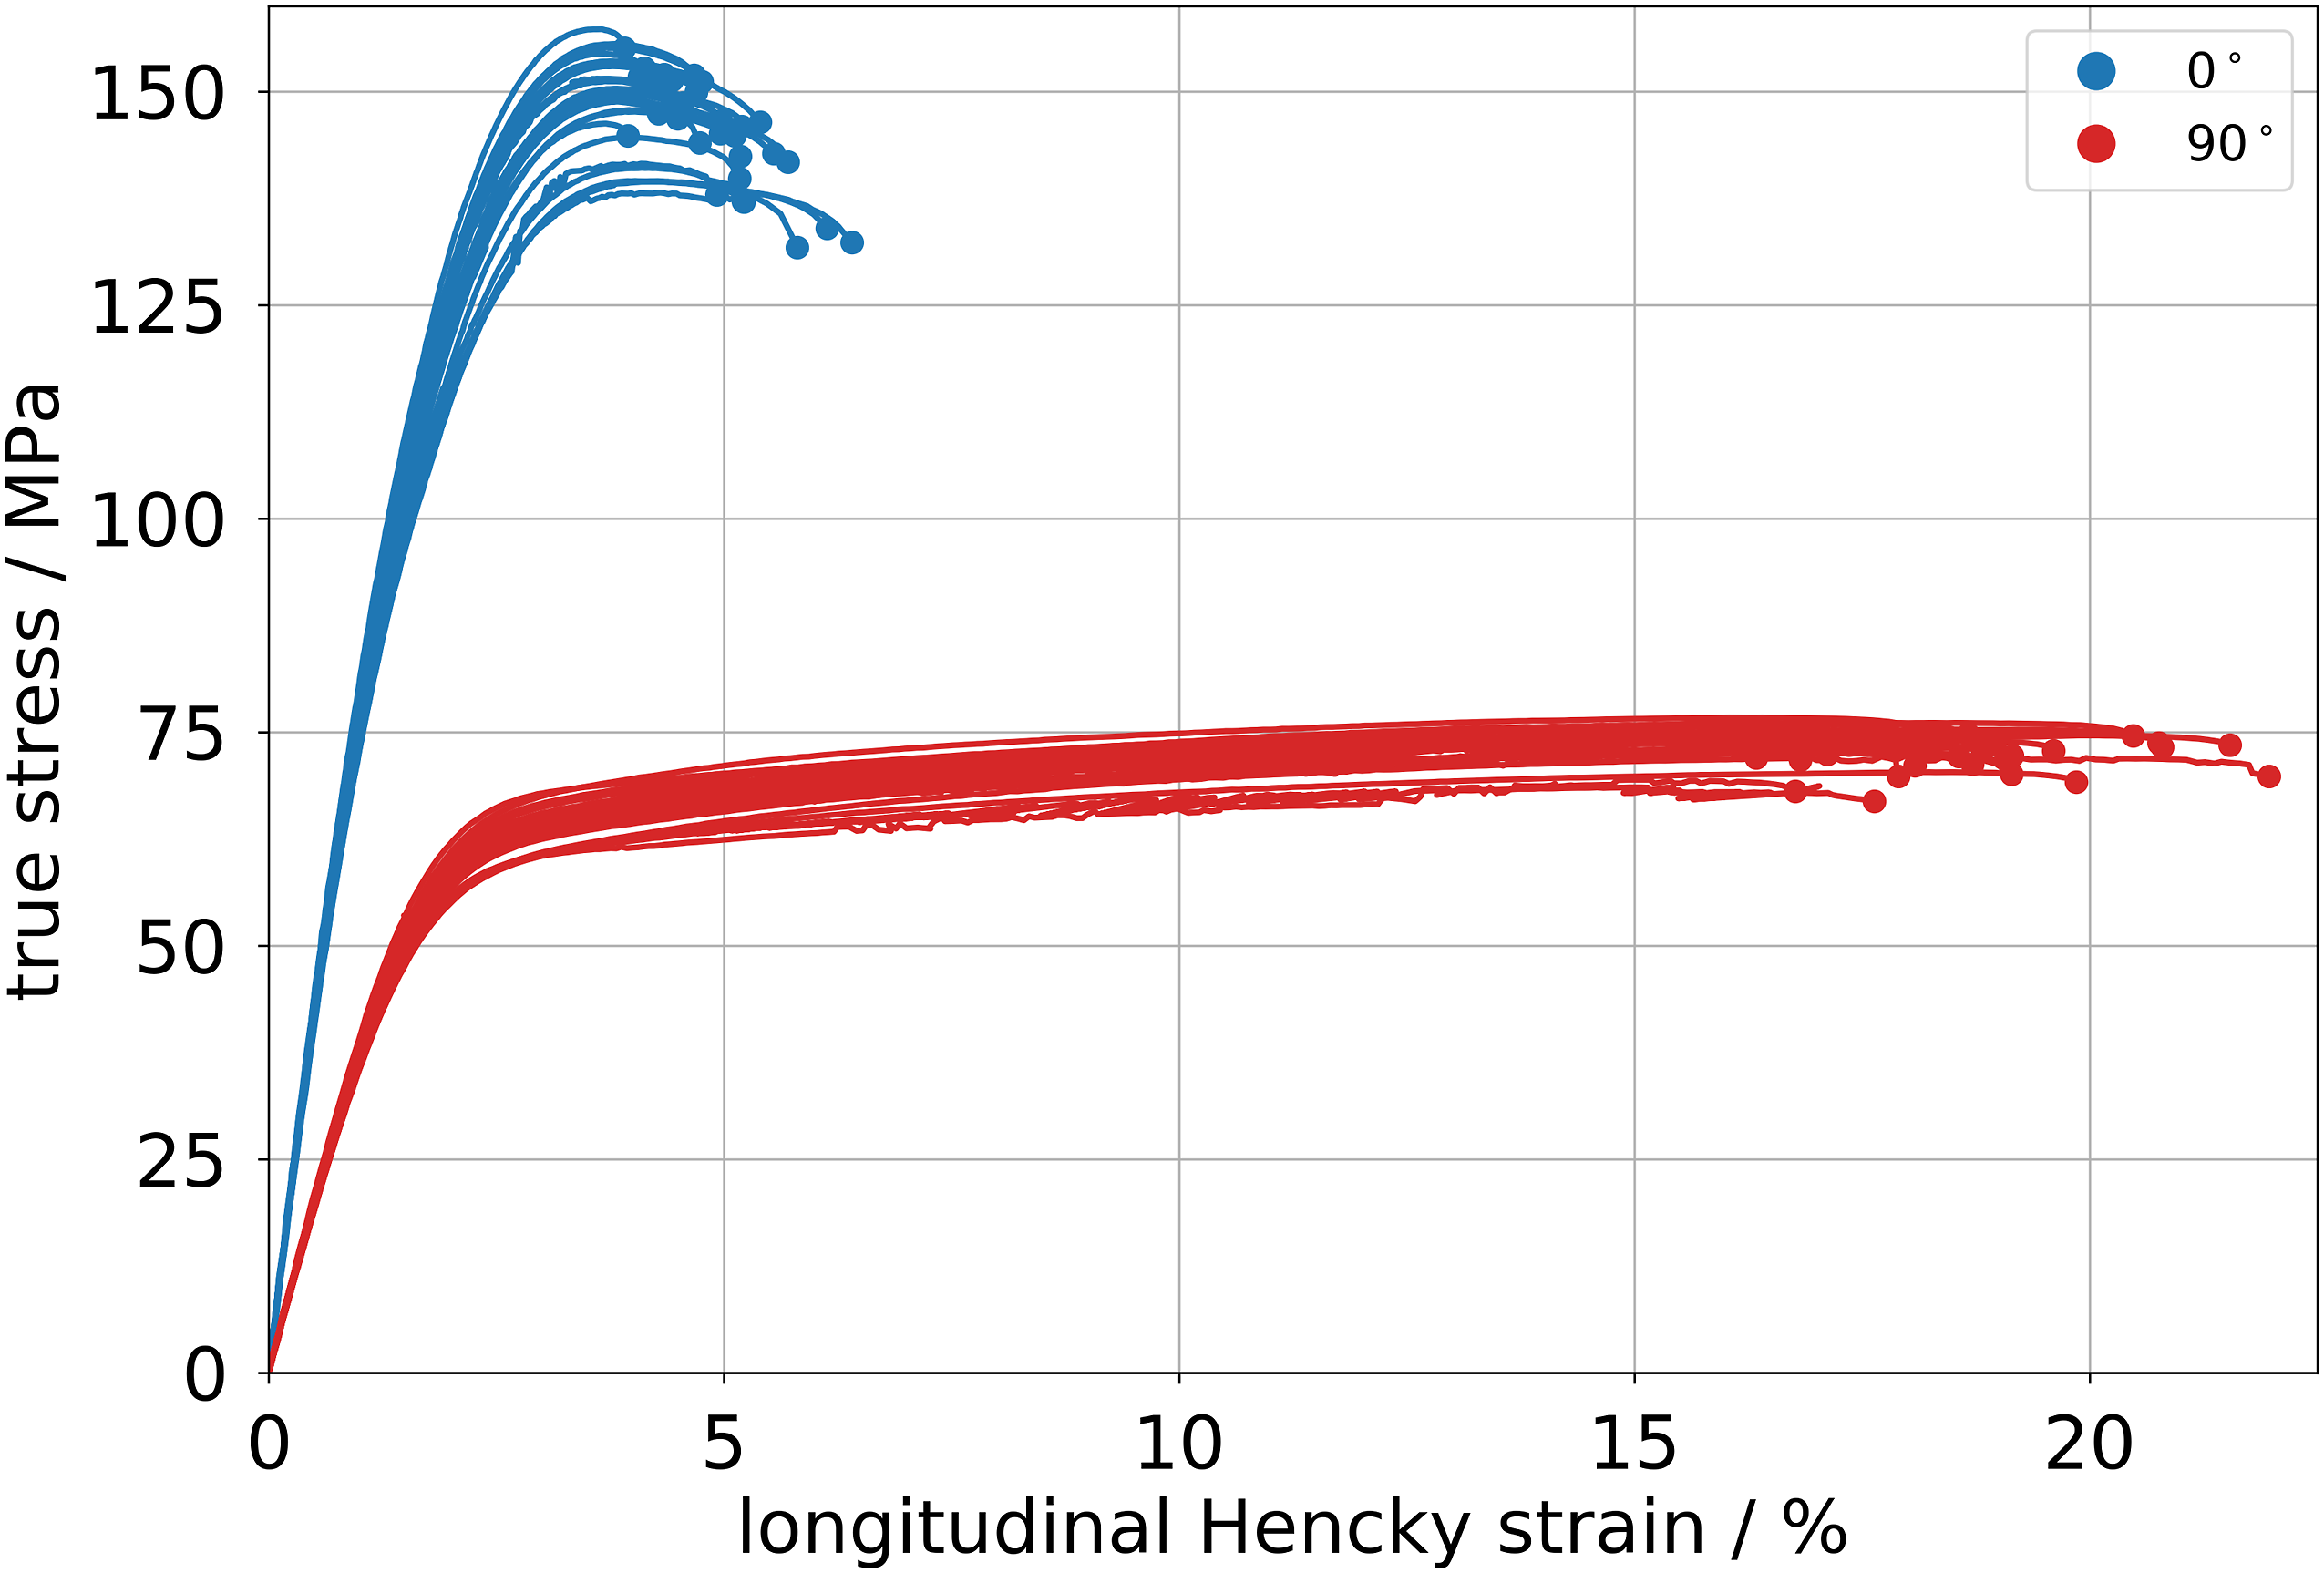
In Figures 7 and 8 the mechanical results for UD specimens made from PBT GF 30 and PA GF 30 are shown as true stress over longitudinal Hencky strain curves. For all measurements, the rupture strain is marked by a data symbol (star or circle). In order to evaluate the deformation limits, a vertical line indicates the average failure strain and a horizontal line the average maximum stress for each setting. True stress over longitudinal Hencky strain curves of PBT GF 30 for mod0 and mod1 specimens with 0°, 22.5°, 45°, 67.5°, 90°, and 135° extraction angle. For all series, the mean rupture strain is displayed with a vertical line and the mean maximum stress by a horizontal line. Solid lines indicate mod0, dashed lines indicate mod1. True stress over longitudinal Hencky strain curves of PA GF 30 for mod0 specimens with 0° and 90° extraction angle.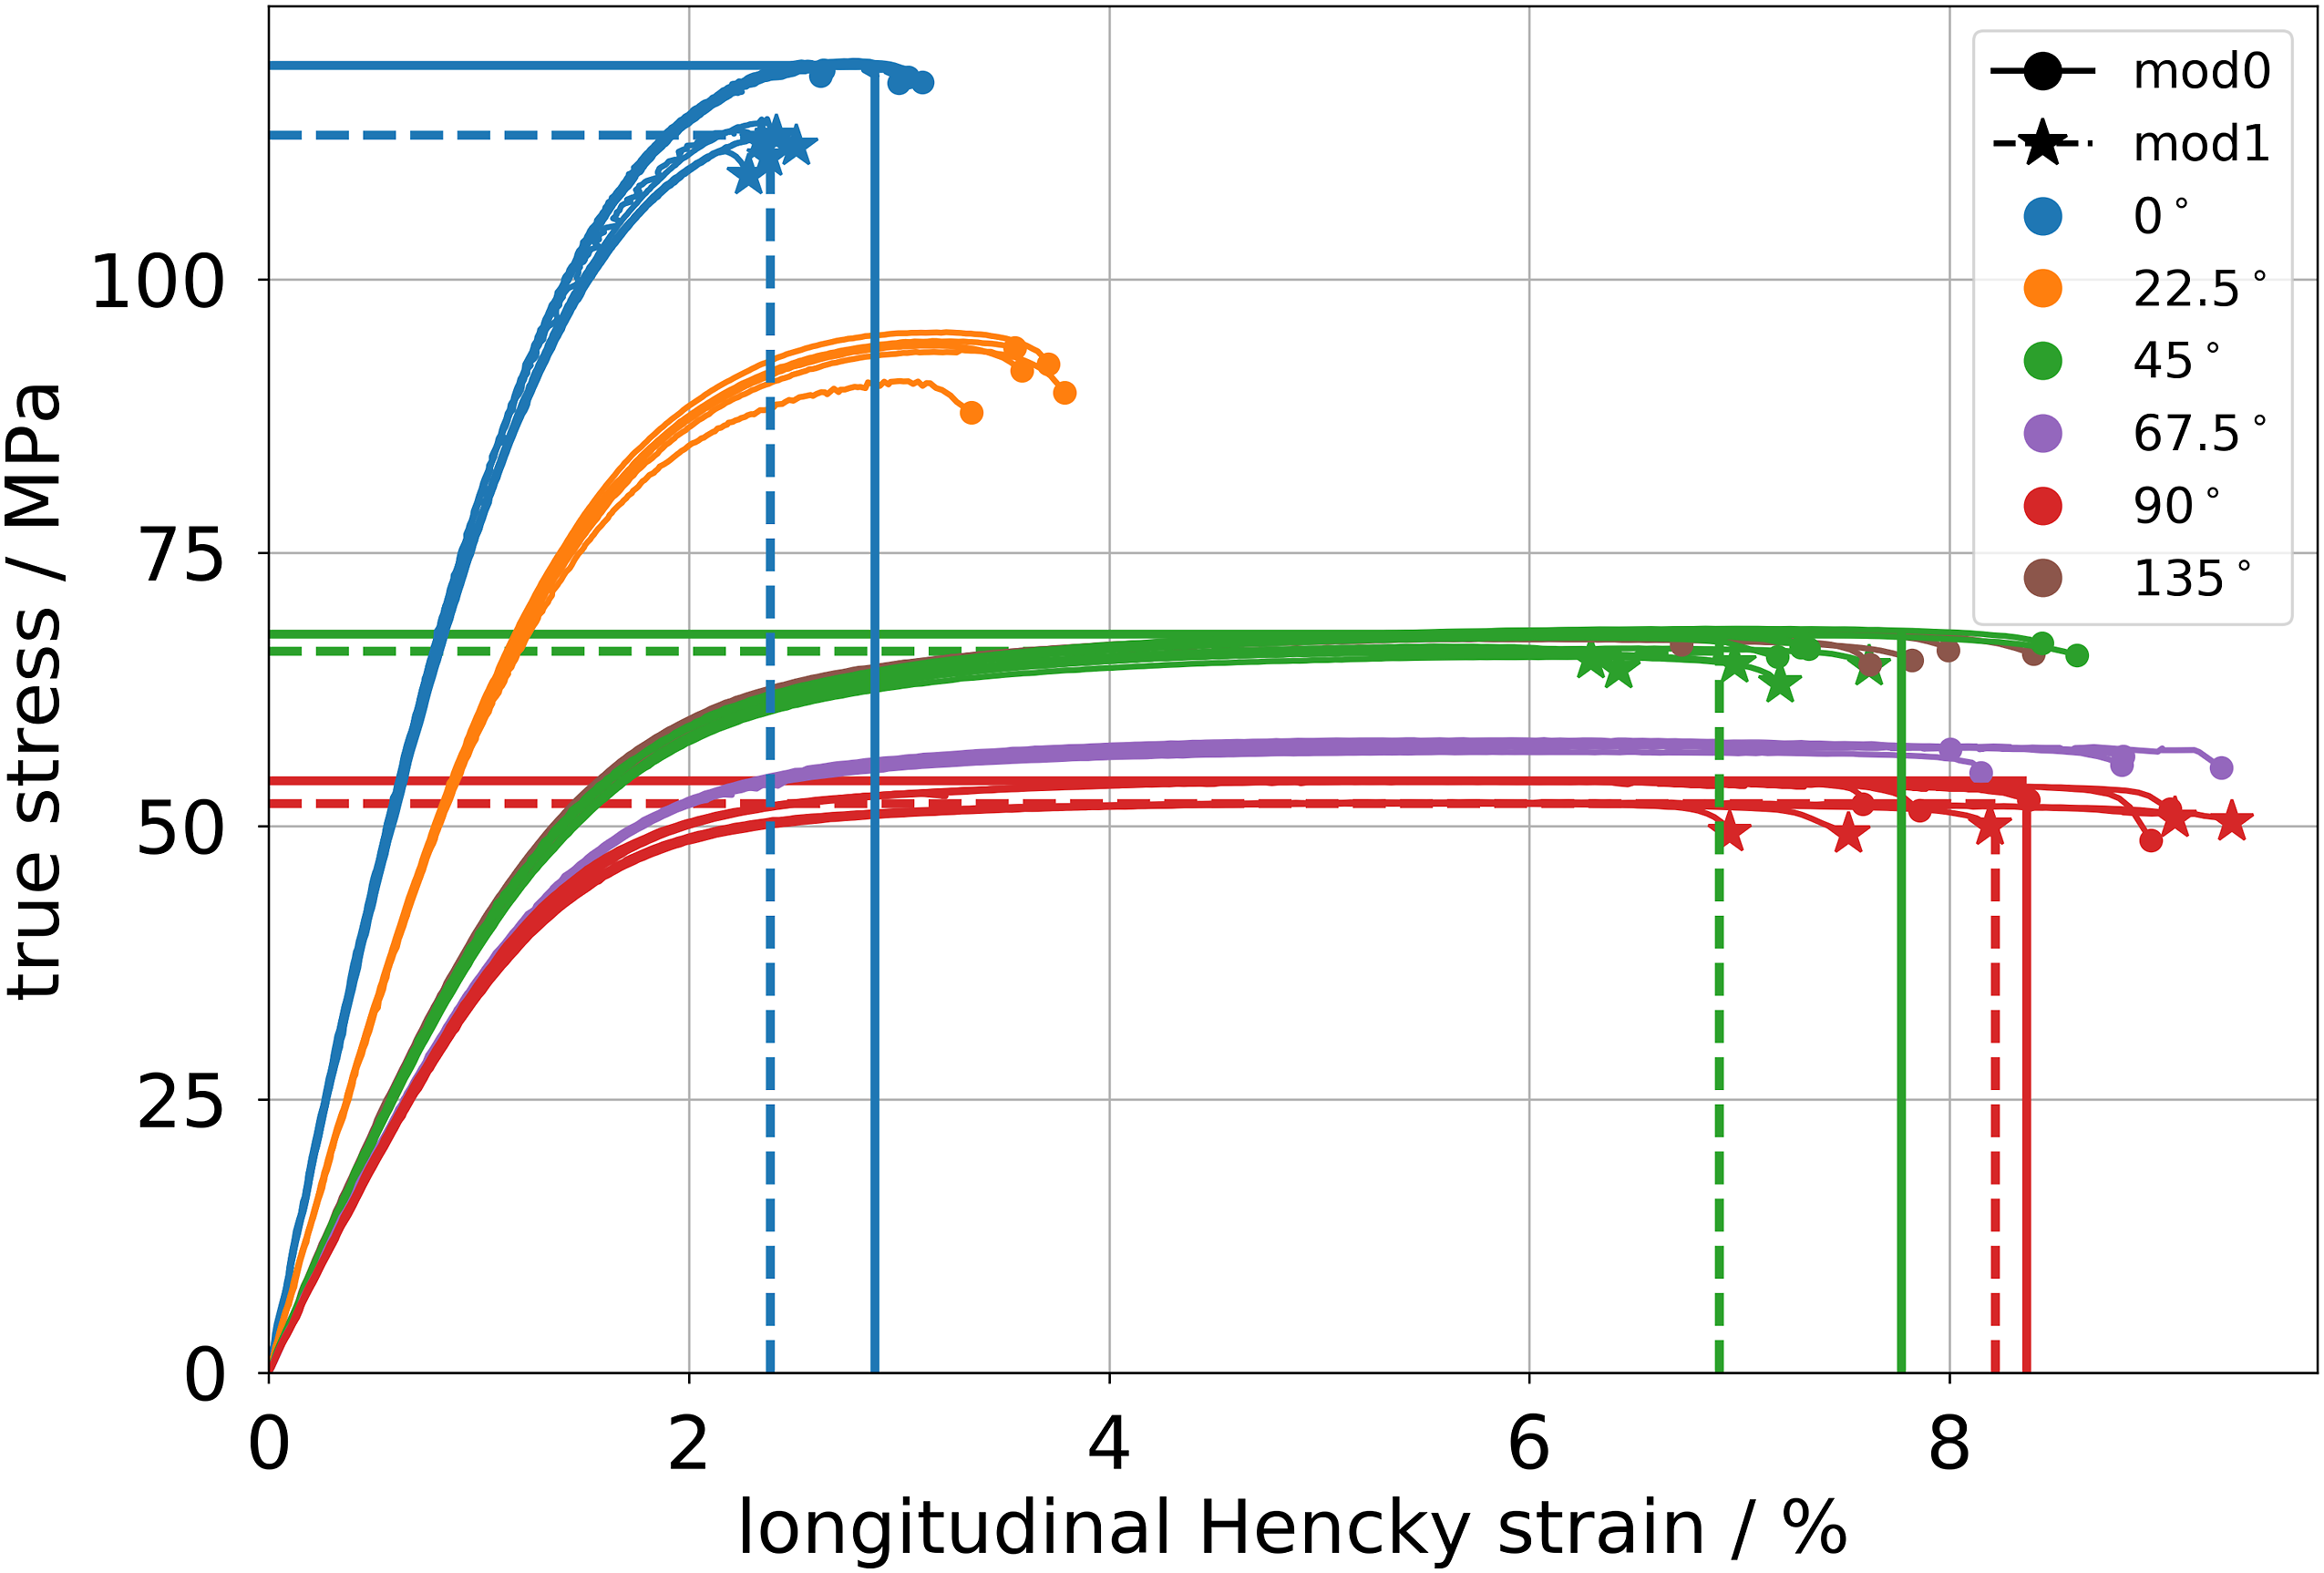
The linear-elastic area seems to be similar for all extraction angles, whereas the slope differs for each. With a changing extraction angle from 0° to 90°, material strength is decreasing, whereas the deformation capability increases if the load is applied orthogonally to fiber direction (90°). The results of 45° extraction angle are comparable to the ones of 135° because they have the same relative orientation with respect to the fiber direction.
If mod0 and mod1 stress–strain behavior is compared, it can be found, that the averages of both, mod1 maximum stress and mod1 rupture strain are lower than the values for mod0, respectively. The rougher surface of the mod1 specimens seems to favor an “earlier” failure, which leads to lower maximum stress and lower rupture strain.
PA GF 30 (cf. Figure 8) shows a qualitatively similar behavior to PBT GF 30 regarding the influence of extraction angles.
Influence of surface roughness on mechanical values
The results of the average roughness displayed over normalized rupture strains for PBT GF 30 are shown in Figure 9. This form of presentation allows the discussion of the influences of the milling settings on the scattering of rupture strains. It is sectioned for all extraction angles and shows the range from 0 to 2 of the normalized rupture strain for each extraction angle. Average roughness over normalized rupture strain for PBT GF 30 with mod0 and mod1 milling parameter set. The scatter box is shown as a gray box from minimum to maximum normalized rupture strain value.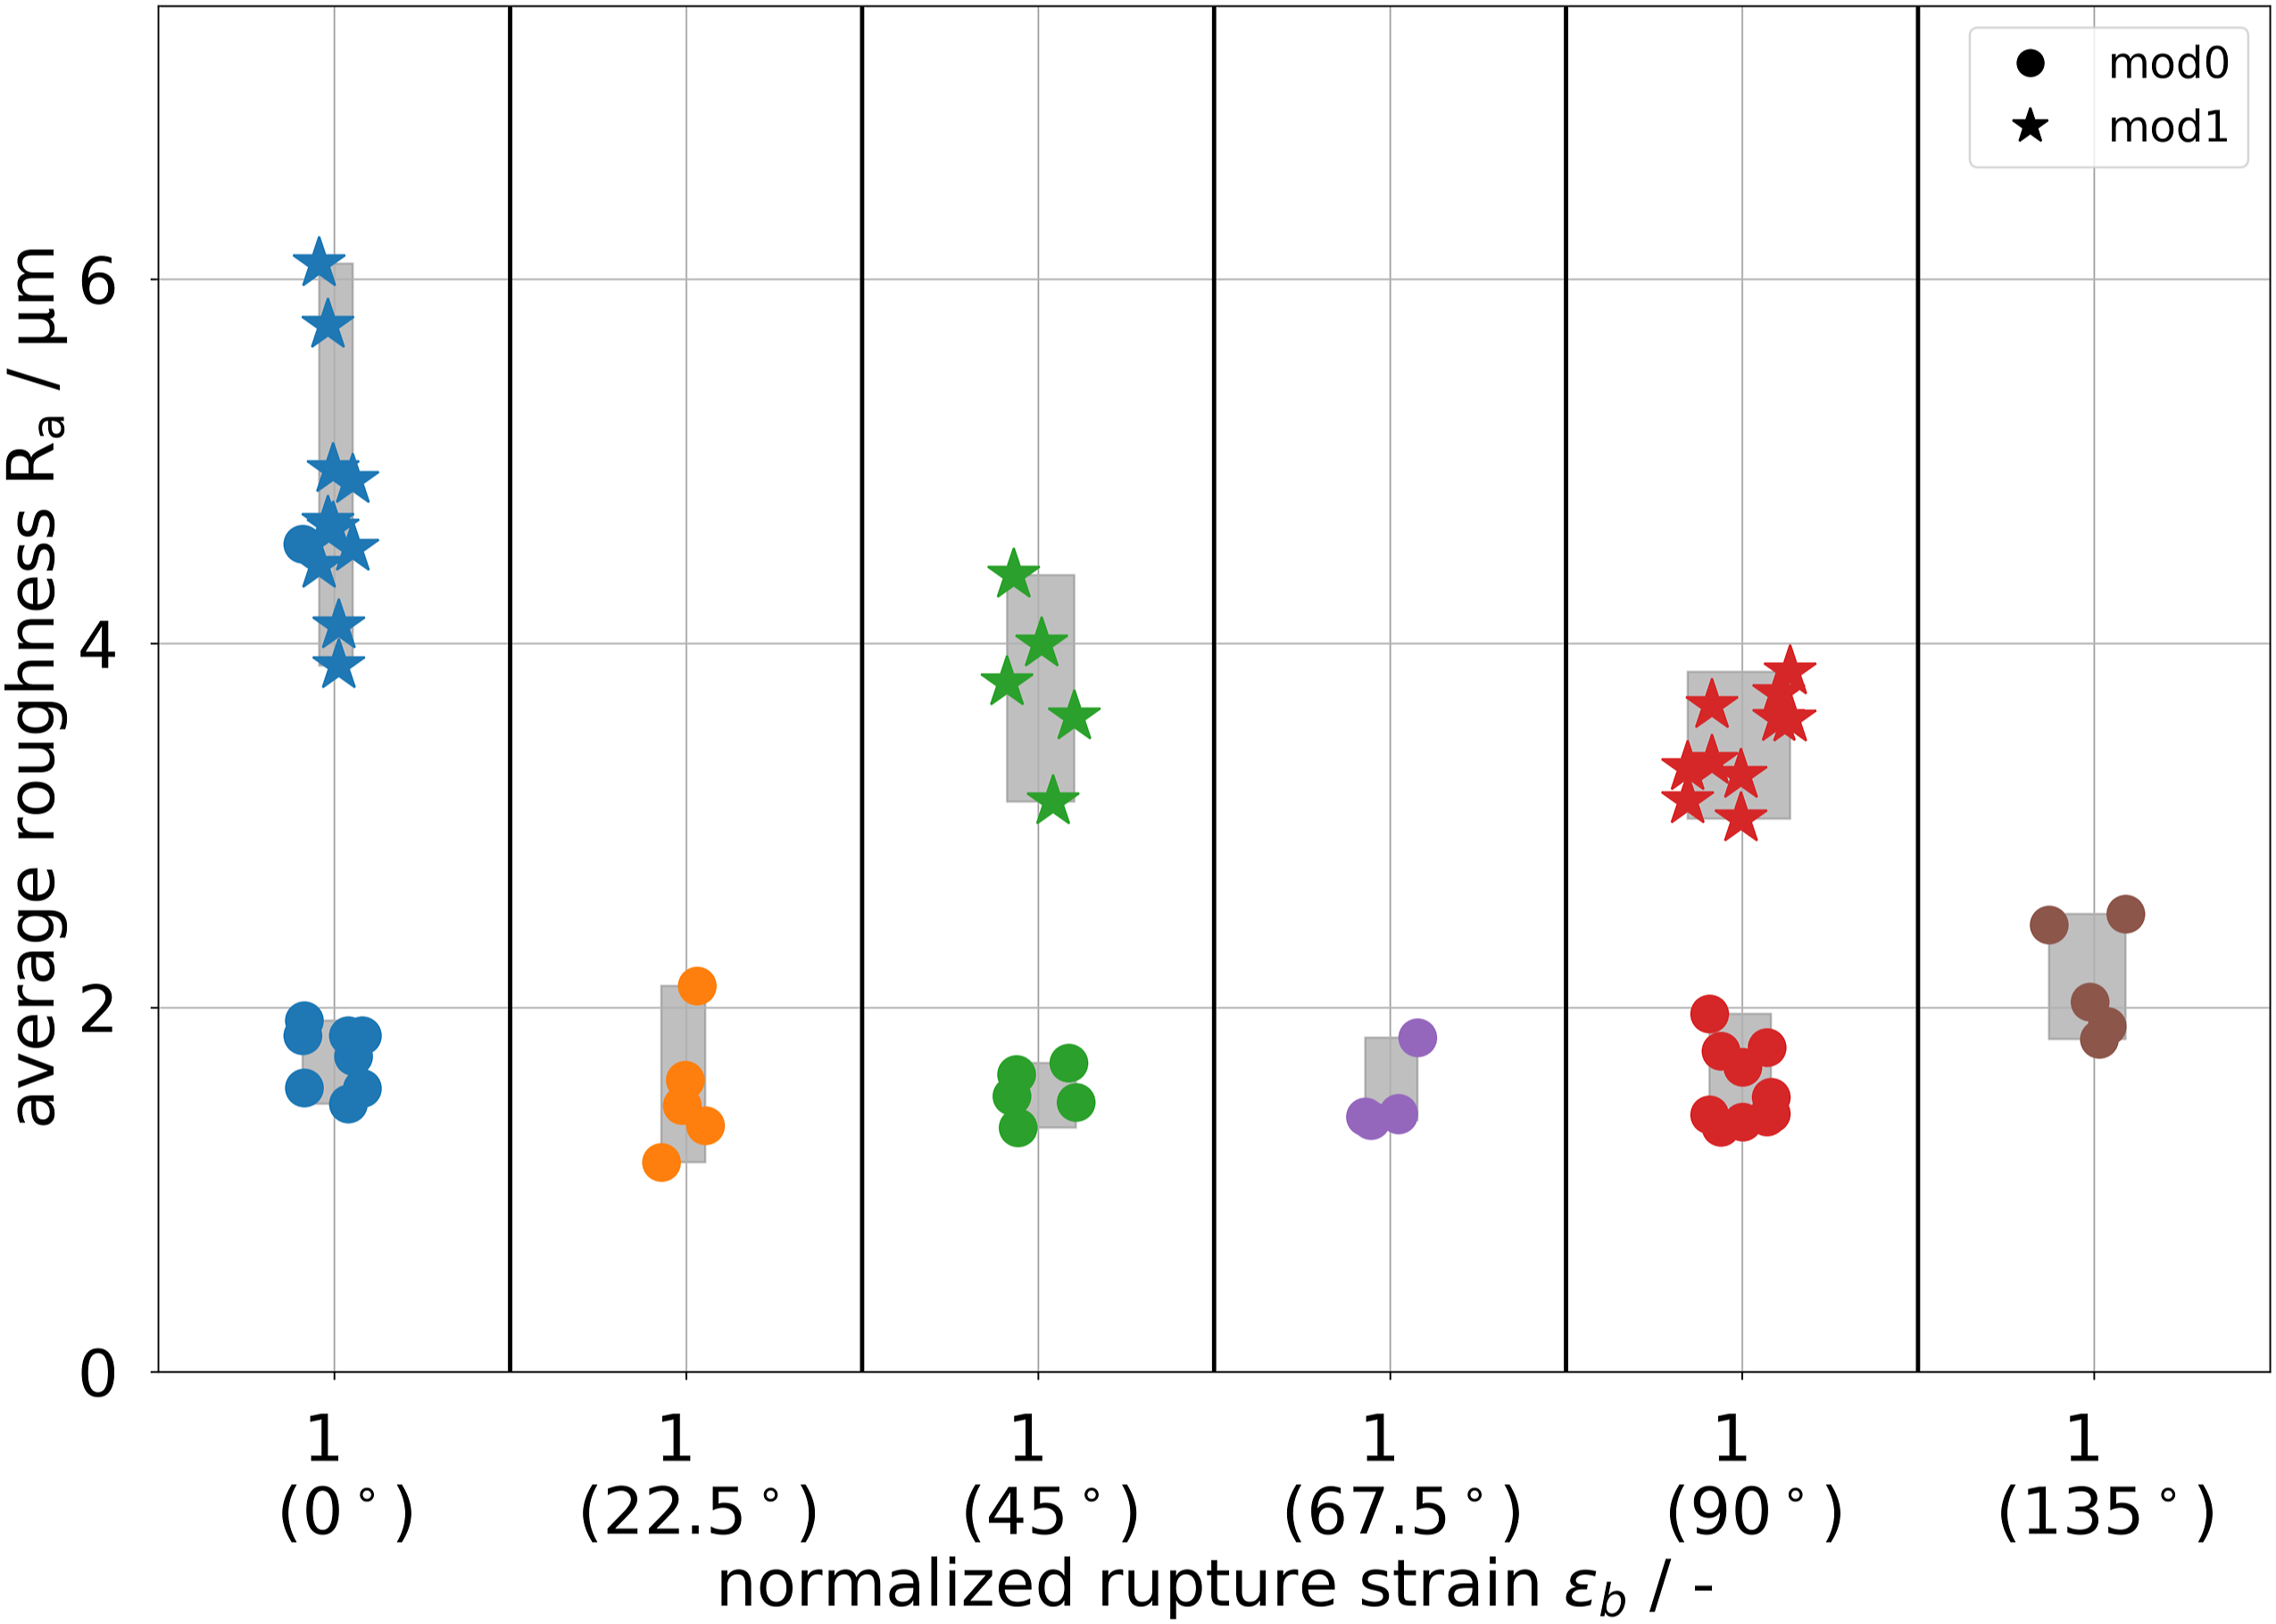
Mod1 roughnesses are generally higher than the ones for mod0. All the normalized rupture strains are located between 0.85 and 1.14.
Normalized rupture strains are discussed with the help of scatter boxes. These boxes stretch from minimum average roughness and minimum normalized rupture strain to maximum average roughness and maximum normalized rupture strain, so all values of one setting are located inside the box. They are indicated in Figure 9 as a gray box.
Comparing the normalized rupture strains’ scatter boxes, for 90° it is the widest (0.29) followed by 135° (0.22) and 45° (0.2). The most narrow scatter box is shown by 22.5° (0.12), closely followed by 67.5° (0.15) and 0° (0.17).
For mod1 it is remarkable that lower angles show lower ranges in normalized rupture strains, whereas the higher angles show higher ranges in normalized rupture strains. This phenomenon cannot be found for mod0 specimens.
In Figure 10 all average roughnesses over normalized rupture strain for PA GF 30 are plotted. Shown are the results for 0° and 90°, both extracted with the mod0 parameter set. Average roughness over normalized rupture strain for PA GF 30 with mod0 milling parameter set.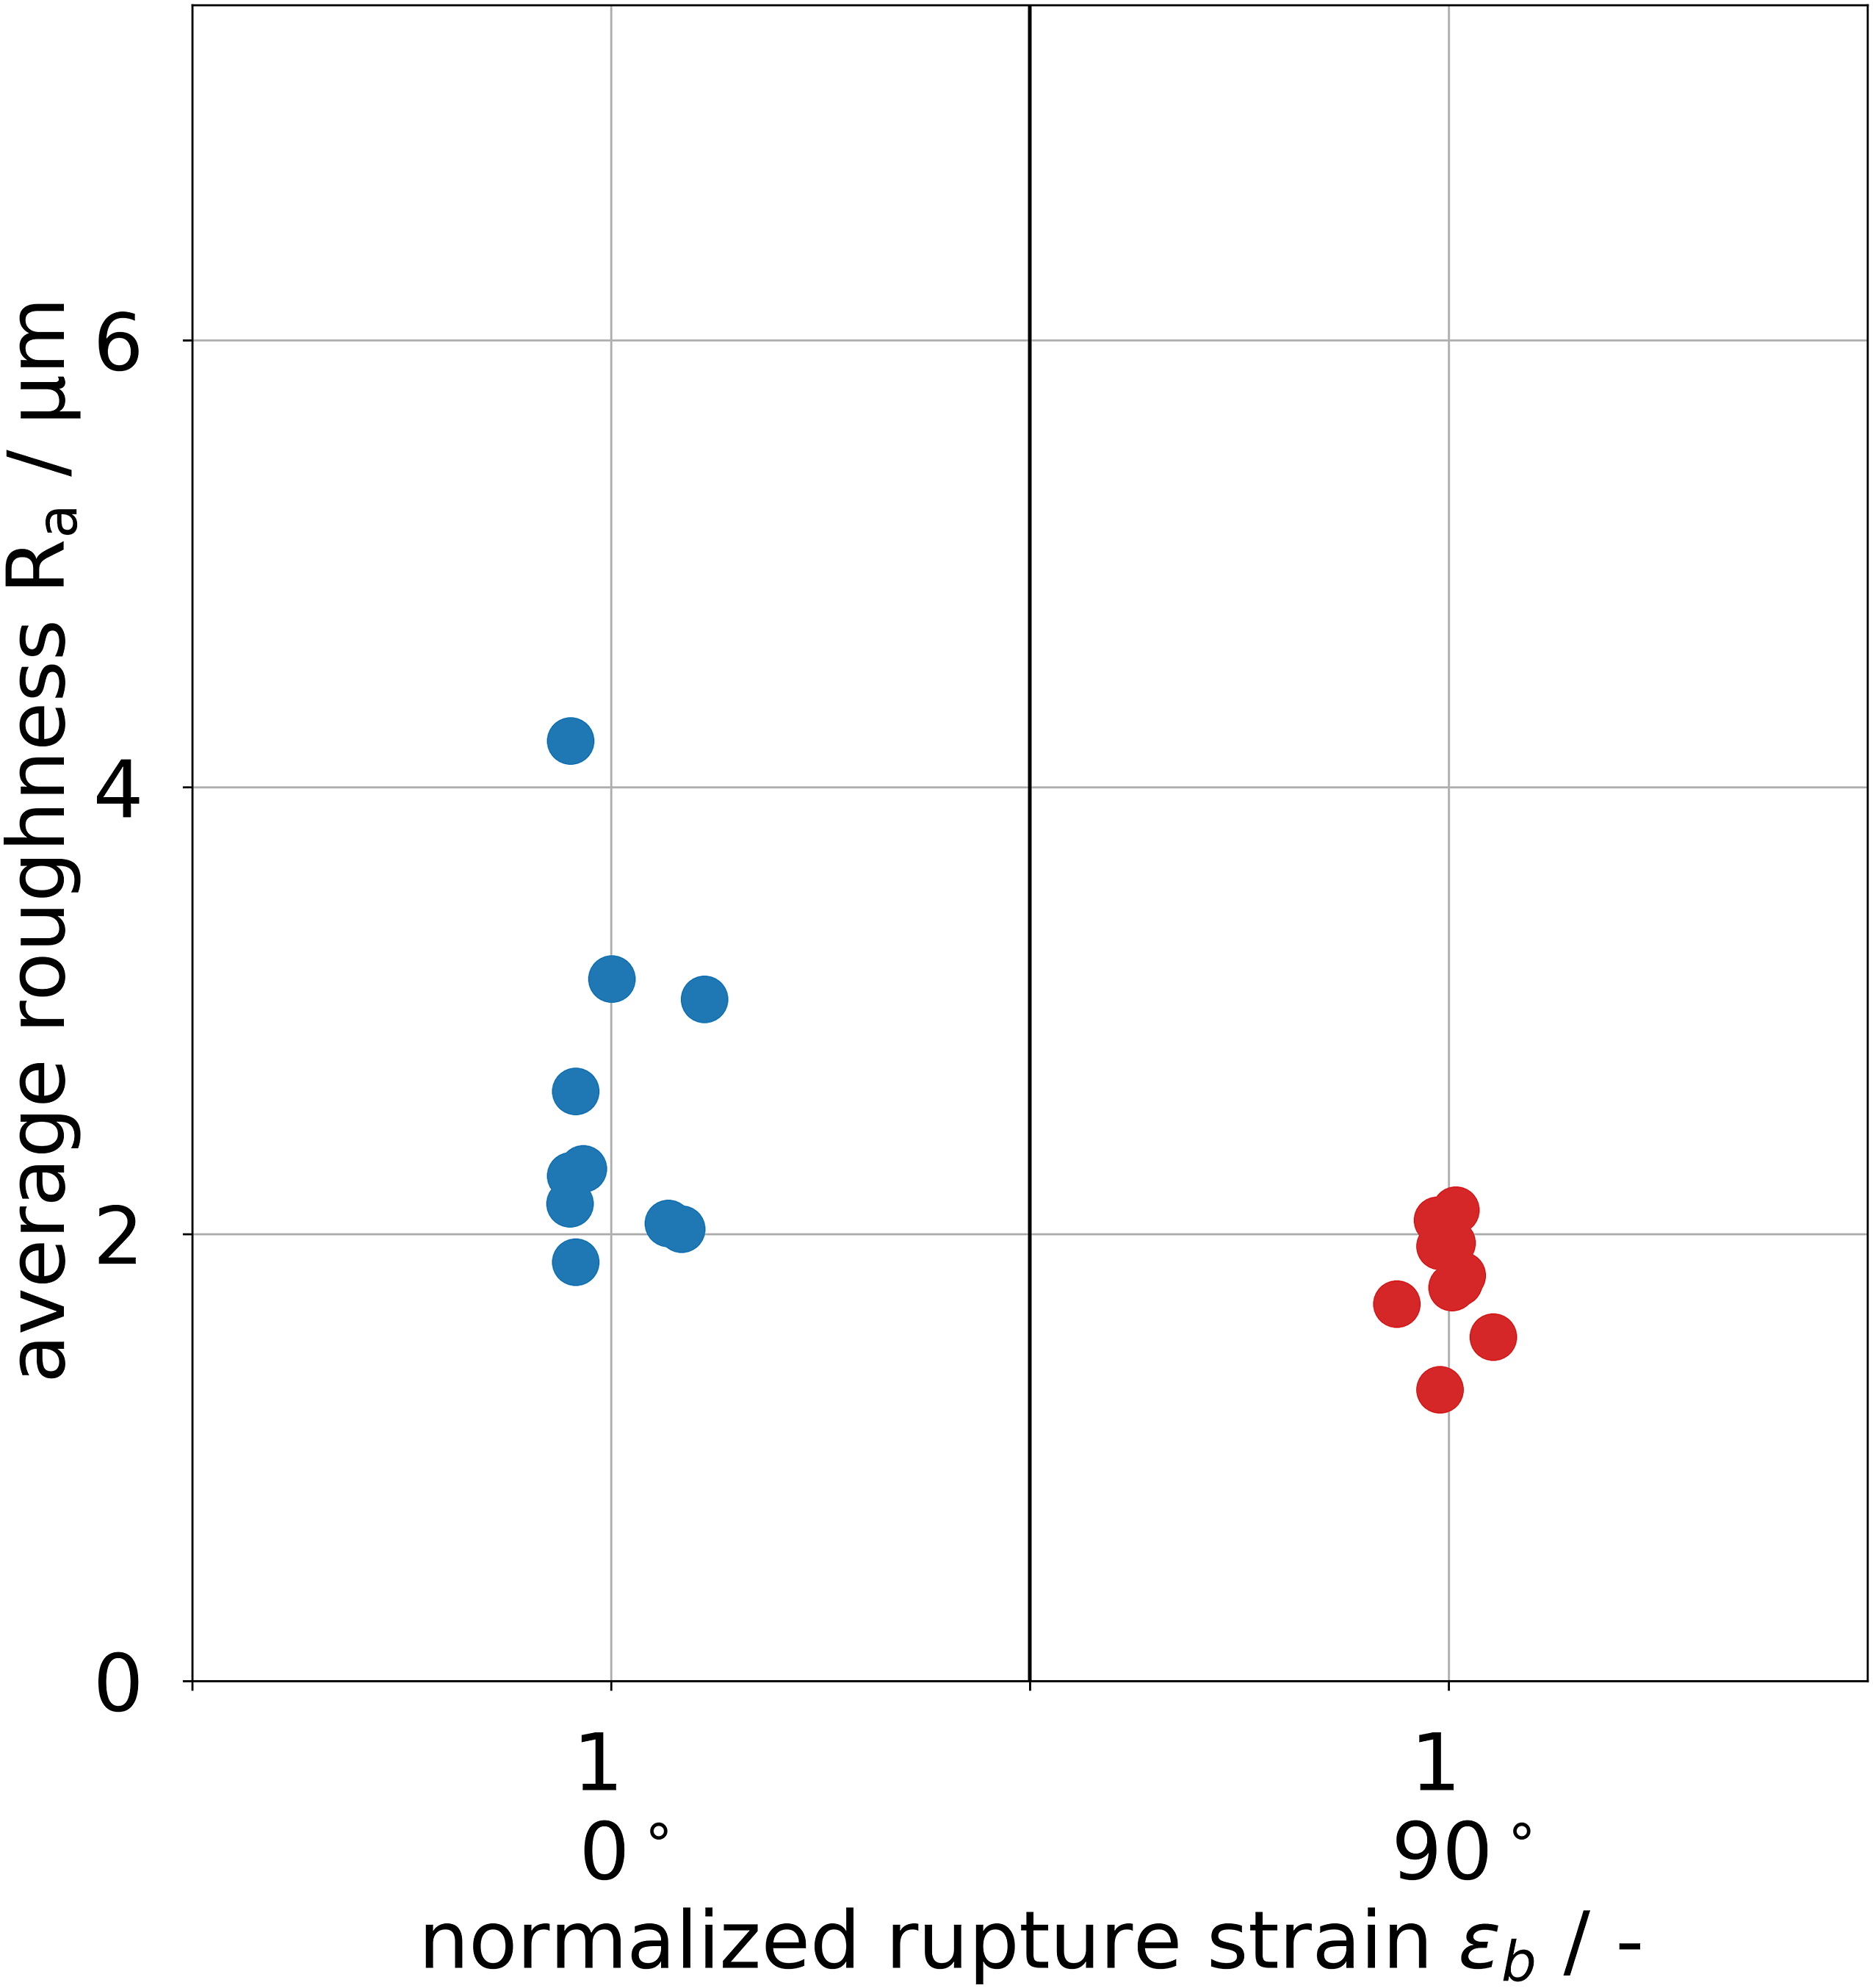
Normalized rupture strains are located between 0.88 and 1.22. The scatter box for 0° (0.32) is wider than that for 90° (0.22).
Comparing the two materials, the normalized rupture strains show similar scatter.
Taking the results shown in Figure 7 into account, it can be stated that stress–strain distribution depends on the extraction angle. Remarkable is the reduction of the rupture strain, respectively, increase of maximum stress, from mod0 to mod1, which can be seen for 0°, 45°, and 90°.
After normalizing rupture strain, shown in Figures 9 and 10, the scatter of characteristic rupture strains for all angles can be compared. The scatter for the average of the normalized rupture strains for mod0 and mod1 specimens encompasses similar bands.
Discussing rupture strains always includes the question of the location of failure. During these quasistatic tests, the failure location was not in the parallel area for all specimens, but occurred sometimes at the tip of the shoulder. Whether the failure location is affected by the machining parameters cannot be said. Mod0 and mod1 failure location seems to be randomly distributed. A correlation between strains and roughnesses may not be appropriate. This led us to the analysis of the maximum true stresses.
As shown in Figure 11 the maximum true stress for mod1 specimens is always lower than that for mod0 specimens. Referring to Figure 9 the scattering of maximum stress seems larger for 0° specimens than for the 45° and 90° specimens. Roughness depth over maximum stress for PBT GF 30 with mod0 and mod1 milling parameters.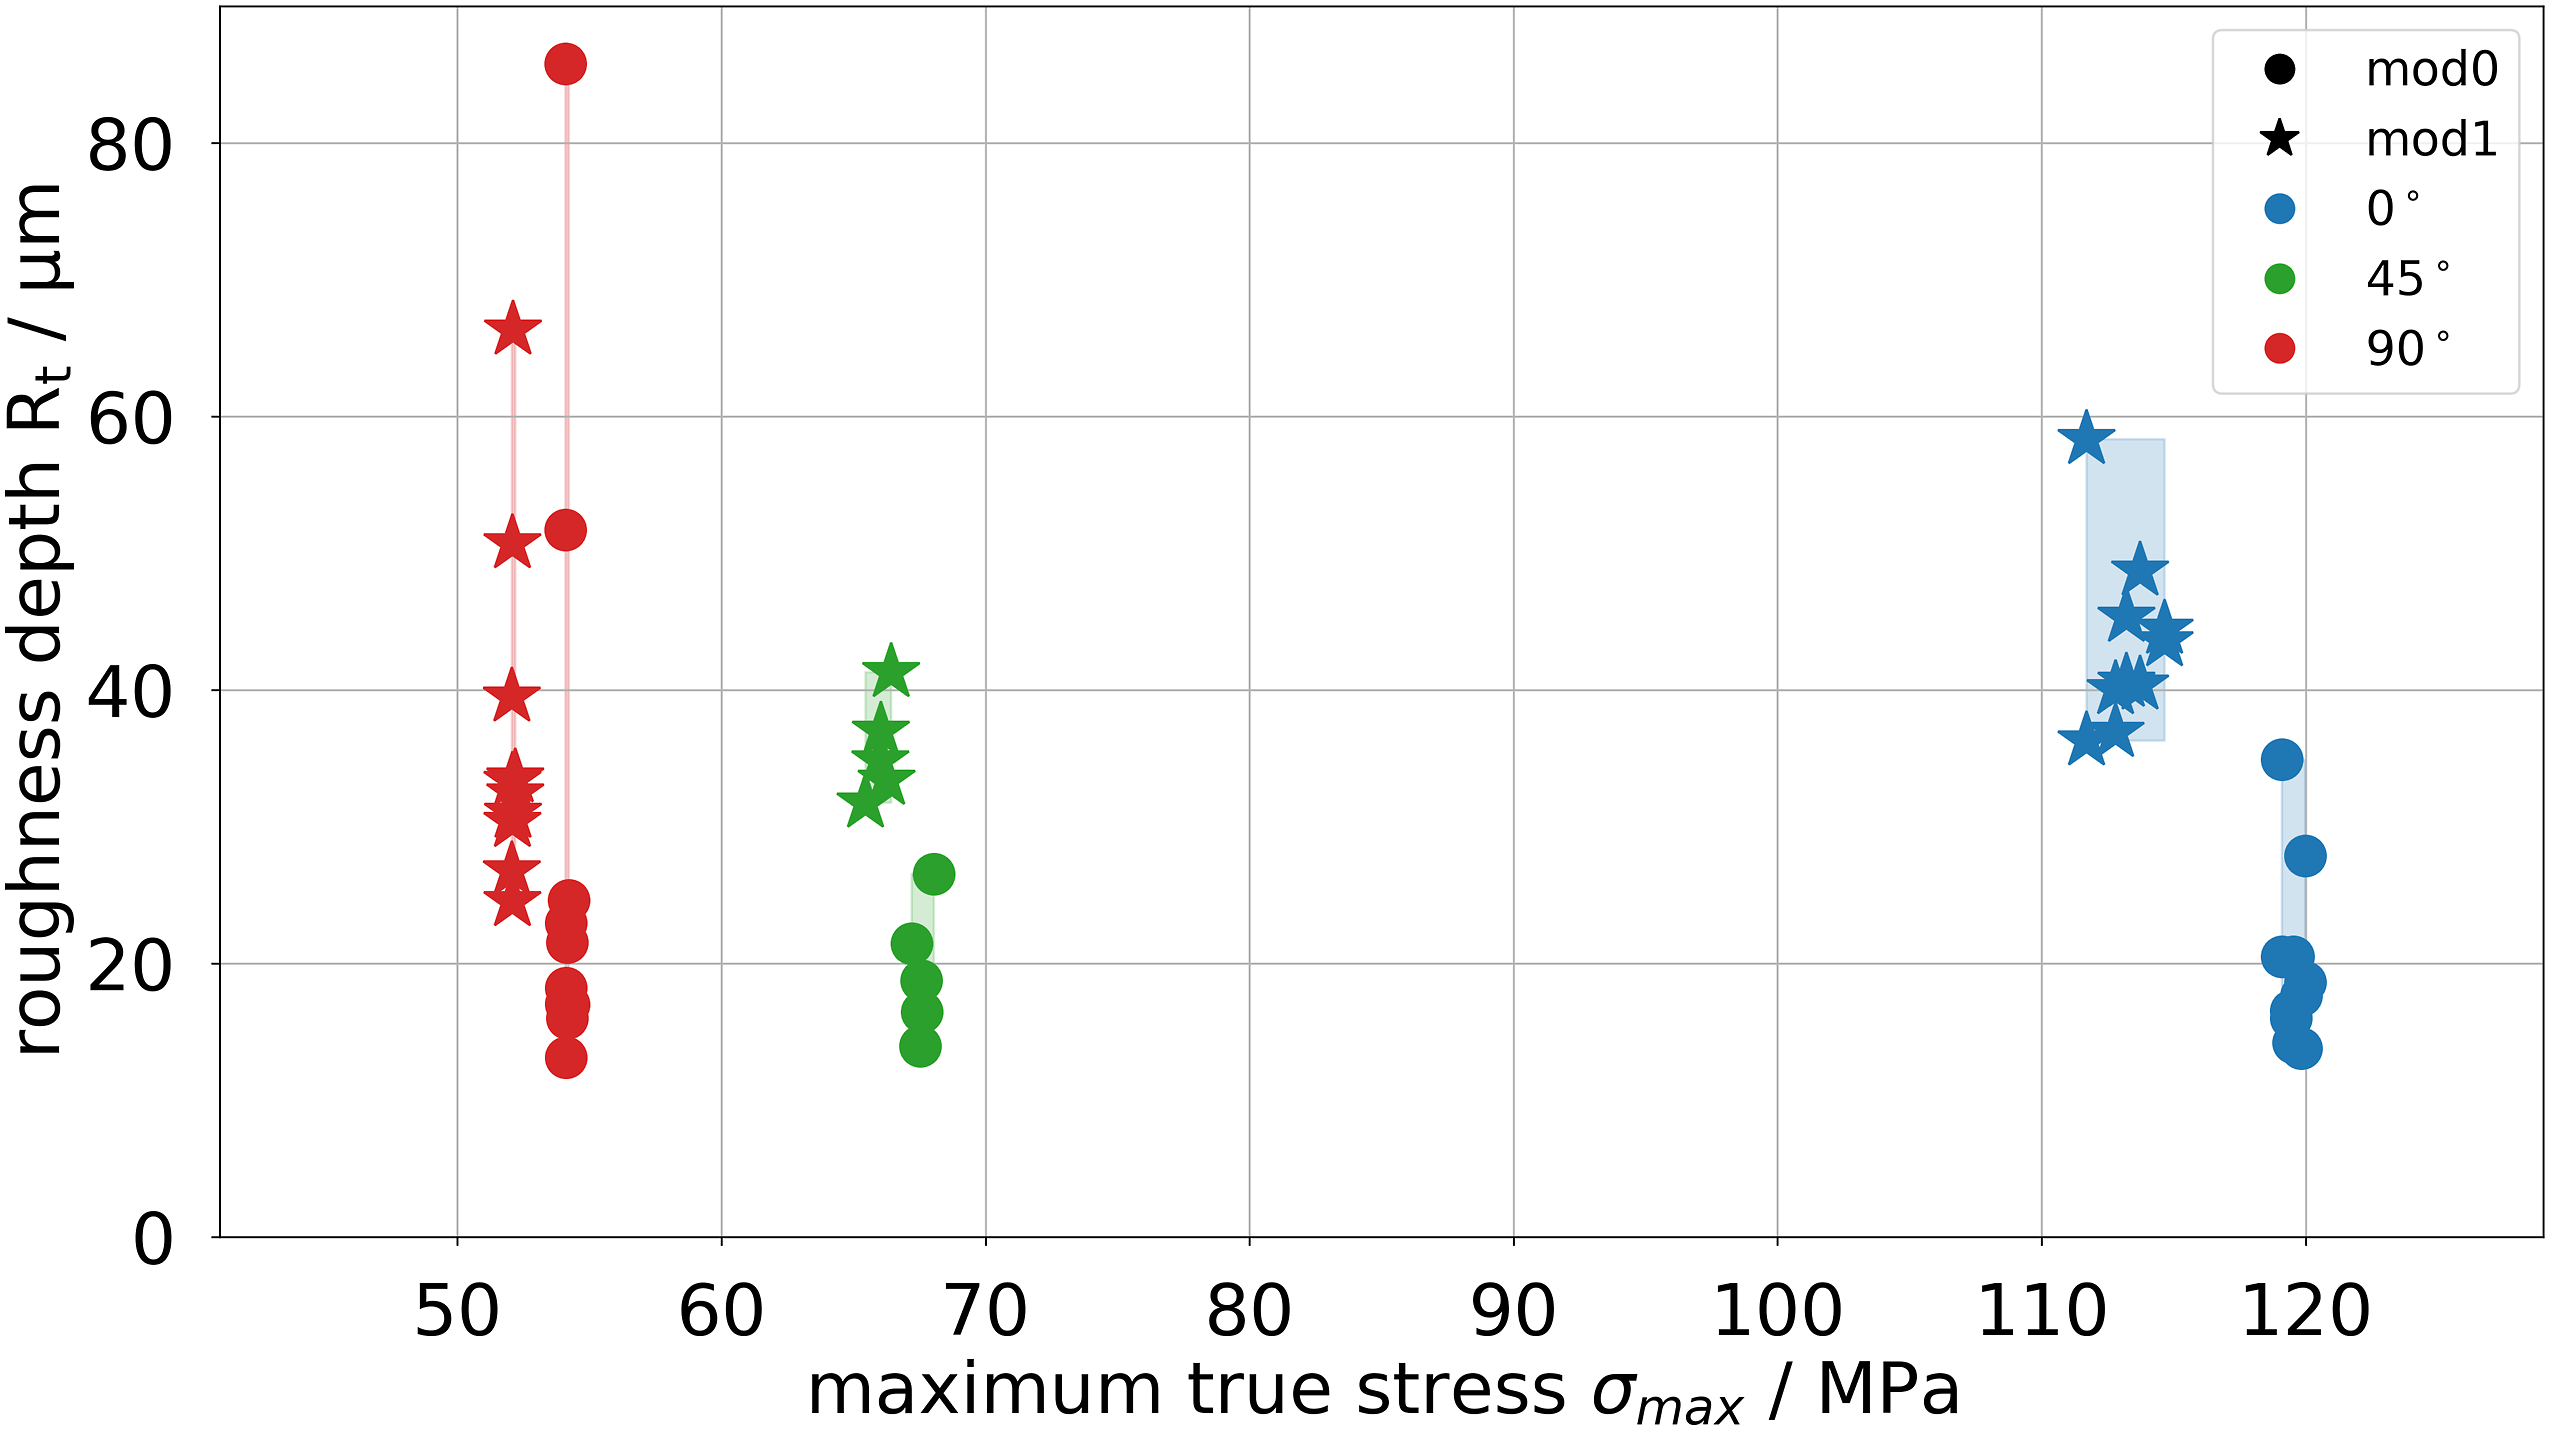
Conclusion
A novel injection molding tool was designed which allows the fabrication of specimens with high FO. In the present study, it was investigated how normalized rupture strains and maximum stress of two thermoplastics reinforced with short glass fibers were influenced by the roughness (average roughness and roughness depth) of the machined surfaces.
The main goal regarding specimen requirements was to develop and design an injection molding tool with a high FO. It was important for the width of the testing area to be wide enough to extract specimens under arbitrary angles.
Based on the geometry of highly oriented plates, which are already available, but show limitations in dimensions, a crucial advancement was made. The previous geometries were massively adjusted in many steps and the impact of change in small details regarding FO in the testable area of the plate was analyzed with injection molding simulation software.
A novel geometry is achieved and presented here that meets the initially defined requirements. The testable area measures 40 mm x 80 mm x 2 mm, which allows the extraction of specimens under arbitrary angles. With μ-CT measurement, two materials (PBT GF 30 and PA GF 30) were analyzed. It was shown that the simulation predicts the FO appropriately and a reasonably homogeneous FO can be achieved in the testing area. The orientation tensor component in the injection molding direction shows high values of more than 0.8.
The presented injection molding tool has been validated to ensure high FOs for the analyzed PAGF30 and PBTGF30 grades. Additional material grades should be validated in further studies.
Further research should, however, also include different milling settings for additional materials.
Via two milling parameter sets, differing surface roughness levels are achieved. For comparison, the mechanical parameters of true stress, longitudinal Hencky strain, and the rupture strain were analyzed.
It is assumed, a higher roughness possesses a non-uniform surface, which leads to differing behavior in rupture, but not in stress–strain behavior and elastic parameters. The extraction angle shows a great effect on the stress–strain behavior. Specimens with their FO in load direction (0° extraction angle) show a stiffer behavior than the specimens with their FO perpendicular to load direction (90° extraction angle). Performing tensile tests with 0° specimens, fiber’s behavior is predominantly, whereas tests with 90° specimens, the matrix’ behavior is dominant. As seen in the stress–strain diagrams, a higher surface roughness seems to reduce the rupture strain and maximum stress.
In case the crack propagation starts inside the specimen or on the back side, other definitions for the rupture strain would be of interest.
Two milling parameter sets (mod0 and mod1) are analyzed. Central findings of both sets do not fit together here. It seems that there is no interaction between FO and average surface roughness for mod0, but for mod1, average surface roughness seems to decrease with rising extraction angle. Hence, the quality of specimens seems to be influenced by FO if more coarse manufacturing parameters that promote an increased surface roughness are applied. Regarding roughness depth, similar phenomena can be perceived: mod0 specimens seem to possess a relatively constant roughness depth, whereas mod1 specimens show slight decreases with rising extraction angle. An obvious correlation between average roughness and the scattering of the normalized rupture strain was not found.
For constant milling parameters as the mod1 parameters, differing roughness levels can be achieved depending on the extraction angle. This rests on the underlying FO.
To clarify the dependencies and interaction behavior of FO and surface roughnesses, further studies are required. Further studies should be done on the question, if higher roughnesses than examined here have an impact. In continuation of this, brittle materials should show even greater impact in rupture behavior since they react more sensitively on surface defects as notches or discontinuities. Based on this consideration, we assume that such effects lead to a larger scattering of rupture strain when performing the tests at low temperatures, thus leading to an embrittlement of the thermoplastic matrix material. 26
In the wide thematic field of manufacturing specimens for mechanical testing, the paper’s content is another jigsaw piece. Following research should expand and sharpen the factors to judge how specimens need to be manufactured and provide clear criterion to evaluate the specimens’ quality.
Footnotes
Declaration of conflicting interests
The authors declared no potential conflicts of interest with respect to the research, authorship, and/or publication of this article.
Funding
The authors received no financial support for the research, authorship, and/or publication of this article.