
Abstract
A large literature has suggested that education leads to higher trust. In this article, I argue that how education and trust are associated at the individual level may depend on the level of risk and uncertainty of each institutional setting. Trust involves not only individuals’ risk-taking propensity and capability but also their perception of how uncertain or risky the situation they are in. I test this micro–macro interactive approach by analyzing data from the World Values Survey, the European Social Survey, and the World Bank. Results show that the education and trust association can change from positive to negative both cross-nationally and within national contexts over time in response to the social and political stability at the macro level. In stable and low-conflict societies, the association between education and trust is highly positive. However, the association becomes negative in transitional societies where social and political risks are widespread. Supporting the risk-taking and risk awareness mechanisms underpinning the interactive process, I show that education has varying impacts on risk-taking propensity and risk awareness across different institutional contexts.
Introduction
Trust is a multidimensional concept. It can be categorized into different forms depending on the target and/or contexts such as trust in people, trust in political institutions, and trust in organizational settings (for detailed discussions on various forms of trust, see, for example, Uslaner 2002; Yamagishi 2013). Aligning with the dominant conceptualization of trust in sociological research (e.g., Bradshaw et al. 2019; Lewis and Weigert 2012; Luhmann 1979; Sztompka 1999), in this study, I focus on generalized social trust, an abstract form of trust with people in general as the target and society at large as the context. 1 Trust in “a wider circle of unfamiliar others” (Delhey, Newton, and Welzel 2011:786) reflects people’s “favorable expectation” of others (Möllering 2001:404). Writing about the importance of social trust, Georg Simmel ([1907] 1990:178) remarked that “without the general trust that people have in each other, society itself would disintegrate.” It is our general belief about the benevolence of human nature that allows us to leave the house without a weapon (Luhmann 1979; see also Paxton 2007; Wu 2020).
To empirically measure generalized trust, scholars have widely used the survey item introduced by Morris Rosenberg (1956)—Generally speaking, would you say that most people can be trusted, or that you can’t be too careful in dealing with other people? With this measure, survey researchers have shown that trust is unevenly distributed among individuals and across societies (Alesina and La Ferrara 2002; Delhey and Newton 2003; Delhey et al. 2011; Putnam 2001; Wilkes and Wu 2018), and that people in many countries such as Australia, Britain, China, France, and the United States have become less willing to trust over recent decades (Hu 2015; Paxton 1999; Putnam 2001; Stolle and Nishikawa 2011; Wilkes 2011). The widespread trust inequality at both the national and the global levels and the decline of trust in many countries have sparked a growing interest in researching the origins of trust (e.g., Alesina and La Ferrara 2002; Asadullah 2016; Delhey and Newton 2003; Dinesen and Sønderskov 2015; Glanville and Paxton 2007; Uslaner 2018).
One of the most important predictors of trust is education. Eric M. Uslaner (1999:134) points out that education is “the single best predictor of social trust” (see also Charron and Rothstein 2016; Helliwell and Putnam 2007; Hooghe, Marien, and de Vroome 2012). The vast majority of empirical studies on the education and trust association conclude that better educated individuals tend to have more trust in others than those who are less educated (e.g., Borgonovi 2012; Borgonovi and Burns 2015; Huang, van den Brink, and Groot 2011; Milligan, Moretti, and Oreopoulos 2004; Sturgis, Read, and Allum 2010; Zanin 2017). Summarizing this line of literature, Marc Hooghe et al. (2012:609) write, “it is an almost universal finding that there is a strong and positive relation between education level and trust.”
More recently, however, several studies have shown that education might yield differential impacts on trust in different societies. In Sweden, Sven Oskarsson et al. (2017) show that education has little impact on trust. In China, Cary Wu and Zhilei Shi (2020) suggest that education has a negative impact on people’s trust. Several cross-national studies have also shown that the education and trust association can vary from positive to negative depending on the specific institutional contexts (e.g., Borgonovi 2012; Charron and Rothstein 2016; Frederiksen, Larsen, and Lolle 2016; Güemes and Herreros 2019). For example, the effect of education is found to be negative in highly corrupt countries such as Serbia, Turkey, Hungary, Slovakia, Bulgaria, Croatia, Kosovo, and Ukraine (Frederiksen, Larsen, and Lolle 2016).
In this article, I argue that trust involves not only people’s capability of taking on risks but also their perception of how uncertain or risky the situation they are in. The micro-level association between education and trust therefore may vary according to the macro level of sociopolitical risks. In stable and low-risk societies, education increases trust by teaching people to accrue the benefits of norms of reciprocity and raising their ability to take on more risks. However, in societies where sociopolitical risks are widespread, education raises people’s awareness of such risks and lowers their propensity for taking on risks, leading to a negative association. To test this micro–macro interactive framework, I consider how education and trust are associated cross-nationally as well as within national contexts over time.
Analyzing data from the World Values Survey (WVS; three waves, 2005–2020), the European Social Survey (ESS; eight waves, 2002–2016), and the Worldwide Governance Indicators (WGI) from the World Bank, I show that how education and trust are associated can change from positive to negative both cross-nationally and over time within national contexts according to the overall level of risk and uncertainty of each social and institutional setting. Cross-nationally, in stable and low-conflict societies such as the United States, Canada, France, Germany, Denmark, Sweden, and Japan, the association is highly positive. However, the association becomes negative in transitional societies where social and political risks are widespread, including countries such as Egypt, Ghana, Jordan, India, Iraq, Romania, and Turkey. Longitudinally within national contexts, changes in the level of political instability explain the changes in education and trust association. Furthermore, I show that level of sociopolitical risks also moderates how education affects individuals’ risk-taking propensity and their risk awareness. Similar to how education and trust are associated cross-nationally, I find that while in low-risk societies education is positively associated with risk-taking propensity, in countries with high levels of political instability, education and risk-taking propensity are negatively associated. Education also increases people’s risk awareness, and this is particularly true in societies where there are widespread social and political risks. Taken together, these findings provide empirical support for the risk-taking and risk awareness mechanisms underpinning the interactive process.
Theoretical Background
Explaining the positive association between education and trust largely found in current literature, scholars have focused on the socializing effects of education. One argument is that education socializes individuals to more cosmopolitan and optimistic worldviews, and these positive attitudes further explain people’s higher levels of trust in others (Bjørnskov 2007; Borgonovi 2012; Uslaner 2002; see also Huang et al. 2011). A second argument is that education leads to higher levels of cognitive ability, and for this reason, better educated individuals tend to make better decisions and have better control in uncertain situations and over time, their accumulative positive experiences interacting with others as well as their ability to accrue the benefits of norms of reciprocity make them more trusting (Hooghe et al. 2012; Sturgis et al. 2010). Highlighting the socialization function of education and schools, Hooghe et al. (2012) remark that education is not just about acquiring cognitive abilities, but more importantly it can indicate people’s social and therefore socializing experience.
In fact, education has long been seen as affecting society through a socializing mechanism. John W. Meyer (1977:56), for example, pointed out, “Prevailing research on school effects is organized around a simple image of socialization in society: Schools provide experiences which instill knowledge, skills, attitudes, and values in their students.” Schools are widely considered as one of the most important agents of socialization largely because people spend the most time at schools during their primary socialization period early in life (e.g., Galston 2001; Jennings and Niemi 2015). Furthermore, education allocates people to different social positions, and this would further shape their socialization experiences (Meyer 1977).
On the contrary, Meyer (1977) has reminded us that there is also a need to study the effects of education beyond its socializing effects. We need to study the effects of education as an institution considering “the contextual effects of variations in the extension and institutionalization of education” (Meyer 1977:76). Schools and educational systems could vary enormously across countries as well as time periods and how people experience the moral standard of the educational system might also matter (Borgonovi 2012; Charron and Rothstein 2016). Therefore, education across different institutional contexts could socialize people to different values, norms, and skills, and in ways that may or may not lead to trust. For example, while education plays a major role in socializing individuals to value orientations, different societies (e.g., democratic and authoritarian) are likely to promote different sets of value orientations. Consequently, the socializing effects of education at the micro level may change according to the specific macro-level institutional contexts.
Indeed, to explain the mixed effects of education on trust cross-nationally, scholars have thus far highlighted the macro-level institutional factors such as the quality of government, state efficacy, and the level of corruption. Nicholas Charron and Bo Rothstein (2016:59), for example, show that the effect of education on trust is positive in countries or regions where there is an “impartial and non-corrupt” institutional setting, while in societies with greater levels of corruption and favoritism, the effect becomes negligible or even negative. Similarly, Frederiksen, Larsen, and Lolle (2016) find that, whereas education has a positive impact on trust in low-corruption western democracies, it has a negative impact on trust in less developed and more corrupt societies, including Serbia, Turkey, Hungary, Slovakia, Bulgaria, Croatia, Kosovo, and Ukraine. Most recently, Cecilia Güemes and Francisco Herreros (2019) show that the association between education and trust is mediated by state efficacy: Whereas education has a positive impact on trust in Europe, it has a weak impact on trust in Latin America and a negative effect in Africa.
In sum, while it has become clear that the micro-level association between education and trust can depend on the macro-level institutional contexts, how education generates or fails to generate trust and under what conditions have yet been well articulated in current studies. Indeed, building a coherent theoretical framework that can explain the diverse effects of education across societies will require considering specifically how educational socialization at the micro level interacts with what macro-level context to shape trust. With this in mind, in what follows I introduce a micro–macro interactive theoretical framework. The goal is to provide a coherent framework that can explain how education and trust are related across contexts.
A Micro–macro Interactive Approach
People’s willingness to trust often reflects their willingness to take on risks (Cook and Cooper 2003; Levi 1998; Luhmann 1979; see also Bohnet and Zeckhauser 2004). Education affects trust by socializing people to different risk-taking values and behaviors. For example, education increases people’s socioeconomic status, thereby making educated individuals more capable of taking on more risks (Wu and Wilkes 2016). Further is that educated individuals might also be more aware of the benefits of trusting, making them trust more (Borgonovi and Burns 2015; Hamamura 2012).
Nonetheless, trust decisions involve not only people’s capability of taking on risks but also their perception of how uncertain or risky the situation is (Luhmann 1979; Rothstein and Stolle 2002). In a socially unstable and institutionally weak society where widespread risks are beyond individuals’ control, better educated people may become less willing to place trust in others. This is not only because they are more aware and more knowledgeable about the social and institutional environment (Charron and Rothstein 2016) but also because they are less inclined to accept the risk of betrayal (Hong and Bohnet 2007).
In fact, the vast majority of evidence showing a positive effect of education on trust comes from stable and low-conflict democratic societies (e.g., Alesina and La Ferrara 2002; Sturgis et al. 2010). In these societies, trust is widely considered as one of the most important democratic values (de Tocqueville 1835; Putnam 1993; Sztompka 1996; Warren 1999), and there are institutions available to individuals ensuring that trust is rewarded (Hamamura 2012). Education in these societies teaches people to accrue the benefits of norms of reciprocity and raises their ability to take on risks, leading to a positive association between education and trust.
In high-risk environment, however, education is likely to socialize people in their early life to be more cautious in interacting with anonymous others and enhances their cognitive and analytical capacities in interpreting and understanding the trustworthiness of others. Because better educated individuals are more aware and knowledgeable about the social and institutional risks around them, they would become less willing to place trust in others (Borgonovi and Burns 2015). For example, Wu and Shi (2020) recently show that in transitional China where sociopolitical risks are widespread, education and risk awareness interact to shape trust: The negative effect of risk awareness on trust is stronger among the better educated. Based on their findings, they further suggest that cross-nationally, education could affect trust differently in response to the level of social risk and political instability of each institutional setting (Wu and Shi 2020). In fact, several studies have already shown that in high-risk societies such as Serbia, Turkey, Hungary, Slovakia, Bulgaria, Croatia, Kosovo, and Ukraine, education lowers people’s trust in others (Charron and Rothstein 2016; Frederiksen, Larsen, and Lolle 2016; see also Wu and Shi 2020).
Accordingly, in this study, I argue that education is associated with people’s trust through how it socializes individuals to their risk-taking propensity, which can vary depending on the level of risk and uncertainty of the institutional setting. In societies where an institutional system ensures a relatively certain environment and trusting is beneficial, education teaches people to trust more (Borgonovi and Burns 2015; Hamamura 2012). Over time, better educated individuals become more capable of taking on more risk and are also more aware of the benefits of trusting. In a socially unstable and institutionally weak society where risks are beyond individuals’ control, the positive association between education on trust will be weakened or reversed. Education teaches people not to trust in societies where sociopolitical risks are widespread by raising their awareness of such risks and lowering their propensity of taking risks due to their position and what is at stake (Charron and Rothstein 2016; Hong and Bohnet 2007). To empirically test this micro–macro interactive approach, in what follows I consider how the association between education and trust may vary cross-nationally as well as within national contexts over time and how the level of sociopolitical risks at the macro level may explain such variations.
Data and Method
Data
Data for this study come from several sources. To investigate how the association between education and trust may vary cross-nationally, I use data from two recent waves of the WVS (2005–2009 and 2011–2014). The WVS data have been widely used in research on the cross-national difference in trust (e.g., Wilkes and Wu 2018). In total, for the WVS, I obtain data for 123,345 individuals from 95 country-years. Some countries have data for both waves, while others have only one wave of data. Most recently, the World Values Survey Association (2015) and the European Values Study (EVS) officially released the joint EVS–WVS 2017–2020 dataset (November 13, 2020). Fieldwork for this wave of data was conducted from 2017 to early 2020. The joint EVS/WVS includes data of 79 countries and territories with over 127,358 respondents around the globe were interviewed. To provide robustness checks of the results, I replicate my analyses using this most recent dataset.
Second, to investigate the longitudinal variation in the association between education and trust, I make use of the ESS that consists of data for 32 countries over eight waves from 2002 to 2016. At the country level, the ESS offers a panel data structure, allowing to investigate how the association between trust and education may change not only cross-nationally but also within countries over time. For the ESS, we obtain 312,558 individuals from 172 country-years (32 countries across eight waves from 2002 to 2016, but not all countries participated all waves of the survey).
Furthermore, to test whether political instability may help explain why the association between education and trust changes both cross-nationally and within country over time, I obtain country-year-level data from the World Bank’s WGI. The WGI includes measures of political instability, corruption, and ethnic diversity for countries across different years. Specifics about the index and methodology are available online (https://info.worldbank.org/governance/wgi/).
Measures
Trust
For the WVS, I use the standard survey item asking, “Generally speaking, would you say that most people can be trusted or that you can’t be too careful in dealing with people?” (Rosenberg 1956). The variable is coded on a 0 to 1 scale, with 1 corresponding to high levels of trust. It is well established that this single-item question is an appropriate and valid measure of generalized trust (Delhey et al. 2011; Mewes 2014; Uslaner 2012). For the ESS, I use the commonly used three-item measure, including “Generally speaking, would you say that most people can be trusted, or that you can’t be too careful in dealing with people?”; “Do you think that most people would try to take advantage of you if they got the chance, or would they try to be fair?”; and “Would you say that most of the time people try to be helpful or that they are mostly looking out for themselves?” All three items are coded on a scale from 1 (disagree) to 10 (agree). I combine these items to create a scale of trust ranging from 3 to 30. This three-item scale has also been validated as a reliable measure of trust across cultures and over time (Reeskens and Hooghe 2008).
Education
For the WVS, I measure educational attainment using respondents’ highest education level attained with eight categories, namely, 1 = no formal education or inadequately completed elementary education, 2 = completed (compulsory) elementary education, 3 = incomplete secondary school: technical/vocational, 4 = complete secondary school: technical/vocational, 5 = incomplete secondary: university, 6 = complete secondary: university, 7 = some university without degree, and 8 = university with degree/higher education. In some analyses, I treat education as a categorical variable. To reduce the number of categories, I recode respondents’ education into Primary, Secondary, Post-secondary, and Tertiary. This is also consistent with the most recent wave of the WVS coding. Similarly, for the ESS, I capture respondents’ level of education using their highest level of education attained, ranging from no education (1) to university and above degree (5).
I should note that measuring education in such a general sense makes it difficult to consider the heterogeneity in the education system as well as the differential schooling experiences across social groups and also across different societies, even though they might have implications for trust learning (e.g., Asadullah 2017). Further is that the quality of education can also vary cross-nationally. In fact, existing research has suggested that school completion could lead to skills or values formation unequally in different contexts (e.g., Asadullah and Chaudhury 2015). In other words, returns to education could change across contexts. Nonetheless, my additional analysis shows that including the country-level measure of the quality of education (data from the Programme for International Student Assessment [PISA]) in models does not seem to change the overall pattern. It is also my hope that including country-year fixed effects in the analysis will help control some of the variations in the education system, schooling experiences, and quality of education. Regardless of the quality of education, schooling remains one of the essential agents for socialization through peer interactions and network building in school (Wentzel 2015).
Sociopolitical risks
I use political instability to indicate the level of sociopolitical risks at the macro level. For WVS (2005–2008 and 2010–2014), political instability for each country-year is measured using the WGI political instability index from the World Bank’s WGI. The index captures respondents’ perception of the likelihood of political instability and/or politically motivated violence. It is created based on multiple indicators from various sources such as the Economist Intelligence Unit’s (EIU) measures of armed conflict, violent demonstrations, social unrest, and international tensions/terrorist threat and the Political Risk Services’ (PRS) measures of government instability, internal conflict, external conflict, and ethnic tensions.
The index ranges from approximately −2.5 to 2.5 with high values corresponding concerns about high levels of political instability. Based on this index, highly unstable countries include, for example, Iraq (2006), Pakistan (2012), Yemen (2014), Libya (2014), and Colombia (2005), while highly stable countries are Singapore (2012), Germany (2012), Finland (2005), New Zealand (2012), Sweden (2005), Norway (2010), and Qatar (2010). In Europe, whereas Denmark, Switzerland, Finland, Norway, France, and Sweden have higher levels of political stability, countries such as Russia, Ukraine, Bulgaria, and Turkey have high levels of political instability. Across the ESS waves, while we also see changes within countries over time, the relative cross-national differences in political instability changed very little. A. Figure 1 in the online appendix provides a visualization of changes in political instability index across and within countries over time.
Risk-taking propensity
To support the mechanisms underpinning the interactive process, I consider how education is associated with individuals’ propensity for taking on risks and how the level of sociopolitical risks may condition the association at the country (or country-year) level. I measure risk-taking propensity using Schwartz’s value item, where respondents were asked to report their similarity to a hypothetical individual: “Adventure and taking risks are important to this person; to have an exciting life.” Respondents rated the statement using a 6-point scale (1 = very much like me, 6 = not at all like me). In my analyses, I reversed the scale of the item such that the highest value (6) represented the highest propensity for risk taking and the lowest value (1) represented the lowest propensity for risk taking (see also Mata, Josef, and Hertwig 2016).
I also control for relevant demographic covariates such as gender, age, income, marital status, and occupational status at the individual level. At the country (or country-year) level, I include measures of the level of democracy (Economist Intelligence Unit’s annual Democracy Index), per capita gross domestic product (GDP; World Bank), corruption (Swiss Economic Institute Index), and Fearon’s ethnic diversity index (see also Asadullah 2017; Borgonovi and Pokropek 2017; Dinesen and Sønderskov 2015; Wilkes and Wu 2018).
Method
Data analysis involves three general steps. First, for each country (or country-year), I run a separate logistic or ordinary least squares (OLS) regression of trust on education controlling for demographic covariates. I then use the resulting country or country-year-level regression coefficients

where
Second, to illustrate the interactive approach, I use random intercept models with a cross-level interaction between education at the individual level and the political instability at the macro level. This micro–macro interactive model is expressed as follows:


where
In the final step, to illustrate the potential mechanism underlying the micro–macro interactive process, I consider, first, how risk taking affects people’s trust (Equation 3) and, second, how education interacts with the level of sociopolitical risks at the institutional level to shape people’s risk-taking propensity (Equation 4).


Findings
Cross-national: WVS
First, I run separate logistic regressions of trust on education using the WVS data for each country (or country-year). All models include demographic covariates. The resulting logistic regression coefficients are used to denote the association between education and trust across country-years. Table 1 ranks the top 30 country-years of both positive and negative coefficients. For example, Ghana, Rwanda, Iraq, India, Egypt, and Yemen are among the countries that show a strong negative association between education and trust, while New Zealand, France, the United States, Trinidad and Tobago, Canada, and Sweden are among the countries that show a strong positive association. This demonstrates that, cross-nationally, education and trust association can change from positive to negative.
Top 30 Country-Years with a Positive or Negative Association between Education and Trust, Logit Estimates (WVS Data).
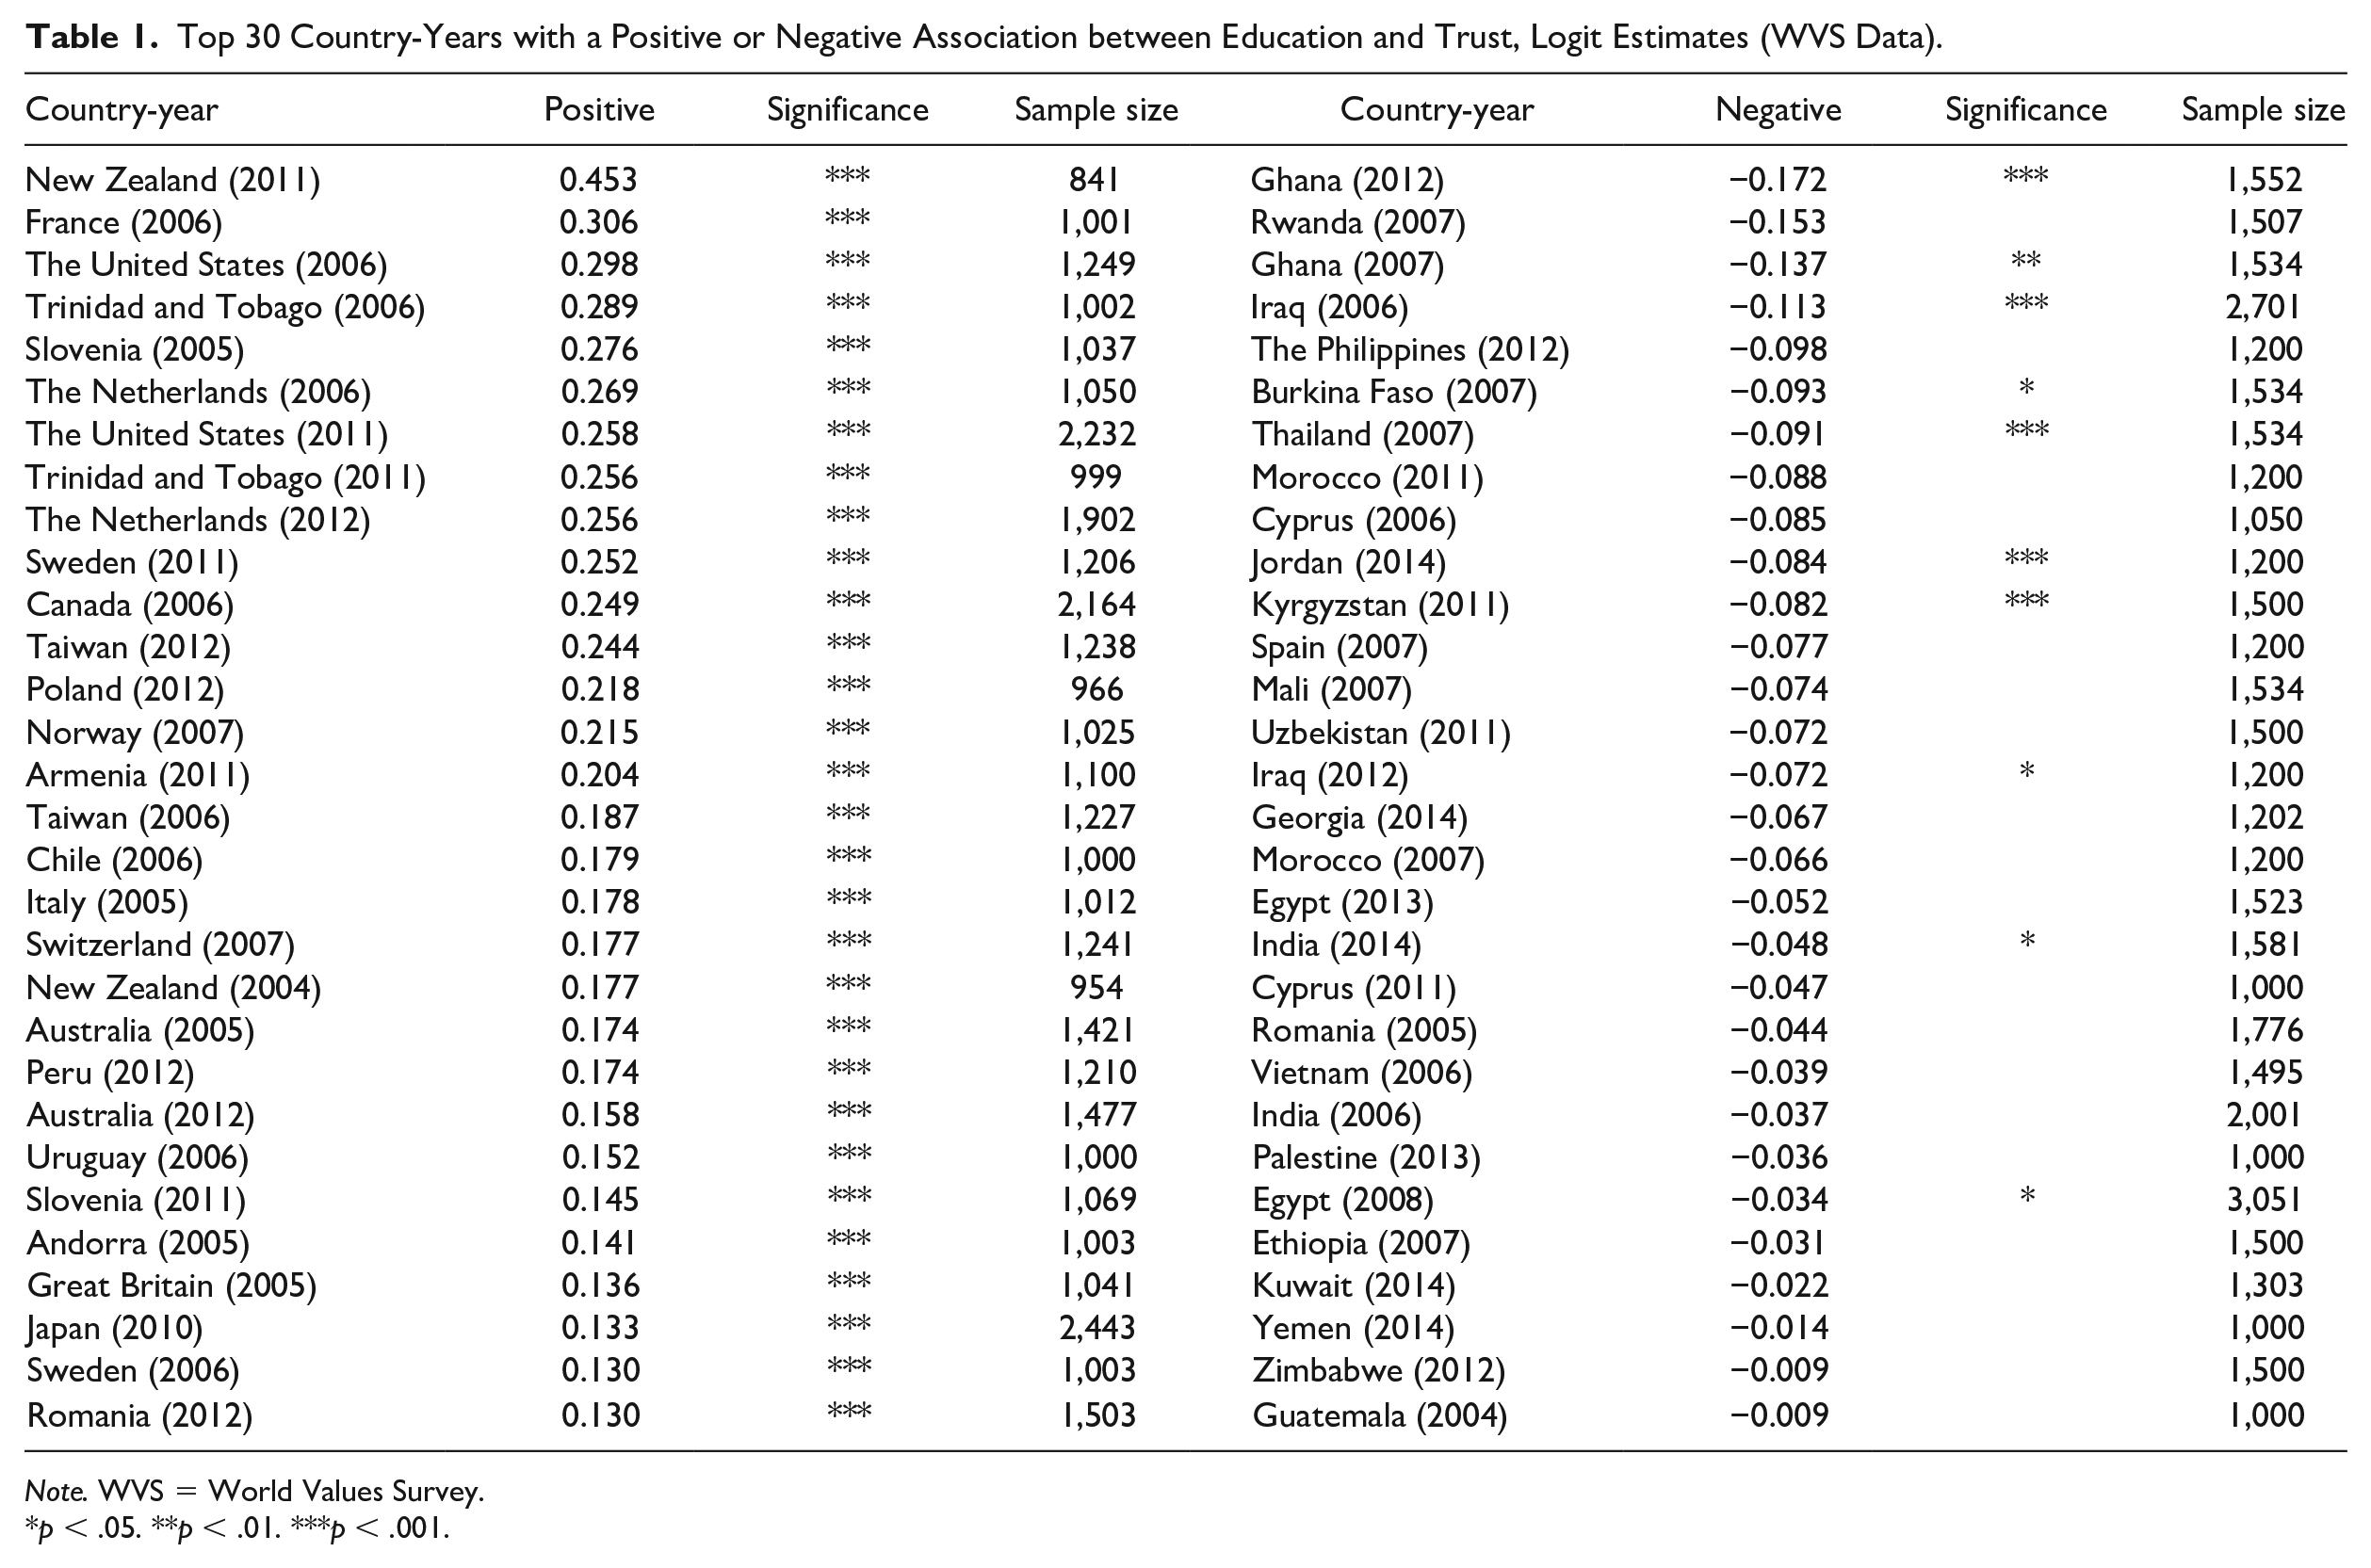
Note. WVS = World Values Survey.
p < .05. **p < .01. ***p < .001.
Figure 1 shows a scatterplot between education and trust association coefficients and the WGI political instability index at the country-year level. Overall, we can see that as the political instability index increases, the association between education and trust changes from positive to negative. In country-years where the political instability index is low, the association is highly positive. These include, for example, New Zealand (2007 and 2011), Sweden (2006 and 2011), Japan (2005 and 2010), Germany (2013), Norway (2007 and 2012), South Korea (2005), Chile (2006), and the United States (2006 and 2011). However, the association between education and trust is negative in country-years where the political instability index is high, such as Ghana (2007 and 2012), Iraq (2006), India (2006 and 2014), Egypt (2008 and 2013), Ethiopia (2007), Rwanda (2007), and Yemen (2014). The Pearson correlation coefficient (r = –.549) confirms that there is a moderate relationship between the level of political instability and the change in education and trust association. This is to suggest that sociopolitical risks at the macro level moderate how education and trust are associated at the individual level.
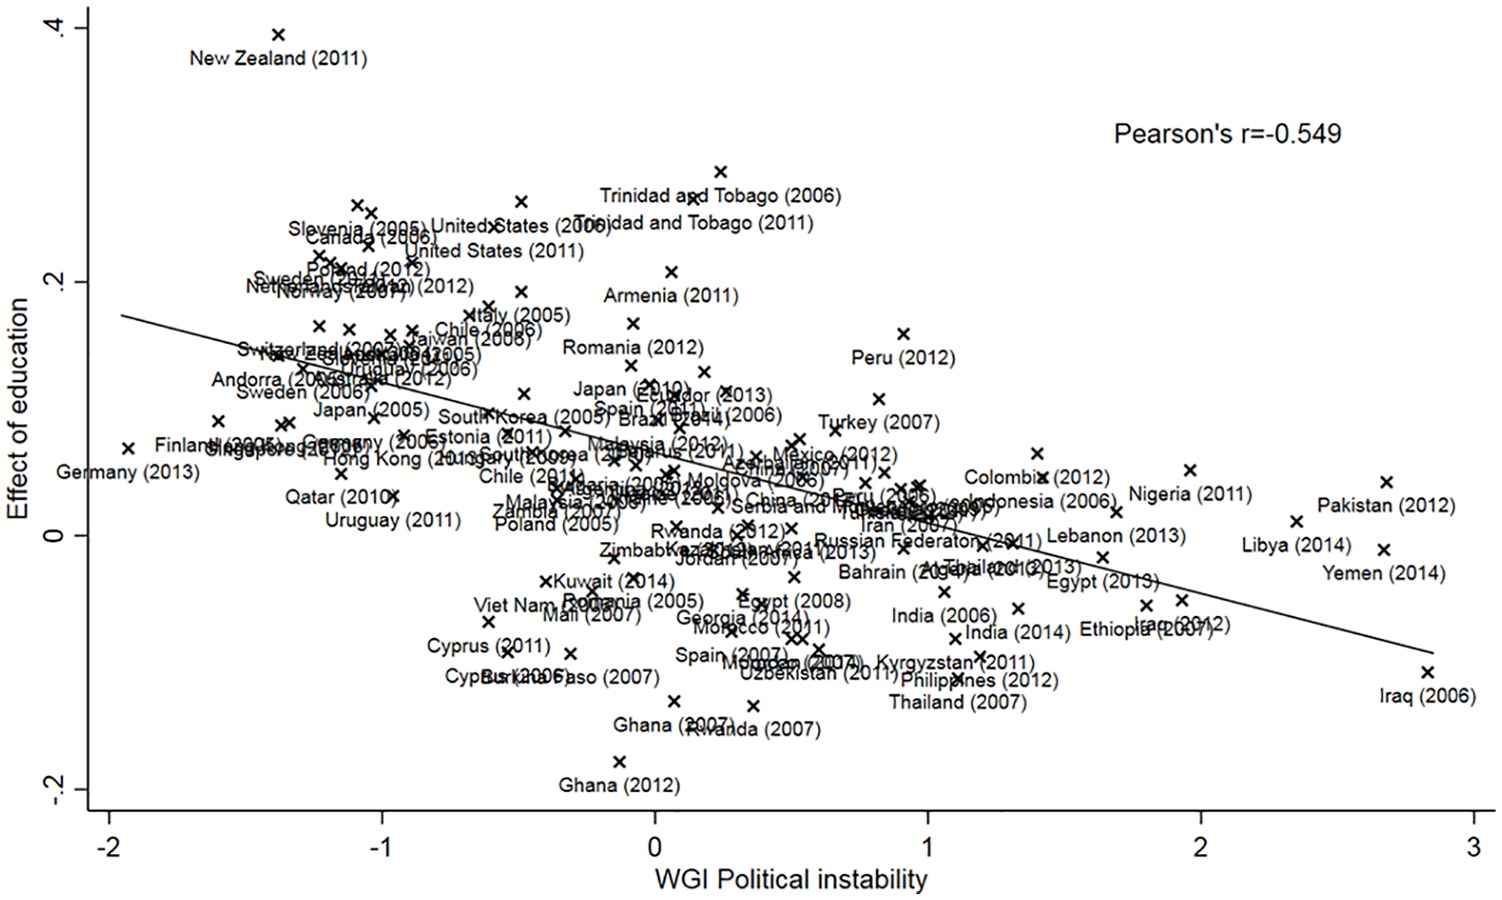
Scatterplot between education and trust association and WGI political instability index.
Next, I run a random intercepts model to predict how, cross-nationally, education and political instability interact with each other to shape trust. Specifically, I include a cross-level interaction term between education at the individual level and political instability at the country-year level with controlling for both individual demographics and country-year factors such as democracy, level of corruption, per capita GDP, and ethnic diversity index (see A. Table 1 for full modeling results). Figure 2 provides a visualization of the interaction effect. It shows that when the political instability index is negative (indicating more stable societies), individuals with higher levels of educational attainment express higher levels of trust. However, in unstable and high-conflict societies (political instability > 1), more educated individuals become the least trusting group while the less educated individuals become the most trusting group.
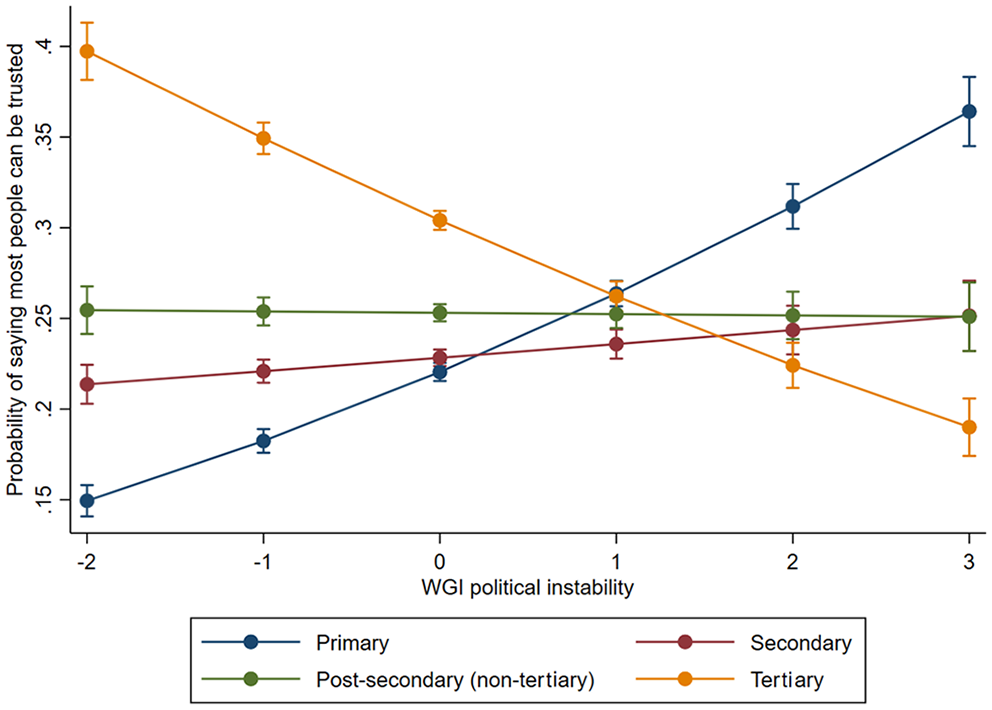
Cross-level interaction between education and political instability in shaping trust.
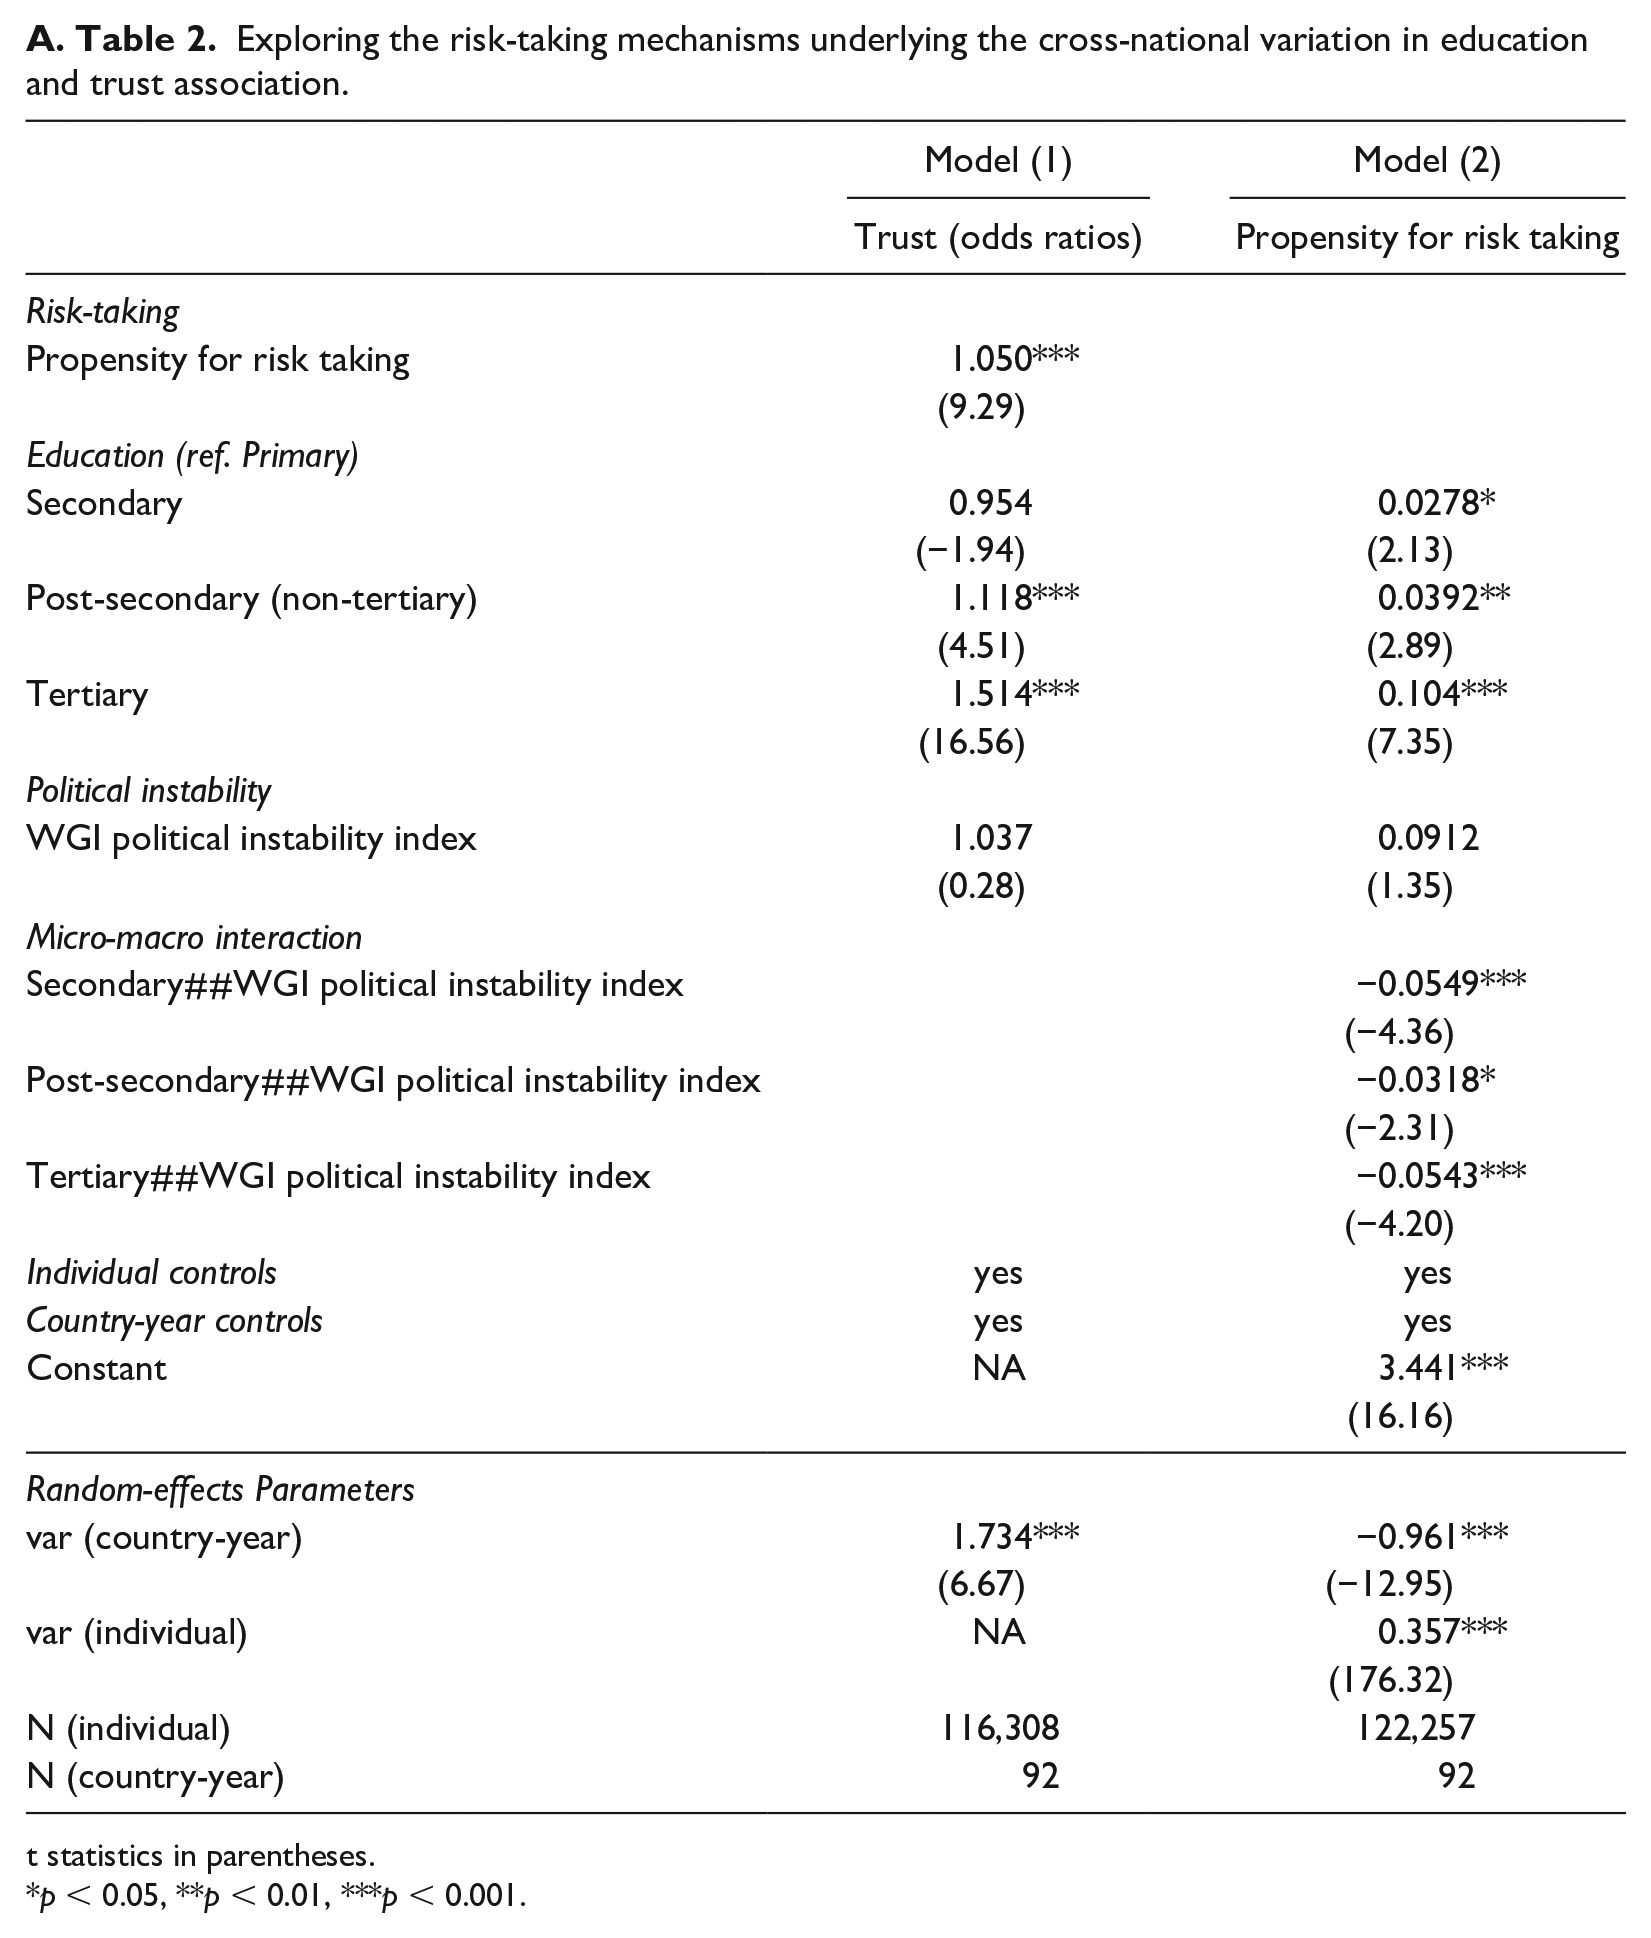
Furthermore, I consider whether risk-taking behavior may help explain the changing association between education and trust across contexts with different levels of sociopolitical risk. Random intercept models show that (1) higher risk-taking propensity leads to higher levels of trust, and (2) individual education interacts with the macro-level sociopolitical risks to shape people’s risk-taking propensity. In fact, similar to how education and trust are associated cross-nationally, the results show that while in low-risk societies education is positively associated with risk-taking propensity, in countries with high levels of political instability, education and risk-taking propensity are negatively associated (see A. Table 2 for full modeling results).
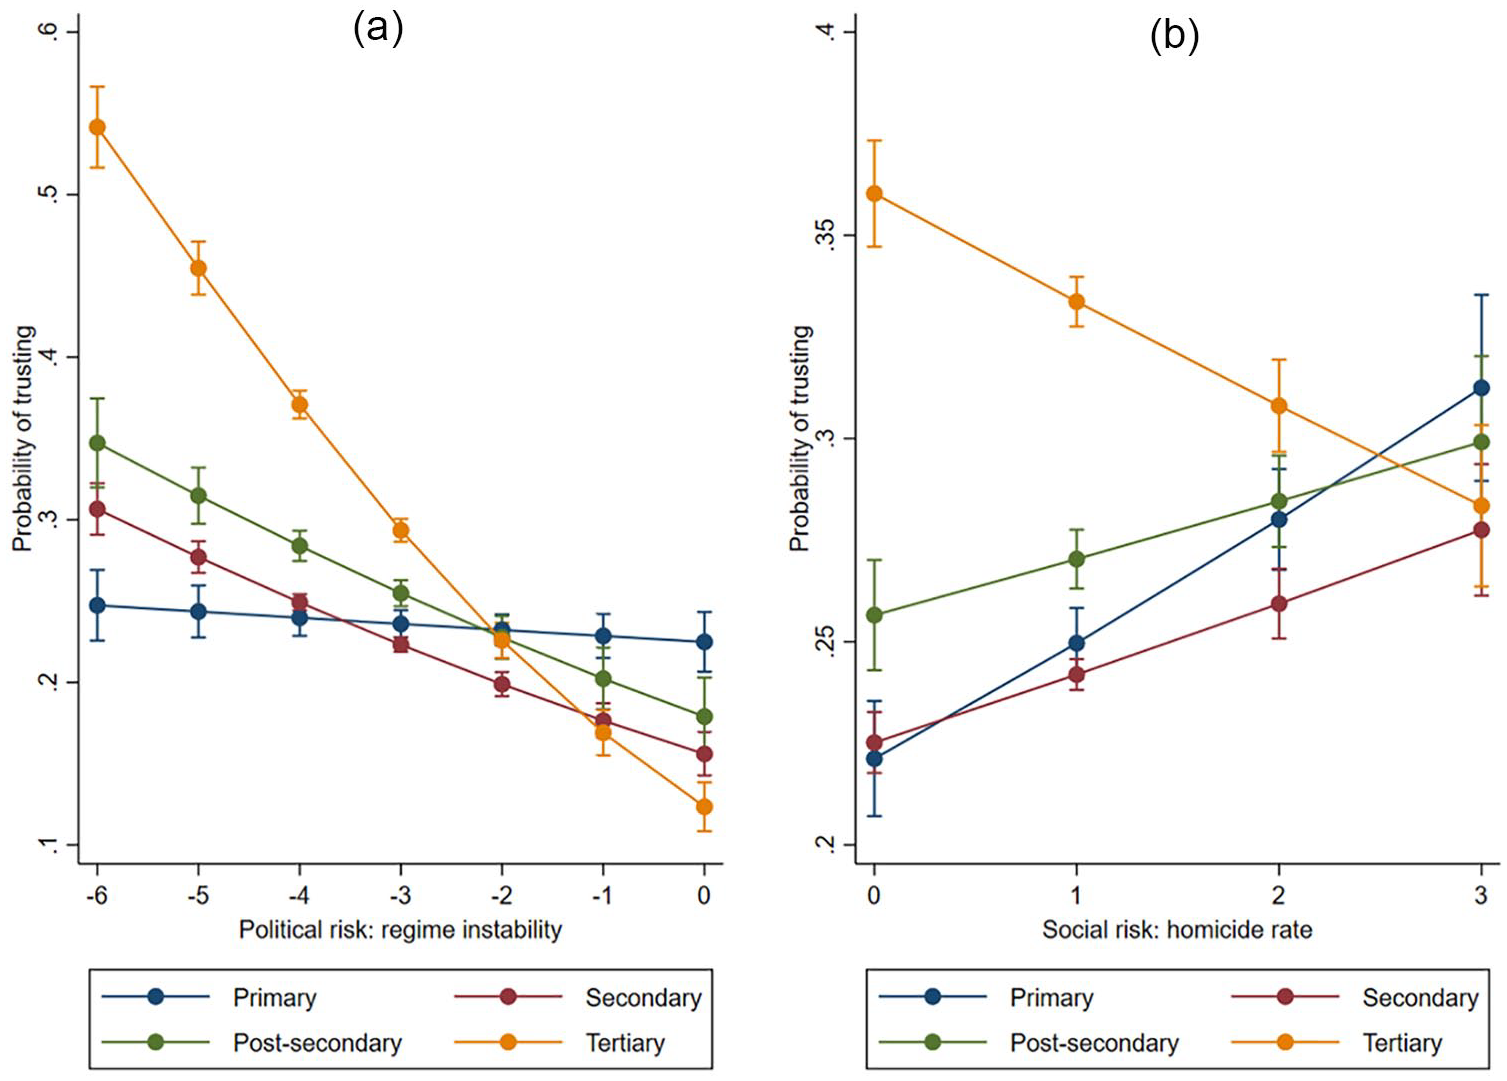
To provide robustness checks of the results, I replicate the above analyses using the recently released data from the WVS (Wave 7, 2016–2020). This new dataset includes macro-level variables for each nation such as per capita GDP, education equality, and level of democracy. In particular, it also includes two macro-level variables that can be used to capture the level of sociopolitical risks at the country level. The first is regime stability indicated by the total number of years since the most recent regime change, out of which I create political instability variable (log(1/(regime stability + 1))) at the country level, ranging approximately from –6 to 0. The second is the rate of homicide (per 100,000 people), out of which I create a social risk variable (=log(homicide rate + 1)) that ranges from 0 to 3.5. Countries that score high in both indices include, for example, Iraq, Turkey, Mexico, Zimbabwe, and Russia. Countries that show low political and social risks include, for example, Switzerland, Sweden, Japan, New Zealand, the United Kingdom, France, Australia, and Denmark.
Figure 3 displays the scatterplots between education and trust association and indices of political risk (Figure 3a) and social risk (Figure 3b). These scatterplots clearly show that the education and trust association changes from positive to negative as the level of social and political risks increases. The stronger Pearson correlation coefficient (r = –.64) between the education and trust association and political risk suggests that institutional stability may matter more than social stability in ensuring a positive association between education and trust.
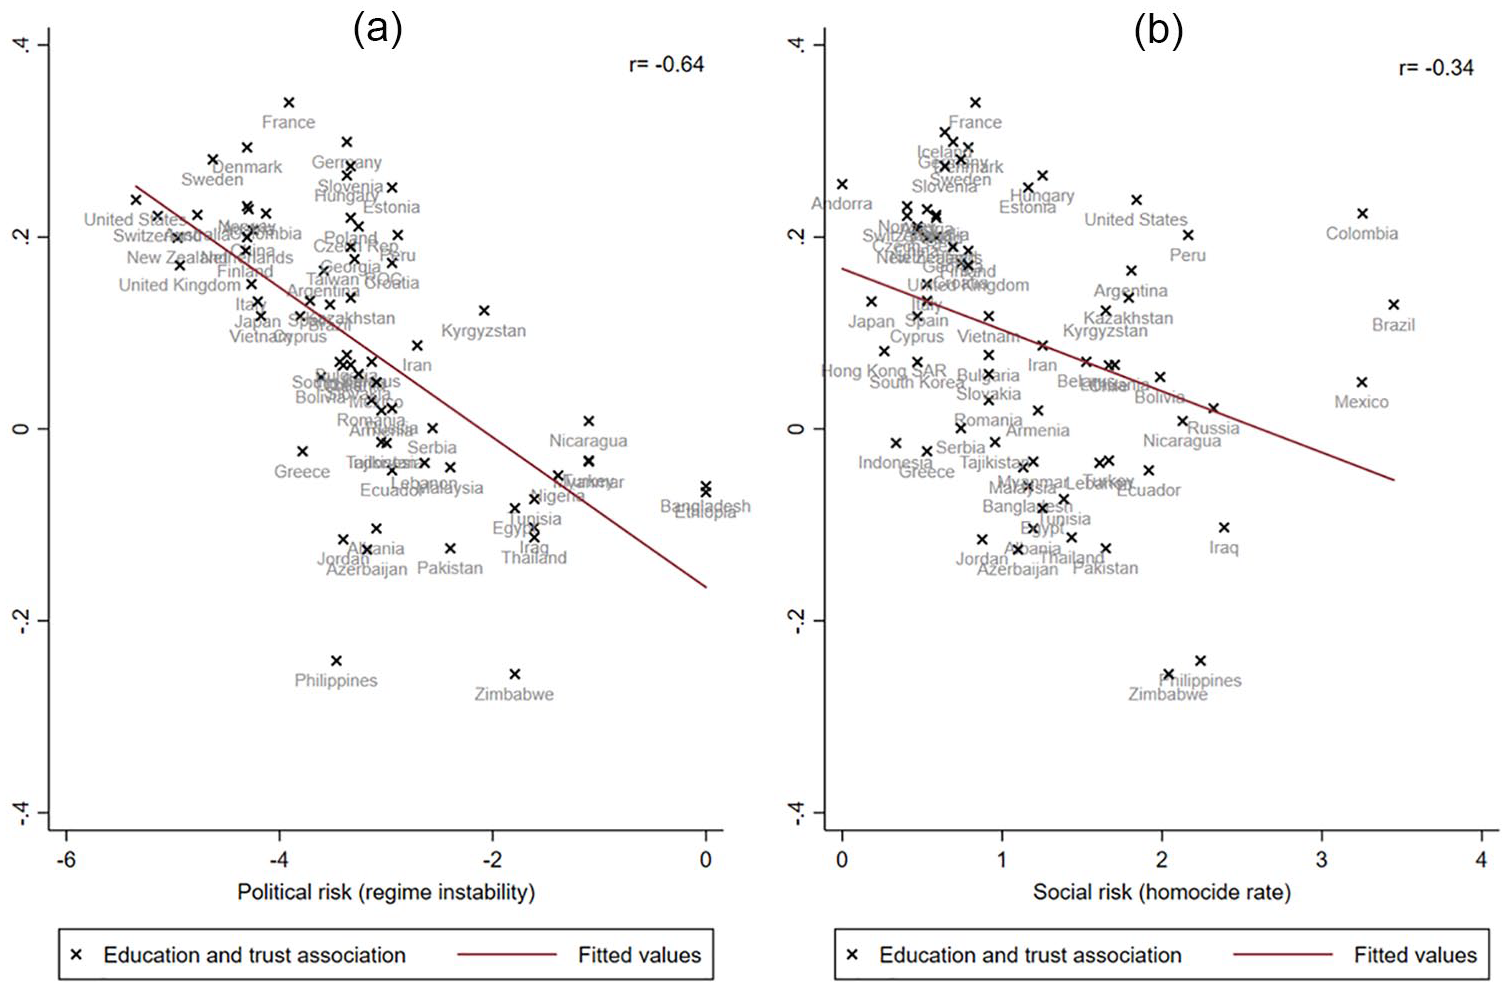
Scatterplots between education and trust association and indices of (a) political risk and (b) social risk.
Figure 4 provides the visualizations of results from two random intercept models with cross-level interactions between education and political instability (Figure 4a) as well as between education and social instability (Figure 4b) in predicting trust. We see a consistent pattern that the positive association between education and trust in stable and low-risk societies is reversed in unstable and high-risk societies. My additional analyses using this new data also show that education increases people’s risk awareness (e.g., whether respondents feel secure in their neighborhood), and this is particularly true in societies where there are widespread social and political risks.
Cross-level interactions between education and (a) political instability and (b) social instability in shaping trust.
Longitudinal: ESS
Taking advantage of the multiple waves of the ESS (2002–2016), I consider how the education and trust association may change within countries over time. Similarly, I run a separate OLS regression for each of the 32 European countries and across different waves (195 total country-wave units). All models include individual-level variables such as age, gender, marital status, as well as socioeconomic status measures such as income, employment status, and life satisfaction. The resulting OLS regression coefficients are used to indicate the education and trust association at the country-year level (for a visualization of the results, please see A. Figure 2). Findings show that while most countries in the analysis have a positive education and trust association (OLS coefficient > 0), the OLS coefficient is closer to or below 0 across waves in Russia (RU), Czech Republic (CZ), Lithuania (LT), and Ukraine (UA), suggesting a weak or even negative education and trust association.
Furthermore, I combine the resulting OLS coefficients that indicate education and trust association and WGI political instability index from the World Bank to create a country-level panel data that include 32 countries across multiple waves. Then, I estimate the pure effect of political instability on education and trust association within each country over time using the least squares dummy variable (LSDV) model. Figure 5 shows a scatterplot between the estimated education and trust association and political instability within countries over time. Clearly, not only is political instability negatively related to the association between education and trust cross-nationally (see also Figure 1), within each country over time (waves of data), we also see a negative relationship between education and trust association and political instability.
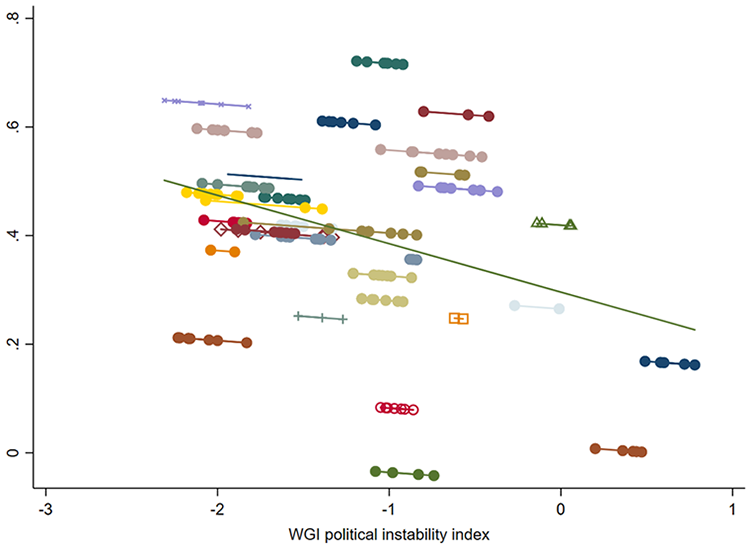
Scatterplot between within-country changes in political instability and education and trust association over time.
Finally, I run a fixed-effects model to investigate how changes in political instability may explain changes in education and trust association within countries over time (random-effects model is preferred based on a Hausman test, p = .41). Table 2 reports the results. It shows that a one-unit change in political instability will lead to 0.08 unit decrease in the education and trust association.
Fixed-Effects Regression Predicting the Effect of Political Instability on Education and Trust Association.
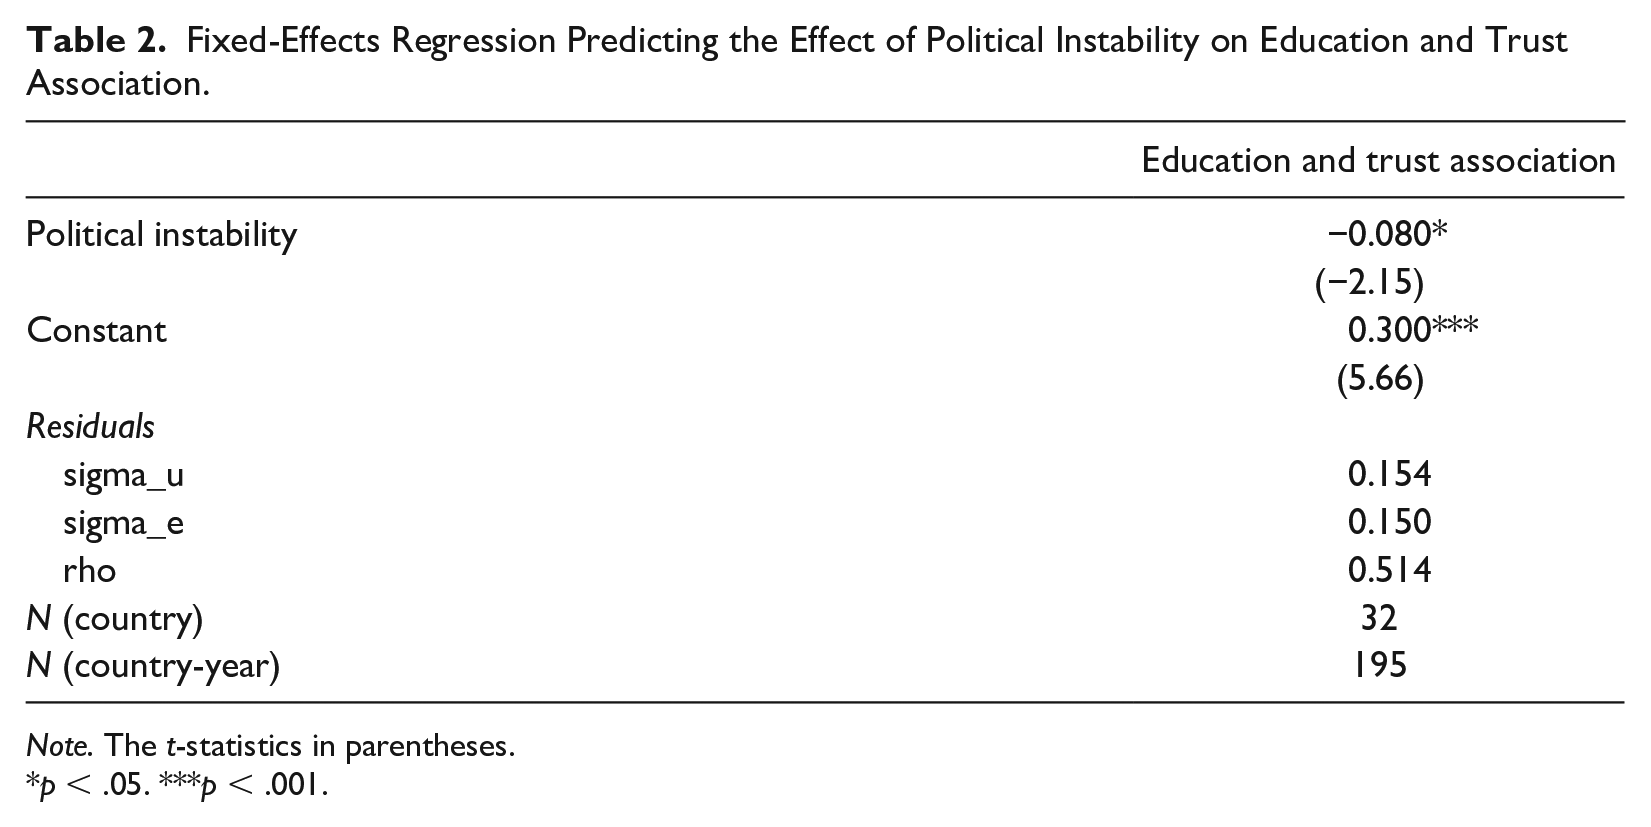
Note. The t-statistics in parentheses.
p < .05. ***p < .001.
Conclusion
It is commonly held that better educated individuals have more trust in others (e.g., Helliwell and Putnam 2007; Hooghe et al. 2012). In this study, I have considered how levels of trust differ across educational groups in different contexts globally. In line with recent cross-national studies (Borgonovi 2012; Charron and Rothstein 2016; Frederiksen, Larsen, and Lolle 2016; Güemes and Herreros 2019), my analysis of data from multiple sources, including three waves of the WVS, eight waves of the ESS, as well as country-level indicators from the World Bank, shows that the education and trust relation changes substantially both across countries and within countries over time.
Explaining why the education and trust association can be context-specific, I have considered education as an essential agent of socialization in the formation of trust and how the role interacts with institutional contexts. Specifically, I have argued that schools and the educational system could vary enormously across countries as well as time periods within a national context, and education could socialize people to different values, norms, and skills, and in ways that may or may not lead to trust (Borgonovi 2012; Charron and Rothstein 2016). For this reason, the socializing effects of education at the micro level may vary in response to specific contexts at the macro level. In particular, I have highlighted the role of political instability as a major factor that conditions how education and trust are related. Education is positively associated with trust only in stable and low-conflict societies such as the United States, Canada, France, Germany, Denmark, Sweden, and Japan. Conversely, in politically unstable and socially risky societies, including Egypt, Ghana, Jordan, India, Iraq, Romania, and Turkey, the education and trust association is negative. Longitudinally within national contexts, changes in political instability largely explain changes in how education and trust are related.
This research transcends the debate over whether socialization or institution is the primary determinant of trust (Uslaner 2002; Wu 2021). Instead, it shows that while socialization is a key formative mechanism of trust at the individual level, how people are socialized and educated is highly variable across different institutional contexts. The micro–macro interactive framework developed in this article provides a way to coherently explain the cross-national variations in the association between education and trust. Accordingly, it is essential that future research on the roots of trust gives greater emphasis to the interaction between individual-level mechanisms and the macro-level institutional setting. This theoretical framework can be easily adopted to study the varying roles education might play in shaping people’s other value orientations and social behaviors such as political trust, social engagement, and voting (for a similar approach, please see, for example, Hakhverdian and Mayne 2012).
The findings of this research also demonstrate the value of comparative research. In particular, doing comparative research helps prevent scholars from over-generalizing based on research from a specific context. Instead, it allows for the testing of research findings and theories across diverse settings (Esser and Vliegenthart 2017). For example, in terms of education, while it is long held, at least since the writings of John Dewey (1916), that education is beneficial for democracy, comparative research suggests that context matters (Weil 1985). Clive Harber (2002:268) indicates that “only democratic education can lead to democracy.” In terms of trust, it is also widely assumed that citizen’s trust in each other is essential for effective democratic governance (e.g., de Tocqueville 1835; Warren 1999). However, cross-national analysis shows that the democratic utility of trust largely depends on the existing levels of democracy within a country and therefore is not consistent cross-nationally (Jamal and Nooruddin 2010). In fact, who wants democracy can also be context-specific. Most recently, for example, Brandon Gorman, Ijlal Naqvi, and Charles Kurzman (2019) show that while high-income individuals in wealthier countries tend to have stronger support for democracy, in poorer countries high-income individuals are more likely to oppose democracy.
Supplemental Material
sj-pdf-1-spx-10.1177_0731121421990045 – Supplemental material for Education and Social Trust in Global Perspective
Supplemental material, sj-pdf-1-spx-10.1177_0731121421990045 for Education and Social Trust in Global Perspective by Cary Wu in Sociological Perspectives
Footnotes
Appendix
Exploring the risk-taking mechanisms underlying the cross-national variation in education and trust association.
| Model (1) | Model (2) | |
|---|---|---|
| Trust (odds ratios) | Propensity for risk taking | |
| Risk-taking | ||
| Propensity for risk taking | 1.050*** | |
| (9.29) | ||
| Education (ref. Primary) | ||
| Secondary | 0.954 | 0.0278* |
| (−1.94) | (2.13) | |
| Post-secondary (non-tertiary) | 1.118*** | 0.0392** |
| (4.51) | (2.89) | |
| Tertiary | 1.514*** | 0.104*** |
| (16.56) | (7.35) | |
| Political instability | ||
| WGI political instability index | 1.037 | 0.0912 |
| (0.28) | (1.35) | |
| Micro-macro interaction | ||
| Secondary##WGI political instability index | −0.0549*** | |
| (−4.36) | ||
| Post-secondary##WGI political instability index | −0.0318* | |
| (−2.31) | ||
| Tertiary##WGI political instability index | −0.0543*** | |
| (−4.20) | ||
| Individual controls | yes | yes |
| Country-year controls | yes | yes |
| Constant | NA | 3.441*** |
| (16.16) | ||
| Random-effects Parameters | ||
| var (country-year) | 1.734*** | −0.961*** |
| (6.67) | (−12.95) | |
| var (individual) | NA | 0.357*** |
| (176.32) | ||
| N (individual) | 116,308 | 122,257 |
| N (country-year) | 92 | 92 |
t statistics in parentheses.
p < 0.05, **p < 0.01, ***p < 0.001.
Declaration of Conflicting Interests
The author(s) declared no potential conflicts of interest with respect to the research, authorship, and/or publication of this article.
Funding
The author(s) received no financial support for the research, authorship, and/or publication of this article.
Notes
Author Biography
References
Supplementary Material
Please find the following supplemental material available below.
For Open Access articles published under a Creative Commons License, all supplemental material carries the same license as the article it is associated with.
For non-Open Access articles published, all supplemental material carries a non-exclusive license, and permission requests for re-use of supplemental material or any part of supplemental material shall be sent directly to the copyright owner as specified in the copyright notice associated with the article.