
Abstract
Tech firms are under strong pressure to increase their demographic diversity. While activists and scholars have tended to treat the sector as homogenously hostile to women and racialized minorities, recent theory on organizational inequalities stresses heterogeneity in firm-level inequality regimes. Beginning with an inductive exploration of variation in executive, managerial, and professional workforce trajectories, we find that between 2008 and 2016 most Tech firms show little change, but that there are also significant clusters of firms that were becoming either much more or much less diverse for all three occupational levels. We model these trajectories as a function of firm visibility, the regulation of federal contractors by the U.S. Department of Labor, and leadership composition. Multinomial logistic regression models show that firms with an increasing (decreasing) diversity pattern in managerial and executive positions are also more likely to become more (less) diverse in their much more numerous professional jobs. Managers are more influential than executive in this regard. Regulatory pressure is associated with increased executive diversity trajectories, but not with managerial or professional trajectories. We conclude that increased Tech diversity is possible but requires leadership, particularly at the middle manager level. In addition, regulatory and visibility pressures primarily produce symbolic shuffles in top jobs.
Responding to calls to theorize and observe the role of organizations in producing inequalities (Acker, 2006; Meyers & Vallas, 2016), we examine variation in firm-level demographic diversity shifts in the US Tech sector. We inductively discover multiple diversity trajectories for executive, managerial, and professional jobs (i.e., occupations within firms), using data on the population of US Tech firms that report their yearly demographic composition to the US Equal Employment Opportunity Commission (EEOC). We then test two prominent explanations as to why firms would change their demographic composition. The first focuses on the impact of influential decision makers, internal to the firm, among whom we distinguish between executives with power over firm procedures and practices and managers who are responsible for local decision making around hiring, pay, and work-team climate. The second explanation for diversity changes is the impact of external pressures, associated with firm visibility and federal oversight to promote increased diversity.
We focus on the Tech sector because it has been the target of criticism for lacking employment diversity and chilly climates toward all women and racialized peoples. Despite the rapid expansion of employment and revenue over the last few decades, women and racialized minorities remain underrepresented and highly segregated in the tech workforce (Cech, 2013; Gee & Peck, 2016; Glass et al., 2013; Prokos & Padavic, 2005), leading to multiple government investigations (EEOC, 2016; U.S. Government Accountability Office (GAO), 2017; U.S. House Committee on Science, Space and Technology, 2019). Consistently, sociological research has taken the White and male dominated Tech firms and occupations as focal sites for examining discrimination process and power dynamics, focusing on how sexuality, gender and race, and their intersections play out in the sector (e.g., Alegria, 2020; Alfrey & Twine, 2017; Cech, 2013; Glass et al., 2013; Luhr, 2024).
In past research, workplace demographic composition has been interpreted as an important indicator of trends in socio-economic exclusion and integration of racialized minorities and women (e.g., Ferguson & Koning, 2018; Stainback & Tomaskovic-Devey, 2012). Organizational processes of social inclusion and exclusion are reflected in differential sorting of workers between and within firms. Women, racialized peoples, and immigrants are found to be less likely than comparable workers to be employed in higher-paying firms or jobs (Brick et al., 2023; Dostie et al., 2023; Merlino et al., 2018). Much research finds that both between-firm sorting and within-firm segregation, combined with discrimination in hiring and promotions, often result in the majority groups’ dominance in both higher-paying occupations and firms (Gorman & Kmec, 2009; Kmec, 2005; Levanon & Grusky, 2016; Tomaskovic-Devey & Avent-Holt, 2019).
Theoretically, we see the demographic compositions of employees to be a result of firms’ inequality regimes (Acker, 2006). By inequality regime we are referring to the set of intertwined organizational practices and cultures that generate class, race, and gendered distributions of rewards and respect. Tomaskovic-Devey and Avent-Holt (2019) describe firms as inhabiting, adapting, and transforming, rather than simply reflecting, their institutional and cultural environments and, as a result, produce workplace specific inequality regimes. The key theoretical point is that we should expect firms to vary in terms of how and how much inequality flows from their set of organizational practices and cultures. This recognition leads to calls for the examination of variation in organizational inequality regimes (Acker, 2006; Meyers & Vallas, 2016; Tomaskovic-Devey & Avent-Holt, 2019). In contrast, prior research has mostly focused on average demographic trends across firms (e.g., Ferguson & Koning, 2018; Hines, 2020; Huffman et al., 2010).
We make two main contributions in this study. First, using panel data on the population of US Tech sector firms, we inductively explore multiple firm-level diversity trajectories for professional, managerial, and executive jobs. 1 Most prior research and political pressure groups treat the Tech sector as internally homogenous (e.g., Cech, 2013; Glass et al., 2013; Luhr, 2024; Prokos & Padavic, 2005). In contrast, we identify a set of qualitatively distinct firm diversity trajectories for multiple gender-race groups across multiple occupational levels. This contribution also helps distinguish between theoretical expectations of inertia and change in firms’ inequality and diversity regimes (Acker, 2006; Meyers & Vallas, 2016; Tomaskovic-Devey & Avent-Holt, 2019). Consistent with Ferguson and Koning (2018), we find that most Tech firms display inertia in their diversity regimes. But there are also firms with considerable increases and decreases in demographic diversity. It is the existence of these more dynamic firm trajectories which we try to explain with theories of internal leadership and external pressure to promote (or reject) employment diversity.
Second, we test hypotheses from two classic approaches to organizational change: the impact of leadership and environmental pressures. Representing endogenous change, we examine whether shifts in executive and managerial diversity profiles are associated with changes in professional demographic composition. We find evidence that both appear to be influential, although shifts in managerial composition seem to be more important. We also test two types of environmental pressure to diversify workforces: firm visibility and government regulatory pressure. Here we find evidence that most of the impact of such pressures is symbolic, leading to marginal changes in executive composition or supporting inertia in firm composition.
Because multiple occupations are knitted together in workplace divisions of labor, rewards, authority, and mobility, examining how internal leadership diversity and external pressures are tied with occupational diversity trajectories for professional, managerial, and executive jobs allows us to explore how they are in practice interconnected, as well as when they are only loosely coupled. With this approach, we can examine how firms expand or shrink their demographic profiles more comprehensively than prior studies. For example, studies examining whether executives and middle manager composition has stronger impacts on subordinate inequalities do not examine the role of external pressures (e.g., Stainback et al., 2016; Zimmermann, 2021) and those that examine how federal oversight is tied to diversity trajectories do not examine internal leadership processes (e.g., Shams & Tomaskovic-Devey, 2019). One of the few exceptions is Kurtulus and Tomaskovic-Devey (2012) who estimated interaction effects of federal oversights with top manager level gender diversity on subordinate middle managers’ gender composition. We incorporate both external visibility and regulatory pressure to diversify and internal executive and managerial diversity as potential explanations for firm diversity trajectories.
Diversity in US Tech Industry in Context
Over the past 20 years US Tech firms have seen robust employment and revenue growth, created high-paying jobs, and produced outsized returns to executives, shareholders, and employees (GAO, 2017; Thompson, 2017). The median annual wage of all workers in the US Tech sector is about double that in non-Tech industries and professional workers’ median annual wage is up to 48% higher in Tech than in non-Tech firms (Roberts & Wolf, 2018; Rothsetin, 2022). Access to high-paying jobs in Tech is not, however, equally distributed and Tech sector firms have been described as having insular cultures and disproportionately high levels of hiring and retention of White and Asian men (Cech, 2013; Gee & Peck, 2016; Glass et al., 2013; Prokos & Padavic, 2005).
At the same time the sector has become the object of political pressure because of their low levels of women and racialized minorities in these rapidly growing highly rewarded jobs (Alegria, 2020; Cech, 2013; EEOC, 2016; GAO, 2017; Gee & Peck, 2016; Glass et al., 2013; Prokos & Padavic, 2005; Sheares, 2021). This pressure for increased diversity has been most intense around gender, with issues of both exclusive workplace climates and a leaky, high-turnover, employment pipeline as the most often cited sources of low levels of women's employment (Alfrey & Twine, 2017; Luhr, 2024; Scott et al., 2017). Advocacy for racial diversity in Tech has also deepened. Black and Hispanic employees are rare in all of the core roles in Tech and generally not fully incorporated into workplace professional cultures (Alegria, 2020; GAO, 2017; Sheares, 2021; Tomaskovic-Devey & Han, 2018). The same is true of the venture capital firms propelling Tech sector expansion (Shieber, 2019). Tech workers’ protests for racial justice have highlighted the lack of diversity in Tech as well (Taft & Kanaracus, 2020). While Asian employees are widespread in professional-technical roles, scholars and advocates have noted lower rates of representation in managerial and especially executive jobs, with Asian professionals facing sustained barriers to leadership positions (Alegria, 2020; Gee & Peck, 2016).
The demographic insularity of the Tech sector has led to congressional hearings (U.S. House Committee on Science, Space and Technology, 2019), as well as investigations by both the EEOC (2016) and the GAO (2017). Despite the large interests in tech worker diversity, there has been almost no systemic scientific research on diversity trends at the firm level. Exceptionally, Tomaskovic-Devey and Han (2018) cross-sectionally showed considerable firm-level variation in demographic diversity among the 177 large tech firms in Silicon Valley. Their point was that demographic diversity was possible in this sector and that firm variation should be recognized and examined. We extend this focus to examining longitudinal change in demographic diversity at the firm level in the 10 largest US tech labor markets.
Underrepresentation of and discrimination against women and racialized minorities suggest a sector-wide lack of diversity. Furthermore, given organizational resistance to change (Hannan & Freeman, 1984; Knight et al., 2022; Stainback et al., 2010) and both the elective adoption and widespread failures of diversity programs (Dobbin & Kalev, 2016; Dobbin et al., 2011; Williams et al., 2014), dramatic shifts in firm demographic composition may be rare or even absent. This would be the case if the sector had such a strongly institutionalized inequality culture that little organizational variation exists. On the other hand, Tomaskovic-Devey and Han's (2018) report on Silicon Valley Tech diversity suggests that there is organizational heterogeneity in this population. Exploring heterogenous diversity trajectories, we show that it is possible, albeit uncommon, for Tech firms to expand, or conversely contract, their demographic diversity.
Theorizing Changes in Tech Firm Diversity
We conceptualize workplace demographic diversity as reflecting processes of social inclusion and exclusion in which firms recruit and retain different demographic groups. Current theorizing stresses the need to study variation in organizational inequality regimes (Acker, 2006; Meyers & Vallas, 2016; Tomaskovic-Devey & Avent-Holt, 2019). These authors theorize patterns of demographic inclusion and exclusion as the product of organizational policies, practices, and cultural expectations. We conceptualize our observed firm-level demographic diversity trajectories as potential outcomes of these underlying firm inequality regimes, including human resource hiring practices, cultural expectations, and firm climate that influence hiring and turnover. We differ from past use of the regime concept in our focus on change in inequality regimes. This idea of change is present in past usage, but the regime concept tends to point toward inertia in firm practices and culture. We document that for most firms their diversity regimes are in fact stable, but for a subset, inequality regimes change quite dramatically. We also show that change in professional diversity composition is associated with change in leadership composition but is unresponsive to visibility and regulatory pressures.
While it is possible for there to be a shared sectoral culture, the actual relational architecture is at the firm level. In developing Relational Inequality Theory (RIT) Tomaskovic-Devey and Avent-Holt (2019) explicitly make this argument, describing firms as crucial actors endogenously generating and adapting their inequality regimes. RIT takes this observation and predicts substantial firm-level heterogeneity in patterns and mechanisms of inequality even among firms in the same industry.
In what follows we ask, are there distinct firm-level trajectories in Tech sector diversity? With the exception of Meyers and Vallas (2016) qualitative comparison of two worker-owned firms, prior research has not been interested in identifying which firms are better and which firms are worse at diversifying their labor forces. Most existing studies focus on trends in average demographic representations across nations or sectors rather than on heterogeneous trends in firm diversity (e.g., Ferguson & Koning, 2018; Hines, 2020; Huffman et al., 2010). One exception is Shams and Tomaskovic-Devey (2019) who argue that inductive approaches to identify diversity in firm trajectories can reveal dynamics that are obscured in conventional averaging statistics. Similarly, our approach reveals firm variation typically obscured in conventional statistical approaches focusing on average trends. We, nonetheless, differ from their focus on managerial trajectories in two regards. First, we expand our lens to include a wider perspective on the division of labor including executives, managers, and professionals and how leadership trajectories are associated with the trajectories of core professional occupations. Second, that paper focused on latent classes of trajectories, mapping yearly changes in managerial representation. Consistent with the inequality regime conceptualization, we take a firm, rather than occupation, centered approach, inductively grouping firms into latent classes defined by change across longer periods. Their paper found very unstable trajectories for Black women and Black men managers, representing, they reasoned, substantial churning at the firm level. By observing a longer period, we focus on longer term and potentially more stable shifts in demographic diversity.
Earlier research suggests that tradeoffs and competition among race/gender groups exist. The most well-known is that the chilly climate in Tech firms leads to high levels of internal disrespect and resulting turnover among women (Scott et al., 2017) and non-Asian people of color (Alegria, 2020). Asian representation in Tech is relatively high compared to other sectors, particularly in technically skilled positions. Tech sector exclusion has been found to be intense, particularly between men and women in professional jobs (Campero, 2020; Cech, 2013; Luhr, 2024), men and women in managerial positions (Alegria, 2019), and between Whites and Asians across authority levels (Gee & Peck, 2016). There are, of course, other bases of exclusion that often intersect with gender and race/ethnicity, including friendships, gender presentation, and elite education (Alfrey & Twine, 2017; Chavez, 2020; Luhr, 2024). 2
Mechanisms Producing Diversity Regime Trajectories
Internal Leadership and Manager Decision-Making
Prior research concentrates attention on changes in leadership demographics as a strategy to broaden firm demographic diversity (e.g., Hirsh, 2009; Huffman et al., 2010; Stainback et al., 2016; Zimmermann, 2021). In this research, more women managers and executives have been found to be associated with lower gender wage gaps (Flabbi et al., 2019; Fuller & Kim, 2023), increased gender diversity in lower-level positions (Kurtulus & Tomaskovic-Devey, 2012), and more support for diversity policies (Dobbin et al., 2011).
This literature on leadership diversity leads us to expect that executive and managerial diversity trajectories will tend to map onto subordinate professional workforce diversity trajectories. Zimmermann (2021), focusing on German workplaces, points toward managers as particularly important change agents for gender wage inequality, stressing interactional homophily with workers and control over hiring, pay setting and department level culture as the important causal mechanisms. Stainback et al. (2024) find that manager gender composition only impacts the gender composition of the employment level directly below in Australia. In contrast, Stainback et al. (2016) find for US Fortune 100 firms, looking simultaneously at director, executive and managerial gender composition, that higher-level actors have the stronger gender desegregation effects. Thus, if the mechanism is general corporate leadership, the impact of executive level trajectories will be stronger than managerial diversity as found by Stainback et al. (2016). Conversely, if the dominant mechanism is routine managerial decision making, then managerial trajectories will be a stronger predictor of professional diversity profiles than executive patterns, as suggested by Zimmermann (2021) and Stainback et al. (2024). Of course, since these studies were done in different countries, it may be that managers are more powerful in Germany and Australia, while executives are more decisive in the United States.
Accounts of tokenism suggest that diversity in leadership may be merely symbolic and diversity in core production occupations will not change even with the expansion of diversity at the executive level because political pressures are often limited to visible top positions. Graham et al. (2016), for instance, reveal that while some firms include Human Resources officers in their top management teams to signal that they are committed to expanding diversity, such nominal behaviors do not change firms’ gender composition. Firms may also create chief diversity officer positions to recruit and retain talent, particularly in innovation-intensive industries (Shi et al., 2018). These appointments have explicit goals of promoting diversity gains, but in practice may primarily be symbolic responses to environmental pressures. Yet, even symbolic diversity at the top may trickle down to practical workplace diversity if executives and managers put efforts into diversifying subordinate workforces or workforces interpret integrated leadership as a signal that career climates are welcoming (Huffman et al., 2010; Kurtulus & Tomaskovic-Devey, 2012; Skaggs et al., 2012). Over a longer time scale, increasing diversity at the top may be a firm strategy to solve the problem of middle manager resistance to diversity initiatives (Dobbin & Kalev, 2016).
3
We do not offer a hypothesis on the relative strength of executive and managerial diversity trajectories, but note that the literature leads to contradictory expectations.
Hypothesis 1: Executive and managerial diversity trajectory classes will be associated with professional diversity trajectory classes net of each other.
External Environmental Pressure
While firms tend to be resistant to change due to organizational inertia (Hannan & Freeman, 1984; Knight et al., 2022; Stainback et al., 2010), firms may be forced to diversify workforces in response to external pressures. Visible firms are more likely to receive such pressure and so may diversify their workforces faster than others (McTague et al., 2009; Mun & Jung, 2018). For example, Knight et al. (2022) find that only large visible firms tend to change firm diversity after discrimination lawsuits, but also that these responses are often limited to visible executive positions. In a close study of diversity initiatives, Berrey (2015) finds that some firms value executive diversity primarily to avoid the embarrassment of all male or all White executive photos. Consistent with the visibility thesis, a disproportionate number of visible (the S&P 1500) firms tend to have exactly “two women” in their boards, meeting but not exceeding a social norm on corporate diversity (Chang et al., 2019).
Hypothesis 2a: The largest tech firms are more visible and the target of political pressure and so are more likely to be in the class of firms with strongly increasing diversity trajectories.
Hypothesis 2b: If primarily symbolic, this effect will be confined to executive jobs.
Regulatory pressure may encourage firms to diversify their workforce as well. Federal contractors are legally mandated to practice affirmative action in hiring and promotion and are at risk for periodic audits by the Department of Labor's Office of Federal Contract Compliance Programs (OFCCP). As a result, one might expect that federal contractors are more likely to be in the class of firms with strong increases in diversity. Prior research sheds doubt on this expectation, showing that effective regulatory pressure on federal contractors was present before 1980 (Leonard, 1984; 1990), but seems to have dissipated by our observation period (Kalev & Dobbin, 2006; Kurtulus, 2012; 2016; Stainback & Tomaskovic-Devey, 2012). If regulatory pressure results in primarily symbolic responses, we would expect its effects to be limited to executive positions.
Focusing on managerial positions for a general population of firms in the 1990–2005 period, Shams and Tomaskovic-Devey (2019) find that federal contractors are more likely to have stable managerial trajectories for White men, White women, Black men, and Black women, concluding that the primary effect of regulatory Affirmative Action mandates was to encourage inertia in employment practices. Zhang (2022) argues that stalling racial integration at the managerial level in the private sector followed Affirmative action bans in the public sector, demonstrating primarily symbolic response to normative pressure for increased diversity. Zhang (2022), however, also finds that these diversity retrenchment events are less common among federal contractors. Both studies suggest that being a federal contractor reduces the probability of being in the class of firms with strong rises or declines in employment diversity.
Hypothesis 3a: Because of regulatory pressure, federal contractors are more likely to be in the class of firms with strongly increasing diversity classes but less likely to be in the strongly declining diversity class.
Hypothesis 3b: If primarily symbolic, this response will be confined to executive jobs.
Importantly, we do not think that managerial and executive leadership are the only sources of endogenous change within firms, or that top 50 visibility and federal regulatory pressures are the only sources of institutional pressure. They are simply the concepts we can operationalize with the available data. Employee organizing and protests, the effectiveness of Diversity officers, and executive's political and moral commitments are all likely to propel endogenous change in diversity regimes. Similarly, external political pressures from state governments, union drives, and social movements are in particular historical moments likely to be influential.
Data and Methods
We observe Tech firms based on the 55 six-digit industry codes (NAICS) identified as Tech-related by the GAO (2017) and four additional industries prevalent among Silicon Valley tech firms (Tomaskovic-Devey & Han, 2018). The list of Tech industries is in Appendix A. The GAO (2017) also identified the 10 largest Tech labor markets as San Francisco, New York, Washington DC, Los Angeles, Seattle, Boston, Dallas, Chicago, Atlanta, and Philadelphia. We focus on these ten cities and their surrounding metropolitan areas since the supply of potential employees is well defined. As a proxy for the demographic compositions of local labor supply, potential differences in the degree of racial and gender discrimination, and geographic contexts of occupational segregation across the cities (Cohen & Huffman, 2003a, 2003b; Mai, 2023), we control for city dummies in models exploring hypotheses 1–3.
Since 1966 the EEOC has been collecting legally mandated establishment-level reports on demographic composition within one-digit occupations for all US workplaces with more than 50 employees if federal contractors and 100 employees if not. Using these workplace-level data from the EEOC for 2008–2016, we define all establishments owned by the same firm within the top 10 local Tech labor markets as a distinct Tech employer. We refer to this local employer as a firm hereafter. For example, all Microsoft establishments in San Francisco are grouped into one local firm and those in New York into another. We group establishments in the same firm within each city for four reasons. First, we reason that they share a local managerial reporting structure. Executives are rare at the establishment level, but common at the local labor market level. Second, it allows workers to move between establishments in the same firm and city, thus internal firm transfers are not observed as a shift in demographic composition. Third, each city has distinct racial groups in their labor supply, so we can use city as a control for supply side demographic composition. Finally, our latent class models are fragile when cell sizes are small, so aggregation helps in this regard. Even so to make trajectories converge we grouped Hispanic and Black employees together separately by gender.
That the EEOC does not collect data on smaller workplaces is a limitation of the data. Using these data, we miss the smallest start-up firms but can observe diversity trajectories for all others. 4 We do learn (Table 3) that large firms are less likely to be in the dynamic latent classes, thus suspect that if we had smaller firms, we would also have found more firms in the more dynamic latent classes.
Relative Risk Ratios of Executive and Managerial Diversity Classes on Professional Diversity Classes From Multinomial Logistic Regressions With Firm Attributes and Geographic Controls (N = 8,323).
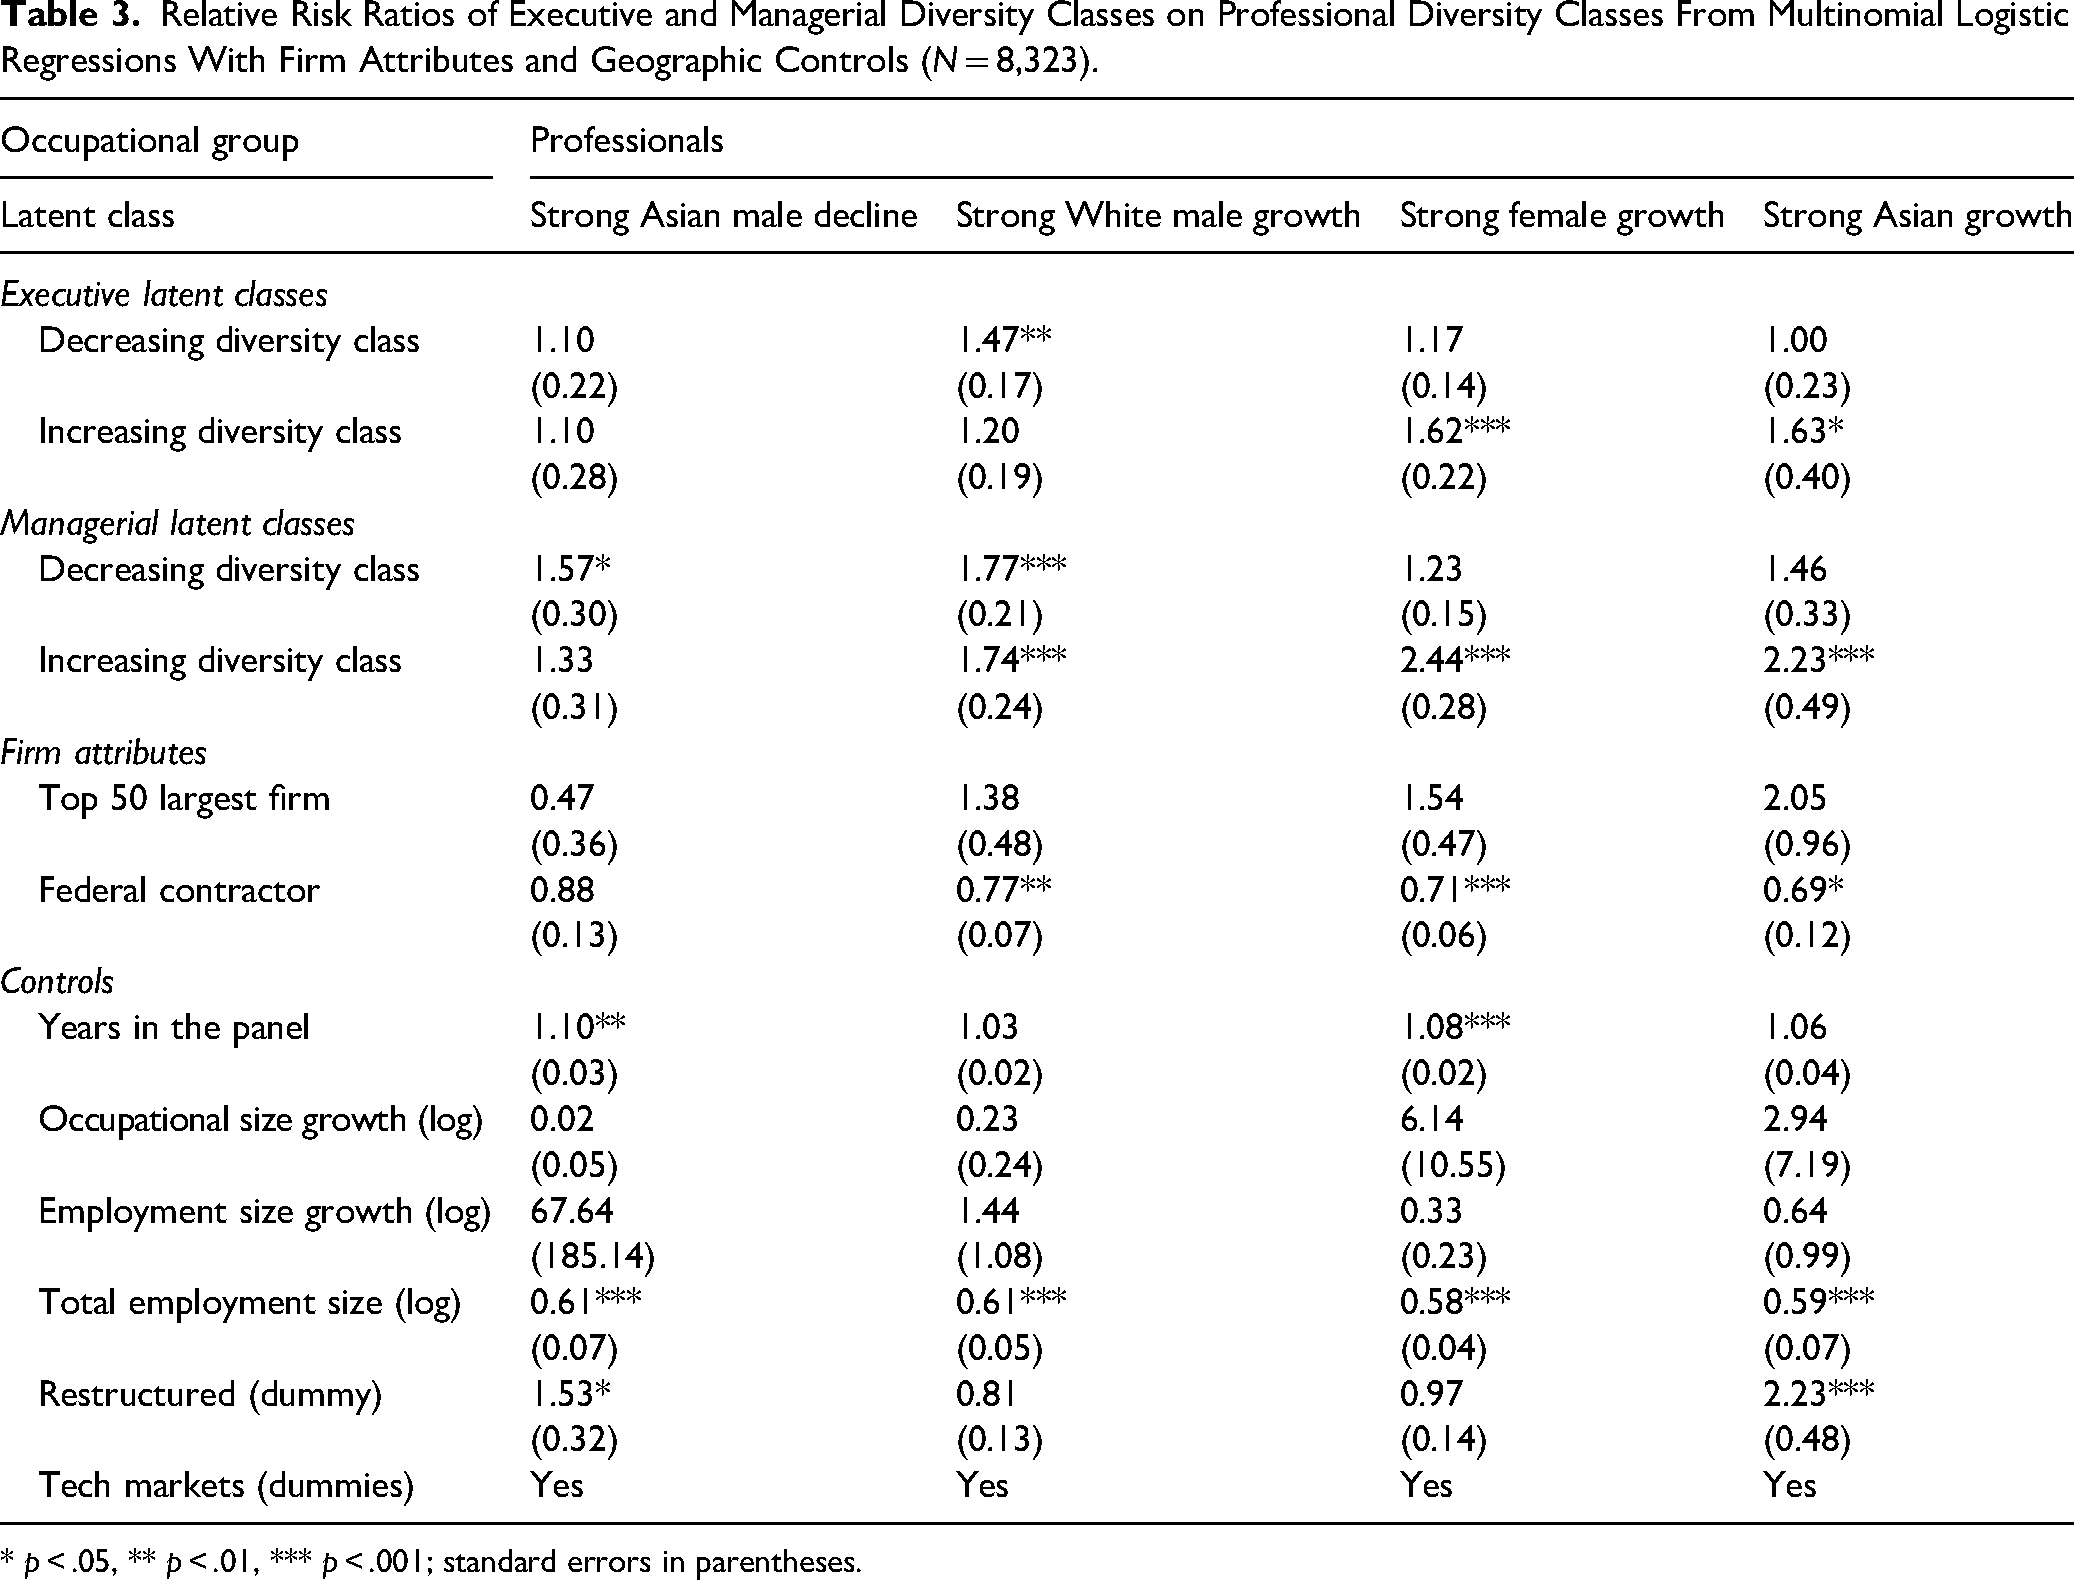
* p < .05, ** p < .01, *** p < .001; standard errors in parentheses.
We focus our analyses on professional, managerial, and executive jobs. Executives are the leadership roles responsible for both firms’ diversity and financial returns. Managers implement policy and coordinate tasks. Professional occupations are the core roles in Tech firms, both because they constitute a larger share of employment in Tech than in other sectors and are central to Tech product innovation (EEOC, 2016; Roberts & Wolf, 2018). Professional occupations include data scientists, computer engineers, programmers, and systems analysts among many more specialized technical roles. It can also include other professions who play support roles (e.g., accountants) but we are confident that at the workplace level these are few relative to technical professionals. 5 Research by the EEOC (2016) shows that most professionals in our sampled tech industries have specializations in STEM occupations as well. Unfortunately, the data do not allow us to disaggregate into more specific occupations.
One route to diversity in Tech is to expand staff professional roles, such as accountants and lawyers. Similarly, managerial diversity may occur in larger firms through the expansion of human resource or benefits managers, who support but do not participate in core technical roles. 6 While we cannot observe these distinctions in our data, we adjust for potential diversity changes via nontechnical occupational growth by controlling for both firm and occupational growth in our hypothesis testing models.
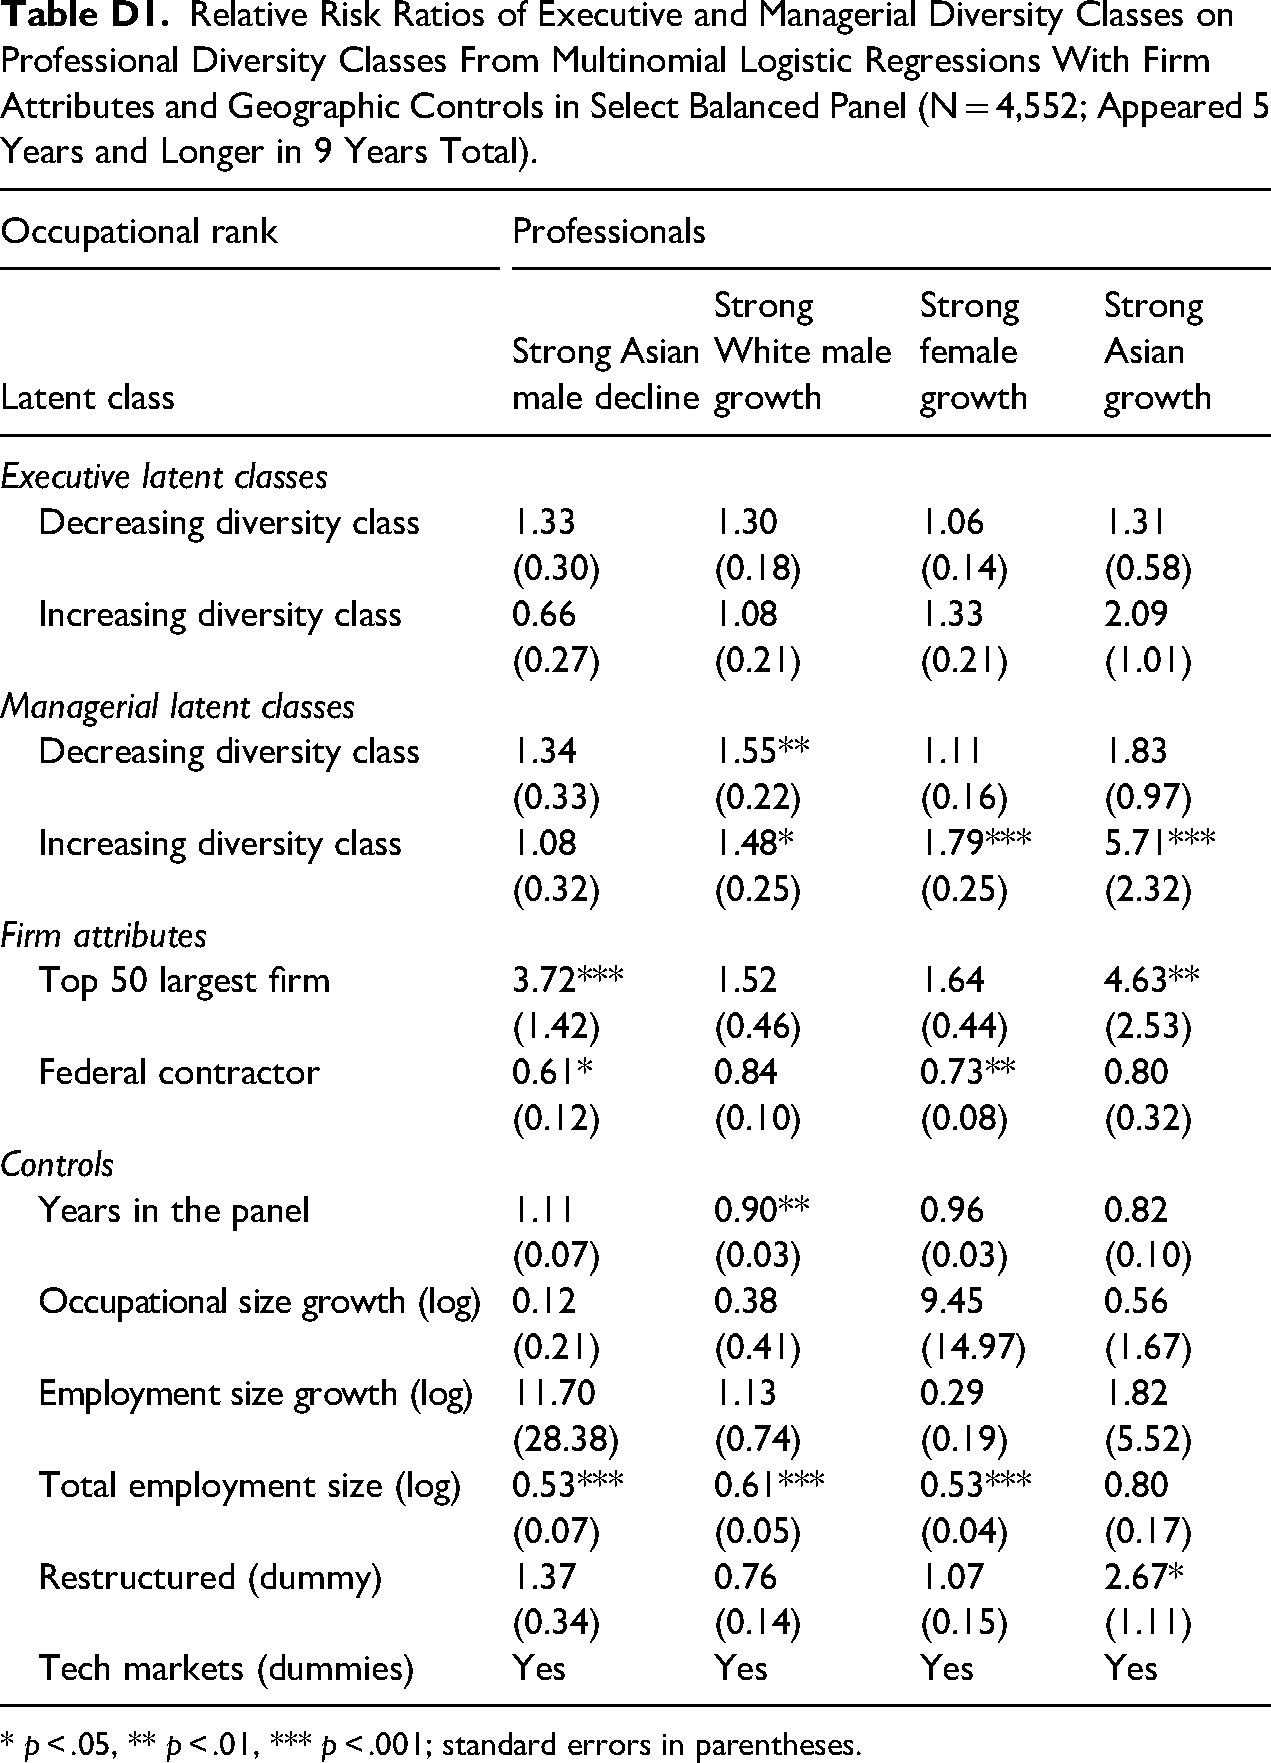
We created firm-year panel data using the EEO-1 reports. For each firm, we calculated each demographic group's percentage point changes between the first year and the last year in which each firm appeared in the 2008–2016 panel. Firms must submit an EEO-1 report at least twice in the potentially maximum 9 years in the panel to be included. This selection rule results in 8,323 firms, which appear in the panel for 5.5 years on average. We control for years in the panel in our multivariate analyses. Because firms are constantly being founded and closed, the number of years in the panel varies across firms. As a robustness check, we ran the same latent class and multinomial logistic regression models only for the firms that appeared 5 years or longer. The results remain quite similar. The multinomial logistic regression results are reported in Appendix Table D1.
Racial groups are limited to four mutually exclusive groups based on the EEOC's categories: White, Asian, Black, and Hispanic. With further breakdown by men and women, thus eight demographic groups are defined for each occupation in each firm. Our dependent variable is the latent classes defined by change in each demographic group's proportion in each occupation. Given their small numbers we combined counts of Hispanic and Black men and Hispanic and Black women into two same-sex groups in order to estimate firm-level trajectories. We attempted to estimate these as four separate groups, but results would not converge, reflecting the widespread incidence of empty cells in many workplaces for these small groups. Similarly, Native Hawaiian/Pacific Islander, American Indian/Native Alaskan, and multiple-race are excluded due to too small numbers to produce reliable estimates.
Our empirical analyses proceed in two parts. First, we identify firm diversity trajectories based on changes in the proportion of race-gender groups in each occupation. We designed a latent class analysis, an inductive statistical technique that identifies units, firms in our case, that are similar to each other, in terms of simultaneous changes in representations of all race-gender groups. The basic approach is to run a clustering algorithm to identify multiple trajectories and classify individual firms into the trajectories that most resemble their employment dynamic, based on the conditional likelihood that a firm belongs to a latent class (Barban & Billari, 2012). We adjust latent class coefficients via weighting by the employment size in each firm in each occupational rank. Statistical significance in the latent class analyses is tested against no change.
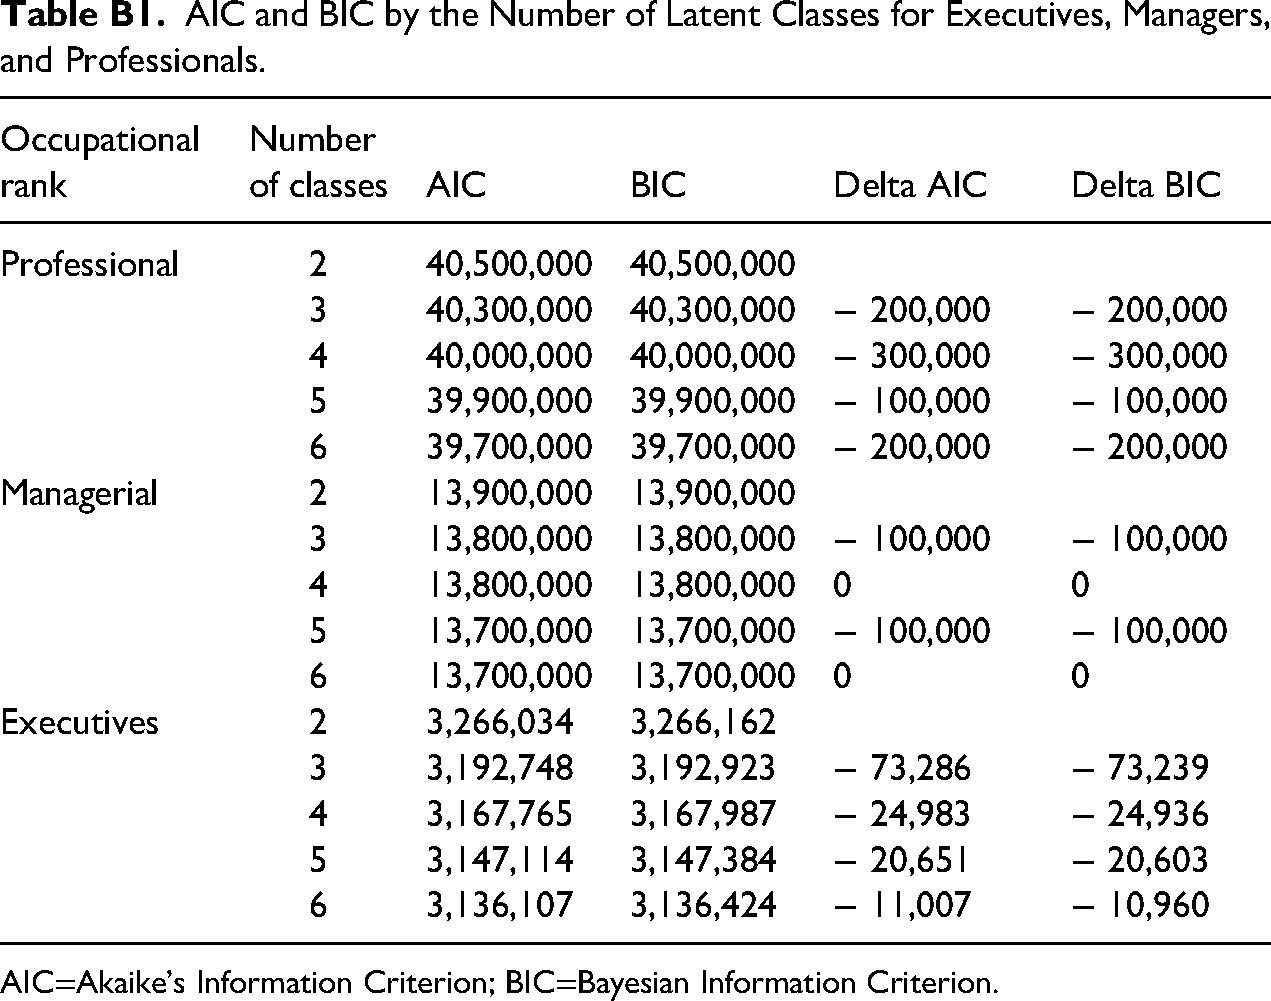
When estimating these latent classes, we did not define maximum iterations, but rather allowed the models to run until maximum likelihoods converge to the expected log-likelihood. There are no a priori limits to the number of classes that might be discovered in a latent class analysis. Various statistical tests such as Akaike's Information Criterion (AIC) and Bayesian Information Criterion (BIC) have been proposed to determine appropriate numbers of classes (Nylund et al., 2007; Oberski, 2016). We examined multiple classes (from two to six) but found no specific number of classes with outstanding AIC and BIC scores. 7 Thus, we choose the three classes with the largest reduction on AIC and BIC for executives and managerial roles and lean on interpretable and substantively meaningful five classes for professionals.
Next, in a multinomial regression framework, we regress the professional latent classes on indicators of endogenous change in managerial and executive composition and exogenous pressures associated with being a highly visible firms, operationalized as the 50 largest tech firms nationally (3% of the sample), and federal contractors (62% of firms). 8 Additionally, we control for firm size (total employees) and the growth of firm, executive, manager, and professional employment between the first and the last year in the panel. These are included to adjust for potential heterogeneity among professional and managerial occupations associated with the increased prevalence of nontechnical support staff. To account for the varying longevity of workplaces in the panel and for the time available for demographic diversity change, we control for years in the panel. Finally, we control for city to adjust for the demographics of local labor supply. We estimate similar models for executive and managerial latent classes. 9
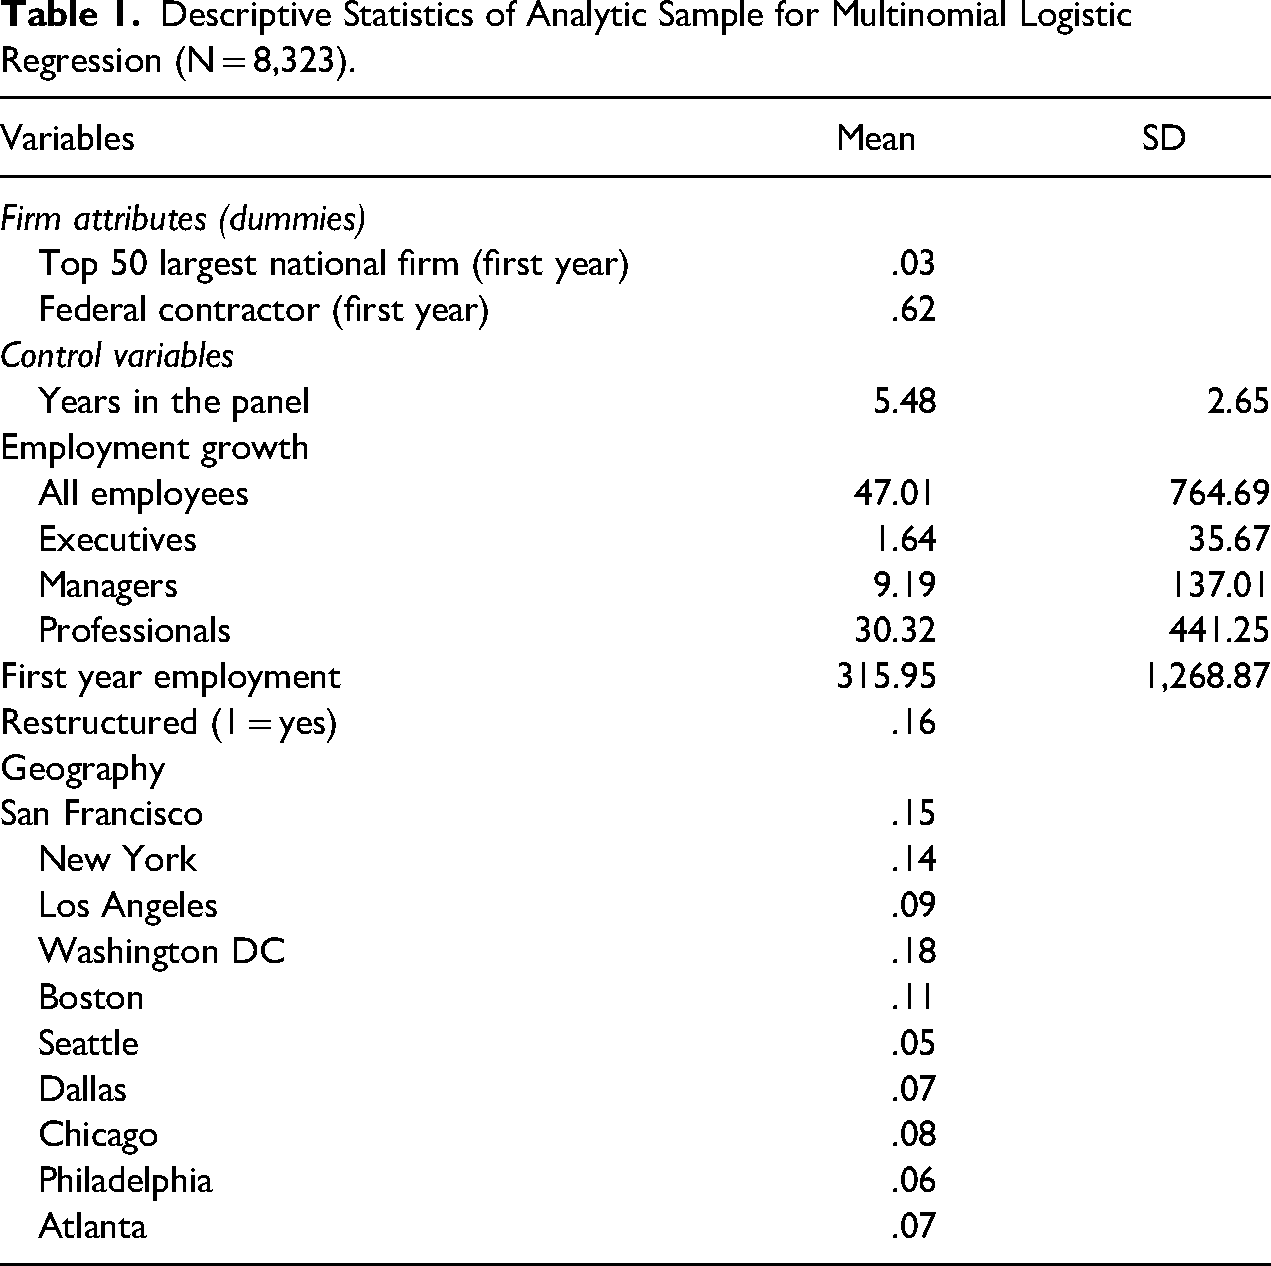
Tech jobs are both dynamic, characterized by sectoral growth, and precarious with higher probabilities of mass layoffs than other sectors (Rothsetin, 2022). The latter was demonstrated in 2023 by large layoffs at Tech giants including Amazon and Microsoft. In order to adjust for changes in workforce composition from sudden restructuring events, such as layoffs or mergers and acquisition, we additionally control when any of the three core occupational groups grew or shrank by more than 100 jobs between the first and the last year in the panel. Practically this mostly happened in professional jobs. Descriptive statistics are presented in Table 1.
Descriptive Statistics of Analytic Sample for Multinomial Logistic Regression (N = 8,323).
Diversity Levels and Trajectories
Before identifying firm-level latent classes, it is worth understanding overall Tech sector diversity trends. Table 2 displays demographic diversity shifts in mean representations across firms between the first and last years in our analytic panel. White men in Tech are the largest group by far and their dominance grows with rank in the organization. White women and Asian men are the next two largest groups. Asian men's representation declines as we move from professional to managerial to executive positions. White women's representation is slightly larger in managerial than in professional roles but declines at the executive level. Other groups—Asian women, Black men and women, Hispanic men and women—follow this same pattern of decreased representation at the top, although their absolute numbers are much smaller. Given their representation at 6.8% (last year) of professional jobs Asian women are particularly absent in executive roles (2.0%). While we report data combining Hispanic and Black employees within gender, it is worth noting that in professional jobs Black (3% in the last year of the panel) and Hispanic women (1.8%) are very rare. Both hold less than 1% of executive jobs.
Mean Percentage of Each Demographic Group in the First and the Last Year in the Panel for Executive, Managerial, and Professional Occupations in Tech Industry Firms (Analytic Panel).
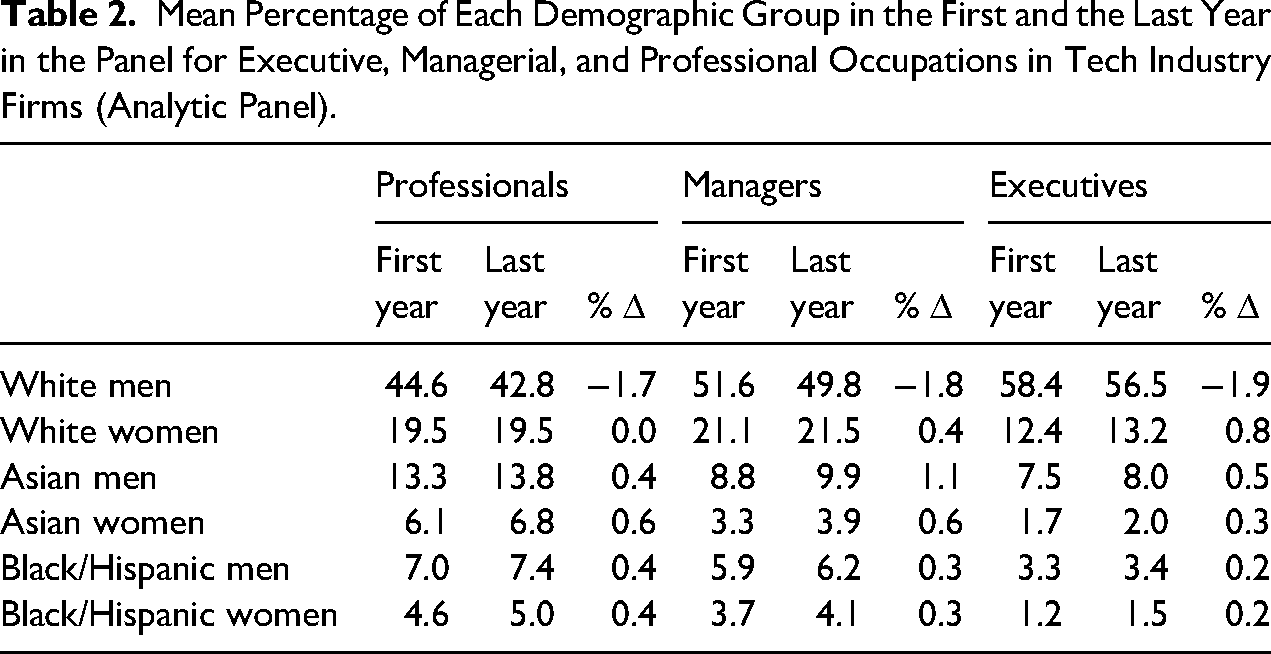
The time trends show a small decline in White men in all three jobs, and small gains for all others, except for White women in professional jobs who experienced no net change. White women did make gains in managerial jobs (.4 percent point) and even more so at the executive level (.8 percent point). Asian men experienced small gains among professionals (.4 percent point) and executives (.5 percent point), but larger gains in managerial roles (1.1 percent point). Asian women made gains in all three roles, .6 percent point for both professionals and managers, but smaller at the executive level (.3 percent point). Black and Hispanic men and women made small gains in professional jobs (.4 percent point) but declines at higher ranks (−.3 and −.2 percent points in managerial and executive roles, respectively).
Next, we report the results of our latent trajectory analyses. The logic of these estimations is to classify firms in terms of shared diversity trajectories.
For professional jobs we found five trajectory patterns: (1) Weak diversity growth, (2) Strong Asian male decline, (3) Strong White male growth, (4) Strong female growth, and (5) Strong Asian growth. For both executive and managerial jobs we discovered three trajectory patterns: (1) Weak diversity growth, (2) Strongly increasing diversity across multiple groups, and (3) Strongly decreasing diversity across multiple groups. It is not surprising to find more dynamic trends in professional occupations than executive and managerial jobs considering professionals’ much larger employment size.
The common finding across all three occupation-specific trajectory analyses is that in the vast majority of firms there is a pattern of slight decline in White males as a share of all employees and small increases in other groups. Most Tech sector firms are becoming slightly more diverse. We see these classes as best described as inertial. However, there are also significant clusters of firms with dramatic patterns of either increased demographic diversity or large gains in White male employment at the expense of other groups.
Firm Diversity Trajectories Among Professional Employees
Figure 1 summarizes for professional employees the average percent change for each demographic group in each of the five trajectory types. 10 The overall sector trend is also presented for comparison's sake. Among these firms the most common pattern, found in 81.7% of firms, is weak diversity growth, characterized by a small decline in White—both male and female—employment, small growth for Asian men and women, even smaller growth for other men of color, but no change for Black and Hispanic women.
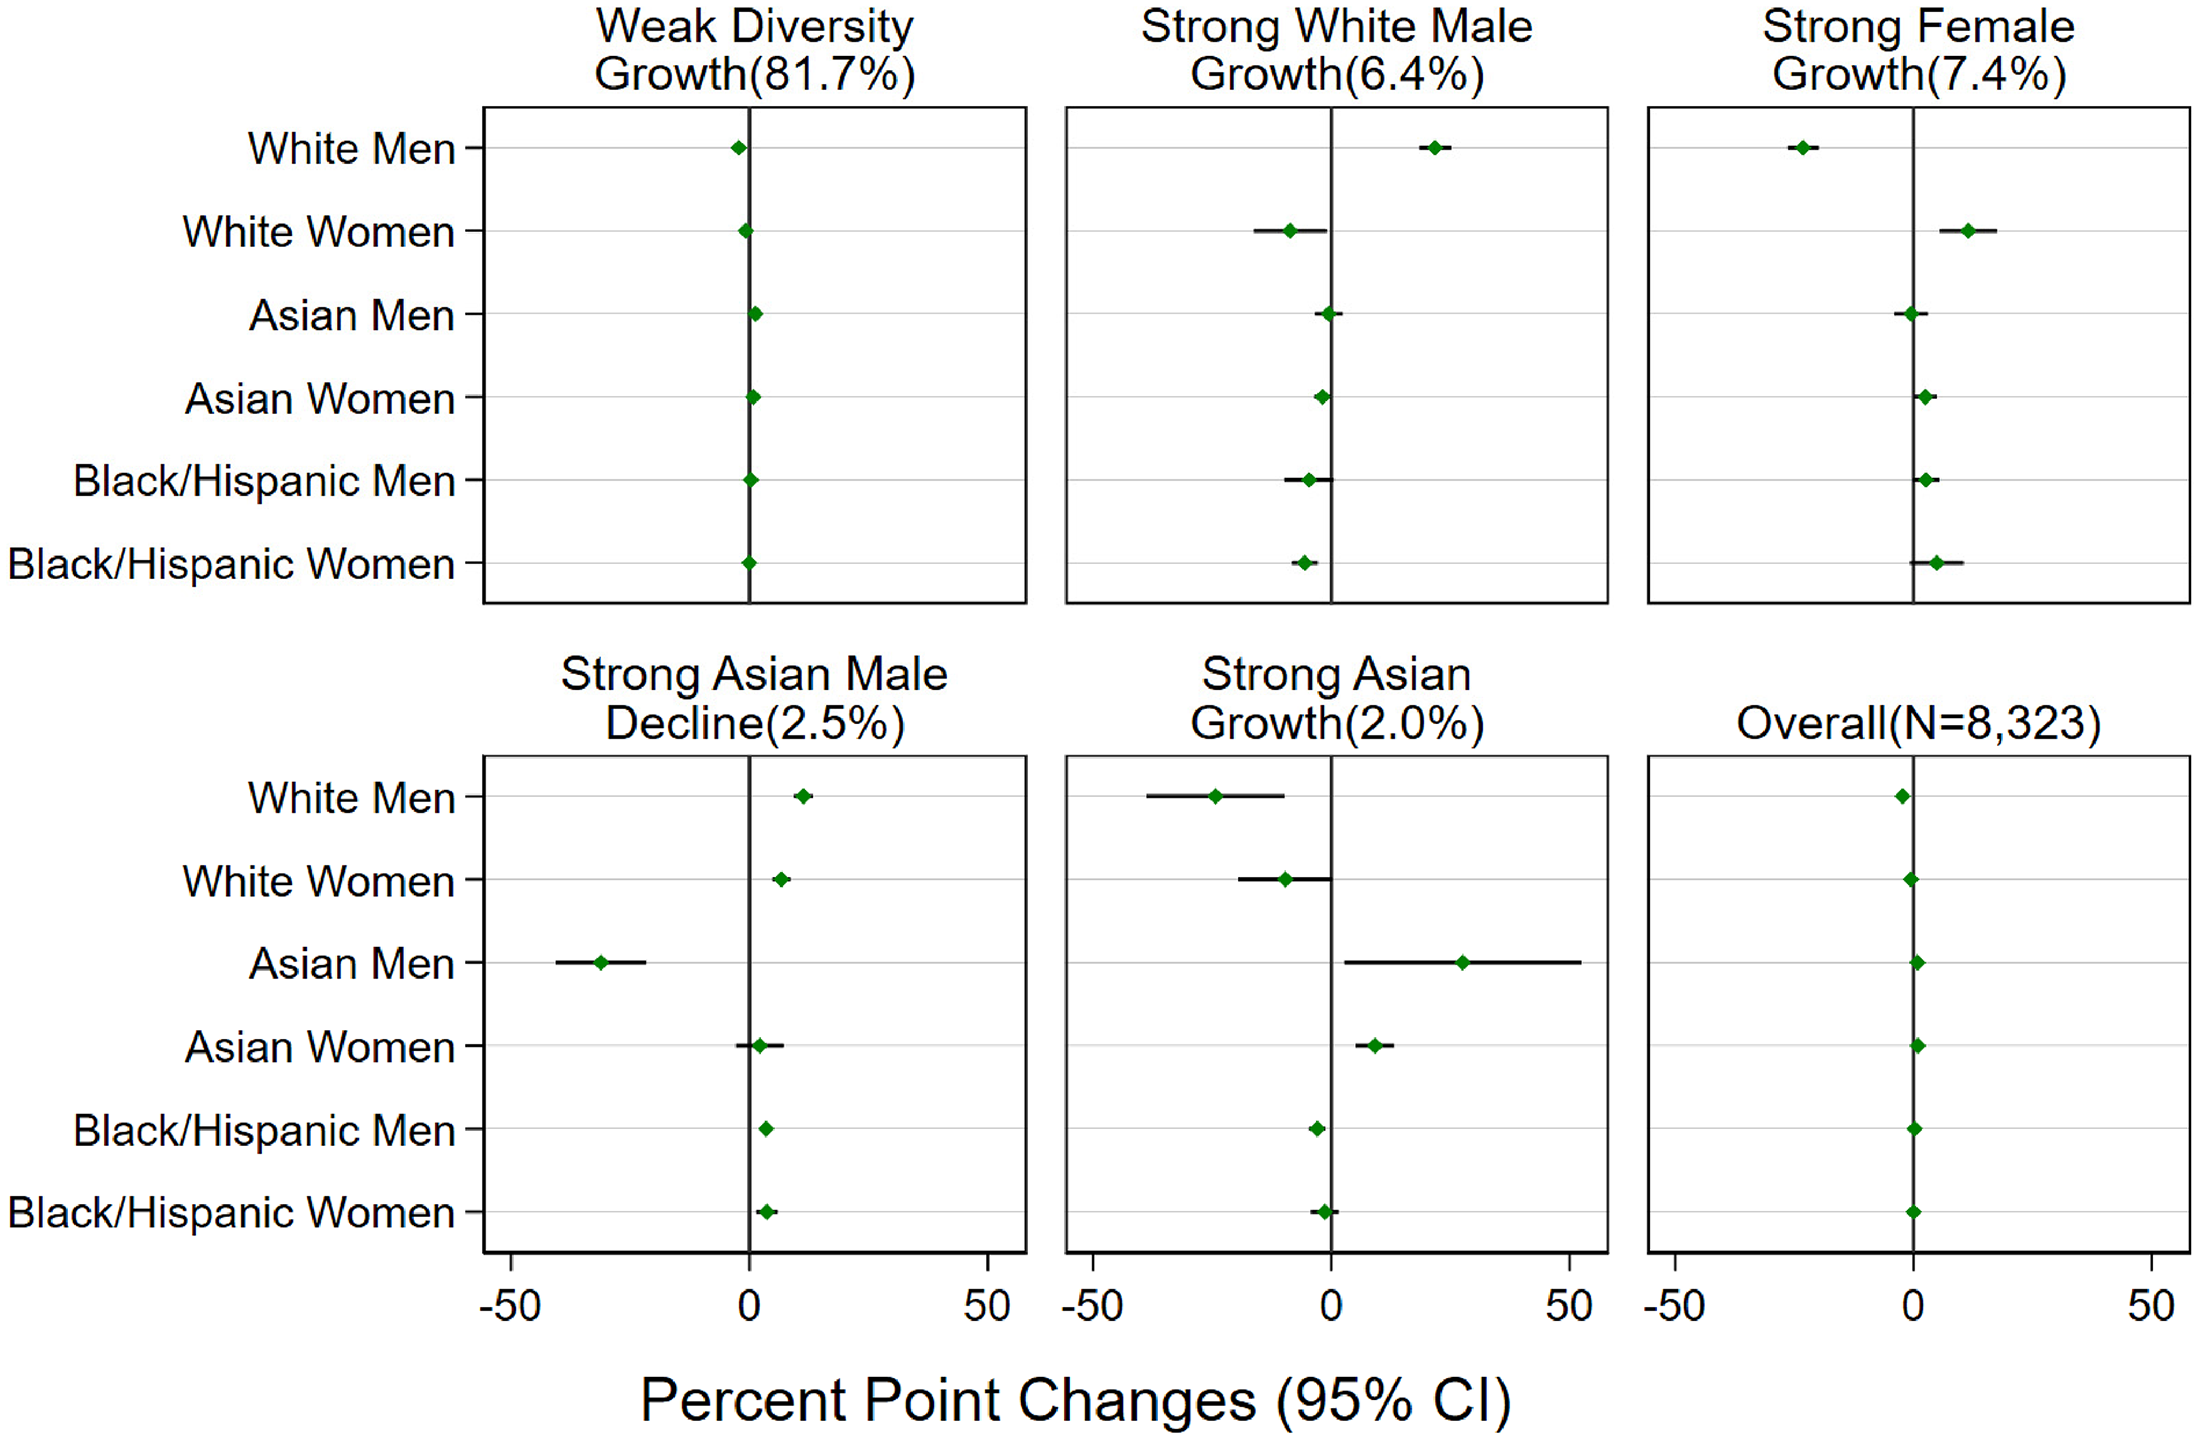
Five Types of Firms, Classified in Terms of Professional Job Diversity Change in Each Demographic Group Between the First and Last Year in Panel.
The next most common pattern includes firms that reflect tradeoffs between White men and all women, and it goes both ways: some firms (6.4%) are moving toward more White male employment with strong declines in female employment and others (7.4%) toward more female, especially White female workforces, and a large decline in White male representation.
The final, and least common pattern is a tradeoff between Asian employment and all other groups. Again, this pattern happens in both directions, some firms see Asian growth at the expense of all other groups, others see the reverse pattern. The first, which we label Strong Asian growth, includes only 2% of firms. In these firms, White representation declines sharply, especially among White men, Black and Hispanic male representation decline as well, and both Asian men's and women's representation grows largely. A slightly larger set of firms (2.5%) show the opposite pattern in which Asian male employment declines in the face of rising employment of all other groups, but particularly of White men and women.
Firm Diversity Trajectories Among Managers
Diversity trends in managerial occupations are less complex as shown in Figure 2. 11 The majority of firms (77.3%) became more diverse in their managerial employment, but the changes are quite small. In these firms the White male share declined by 3.5 percent point on average, while all the other groups’ share increased slightly. White, Black, and Hispanic women saw no statistically significant gains. The larger gains were for Asian men and women, with a very weak pattern of growth in Black and Hispanic male managers.
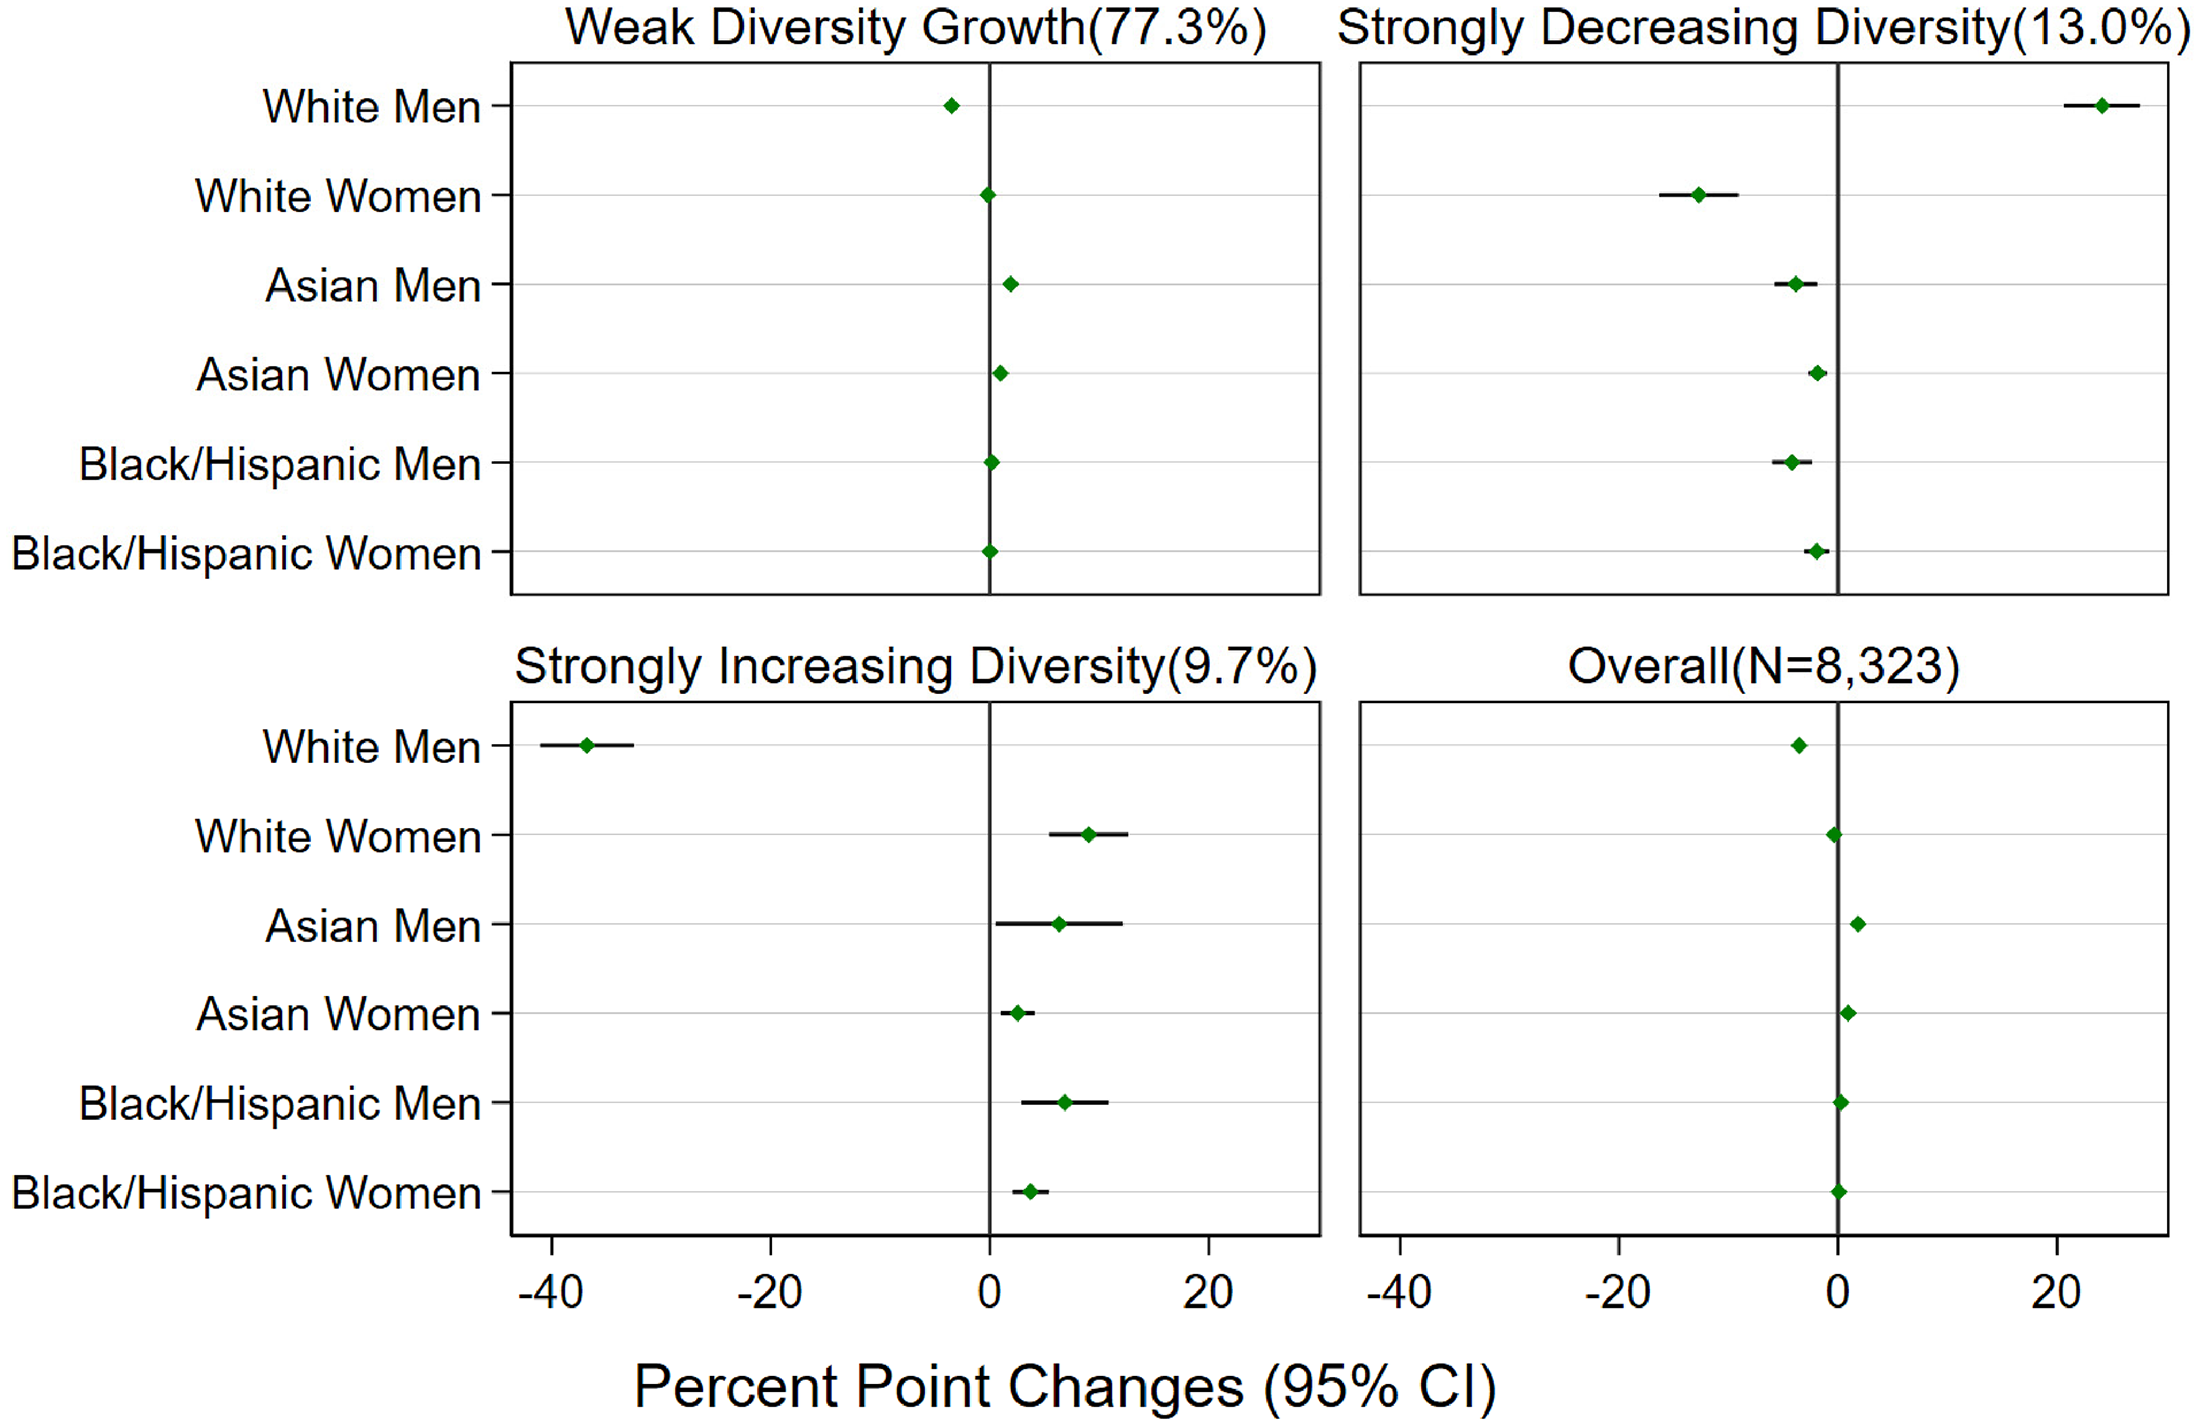
Three Types of Firms, Classified in Terms of Managerial Job Diversity Change in Each Demographic Group Between the First and Last Year in Panel.
In a second set of firms, we observe large decreasing managerial diversity. In these firms the White male share of managerial jobs increased on average by 24.1 percentage points. All other groups decline, and White women declined most dramatically. This pattern of strongly declining diversity and growing White male managerial employment occurred in 13% of firms.
Conversely, almost one in ten firms showed strong increases in managerial diversity. White male representation declined by a third in these firms, while other groups’ representation increased. White women showed the most dramatic gains (9.0 percent point) and Asian women the smallest (2.5 percent point), but for these firms there was large growth across all other groups, with While male proportion declining.
Firm Diversity Trajectories Among Executives
Variation in firm trajectories for executive roles, summarized in Figure 3, is similar to that of managers. 12 We again find that most firms show small increases in diversity, and smaller groups of firms display larger increases or decreases in executive diversity.
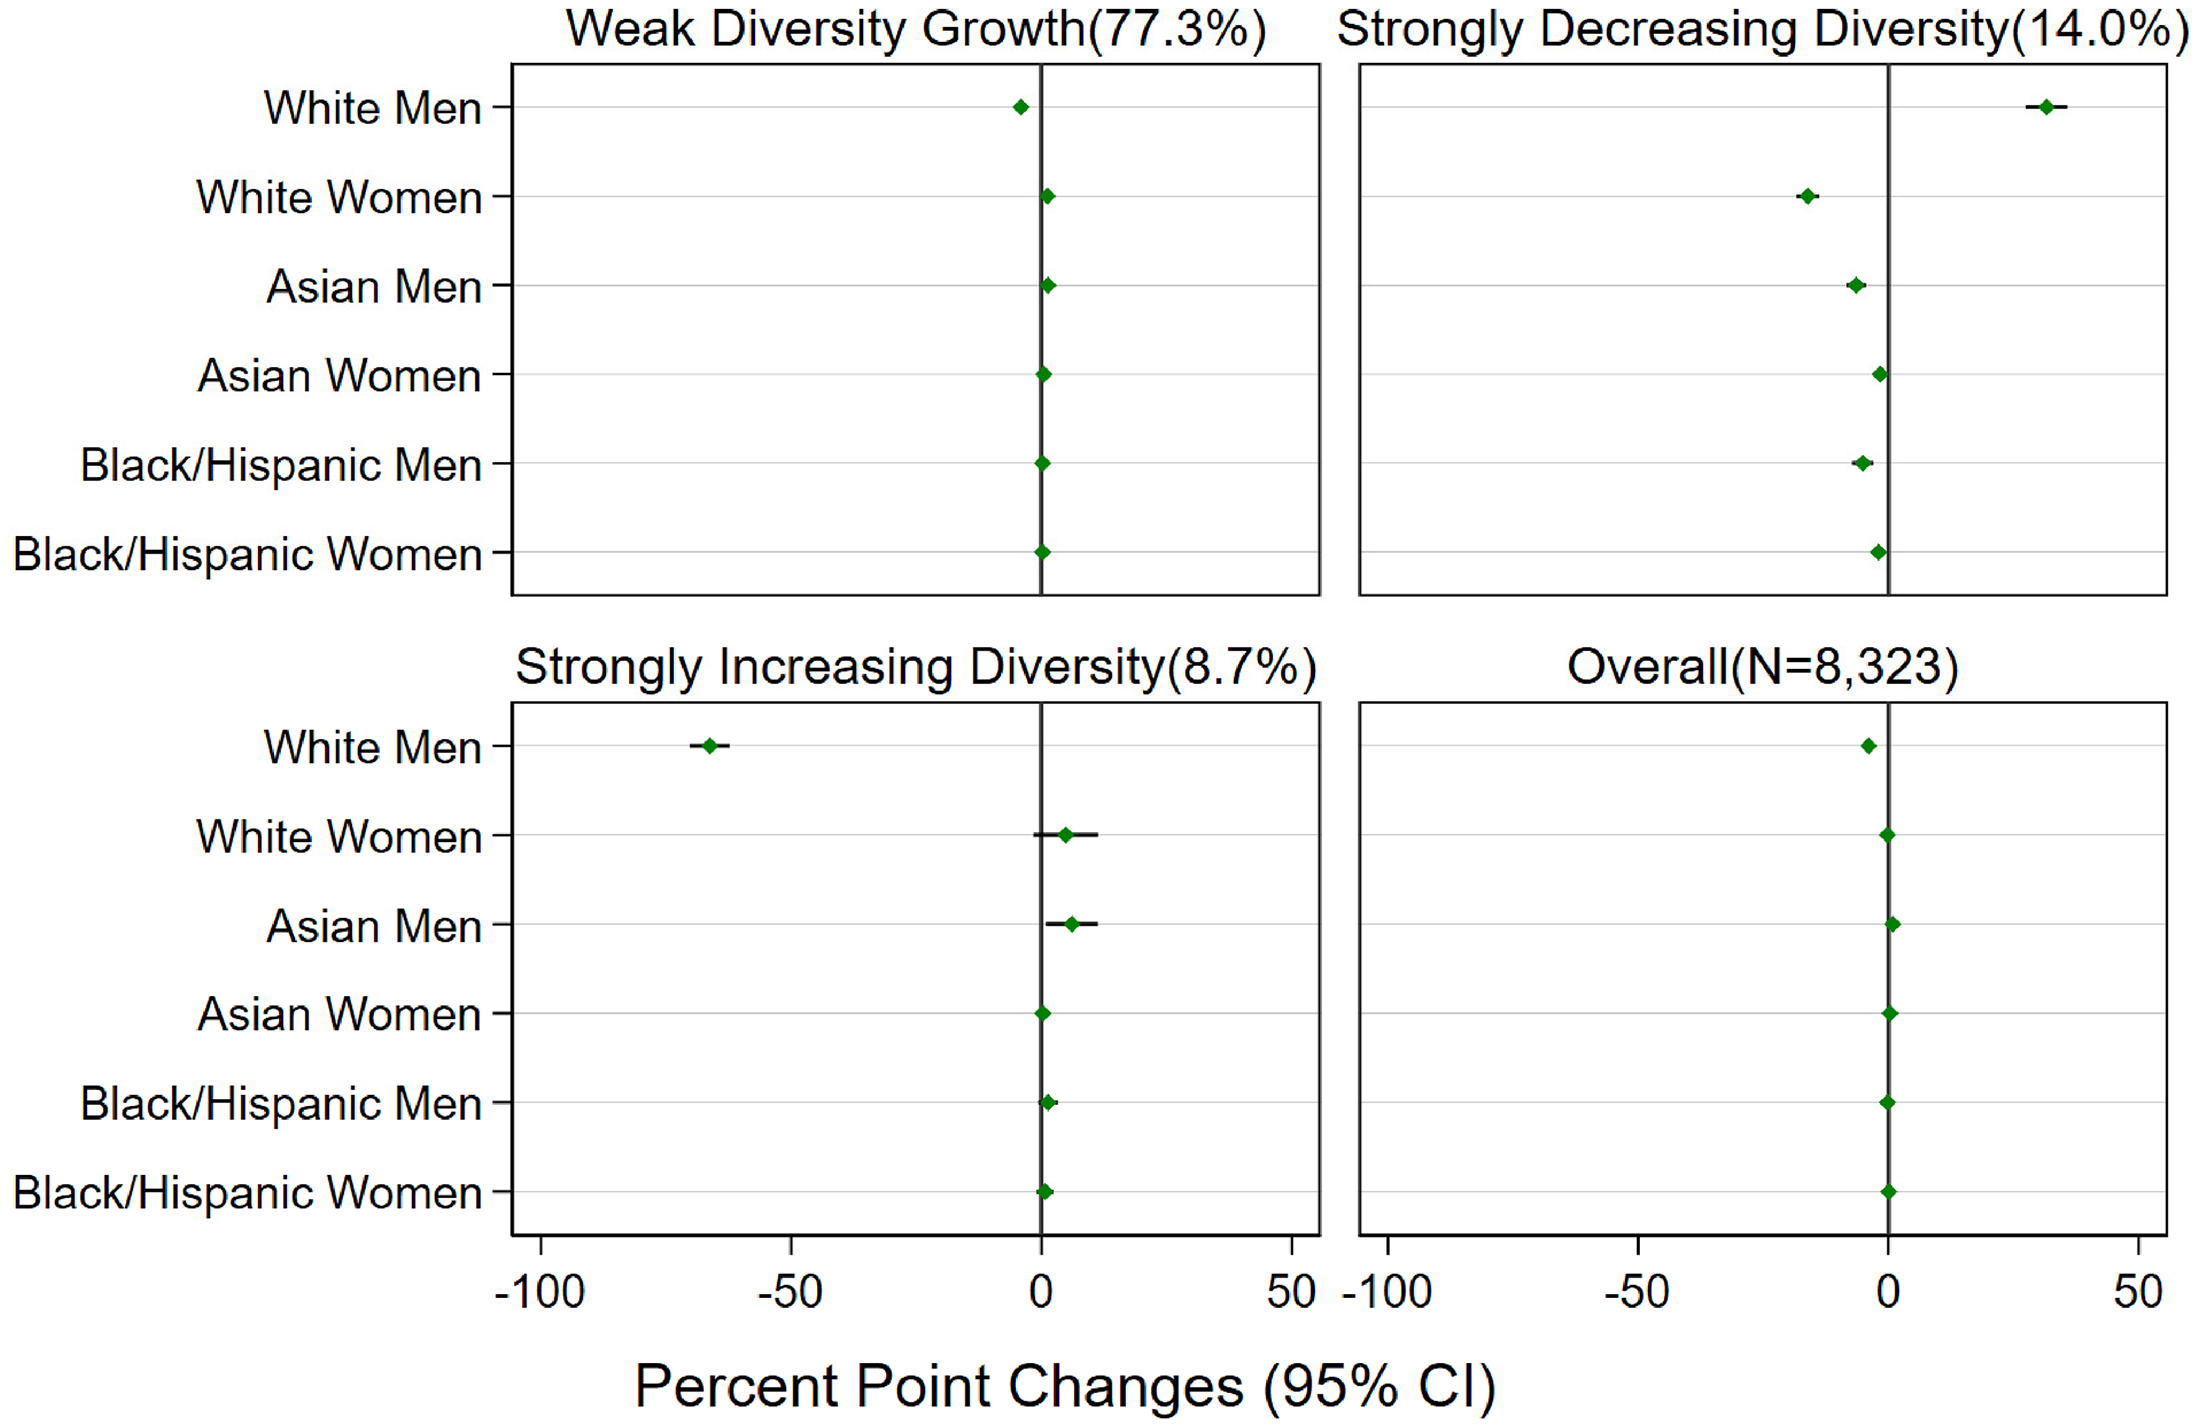
Three Types of Firms, Classified in Terms of Executive Job Diversity Change in Each Demographic Group Between the First and Last Year in Panel.
The majority of firms (77.3%) became slightly more diverse in their executive ranks over time. In these firms, the proportion of White male executives declined by 4.0 percentage points on average, while that of all other groups increased slightly, 1.2 percentage points for White women, 1.3 for Asian men, 0.5 for Asian women, while Black and Hispanic men and women both increased by 0.2 percentage points. All of these changes were statistically significant except for Black and Hispanic men, signaling a broad but not dramatic increase in executive diversity in three-quarters of US Tech firms.
In the next largest group of firms (14.0%), executives became increasingly White male. White male executives increased by 31.6 percent point, on average in these firms, and all the other groups’ executive proportions declined, and these declines were statistically significant. Conversely, fewer firms, only 8.7%, became dramatically more diverse in their executive ranks. White male executives in these firms declined considerably (−66.2 percent point), while the proportion of all other groups increased. The largest representation growth is found among Asian men (6.1), followed by White women (4.9), Black and Hispanic men (1.3), Black and Hispanic women (0.7), and Asian women (0.3 percent point). However, only the increase in Asian male representation is statistically significant at p < .05. Because most firms have few executives and few firms are in this expanding executive diversity class it is not surprising that when we look at each demographic group we do not find statistical significance for most.
In sum, the dominant pattern in executive diversity is toward weak increases in representation of all groups, and slight declines in the proportion of executives that are White men. Dramatic surges in executive diversity are less common, but do happen, although it is for Asian men that this pattern is most consistent, being both larger and statistically significant. That the other groups have relatively large percentage shifts but are not statistically significant suggests that their integration into executive jobs is quite uneven within this cluster of firms. Another visible pattern is that in one of eight firms the executive ranks are becoming increasingly White male, at the expense of all other groups.
For all three occupational levels the modal diversity regime is stable, presumably reflecting reinforcing internal sets of practices around hiring, climate, policies, and practices. On the other hand, for all three levels we also find small subsets of firms where their diversity regime is dynamic, either moving toward more White male or Asian dominance of key roles or toward increased gender and Black/Hispanic diversity. From the point of view of firms as inequality regimes, the overwhelming pattern is one of inertia. Presumably this represents underlying stability in practices and cultures in most firms. Since this is the only paper to look at firm diversity trajectories it is impossible to say confidently if inertia is higher or lower in the Tech sector than elsewhere. Since the sector is so dynamic there is certainly the possibility of more dramatic change. Conversely, past research has stressed a common “tech culture” which cuts across firms, perhaps producing more stability in diversity regimes. In the next section, we explore the impact of internal leadership and external pressure on the presences of the more dynamic inequality regimes.
Modeling Diversity Trajectories
We next examine how the professional, managerial, and executive classes are jointly associated at the firm level as well as the impact of firm exposure to environmental pressures. Because in the vast majority of firms all three occupations show a pattern of marginally increased diversity, it is not surprising that the most common pattern, in 51.9% of firms, is weak employment diversity growth in all three occupational roles. We interpret these firms as having stable inequality regimes. They simply reproduce the status quo as theories of organizational inertia would predict. At the same time, about half of all firms show more dynamic patterns for one or more job groups. Here we examine the role of leadership and external pressures to understand these more dynamic diversity regime patterns.
Because our dependent variables take multiple categorical outcomes, we employ multinomial logistic regressions to parse out these associations. We take the weak diversity growth, inertial firm class as the reference for both outcome and independent variables. Thus, our models ask in comparison to inertial firms, if executive and managerial diversity trajectory classes and firm exposures to exogenous pressure to diversify are associated with the strong increase and decrease in diversity for professional classes. Table 3 reports the results of these analyses as the relative risk ratio (RRR), a measure of association, of the five trajectory classes of professional trajectories and our key explanatory variables: the executive and managerial trajectory classes, top 50 firm, and federal contractor status, with a set of covariates controlled to adjust for years in the panel, firm employment dynamics, and labor market location.
We first look at the associations between executive and managerial trajectories and the five professional trajectories. These are not strong causal estimates as all trajectories happen simultaneously, but they do tell us if increased (decreased) diversity at the executive and managerial levels are plausibly associated with increased (decreased) diversity for the core labor force of technical professionals as expected given a leadership mechanism. Of course, the absence of a relationship is stronger evidence against a causal interpretation.
Firms with increasing (decreasing) executive diversity are more likely to also be in increasing (decreasing) professional diversity classes as well. The relative risks of falling into the strong female growth class and the strong Asian growth class in professional jobs are respectively 62% (1.62−1 = 62%) and 63% higher among firms with an increasing executive diversity trajectory than it is in the more numerous firms in the weak growth executive diversity class. Conversely, the firms with decreasing executive diversity have 47% higher risk of being in the professional female decline class.
The managerial level diversity trajectories have even stronger relationships with the professional diversity classes. Firms in the increasing managerial diversity class have 144% and 123% higher risks of also being in the strong female and the Asian growth classes, respectively. Consistently, firms in the decreasing managerial diversity class are more likely to correspond with professional trajectories with strong declines in both female and Asian employment.
Inconsistently, the increased managerial diversity class is also significantly associated with the decreasing female professional diversity class (RRR = 1.74). We suspect that this represents firms that disproportionally promote women from professional to managerial jobs. Alegria (2019) found that White women, but not other women, in Tech firms tend to benefit from a step stool out of technical roles and into low level managerial jobs and we may be picking up this process.
These results support Hypotheses 1, suggesting that increased leadership diversity promotes increased professional diversity. The estimates also suggest that for this population of Tech firms managerial diversity trickles down more effectively than simply adding a few “more diverse” executive positions, consistent with the decision-making mechanism identified in Zimmermann (2021) and Stainback et al. (2024). It is different in that we find a smaller, rather than absent, influence on nonmanagerial workers’ diversity profiles. We suspect that changes in these leadership positions, even if motivated for merely symbolic reasons, can trickle down to produce more diverse workforce in professional positions over time (Kurtulus & Tomaskovic-Devey, 2012; Skaggs et al., 2012).
Rejecting Hypotheses 2a and 3a, visibility and regulatory pressure have no observable impact on professional diversity trajectories. Being part of a top 50 firm is not associated with any firm diversity trajectory. Being a federal contractor, however, is strongly associated with being in the reference category of weak diversity growth. This result echoes the earlier finding in Shams and Tomaskovic-Devey (2019) that federal contractors were less likely to have dynamic managerial composition trajectories. If environmental pressures tend to be on more visible roles, these null findings may not be surprising.
We also examine if firms respond to environmental pressures for managerial and executive jobs. Table 4 reports relative risk ratios from multinomial logistic regression models for executive and managerial classes. Neither visibility nor federal contractor status is associated with diversity patterns for managerial roles. In contrast, net of federal contractor status, the top 50 most visible firms tend to be both in decreasing and increasing executive diversity classes relative to the inertia diversity class firms, which partially supports Hypothesis 2b. If one interprets the Top 50 effect to be a response to environmental pressures on visible firms, it suggests that these pressures produce new executive appointments in both directions. Sometimes retrenchment to a more White male leadership structure dominates and sometimes executive diversity is expanded. Firms respond to external pressure from federal affirmative action mandates by expanding diversity only in visible top executive roles, supporting Hypothesis 3b.
Relative Risk Ratios of Visible and Federal Contractor Firms on Managerial and Executive Diversity Classes From Multinomial Logistic Regressions With Firm Attributes and Geographic Controls (N = 8,323).
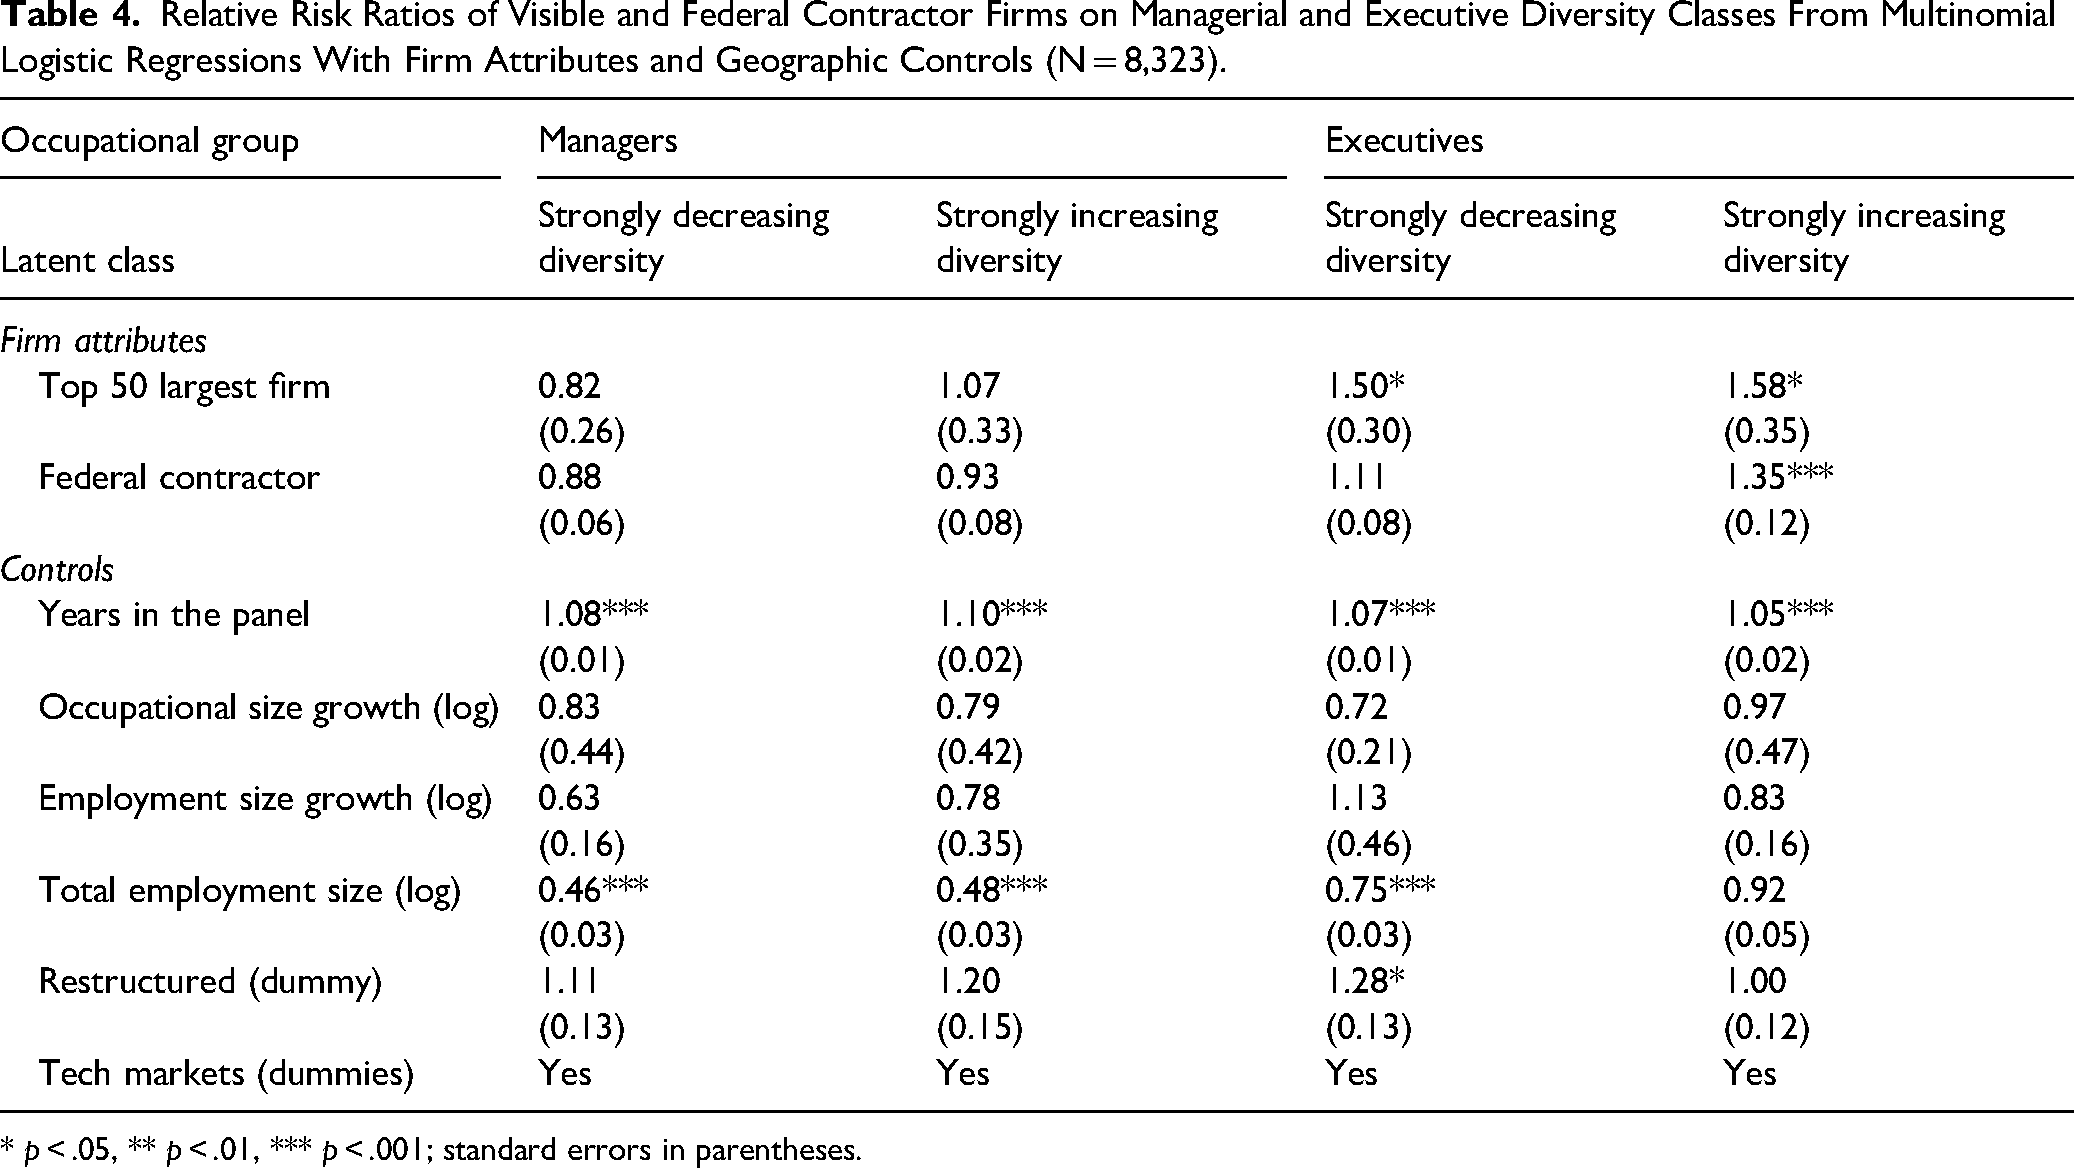
* p < .05, ** p < .01, *** p < .001; standard errors in parentheses.
Discussion
In the 2008–2016 period we study, White male dominance in all professional, managerial, and even executive positions declined slightly and most of the other race/gender groups, with the exception of White women in professional jobs, made small gains in employment share over time. All firms, however, are not moving in the same direction. While the majority of Tech firms became slightly more diverse, a fraction of firms changed their employment profile more radically. Some firms dramatically diversified their labor forces, others became increasingly White male dominated. These diverging firm diversity trends are present for professionals, managers, and executives.
About half of all firms showed the sector-level pattern of weak growth in diversity in all three occupational levels. These status quo firms do not show any evidence of successful efforts to increase employment diversity, nor do they show signs of backlash and retrenchment against diversifying their labor force. What they do show is inertia in their staffing profiles. However, because the EEOC data we draw on are yearly employment counts, it is difficult to know exactly which mechanisms in status quo firms prevail. It could be any combination of failing to recruit, hire, or retain select demographic groups of employees. Furthermore, a possible confounding mechanism of changing employee diversity via outsourcing of some professional tasks cannot be examined with the EEOC data.
Inertia is also more common in larger firms. It is important to recognize that the EEO-1 reports do not include small workplaces, and that small workplaces are more likely to be found in the more dynamic latent classes. Thus, if those observations were included, we might observe a higher proportion of firms showing rapid growth and declines in diversity for all three occupations.
Nonetheless, change does happen in some firms and is to some extent predictable. Firms that became strongly more diverse in their executive and managerial ranks, also did so for their professional workforces. Likewise, in firms where executive and managerial jobs became more White male dominated, the much more numerous professional workforces became less gender integrated and more White male as well. This suggests that leadership matters. Our estimates also suggest that managerial level diversity matters more than executive diversity. Although with these data we cannot see exactly what it was that these diversity champion firms adjusted, we can assume that something in leadership, organizational culture, or human resource practices favored increased diversity. Given data limitations, we also cannot tell if the proximate mechanism was increased hiring diversity or decreased chilly climates, although both seem plausible mechanisms.
Since managers in Tech firms are most often promoted from professional positions, both increasing and decreasing diversity in managerial positions is likely to be reflected in some synergy between technical-professional labor force composition and leadership cultures. Our finding that while rising diversity among managers is likely to expand diversity among female and Asian professional workers, it is also associated with decreases in professional diversity for women, suggests an internal mobility mechanism as outlined by Alegria (2019).
External pressures may differ for executive and managerial/professional labor markets. The diversity trajectories for managerial and professional jobs probably mostly reflect available labor supply coupled with corporate recruitment and retention commitments and competency. Executive diversity is likely to be more responsive to political pressures from diversity advocates within and outside the firm. Retrenchment in executive and professional diversity may reflect leadership as well. Zhang (2022) finds that the political orientation of CEOs steers reactions to environmental shifts. That declines in executive diversity are associated with declines in professional diversity in our models could reflect a very similar leadership process. This may also explain why top 50 firms, presumably because of their exposure to higher levels of pressure, are more like to both increase and decrease executive diversity. If political pressure and top firm visibility are filtered through the political orientations of executives, we would expect to see patterns of both expanding diversity and backlash. Of course, we cannot observe this mechanism, but it is not implausible that it explains this result.
The expansion of executive diversity may begin as a symbolic response to political pressures. For example, in 2018 California passed a bill that mandates at least one female board director in publicly traded companies and one Silicon Valley Tech firm, in response, invited a female board member from a Canadian Tech firm (National Public Radio, 2020). Prior research suggests that more visible firms may be under more pressure to display executive diversity in leadership photographs (Berrey, 2015; Chang et al., 2019). Our results for top 50 firms suggest that the response to this pressure can either be acquiescence or retrenchment. Nonetheless, our finding that firms under federal oversights are more likely to expand diversity only for executive roles but not for managerial or professional jobs supports the symbolic response explanation. That federal contractors are more likely to be in the relatively stable, weak growth in diversity class, suggests that the primary role of federal regulation is not to promote affirmative action, but to promote bureaucratic inertia. Shams and Tomaskovic-Devey (2019), looking at managerial trajectories across sectors, report a similar result.
At the same time, we find evidence that expansion of executive, and especially managerial, diversity, may trickle down in some firms and change the composition of the professional-technical labor force. Some past research suggests that executive level diversity may have limited impact on lower-level diversity (Graham et al., 2016), but others suggests that leadership may trickle down to reduce worker level inequalities (Stainback et al., 2016). Although our estimates are not causal, we do find some association of increased executive diversity with increased professional diversity, even net of the much more influential managerial shifts. The limited coupling of executive level diversity with professional level diversity may also be due to the backlash experienced by female and people of color leaders engaging in diversity-valuing behaviors (Hekman et al., 2017).
One limitation of our analyses and use of the inequality regime idea is that we treat organizational regimes as internally homogenous. For small firms this may be the case, but for larger firms, workgroups and teams may be important relational contexts. Our finding that most firms have stable inequality regimes at the organizational level, does not rule out the potential for substantial heterogeneity in the actual relationships and outcomes within the firm. In this sense inertia may actually reflect internal heterogeneity at the team (Cech & Waidzunas, 2022; Fuller & Kim, 2023) and temporal (Shams & Tomaskovic-Devey, 2019) levels.
Our interpretations are not based on strong causal estimands, although our outcomes are change and we use change scores for multiple predictors, increasing confidence in casual interpretations. On the other hand, we do not identify when exactly change happens within the panel, weakening causal inference. The usual caveats about unmeasured explanations also apply. For these estimates it is possible that some unmeasured and exogenous backlash, diversity commitment, and indifference in the general organizational culture underlie the estimates of relationships between managerial and executive trajectories and the professional latent classes. Such cultural orientations might also make a firm more or less vulnerable to external pressures. There are multiple endogenous processes which may explain both our leadership and environmental pressure explanations, but these do not threaten our interpretations of the results.
Conclusion
We see these results as helping to develop the idea that firms have diversity and inequality regimes (Acker, 2006; Meyers & Vallas, 2016). The idea of a regime as a set of reinforcing practices in the labor process (Tomaskovic-Devey & Avent-Holt, 2019) leads to an expectation that most firms will display continuity in their demographic profiles. This is the case in the Tech firms we follow here. But the regime idea also highlights the endogenous negotiation of practices as the causal source of any particular regime. This more dynamic conception implies that we should be able to observe change in diversity profiles in at least some firms. This is clearly the case here. Some firms’ diversity regimes shift toward more White or White male dominance and others move toward more demographic diversity.
RIT mostly emphasizes exogenous institutional processes as driving such change (Tomaskovic-Devey & Avent-Holt, 2019) and has been criticized for neglecting endogenous sources of change (Vallas & Cummins, 2014). We find evidence that internal changes in the composition of managers and executives accompany shifts in the core professional jobs in Tech in our observation period. External political pressures on the most visible firms or regulatory mandates for affirmative action among federal contractors matter, but in quite limited ways. Being a top 50 firm was associated with both strong increases and decreases in executive diversity profiles. Being a federal contractor encouraged inertia in diversity regimes for professionals. Of course, there are no doubt many more internal and external causal forces reinforcing and destabilizing particular diversity regimes and these causal forces are likely to be more or less influential at different moments in the history of particular firms. The past research on federal regulation is clear in this regard. In the 1960s only the most visible federal contractors showed shifts in their demographic diversity, which spread to all federal contractors in the 1970s as federal regulatory efforts strengthened, but these gains weakened and then extinguished as political commitments and social movement pressures waned (Kurtulus, 2016; Stainback & Tomaskovic-Devey, 2012). Our results should be seen as confirmation that diversity regimes can change, and future research should try to figure out when and why they do. Meyers and Vallas (2016) provide some clues. They compared two worker-owned cooperatives, one of which developed a demographically diverse empowered labor force and the other a more conventional segregation along gender and racial lines. They differed in that the former self-consciously addressed racial and gender equality, while the latter were color and gender blind, stressing occupational skill distinctions connected to earnings and security inequalities in the development of their labor process.
Prior research has concluded that more racially and gender diverse firms tend to be more innovative and financially successful than less diverse firms (Andrevski et al., 2014; Carter et al., 2010; Garnero et al., 2014; Herring, 2009, 2017; Hunt et al., 2015; Perryman et al., 2016). Other research confirms that group interactions can become more productive and innovative in more diverse workplaces (Díaz-García et al., 2013; Parrotta et al., 2014). Ruiz-Jiménez and Fuentes-Fuentes (2016), for instance, show that gender diversity in managerial positions positively contribute to product and process innovation among technology-based small-and-medium size enterprises. Scarborough et al. (2021), focusing on gender integration in the Tech sector across U.S. labor markets, find that both Tech sector employment and productivity growth are higher in labor markets with more gender integration. Furthermore, diversity in Tech workforces may reduce race and gender biases in software algorithms (Benjamin, 2019; Noble, 2018). It may be the case that the old boys’ network in Tech is actually slowing innovation.
There is a long-standing explanation for the absence of women or racialized minorities in Tech that they do not exist, and the problem is that there are not enough skilled people in the pipeline. The EEOC investigation of Tech diversity (2016) found that many people with computer-oriented college degrees found jobs in other industries and many professionals in Tech did not come through that training route. Luhr (2024) shows that within-firm interactional social closure in access to training to code moved men, but not women, with nontechnical backgrounds into lucrative technical positions in Silicon Valley tech firms. Our finding that managerial diversity drives professional diversity suggests that a similar conventional pipeline story serves, at least in part, as an excuse for management reluctance in some firms to actively engage in expanding employee diversity.
Our results suggest that increased diversity in Tech is possible and that one recipe for the advancement of women and people of color in the core professional jobs includes diversifying the managerial ranks. For the majority of firms that show little change this may require gender and racial targeted hiring and promotions (Williams et al., 2014). Observed external pressures to diversify Tech in our period seem to have no particular influence on changing professional or managerial labor forces. There is evidence, however, that executive diversity can influence firms’ professional diversity, albeit not as strongly as managerial shifts. Thus, external pressures effects may be indirect. This suggests that external diversity advocates, whether activists or regulators, might endeavor to empower executives, Chief Diversity Officers, and other internal stakeholders responsible for firms’ diversity progress, in order to speed up the process further down in the organization. That federal contractors are more likely to be in the expanding executive diversity class, but not managerial or professional classes, suggests that regulatory pressures are at present too weak to support equity demands in the Tech sector, but also that firms are responding to that regulatory pressure, albeit if only symbolically.
Time changes and we do wonder whether pressures for demographic diversity and inclusion are the same now as they were during our 2008–2016 study period. Tech sector employment expanded rapidly during the COVID pandemic but has contracted more recently. We suspect that the basic patterns we document here existed as well during these periods of expansion and contraction. We will learn more from future research on how Tech firms respond to these changing historical contexts.
Footnotes
Acknowledgments
We are grateful to the editor and reviewers of Work and Occupations for their thorough and thoughtful comments and suggestions on this article. We also thank Sharla Alegria and the Social Inequality and Population Dynamics (SIPD) research group at the University of Oslo for their discussions and comments on the earlier drafts.
Declaration of Conflicting Interests
The authors declared no potential conflicts of interest with respect to the research, authorship, and/or publication of this article.
Funding
The authors disclosed receipt of the following financial support for the research, authorship, and/or publication of this article: This work was supported by the W. K. Kellogg Foundation (grant number #P0132801) and the European Research Council (ERC) under the European Union’s Horizon 2020 research and innovation programme (grant number #851149).
Notes
Author Biographies
Appendix A: NAICs Codes of Tech Industry
Firms with high proportions of professional-technical workforces are found under the following NAICs codes: 334111 Electronic Computer Manufacturing; 334112 Computer Storage Device Manufacturing; 334118 Computer Terminal and Other Computer Peripheral Equipment Manufacturing; 334210 Telephone Apparatus Manufacturing; 334220 Radio and Television Broadcasting and Wireless Communications Equipment Manufacturing; 334290 Other Communications Equipment Manufacturing; 334310 Audio and Video Equipment Manufacturing; 334412 Bare Printed Circuit Board Manufacturing; 334413 Semiconductor and Related Device Manufacturing; 334416 Capacitor, Resistor, Coil, Transformer, and Other Inductor Manufacturing; 334417 Electronic Connector Manufacturing; 334418 Printed Circuit Assembly (Electronic Assembly) Manufacturing; 334419 Other Electronic Component Manufacturing; 334510 Electromedical and Electrotherapeutic Apparatus Manufacturing; 334511 Search, Detection, Navigation, Guidance, Aeronautical, and Nautical System and Instrument Manufacturing; 334512 Automatic Environmental Control Manufacturing for Residential, Commercial, and Appliance Use; 334513 Instruments and Related Products Manufacturing for Measuring, Displaying, and Controlling Industrial Process Variables; 334514 Totalizing Fluid Meter and Counting Device Manufacturing; 334515 Instrument Manufacturing for Measuring and Testing Electricity and Electrical Signals; 334516 Analytical Laboratory Instrument Manufacturing; 334517 Irradiation Apparatus Manufacturing; 334519 Other Measuring and Controlling Device Manufacturing; 334613 Blank Magnetic and Optical Recording Media Manufacturing; 334614 Software and Other Prerecorded Compact Disc, Tape, and Record Reproducing; 336411 Aircraft Manufacturing; 336412 Aircraft Engine and Engine Parts Manufacturing; 336413 Other Aircraft Parts and Auxiliary Equipment Manufacturing; 336414 Guided Missile and Space Vehicle Manufacturing; 336415 Guided Missile and Space Vehicle Propulsion Unit and Propulsion Unit Parts Manufacturing; 336419 Other Guided Missile and Space Vehicle Parts and Auxiliary Equipment Manufacturing; 423430 Computer and Computer Peripheral Equipment and Software Merchant Wholesalers; 454111 Electronic Shopping; 541519 Other Computer Related Services; 541990 All Other Professional, Scientific, and Technical Services. 511210 Software Publishers; 517110 Wired Telecommunications Carriers; 517210 Wireless Telecommunications Carriers (except Satellite); 517410 Satellite Telecommunications; 517911 Telecommunications Resellers; 517919 All Other Telecommunications; 518210 Data Processing, Hosting, and Related Services; 519110 News Syndicates; 519130 Internet Publishing and Broadcasting and Web Search Portals; 519190 All Other Information Services; 541310 Architectural Services; 541320 Landscape Architectural Services; 541330 Engineering Services; 541340 Drafting Services; 541350 Building Inspection Services; 541360 Geophysical Surveying and Mapping Services; 541370 Surveying and Mapping (except Geophysical) Services; 541380 Testing Laboratories; 541511 Custom Computer Programming Services; 541512 Computer Systems Design Services; 541513 Computer Facilities Management Services; 541519 Other Computer Related Services; 541711 Research and Development in BioTechnology; 541712 Research and Development in the Physical, Engineering, and Life Sciences (except BioTechnology); 541720 Research and Development in the Social Sciences and Humanities.
Appendix B: AIC and BIC by Number of Latent Classes
AIC and BIC by the Number of Latent Classes for Executives, Managers, and Professionals.
| Occupational rank | Number of classes | AIC | BIC | Delta AIC | Delta BIC |
|---|---|---|---|---|---|
| Professional | 2 | 40,500,000 | 40,500,000 | ||
| 3 | 40,300,000 | 40,300,000 | − 200,000 | − 200,000 | |
| 4 | 40,000,000 | 40,000,000 | − 300,000 | − 300,000 | |
| 5 | 39,900,000 | 39,900,000 | − 100,000 | − 100,000 | |
| 6 | 39,700,000 | 39,700,000 | − 200,000 | − 200,000 | |
| Managerial | 2 | 13,900,000 | 13,900,000 | ||
| 3 | 13,800,000 | 13,800,000 | − 100,000 | − 100,000 | |
| 4 | 13,800,000 | 13,800,000 | 0 | 0 | |
| 5 | 13,700,000 | 13,700,000 | − 100,000 | − 100,000 | |
| 6 | 13,700,000 | 13,700,000 | 0 | 0 | |
| Executives | 2 | 3,266,034 | 3,266,162 | ||
| 3 | 3,192,748 | 3,192,923 | − 73,286 | − 73,239 | |
| 4 | 3,167,765 | 3,167,987 | − 24,983 | − 24,936 | |
| 5 | 3,147,114 | 3,147,384 | − 20,651 | − 20,603 | |
| 6 | 3,136,107 | 3,136,424 | − 11,007 | − 10,960 |
AIC=Akaike's Information Criterion; BIC=Bayesian Information Criterion.
Appendix C: Latent Class Analyses
Three Types of Firms, Classified in Terms of Diversity Change in Executive Jobs Between the First and the Last Year in the Panel.
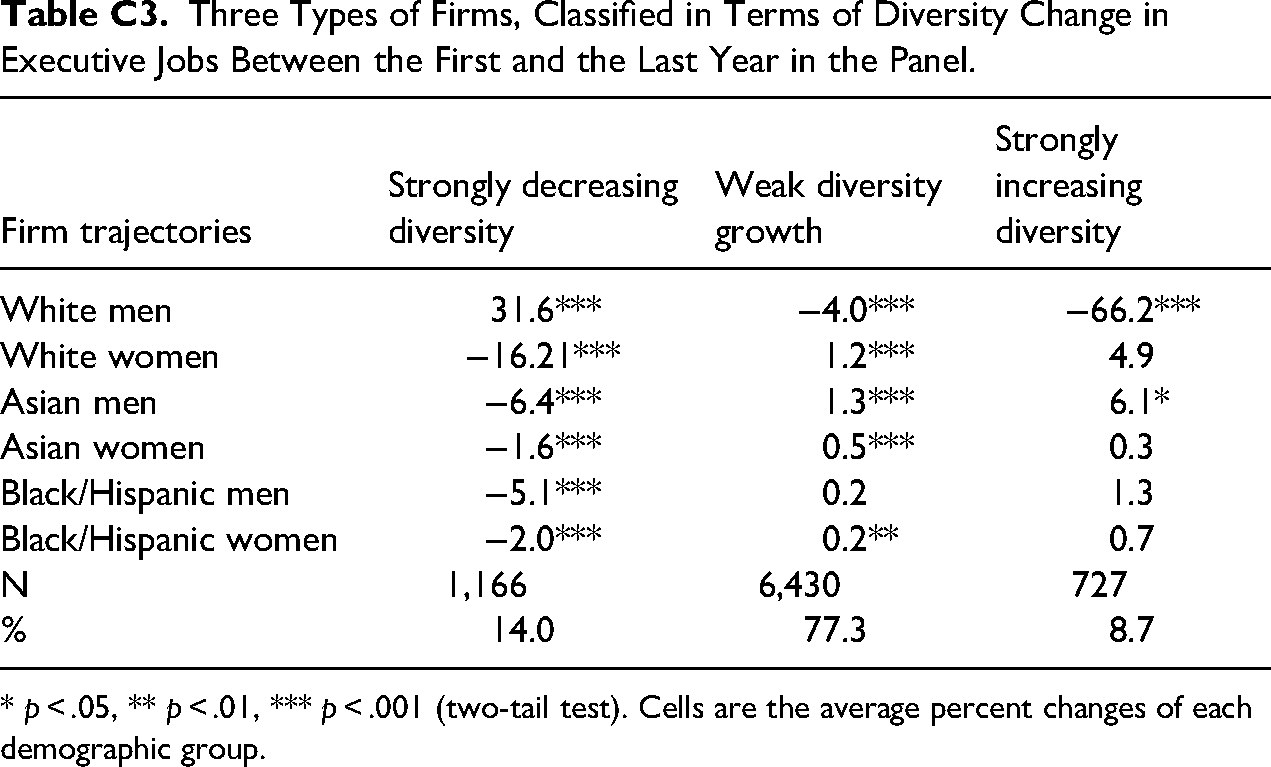
| Firm trajectories | Strongly decreasing diversity | Weak diversity growth | Strongly increasing diversity |
|---|---|---|---|
| White men | 31.6*** | −4.0*** | −66.2*** |
| White women | −16.21*** | 1.2*** | 4.9 |
| Asian men | −6.4*** | 1.3*** | 6.1* |
| Asian women | −1.6*** | 0.5*** | 0.3 |
| Black/Hispanic men | −5.1*** | 0.2 | 1.3 |
| Black/Hispanic women | −2.0*** | 0.2** | 0.7 |
| N | 1,166 | 6,430 | 727 |
| % | 14.0 | 77.3 | 8.7 |
* p < .05, ** p < .01, *** p < .001 (two-tail test). Cells are the average percent changes of each demographic group.
Appendix D: Analyses of Balanced Panel
Relative Risk Ratios of Executive and Managerial Diversity Classes on Professional Diversity Classes From Multinomial Logistic Regressions With Firm Attributes and Geographic Controls in Select Balanced Panel (N = 4,552; Appeared 5 Years and Longer in 9 Years Total).
| Occupational rank | Professionals | |||
|---|---|---|---|---|
| Latent class | Strong Asian male decline | Strong White male growth | Strong female growth | Strong Asian growth |
| Executive latent classes | ||||
| Decreasing diversity class | 1.33 | 1.30 | 1.06 | 1.31 |
| (0.30) | (0.18) | (0.14) | (0.58) | |
| Increasing diversity class | 0.66 | 1.08 | 1.33 | 2.09 |
| (0.27) | (0.21) | (0.21) | (1.01) | |
| Managerial latent classes | ||||
| Decreasing diversity class | 1.34 | 1.55** | 1.11 | 1.83 |
| (0.33) | (0.22) | (0.16) | (0.97) | |
| Increasing diversity class | 1.08 | 1.48* | 1.79*** | 5.71*** |
| (0.32) | (0.25) | (0.25) | (2.32) | |
| Firm attributes | ||||
| Top 50 largest firm | 3.72*** | 1.52 | 1.64 | 4.63** |
| (1.42) | (0.46) | (0.44) | (2.53) | |
| Federal contractor | 0.61* | 0.84 | 0.73** | 0.80 |
| (0.12) | (0.10) | (0.08) | (0.32) | |
| Controls | ||||
| Years in the panel | 1.11 | 0.90** | 0.96 | 0.82 |
| (0.07) | (0.03) | (0.03) | (0.10) | |
| Occupational size growth (log) | 0.12 | 0.38 | 9.45 | 0.56 |
| (0.21) | (0.41) | (14.97) | (1.67) | |
| Employment size growth (log) | 11.70 | 1.13 | 0.29 | 1.82 |
| (28.38) | (0.74) | (0.19) | (5.52) | |
| Total employment size (log) | 0.53*** | 0.61*** | 0.53*** | 0.80 |
| (0.07) | (0.05) | (0.04) | (0.17) | |
| Restructured (dummy) | 1.37 | 0.76 | 1.07 | 2.67* |
| (0.34) | (0.14) | (0.15) | (1.11) | |
| Tech markets (dummies) | Yes | Yes | Yes | Yes |
* p < .05, ** p < .01, *** p < .001; standard errors in parentheses.