
Abstract
Objective
Blood DNA methylation (DNAm) alterations have been widely reported in the onset and progression of mild cognitive impairment (MCI) and Alzheimer's disease (AD); however, DNAm is underutilized as a diagnostic biomarker for these diseases. We aimed to evaluate the diagnostic performance of DNAm for MCI and AD, both individually and in combination with well-established AD biosignatures.
Methods
A total of 1,891 blood samples from Alzheimer's Disease Neuroimaging Initiative (ADNI) studies were used to identify potential candidate DNAm biomarkers. Multimodal clinical data from 635 samples (normal control (NC), n = 193; MCI, n = 352; AD, n = 90) in the TADPOLE dataset were utilized to construct eight different classification models using a graph convolutional network, a machine learning framework.
Results
After feature selection, 17 DNAm sites were selected for subsequent analysis. Remarkable differences in DNAm levels were observed at the screened DNAm loci in all three cohorts. Adopting DNAm features into multimodal models significantly improved the classification performance for three dichotomous subtasks (NC vs. non-NC, MCI vs. non-MCI, and AD vs. non-AD), especially when combined with cerebrospinal fluid (CSF) features for NC (area under the curve (AUC): 0.8534) and MCI classification (AUC: 0.7675). A weak correlation between DNAm and both magnetic resonance imaging and CSF features in the NC and MCI cohorts suggests good complementarity between modalities (correlation coefficient ≤0.2).
Conclusions
Our study offers new insights into peripheral DNAm in MCI and AD and suggests promising diagnostic performance of models integrating epigenomics, imaging, or CSF biomarkers.
Plain Language Summary Title
Using Machine Learning and Blood-Based Genetic Markers to Help Diagnose Mild Cognitive Impairment and Alzheimer's Disease
Plain Language Summary
Why Was the Study Done? Memory issues range from mild cognitive impairment, where people have more problems thinking or remembering than their peers, to Alzheimer's disease, which profoundly affects memory, thinking and independence. Accurate diagnosis is essential for disease intervention. Researchers have found that DNA methylation, which regulates gene expression, is altered in the blood of people with cognitive disorders. Despite its potential, DNA methylation hasn't been widely used for diagnosis. Our study investigated its effectiveness in diagnosing both mild cognitive impairment and Alzheimer's, either alone or alongside other indicators. How we did the study? We analyzed blood samples from 1,891 people in an Alzheimer's disease research dataset to find potential DNA methylation indicators. We then focused on 635 people with comprehensive clinical data, including healthy people, those with mild cognitive impairment, and Alzheimer's patients. We built machine learning models using many types of data, such as DNA methylation, brain imaging, or cerebrospinal fluid analysis and evaluated their diagnostic performance. These models excel at detecting subtle patterns in data that are not obvious to humans. What We Found? Our study identified 17 key DNA methylation markers that are valuable for diagnosis. We found that using DNA methylation data along with other clinical data, such as cerebrospinal fluid testing, significantly improved the ability to correctly classify who has cognitive disorder. Our results show that DNA methylation can provide additional information not available from other tests, highlighting its potential as a diagnostic tool. What This Means for You? Our study sheds new light on the potential of blood DNA methylation to diagnose mild cognitive impairment and Alzheimer's disease. Our models, which combine genetic information with brain imaging or cerebrospinal fluid testing, show promise in diagnosing cognitive disorders.
Introduction
Alzheimer's disease (AD) is a genetic and sporadic neurodegenerative disease characterized by progressive amnestic cognitive impairment. 1 AD is the most common form of dementia, and with the rising elderly population, it has become a major global health problem.2,3 Although there is no efficacious cure for AD, studies have provided promising evidence that the early prodromal stages of AD, such as mild cognitive impairment (MCI), are precious time windows for reducing the incidence and symptoms of AD. Therefore, there is an increasing focus on timely diagnosis, early intervention, and risk reduction in AD and MCI.4,5
Neuroimaging and biomarkers provide relevant information regarding the diagnostic status and disease progression of AD and MCI. In particular, different modalities provide different information for diagnosing AD/MCI, such as structural cerebral atrophy through magnetic resonance imaging (MRI), 6 altered metabolism in the brain through positron emission tomography, 7 and pathological amyloid deposition in the cerebrospinal fluid (CSF).8,9 Combining machine learning with multimodal neuroimaging data or CSF information, studies have shown improved early diagnostic accuracy for MCI and AD.4,9–12
Common gene polymorphisms, such as apolipoprotein E (APOE) ɛ4, are associated with an increased risk for late-onset AD. In particular, approximately 60% of patients with sporadic AD have the APOE ε4 allele.13,14 In addition, apart from genetics, there is growing recognition that epigenetic markers such as DNA methylation (DNAm) also play an important role in the onset of AD. 15
After identifying the DNAm pattern in the AD brain and its correlation with progression defined by Braak stages,16,17 recent studies have also revealed DNAm differences in the blood samples of AD patients from different dimensions. Silva et al. 18 conducted an epigenome-wide meta-analysis of blood DNAm and identified methylation differences significantly associated with AD at individual CpG sites, mapped to genomic regions and intergenic regions. Intriguingly, studies have shown that alterations in blood DNAm can be detected at least 3 years before the emergence of dementia symptoms.18,19 Moreover, a biosignature comprising blood DNAm changes may be a useful prognostic biomarker for AD progression. 20 These studies indicate the promising early classification capability of DNAm, providing ideas for the optimization of AD/MCI diagnosis.
In this study, we innovatively integrated and exploited DNAm information into classification models for MCI and AD together with other underlying clinical information, including MRI neuroimaging data and CSF information. Briefly, we used a data-driven approach to screen for validated methylation features. Subsequently, we utilized multimodal data (epigenomics and imaging omics) to construct and train classification models using a powerful graph convolutional network (GCN). The primary goal of this project was to facilitate the clinical diagnosis and early detection of MCI or AD. Prompt diagnosis and treatment of patients will hopefully retard disease progression and ultimately reduce the burden at both individual and societal levels.
Materials and Methods
Ethical Standards
The data involved in this study were obtained from the publicly available Alzheimer's Disease Neuroimaging Initiative (ADNI) database and its subset, TADPOLE. All procedures involving human participants were conducted in accordance with the ethical standards of the Institutional and/or National Research Committee and the Declaration of Helsinki.
Datasets
The multimodal data in this study were obtained from ADNI, which is publicly available upon approval. We used 1,891 blood samples to identify candidate biomarkers in DNAm, including 606 normal control (NC), 890 MCI, and 395 AD samples. After DNAm feature selection, classification model construction was separately performed using a subset of 635 samples (including 193 NC, 352 MCI, and 90 AD) with complete multimodal characteristics. The multimodal information comes from the TADPOLE dataset, 21 which includes the following three types of characteristics: (1) four basic phenotypic characteristics (recorded as base): age, sex, year of education, and APOE ε4 allele; (2) the concentration of three biomarkers in CSF (recorded as csf): amyloid-beta protein, tau, and phosphorylated tau; and (3) MRI characteristics (recorded as mri18). The details of the characteristics used for the classification model are presented in Table S1. The 635 samples with complete characteristics were divided into NC, MCI, and AD groups according to their disease status.
Preprocessing of DNAm Data
All DNAm samples were analyzed using the Illumina Human Methylation EPIC BeadChip, which covers approximately 866,000 CpG sites. It contains two types of Infinium Methylation Assay scheme (see Refs.22,23 for more details). In type-1 probe, two types of beads correspond to each CpG site: one for measurement of the methylated state and one for measurement of the unmethylated state. Two bead types for the same CpG site incorporate the same type of labeled nucleotide and are detected in the same color channel. In type-2 probe, each CpG site corresponds to one bead and is detected by single-base extension using two colors. To avoid the bias caused by the different methylation distributions and dynamic range of these two types of probes, we employed the BMIQ algorithm (Beta MIxture Quantile dilation) 24 to adjust the beta-values of type-2 design probes into a statistical distribution characteristic of type-1 probes. This method involves a three-state beta-mixture model to assign probes to methylation states, a probability-to-quantile transformation, and a methylation-dependent dilation transformation to preserve monotonicity and continuity. It is implemented using champ.norm function in the R package CHAMP. 25 According to official guidelines, the ADNI database provides 1,904 original samples that have undergone official quality control. Then, according to barcode matching, 1,891 of the original 1,904 samples had the corresponding disease status labels; thus, they were finally used for DNAm biomarker mining.
Feature Selection of DNAm Biomarkers
We adopted the minimum redundancy maximum relevance algorithm 26 for the preliminary screening of methylation characteristics. This algorithm can minimize redundancy between features and maximize the correlation between features and classification labels. According to the feature importance scores obtained by the algorithm, the top-ranked 4,000 methylation sites were selected.
Previous studies found that adjacent CpG sites usually share the same methylation state.27,28 Clustered sites are more reliable than isolated sites because the resolution of methylation states at individual sites is generally imprecise.28,29 Therefore, we used the Density-Based Spatial Clustering of Applications with Noise 30 method to cluster sites with close coordinates into several groups and applied the group least absolute shrinkage and selection operator (LASSO) 31 algorithm to estimate the importance of these sites. The CpG sites were then ranked according to their importance scores, from large to small.
Finally, we built support vector machine classification models by accumulating methylation characteristics individually and recording the classification accuracies (the accuracy of the top-1, top-2, etc.) until the accuracy rate no longer increased. The accuracy of the top-ranked 17 methylation sites reached the highest. Therefore, we used the methylation levels of these 17 methylation sites to construct AD classification models, together with other multimodal characteristics.
Classification With GCN
We model the population information as a sparse graph, where the nodes represent different samples and the edges represent the relationship between samples. The GCN 32 has recently emerged as a powerful architecture for explicitly modeling the similarity relationships (edges) between samples (nodes), thus achieving a more accurate classification through information propagation and aggregation between nodes in the graph. Excellent results have been achieved in the field of medical-assisted diagnosis. 33 Therefore, we employed this method to fuse multimodal information and capture the similarities between samples for AD classification. Based on the semi-supervised node classification method proposed by Parisot et al., 34 all samples were constructed into a sparsely large graph, where the labels of the testing samples were hidden, and they were predicted through the message passing of the GCN.
To fuse different types of characteristics and form multimodal data, characteristics other than basic phenotypic ones are concatenated to form node features
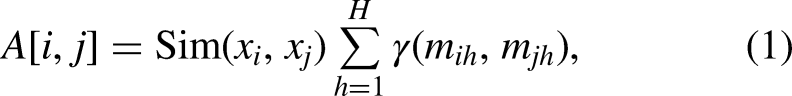
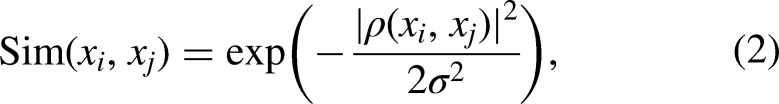
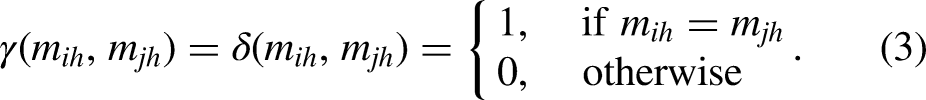
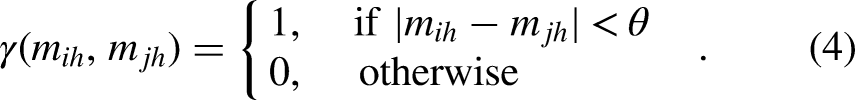
The node update rule in a graph convolution layer in GCN is formulated as

In general, we constructed a GCN with two layers (L = 2), where the activation functions were ReLU and Softmax, respectively. The formula for forward propagation is as follows:

Experimental Settings
Feature selection was performed using MATLAB with the fscmrmr and dbscan functions and the self-implemented LASSO group. GCN classification was implemented using Python with TensorFlow. 32 In the GCN model, the value of the dropout layer parameter was 0.02, and the Adam optimizer was used to optimize the network at a learning rate of 0.05. We adopted ten-fold cross-validation, a popular internal validation scheme,36,37 to evaluate the performance of multimodal classification models using 635 samples with DNAm and other multimodal TADPOLE features. All the data were divided into 10 subsets, nine as a training set, and the remaining one as a testing set.
Results
Basic Information About the Study Dataset and Features
Following feature selection, 17 DNAm sites were screened for subsequent classification (recorded as me17). Multimodal clinical data from 635 samples in the TADPOLE dataset were utilized for classification model training (see section “Datasets” for details on multimodal data). The demographic and clinical information of the cohort are shown in Table 1. In the present study, different types of features, either individually or in combination, were used in different models. The eight classification models were: (A) base, (B) base + csf, (C) base + mri18, (D) base + me17, (E) base + csf + mri18, (F) base + mri18 + me17, (G) base + csf + me17, (H) base + csf + mri18 + me17.
Demographics and Clinical Information of Each Cohort.
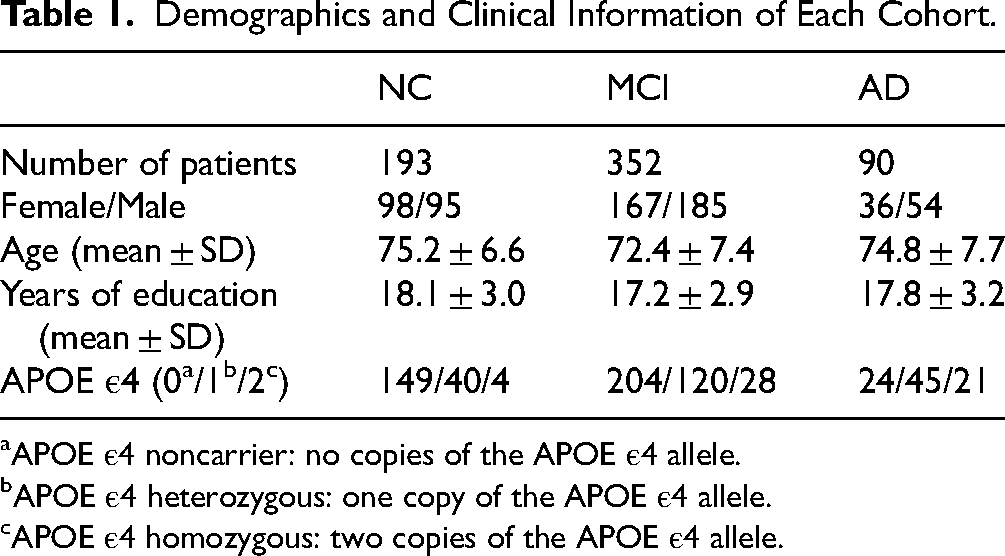
APOE ε4 noncarrier: no copies of the APOE ε4 allele.
APOE ε4 heterozygous: one copy of the APOE ε4 allele.
APOE ε4 homozygous: two copies of the APOE ε4 allele.
Comparison of Receiver Operating Characteristic Curves for Classification Models
A comparison of the receiver operating characteristic (ROC) curves of the eight classification models in the three dichotomous subtasks (NC vs. non-NC, MCI vs. non-MCI, and AD vs. non-AD) is shown in Figure 1. The area under the ROC curve (AUC) of the eight machine learning models was calculated and is presented in Figure 1 and Supplemental Material (Table S2 and Figure S1). In most cases, the application of 17 DNAm features increased the AUC, indicating the good classification efficacy of DNAm. In particular, a combination of base, CSF, and DNAm features showed optimal classification performance for the average NC/MCI/AD, NC, and MCI groups (AUC: 0.863281; AUC: 0.853409; and AUC: 0.767488).
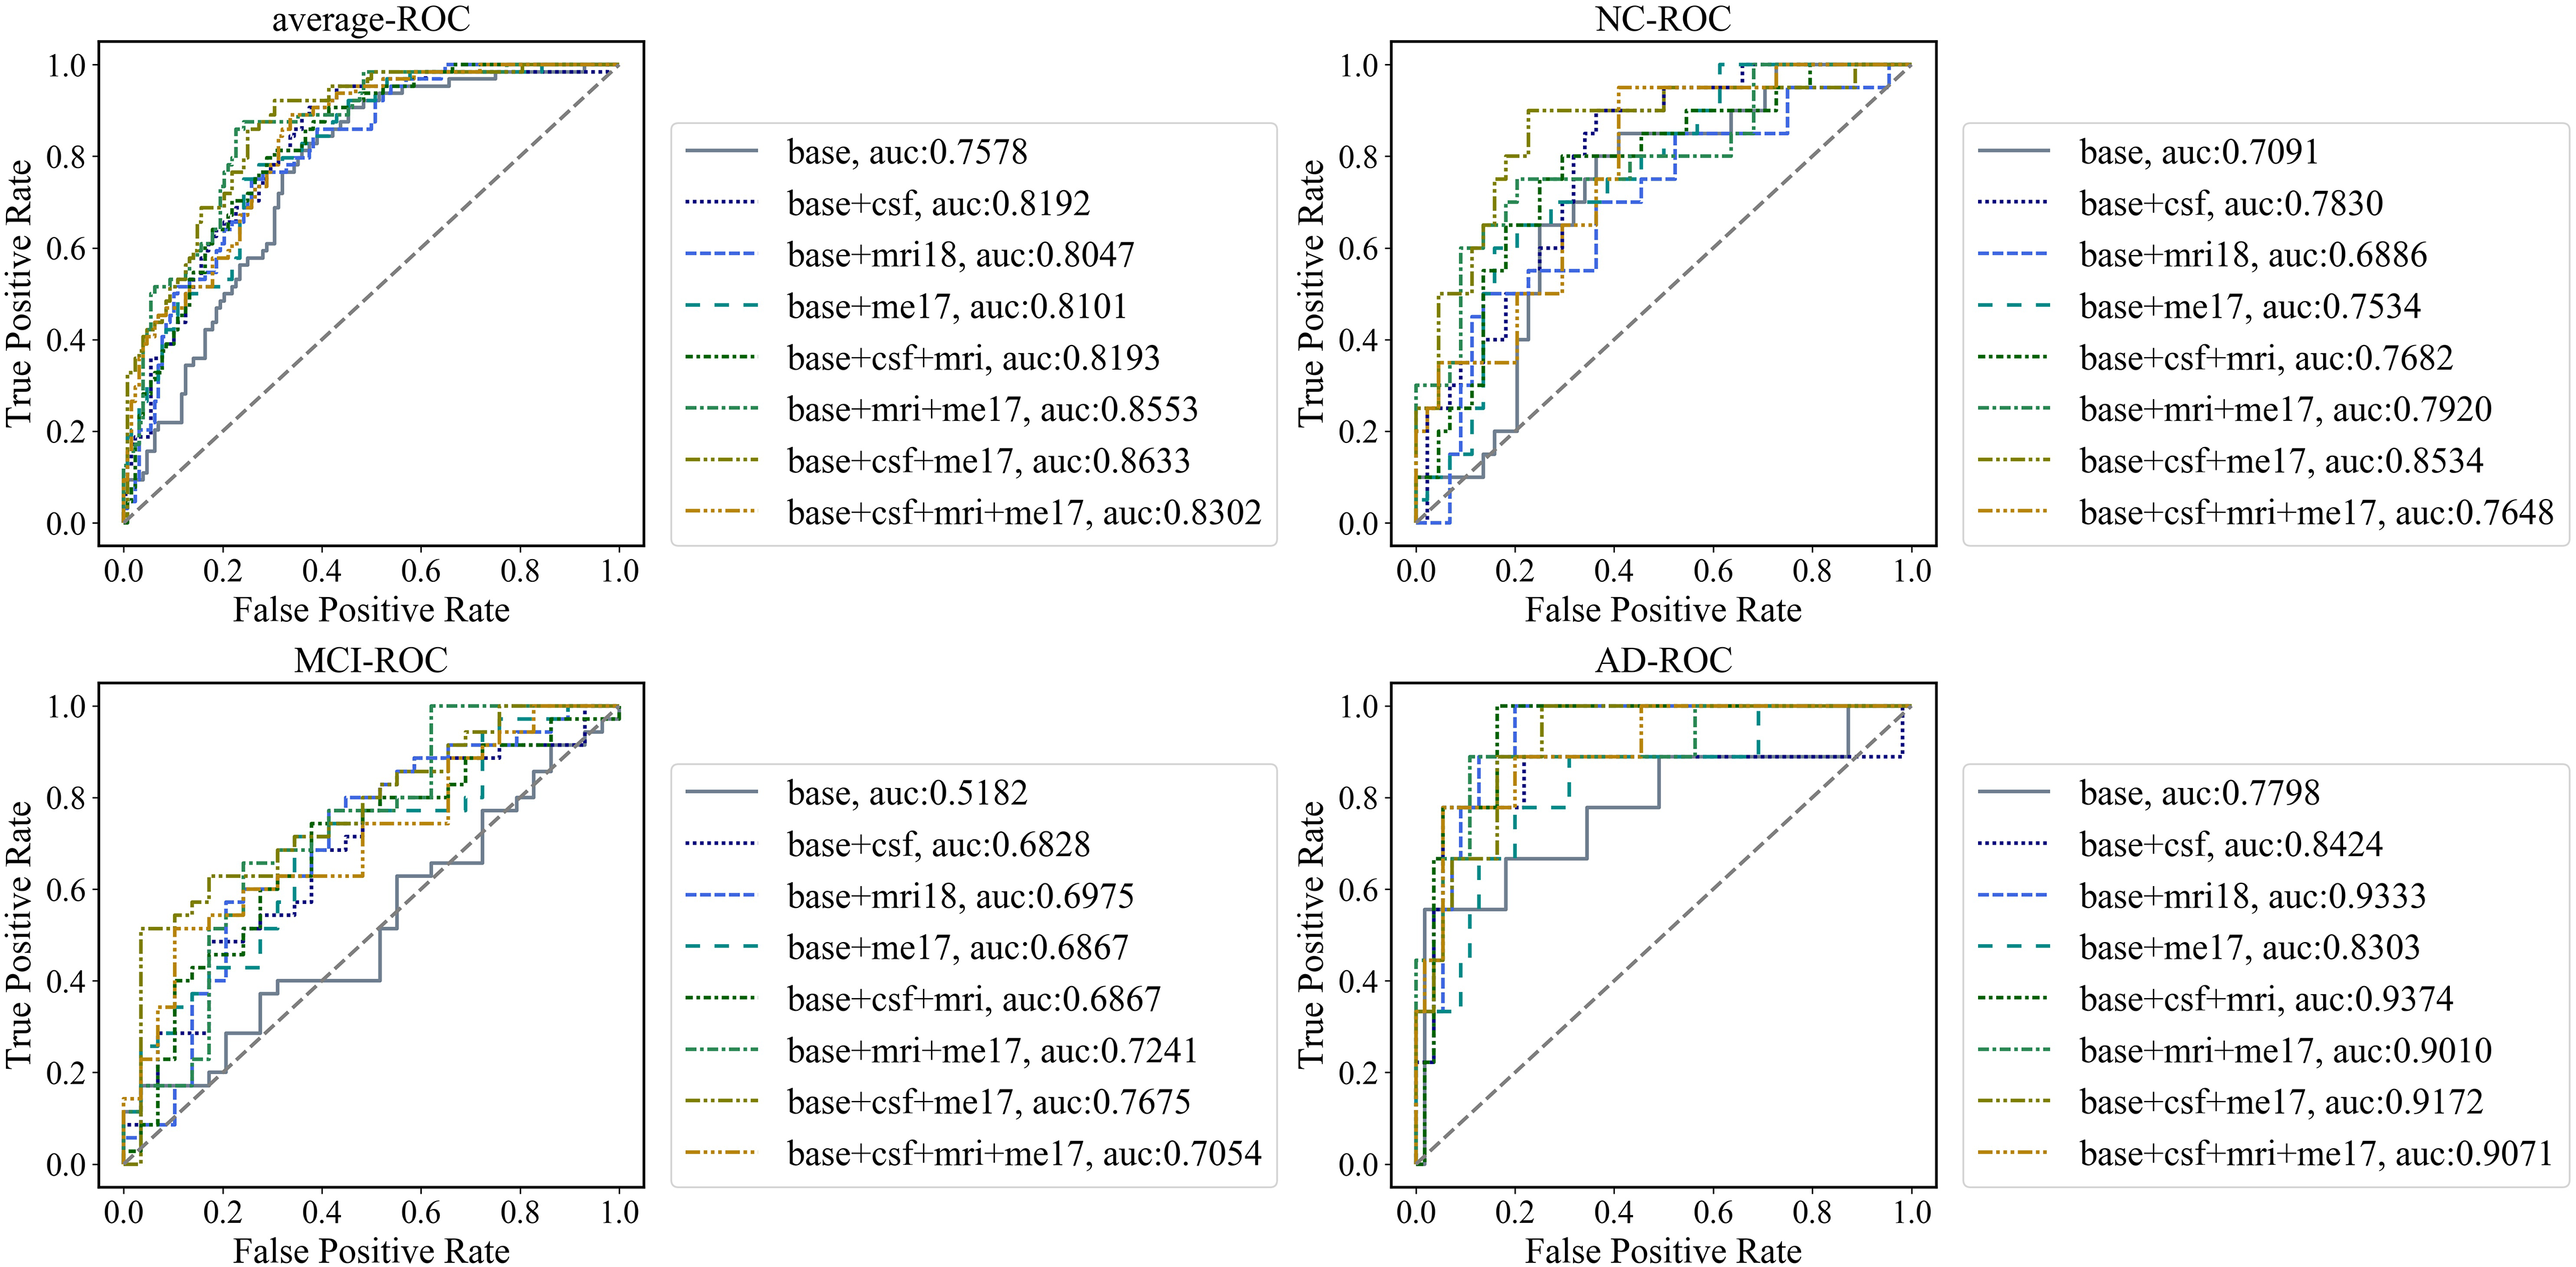
Comparison of each classification model by receiver operating characteristic (ROC) analysis. ROC curves for eight classification models in three dichotomous sub-tasks: NC vs. non-NC (b), MCI vs. non-MCI (c), and AD vs. non-AD (d). Average ROC curves for the three dichotomous tasks are calculated using the following micro method (a),
DNAm Level Difference at 17 Methylation Sites
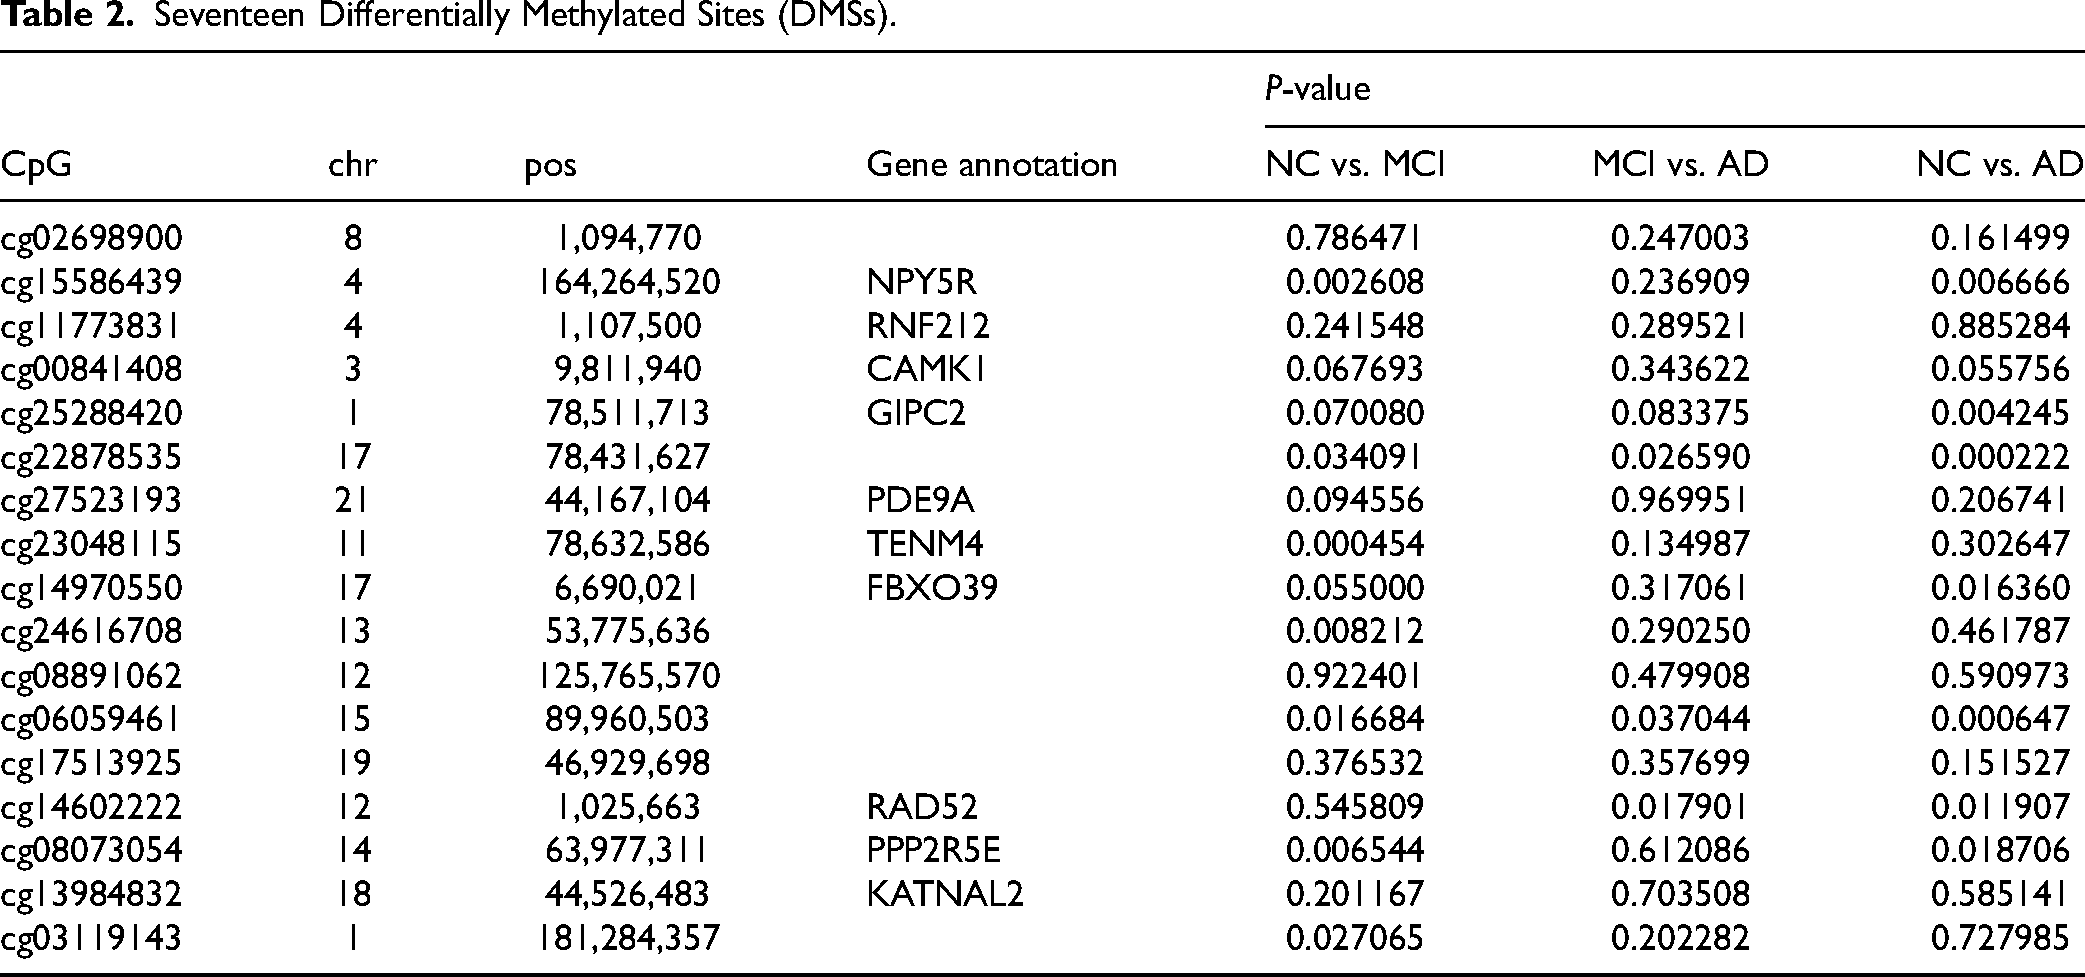
The 17 differentially methylated sites (DMSs) are listed in Table 2. Among them, DMSs at 10 CpG sites were located in NPY5R, RNF212, CAMK1, GIPC2, PDE9A, TENM4, FBXO39, RAD52, PPP2R5E, and KATNAL2 genes. In particular, CAMK1, GIPC2, and PDE9A are closely associated with AD.38–41 We performed two-by-two comparisons of methylation levels at these 17 loci in the NC, MCI, and AD cohorts (Table 2, Figure S2). A total of 7 DMSs differentiating MCI and NC (cg15586439, cg22878535, cg23048115, cg24616708, cg06059461, cg08073054, and cg03119143), 7 DMSs differentiating AD and NC (cg15586439, cg25288420, cg22878535, cg14970550, cg06059461, cg14602222, and cg08073054), and 3 DMSs differentiating MCI and AD (cg22878535, cg06059461, and cg14602222) were found in this study.
Seventeen Differentially Methylated Sites (DMSs).
Correlation Between DNAm and Other Modalities
Furthermore, to investigate the correlation of DNAm features with other features employed in the models, we conducted Spearman correlation analysis in the NC, MCI, and AD cohorts. As shown in Figure 2, DNAm exhibits a low correlation with MRI and CSF features in NC and MCI cohorts (correlation coefficient ≤0.2) but a moderate correlation with cognition scores in AD patients (Figure 2(f), correlation coefficient: 0.30). Cognitive evaluation is regarded as the gold standard diagnostic criterion for MCI and AD; therefore, the correlation between DNAm and cognition scores suggests the diagnostic efficacy of DNAm.
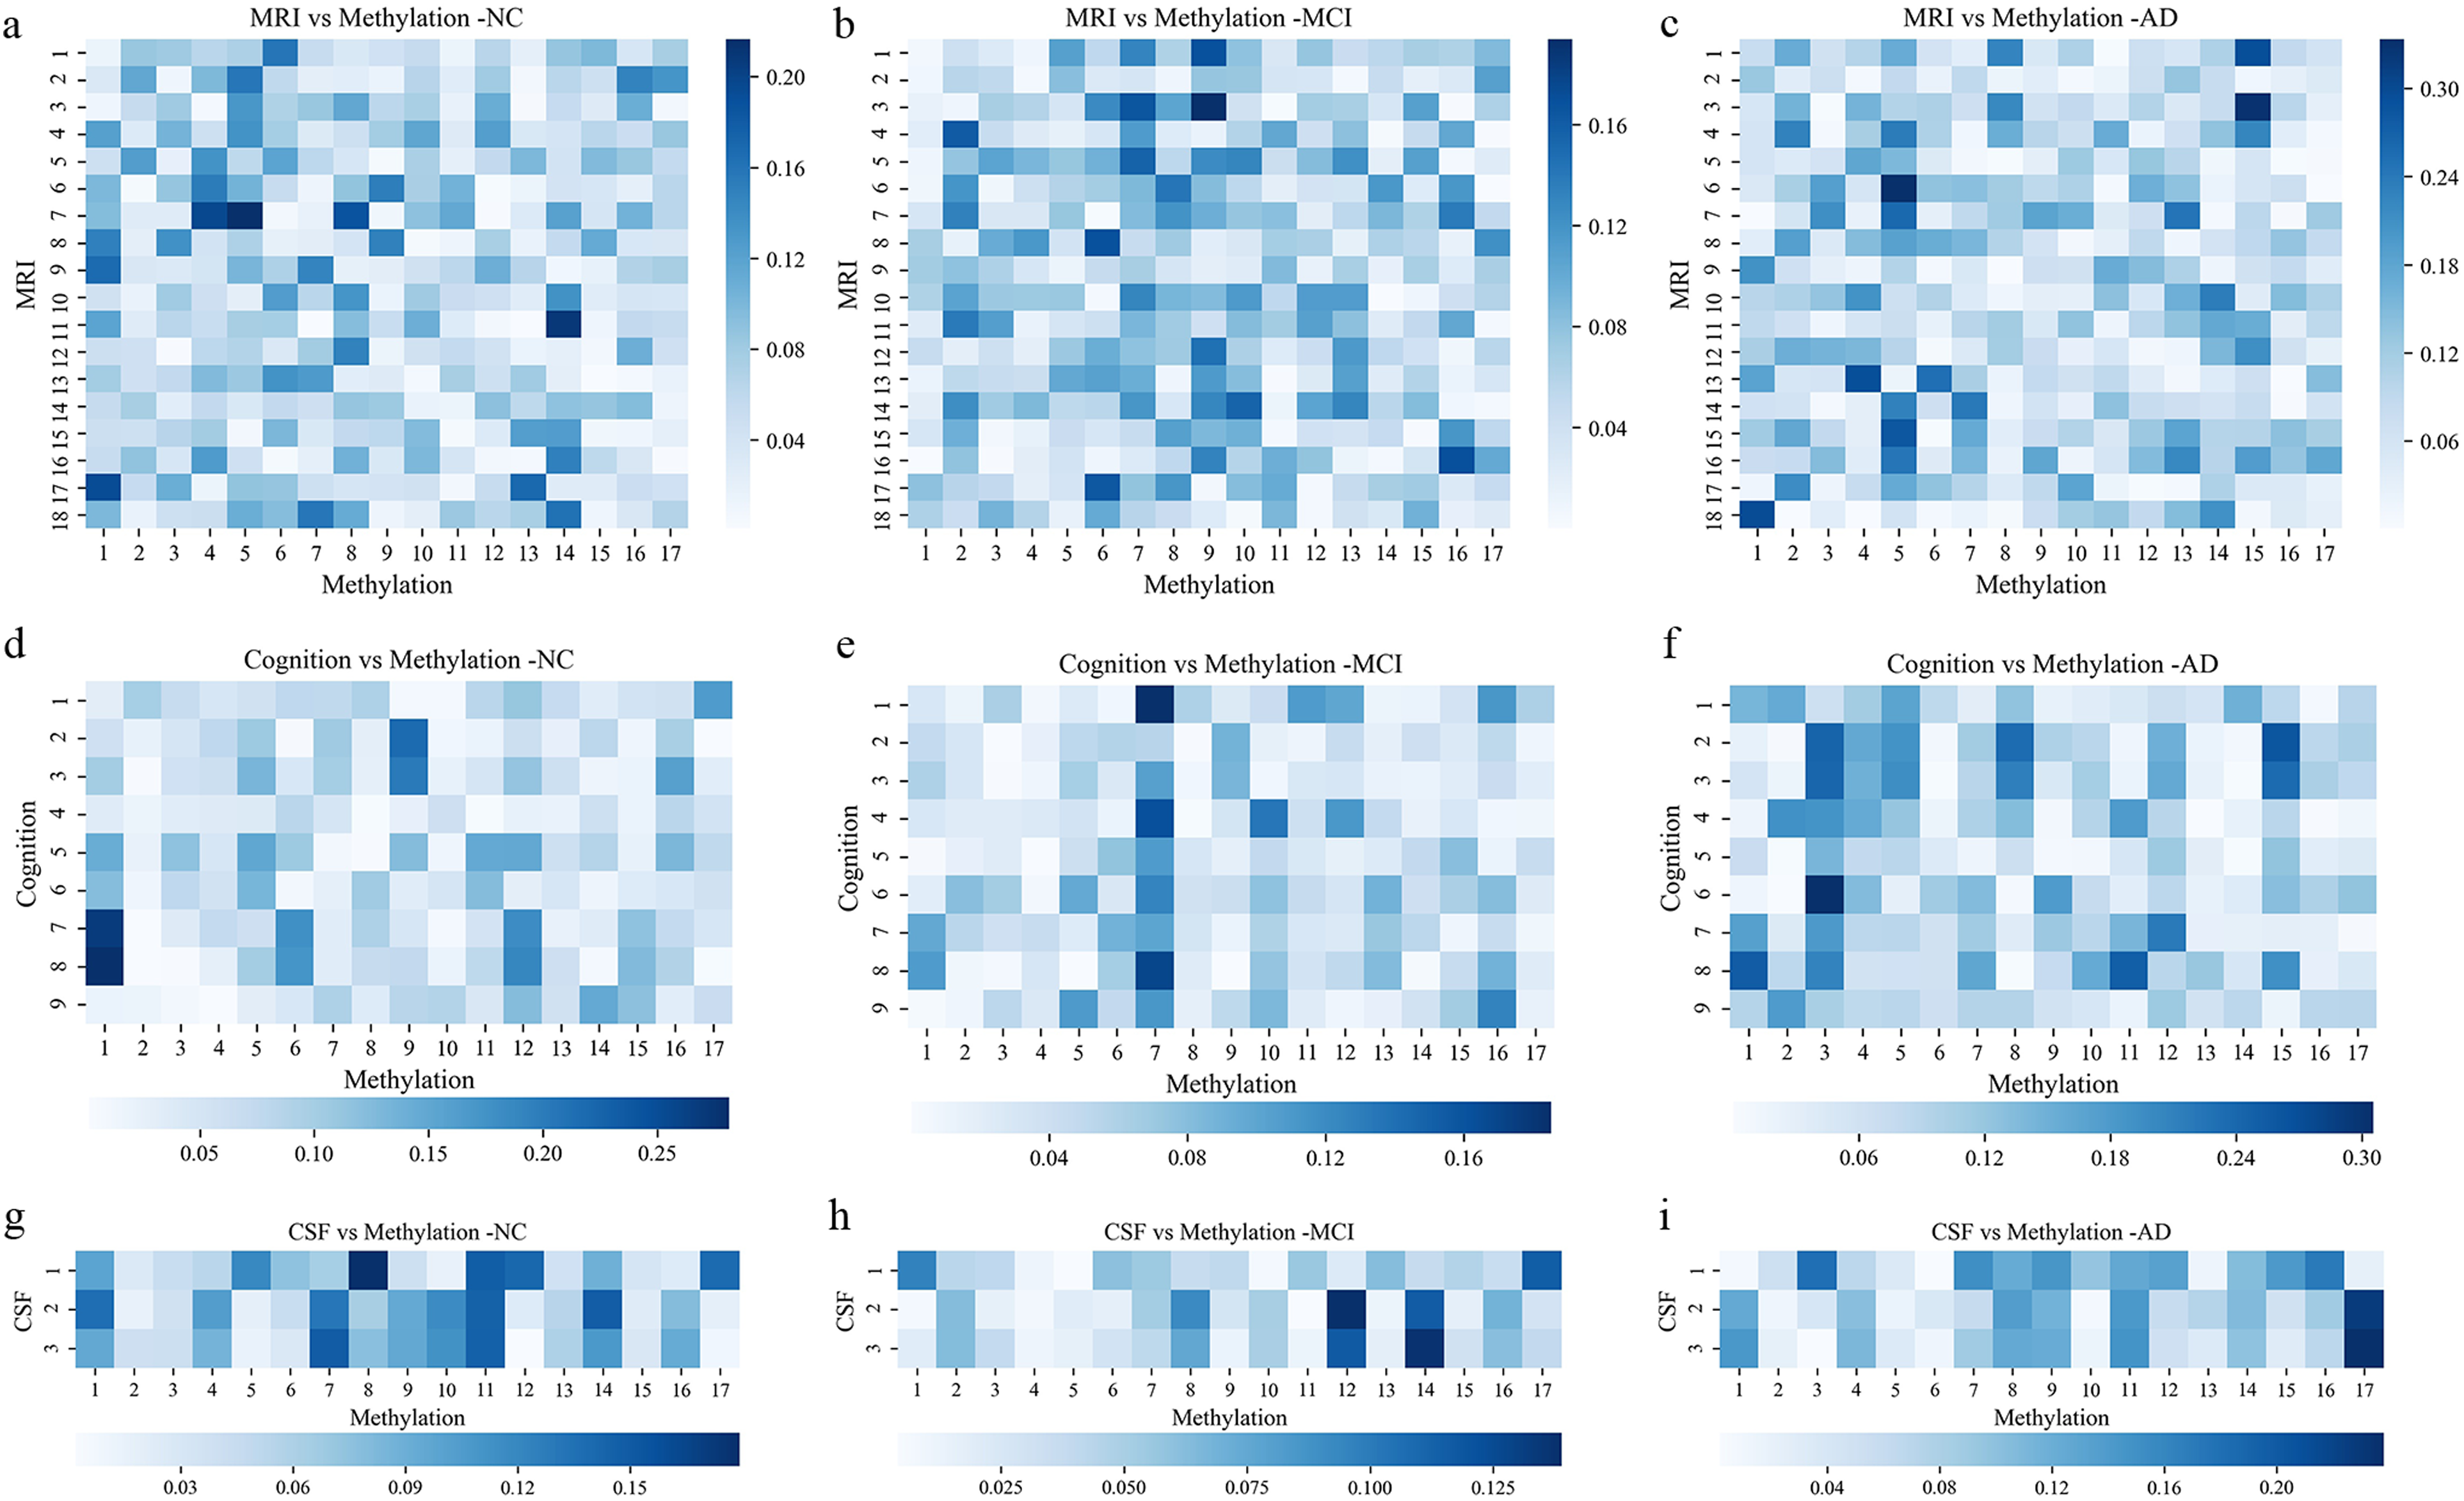
Correlation coefficient heatmap between DNA methylation (DNAm) features and multimodal features heat map of Spearman correlation coefficients between 17 DNAm features and 18 brain imaging features (a–c), 9 cognitive scores (d–f) and 3 CSF features (g–i) under the three categories, MCI, AD, and NC are shown respectively. (There are 15 samples with missing cognitive scores, so the graph (g–i) is drawn for 620 samples).
Prediction Probability and Risk Score for Classification Models
To further visualize and compare the models’ capacities to discriminate between participants with MCI, AD, and controls, we provided boxplots of the prediction probability and risk score for each model (Figure 3; Figure S3). In most cases, when DNAm features were combined with MRI or CSF features, the probability of a correct prediction for each sample type significantly increased (Figure 3). The risk score represented the probability of a specific class of samples being classified as diseased. In the AD cohort, the risk score reached its maximum in the base + me17 + mri18 model (Figure S3; risk score: 1.410763). These results demonstrate the efficacy of our models and highlight the significance of DNAm information in the diagnosis of MCI and AD.
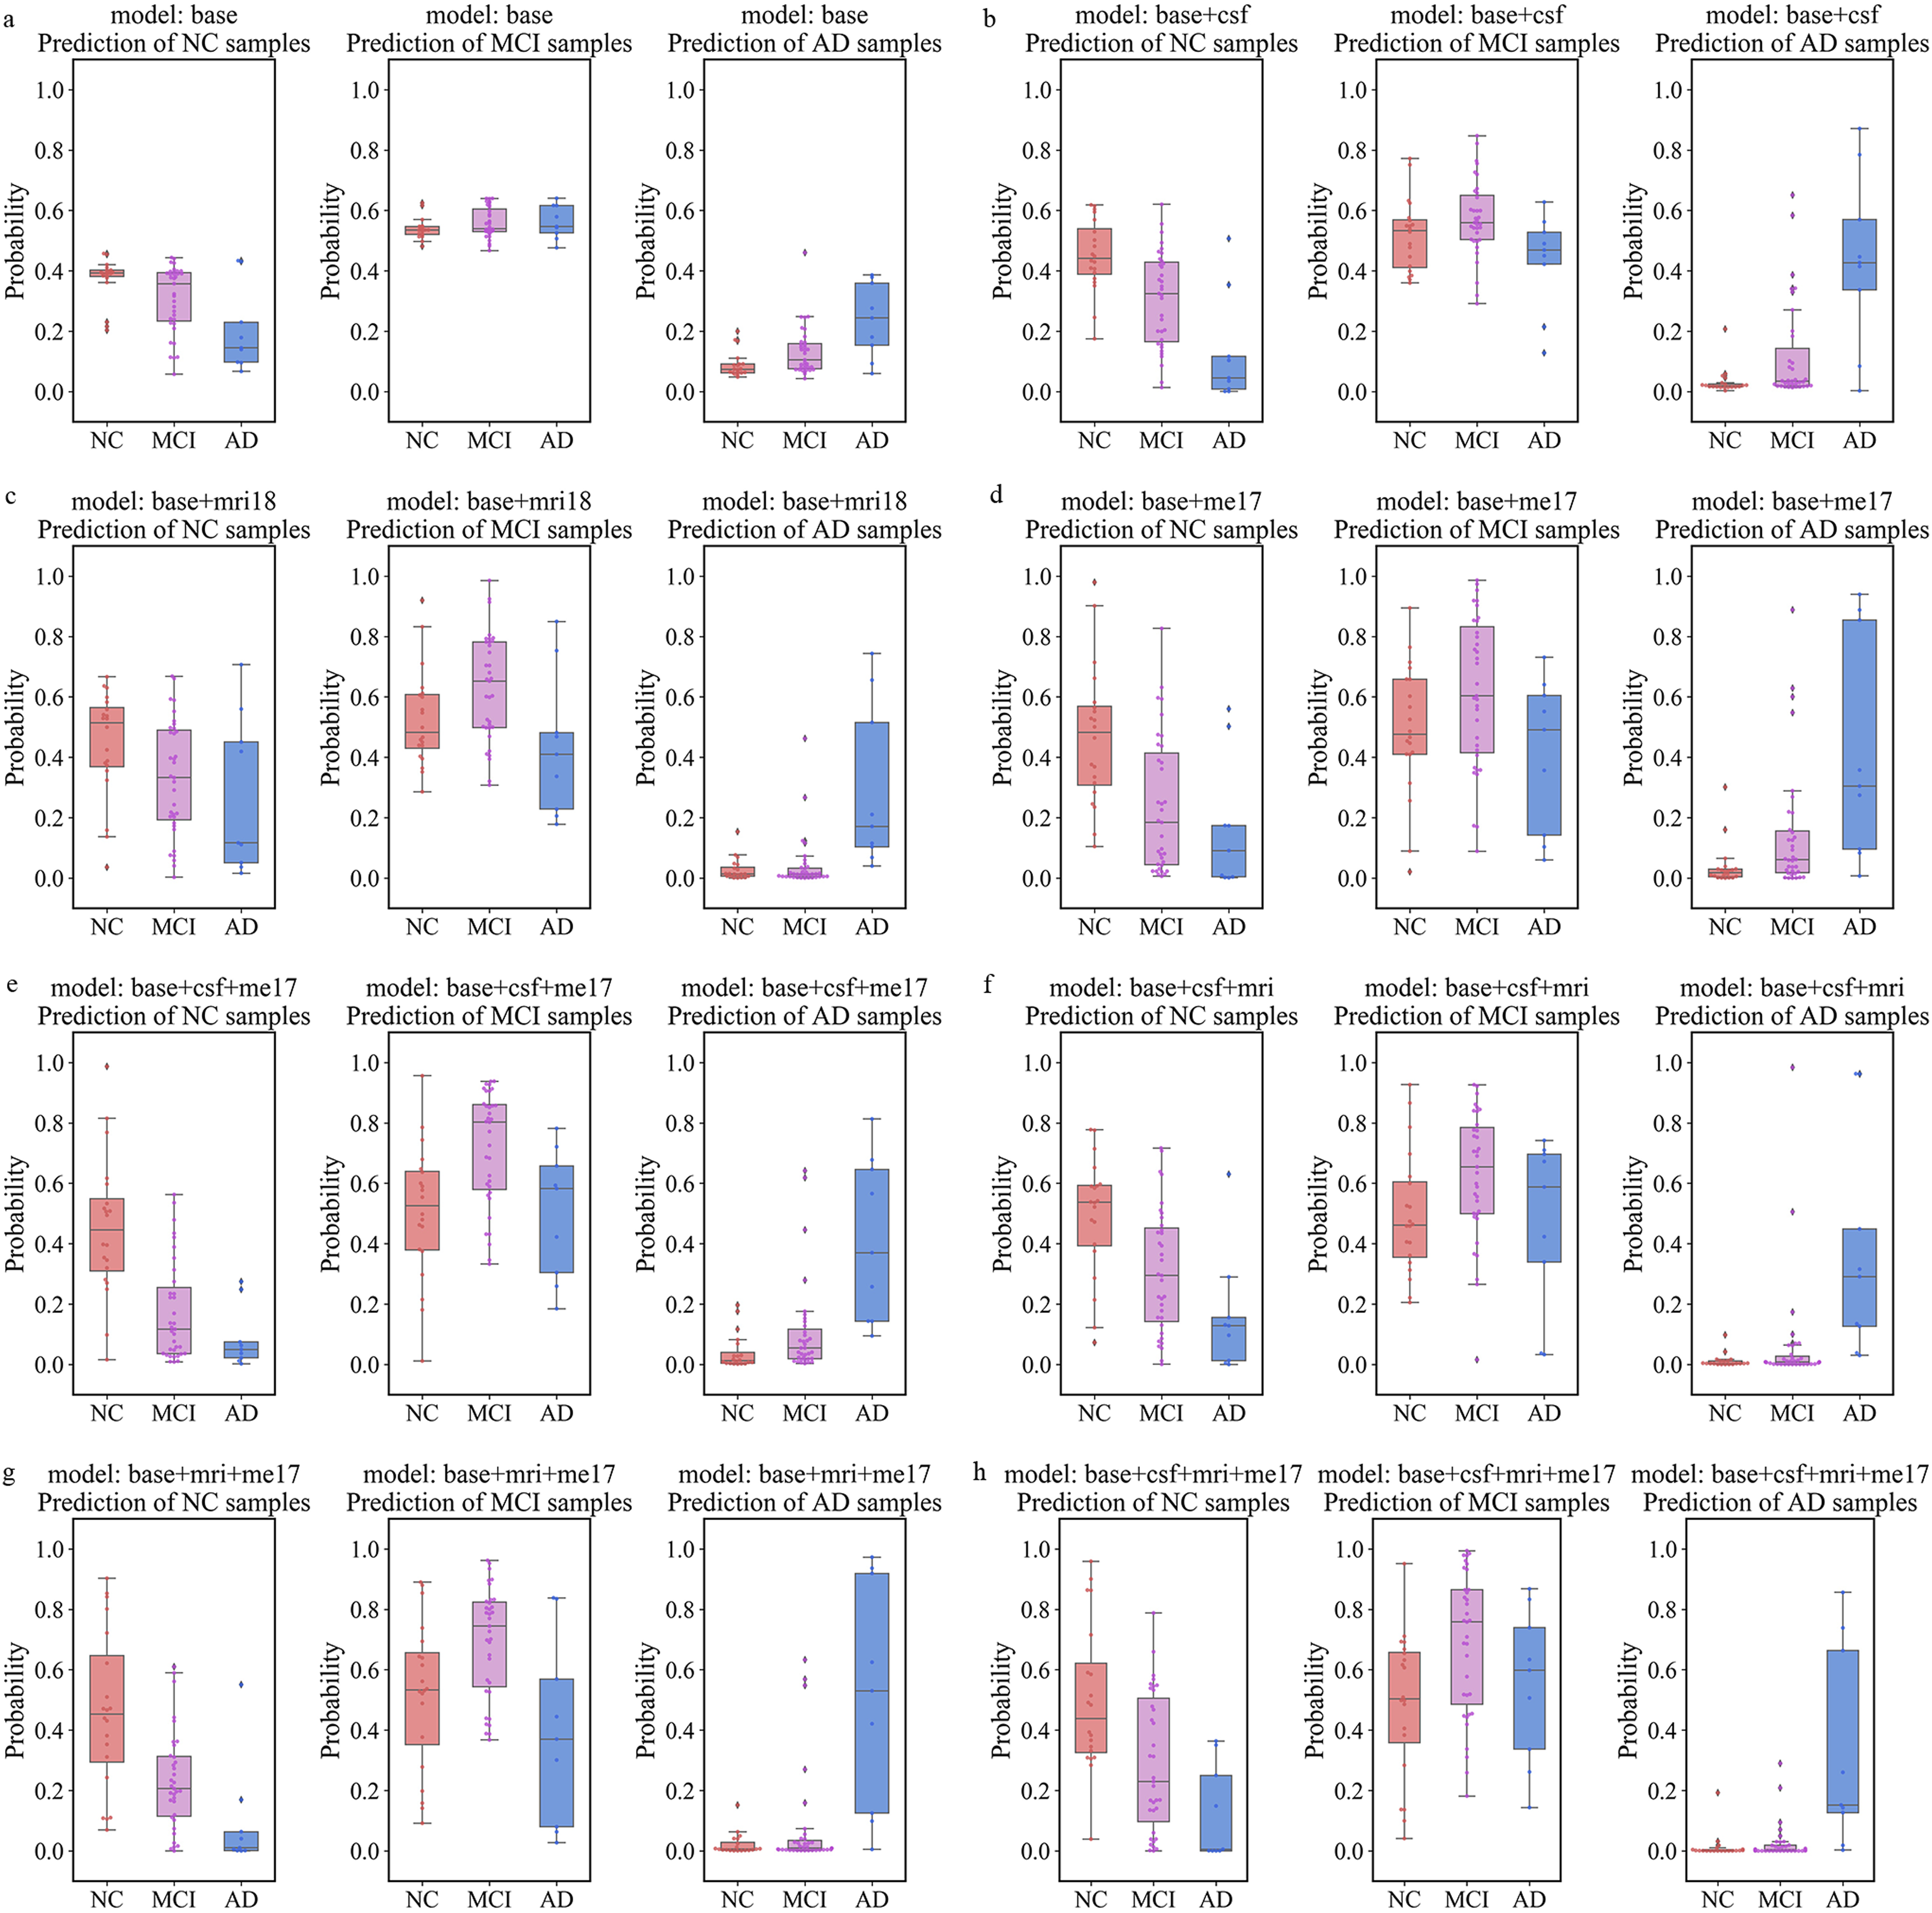
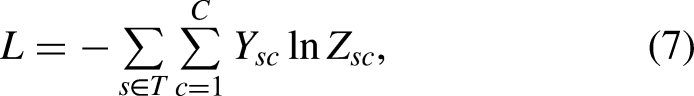
Boxplots of prediction probability for classification models. The y-axis depicts the prediction probability estimates of a class of samples being identified as NC, MCI or AD. Prediction probability is the output of the GCN model (Equation (6)), which is converted into a scale of 0 to 1 with a sum of 1 using a softmax activation function:
Discussion
In this study, we used a data-driven approach to screen for validated blood DNAm features. Top-ranked 17 methylation sites were selected and significant differences in DNAm levels were observed at these loci between NC, MCI, or AD cohorts. We then constructed classification models using a GCN to evaluate the diagnostic performance of DNAm for MCI and AD, individually and in combination with well-established AD biosignatures. Notably, multimodal models integrating epigenomics, imaging or CSF biomarkers showed improved classification performance. Our findings add new evidence for good disease classification accuracy and efficacy of multimodal data incorporating DNAm.
DNAm alteration in AD has attracted increasing attention, mainly because of its early emergence in presymptomatic patients and its association with the AD susceptibility gene network. 16 Previous studies mainly focused on peripheral DNAm alterations as novel biomarkers of MCI and AD.42–44 With the development of machine learning techniques, researchers used DNAm data to build classification models based on different deep learning frameworks. A recent study proposed a deep learning-based model to predict AD by integrating gene expression and brain DNAm datasets, and reported improved prediction accuracy. 45 Using blood DNAm is critical given the convenience of obtaining blood compared to brain tissue. Similar to Mahendran's study, 46 we adopted a data-driven approach to select blood DNAm features, rather than simply focusing on DNAm in reported AD risk genes. Compared to models using DNAm data of 7 key immunologic-related genes in Lin's study 47 (AD vs. NC, AUC: 0.81), our multimodal models showed better classification performance (for example: base + csf + me17 model, AD vs. non-AD, AUC: 0.917172). Our study demonstrates the advantage of multimodal models incorporating blood DNAm information in disease classification.
We extracted 17 DNAm features from approximately 866,000 CpG sites screened using the Illumina Methylation BeadChip. Consistent with previous studies, 42 the screened DNAm sites showed significantly altered DNAm levels in three clinical phenotypic comparisons: AD vs. NC, AD vs. MCI, and MCI vs. NC (Table 2, Figure S2). Several DMSs identified in this study mapped to genes which are closely associated with AD, such as phosphodiesterase 9A (PDE9A). PDE9A is a cyclic nucleotide (cGMP)-specific phosphodiesterase. cGMP plays a vital role in glutamatergic neurotransmission, synaptic plasticity, and memory. In cases of abnormal glutamatergic neurotransmission, such as AD, studies have shown inhibition of PDE9A may increase cGMP levels and improve cognitive function in AD mice.40,41,48 However, the potential classification ability of most DMSs for MCI and AD was reported for the first time. Our results provide a valuable resource for the discovery of AD biomarkers.
The advent of GCN has significantly improved disease classification accuracy compared with traditional machine learning frameworks such as convolutional neural networks.4,35 Interestingly, in this study, applying DNAm features to multimodal models based on GCN significantly improved the classification accuracy and efficacy for NC, MCI, and AD, especially when combined with CSF features for NC and MCI classification. This can be explained by the good complementarity of DNAm and CSF features; that is, they showed a relatively low correlation in the NC and MCI cohorts (Figure 2(g) and (h)). It is worth noting the good performance of our multimodal model in classifying patients with MCI. This finding is supported by previous studies indicating deregulated blood differentially methylated regions in patients with MCI compared with age-matched healthy controls.20,49 Of particular importance, Li and his colleagues also reported that certain DMSs have an association with MCI conversion status. 20 As a presymptomatic stage of dementia, MCI shows a high risk of developing AD at a rate of 10–15% per year compared to 1–2% per year in non-demented populations. Our machine-learning-based model will assist in the prompt diagnosis of patients with MCI.
This study has several limitations. First, DNAm levels in ADNI database are analyzed using whole blood, which contains a complex mixture of cell types. Studies have shown that methylation characteristics vary widely in different cell types. 50 Cell type specific methylation differences may be masked by this assay. Further methylation studies could be performed after cell classification. Second, because few public datasets contain complete multimodal data such as peripheral DNAm, APOE ɛ4 allele, and neuroimaging, we employed 10-fold validation instead of an out-of-sample validation analysis to assess the performance of models. Nevertheless, cross-validation is accepted as a popular internal validation scheme.36,37 Third, although the application of DNAm features improved the performance of the models in most cases, integrating DNAm into the base + mri18 model failed to improve the classification performance for AD versus non-AD. This may indicate potential redundancy between imaging and DNAm features. Finally, it remains unclear whether altered DNAm contributes to the pathology or is an early epiphenomenon of neurodegeneration. Further studies are needed to elucidate the functions of these DMSs in AD.
Early detection of AD in the preclinical phase will have the greatest clinical utility in the prevention, survival, therapeutic intervention and management of this deadly disease. A recent study has shown improved performance of models using DNAm data to predict AD progression. 51 Ongoing work includes the integration of DNAm data and rich multi-omics data from the ADNI dataset for the prediction of MCI conversion to AD. This will enable the optimal use of DNAm as a dynamic biomarker of disease onset and progression.
Conclusion
Our study highlights the importance of peripheral DNAm information in the diagnosis of MCI and AD and suggests the promising diagnostic performance of multi-omics models integrating epigenomics, imaging, or CSF biomarkers.
Supplemental Material
sj-docx-1-cpa-10.1177_07067437241300947 - Supplemental material for Graph Convolutional Network for AD and MCI Diagnosis Utilizing Peripheral DNA Methylation: Réseau de neurones en graphes pour le diagnostic de la MA et du TCL à l’aide de la méthylation de l’ADN périphérique
Supplemental material, sj-docx-1-cpa-10.1177_07067437241300947 for Graph Convolutional Network for AD and MCI Diagnosis Utilizing Peripheral DNA Methylation: Réseau de neurones en graphes pour le diagnostic de la MA et du TCL à l’aide de la méthylation de l’ADN périphérique by Yuqin Qian, Xinlu Tang, Ruinan Shen, Yong Lu, Jianqing Ding, Xiaohua Qian and Chencheng Zhang in The Canadian Journal of Psychiatry
Footnotes
Acknowledgments
We thank our colleagues at the Zhang and Qian Laboratories for providing generous assistance, critical comments, and suggestions.
Data Availability
All datasets analyzed in this study are openly available as described in Materials and Methods. In particular, ADNI can be accessed from https://adni.loni.usc.edu, and TADPOLE dataset can be accessed from ![]() .
.
Declaration of Conflicting Interests
The authors declared no potential conflicts of interest with respect to the research, authorship, and/or publication of this article.
Funding
The authors disclosed receipt of the following financial support for the research, authorship, and/or publication of this article: This study was supported by grants from the Shanghai Science and Technology Innovation Plan 2022 for the Artificial Intelligence Science and Technology Support Special Project (No. 22511106002).
Supplemental Material
Supplemental material for this article is available online.
References
Supplementary Material
Please find the following supplemental material available below.
For Open Access articles published under a Creative Commons License, all supplemental material carries the same license as the article it is associated with.
For non-Open Access articles published, all supplemental material carries a non-exclusive license, and permission requests for re-use of supplemental material or any part of supplemental material shall be sent directly to the copyright owner as specified in the copyright notice associated with the article.