
Abstract
Objective
To estimate prevalence and incidence rates over time in children and youth with attention deficit/hyperactivity disorder from the validation of population-based administrative data algorithms using family physicians’ electronic medical records as a reference standard.
Methods
A retrospective cohort study was conducted in Ontario, Canada to identify attention deficit/hyperactivity disorder among children and youth aged 1–24 years in health administrative data derived from case-finding algorithms using family physicians’ electronic medical records. Multiple administrative data algorithms identifying attention deficit/hyperactivity disorder cases were developed and tested from physician-diagnosis of attention deficit/hyperactivity disorder in the electronic medical record to determine their diagnostic accuracy. We calculated algorithm performance using sensitivity, specificity, and predictive values. The most optimal algorithm was used to estimate prevalence and incidence rates of attention deficit/hyperactivity disorder from 2014 to 2021 in Ontario.
Results
The optimal performing algorithm was “2 physician visits for attention deficit/hyperactivity disorder in 1 year or 1 attention deficit/hyperactivity disorder-specific prescription” with sensitivity: 83.2% (95% confidence interval [CI], 81.8% to 84.5%), specificity: 98.6% (95% CI, 98.5% to 98.7%), positive predictive value: 78.6% (95% CI, 77.1% to 80.0%) and negative predictive value: 98.9% (95% CI, 98.8% to 99.0%). From 2014, prevalence rates for attention deficit/hyperactivity disorder increased from 5.29 to 7.48 per 100 population in 2021 (N = 281,785). Males had higher prevalence rates (7.49 to 9.59 per 100 population, 1.3-fold increase) than females (2.96–5.26 per 100 population, 1.8-fold increase) from 2014 to 2021. Incidence rates increased from 2014 (0.53 per 100 population) until 2018, decreased in 2020 then rose steeply in 2021 (0.89 per 100 population, N = 34,013). Males also had higher incidence rates than females from 2014 to 2020 with females surpassing males in 2021 (0.70–0.81 per 100 male population,1.2-fold increase versus 0.36–0.97 per 100 female population, 2.7-fold increase).
Conclusions
Attention deficit/hyperactivity disorder is increasing in prevalence. We developed an administrative data algorithm that can reliably identify children and youth with attention deficit/hyperactivity disorder with good diagnostic accuracy.
Introduction
Attention deficit/hyperactivity disorder (ADHD) is a childhood-onset neurodevelopmental disorder. It is one of the most common childhood psychiatric conditions in Canada.1,2 ADHD is characterized by developmentally inappropriate symptoms of inattention, hyperactivity and/or impulsivity. This chronic disorder is more common in males than females in childhood3,4 but tends to even out by adulthood. 5 Over 90% of children diagnosed with ADHD will continue to struggle with varying ADHD symptoms and impairments as they age into adulthood. 6 About 40%–80% of children and 80% of adults experience at least one comorbid psychiatric disorder such as anxiety, mood disorders and substance use disorders.7–10 Those diagnosed with ADHD also have a higher risk of school failure, antisocial behaviour, accidental injuries, and premature death including attempted and completed suicide. 11
Given the significant impairments of ADHD on academic, social, occupational, and mental functions, it is imperative to conduct surveillance of the prevalence and incidence trends of ADHD over time for planning healthcare services and resource allocation. An effective method of conducting ADHD surveillance at a population level is to create administrative data algorithms that identify individuals diagnosed with ADHD from routinely collected health administrative data such as physician billing claims, dispensed medications, hospital admissions, and emergency department visits. Given that administrative data algorithms are prone to misclassification,12,13 it is necessary to measure the diagnostic accuracy of these algorithms for ADHD, i.e., the validity, by reporting the sensitivity, specificity, positive predictive value (PPV) and negative predictive value (NPV), before implementing such an algorithm for surveillance purposes. Yet, studies on prevalence and incidence trends for ADHD in Canada have largely used administrative data algorithms that have not been adequately validated so it is unclear how accurate these algorithms are at detecting cases of ADHD.14,15
A systematic review published in 2022 assessing the validity of administrative database algorithms to detect ADHD cases concluded that methodologically higher quality studies are essential and needed to fully understand the potential of using administrative data to identify ADHD. 14 Few published Canadian studies have attempted to identify children and youth with ADHD using case-finding algorithms and such studies have been limited by their under-reporting of validation measures.14–16 The aim of this study was to conduct a comprehensive validation study of administrative data algorithms to detect ADHD in children and youth aged 1–24 years with their full diagnostic test characteristics, and then assess the implementation of the top-performing algorithms for prevalence and incidence rates from 2014 to 2021 in Ontario, Canada.
Methods
A validation study was conducted to identify ADHD cases using an algorithm of Ontario health administrative data tested against a reference standard of children and youth aged 1–24 years having ADHD and without ADHD identified from their family physicians’ electronic medical records (EMRs). This study cohort was linked to health administrative data to test and validate multiple data algorithms consisting of different combinations of physician billing claims, hospitalization diagnoses, emergency department visits, same day surgery visits, specialist consultation, and/or prescription data. The optimal case-finding algorithm for ADHD was determined by evaluating its overall test performance/accuracy and then used to estimate annual prevalence and incidence rates of ADHD in children and youth aged 1–24 years in Ontario from 2014 to 2021. This methodology follows recommendations on the reporting and study design of administrative data validation studies,12,13 and the modified Standards for Reporting Diagnostic Accuracy (STARD) criteria. 17
The Electronic Medical Record Administrative data Linked Database (EMRALD) contains all clinically relevant EMR data extracted from family physicians across Ontario. 18 Patients in EMRALD have similar demographics and disease burden when compared to the general population in Ontario. 19 Using family physicians’ EMRs as a reference standard for the development of administrative data algorithms has been widely published for several chronic conditions.20–24 The reference standard for this ADHD validation study was created using a population-based random cohort of 10,000 children and youth aged 1–24 years of age within EMRALD and these details are published elsewhere. 25 We developed and validated an EMR algorithm to identify children and youth with ADHD using primary care data. This algorithm consisted of “2 billing codes for ADHD in 1 year or a prescription for an ADHD-specific medication or specific text terms to identify ADHD in the Cumulative Patient Profile”. The algorithm performance had an 81.2% (95% confidence interval [CI], 77.6% to 84.4%) sensitivity, 99.5% (95% CI, 99.4% to 99.7%) specificity, 90.6% (95% CI, 87.7% to 93.1%) PPV, and 98.9% (95% CI, 98.7% to 99.1%) NPV. Given that the reference standard for ADHD was originally created in 2012, 25 we used this validated EMR algorithm to identify ADHD cases and non-cases in 2016 which represented the latest date that data were available.
We used several different Ontario health administrative data sources from January 1, 2014 to December 31, 2021 at ICES, which are described in eTable 1 of the online Supplementary file. These datasets were linked using unique, encoded identifiers. 26 We used the Ontario Health Insurance Plan Claims database to identify physician billing diagnosis codes. Hospital data prior to 2002 have diagnoses coded in ICD-9 and hospitalizations and emergency department encounters after 2002 are coded using ICD-10-CA (eTable 2).
Descriptive statistics were used to characterize the study population. Sensitivity, specificity, PPV, and NPV with their 95% CIs, prevalence, kappa statistic, and Youden's index were calculated for each algorithm to determine the accuracy of the case-finding algorithm for ADHD. The optimal administrative data algorithm for ADHD was selected based on high sensitivity (to capture all cases), maximal PPV (to reduce false positives) and maximal specificity to create a more homogeneous sample. 13 For each selected algorithm, annual age- and sex-standardized prevalence and incidence rates were estimated from 2014 to 2021. To adjust for differences in population distribution over time, age- and sex-standardization rates were generated using the 2011 Ontario census population estimates provided by Statistics Canada. All analyses were done on de-identified data at ICES using the binomial approximation with SAS version 9.2 (SAS Institute, Cary, North Carolina, USA).
To evaluate whether the COVID-19 pandemic had a significant impact on primary care services for ADHD, we used data from the years before the pandemic (2014–2019) to predict the expected prevalence and incidence rates in 2020 and 2021 during the pandemic. We used linear regression to estimate the expected rate of annual prevalence and incidence with linear parameterization of the calendar year from 2014 to 2021. We hypothesized that the prevalence and incidence of ADHD may differ by biological sex, and we performed subgroup analyses using linear regression by stratifying for biological sex. The expected annual prevalence and incidence rates are reported with 95% CIs and two-sided Z-test assuming normal distribution. This statistical analysis was performed using SAS software version 9.4. This study was approved by the Research Ethics Board at the University of Toronto.
Results
We had 49,031 children and youth aged 1–24 years in EMRALD. There were 2,904 ADHD cases and 46,127 non-cases (eTable 3), corresponding to an overall prevalence of 5.92% (pre-test prevalence) in 2016. The mean age of ADHD cases was 16.2 ± 5.0 years versus 11.9 ± 7.3 years for non-cases, consistent with previously published results on the development of the reference standard. 25
We examined a large variety of administrative data algorithms to detect ADHD in children and youth aged 1–24 years (available upon request). We selected several algorithms to demonstrate the effect of different combinations of data sources and bolded the top five performing administrative data algorithms by selecting high sensitivity, specificity, PPV, kappa statistic, and Youden index (Table 1). The use of “1 hospitalization diagnosis code ever” for ADHD had the lowest sensitivity (3.7%) of all the algorithms in Table 1. Having an ADHD-specific prescription (eTable 4) generally improved the sensitivities of the case-finding algorithms. Three algorithms that combined 2 physician visits in 1 or 2 years or 1 ADHD-specific prescription, all had similar diagnostic indices (sensitivities 83.2%–84.1%; PPVs 78.2%–78.6%) (Table 1).
Accuracy of Administrative Data Algorithms to Identity Children and Youth Aged 1–24 Years with ADHD.
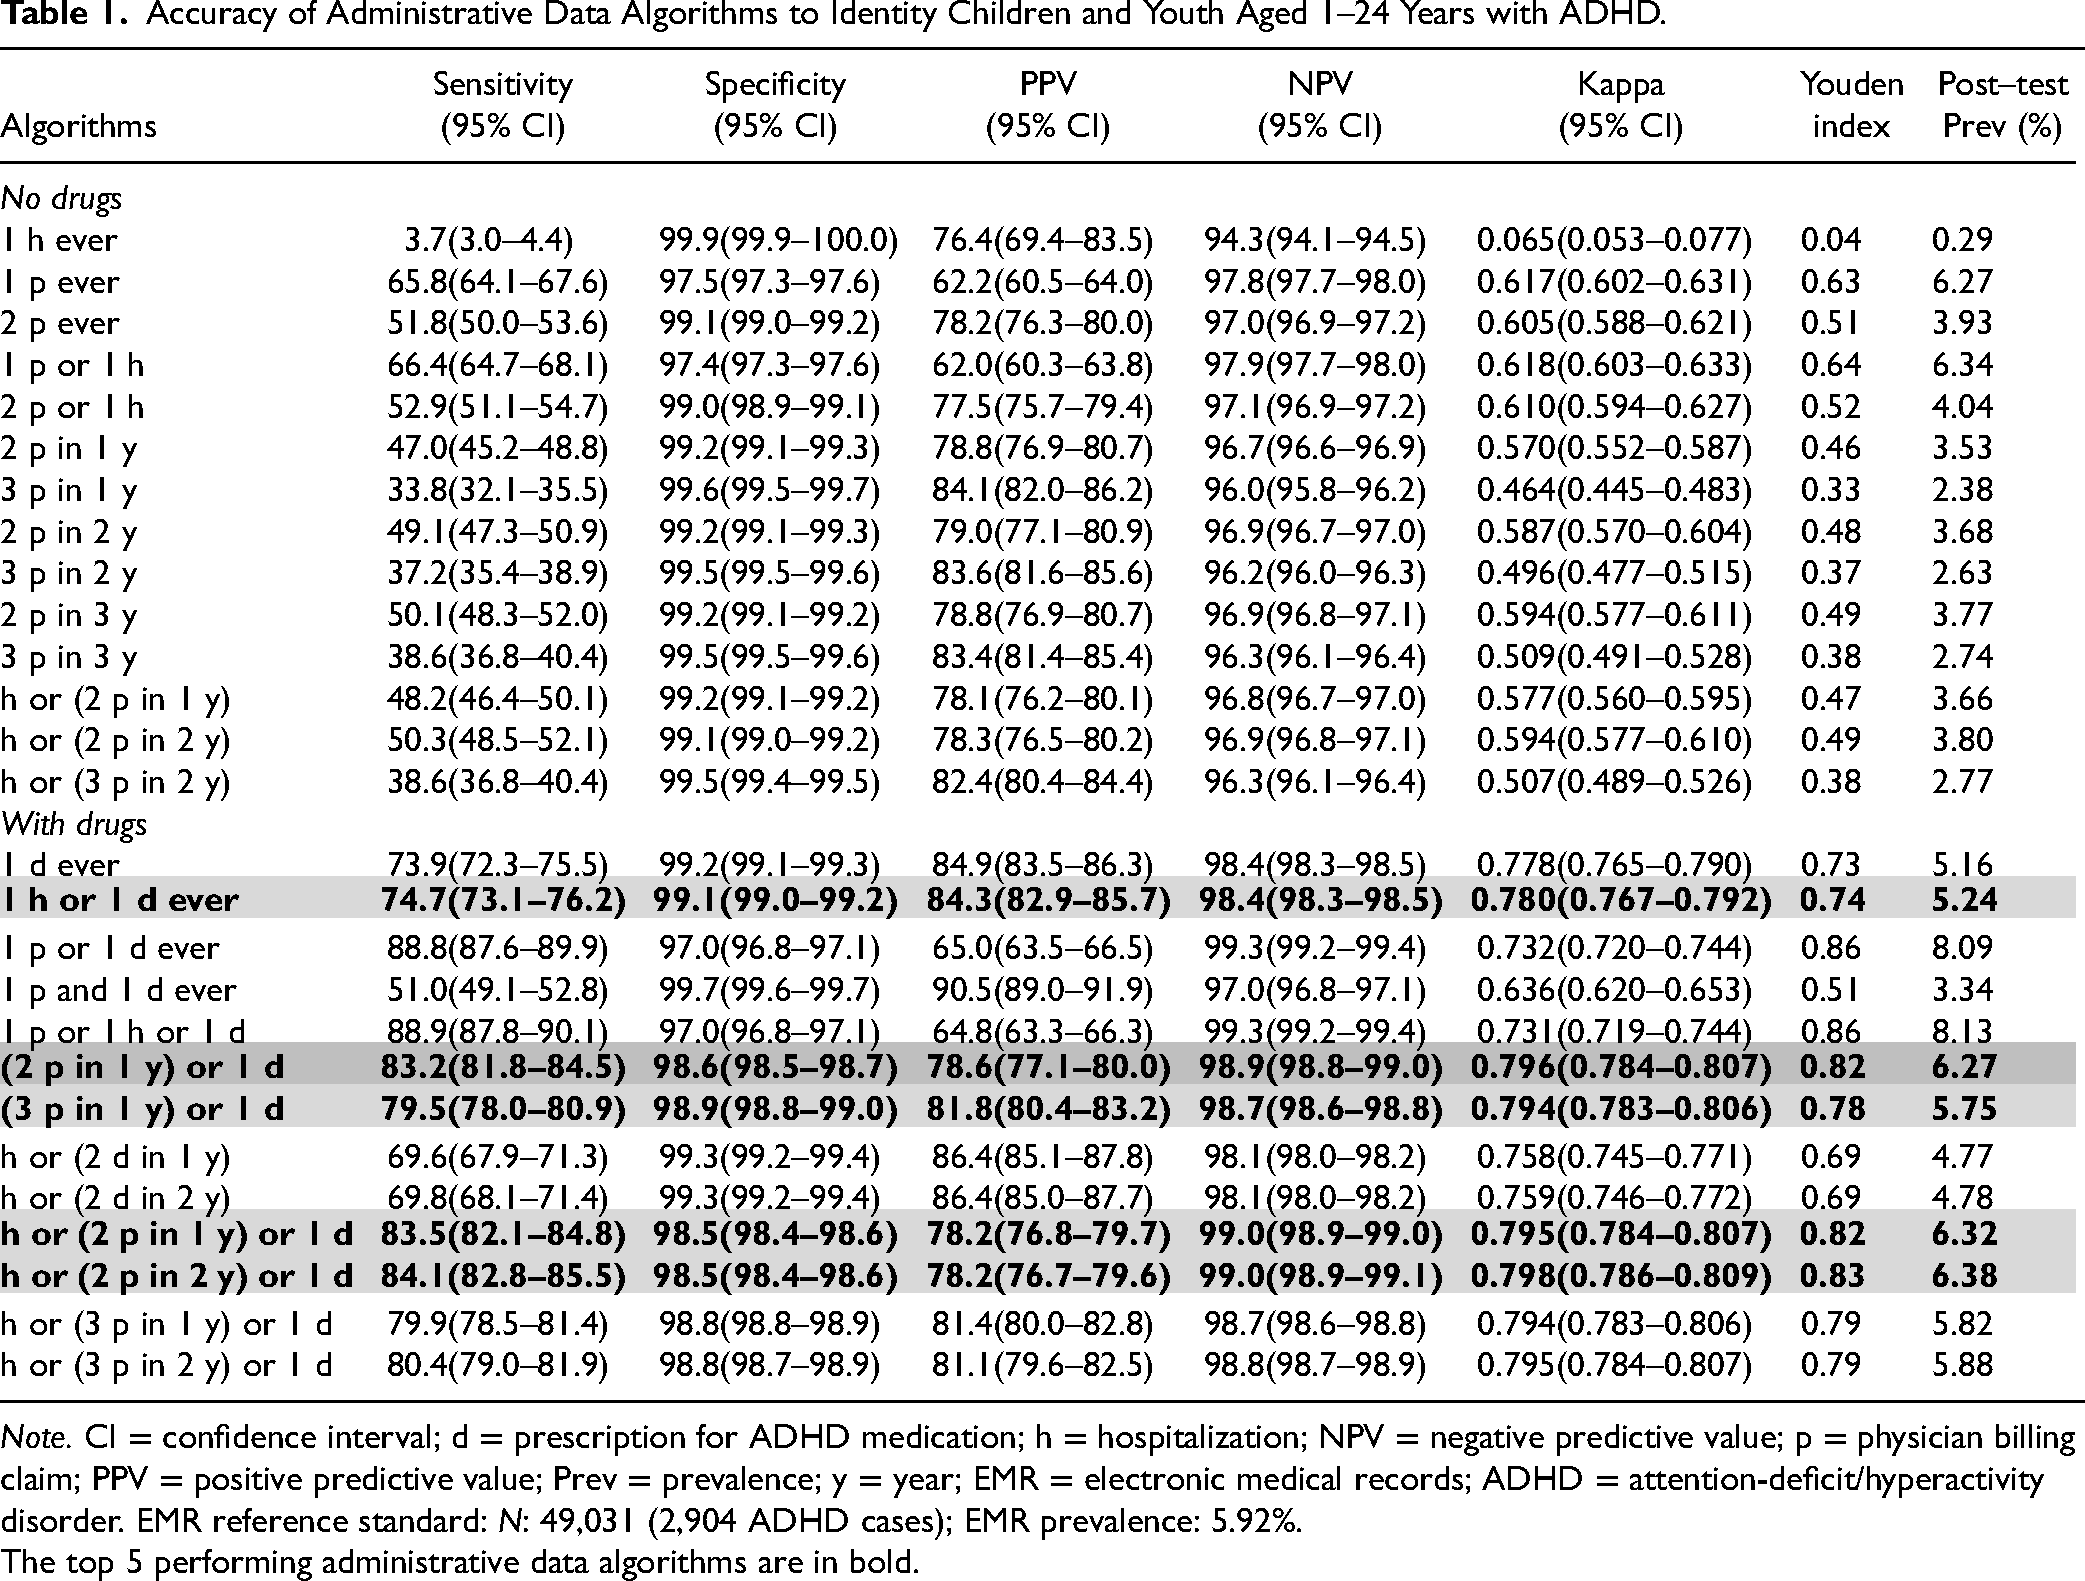
Note. CI = confidence interval; d = prescription for ADHD medication; h = hospitalization; NPV = negative predictive value; p = physician billing claim; PPV = positive predictive value; Prev = prevalence; y = year; EMR = electronic medical records; ADHD = attention-deficit/hyperactivity disorder. EMR reference standard: N: 49,031 (2,904 ADHD cases); EMR prevalence: 5.92%.
The top 5 performing administrative data algorithms are in bold.
Using the top five performing administrative data algorithms for ADHD in children and youth aged 1–24 years, population-level estimates of prevalence and incidence were determined in Ontario from 2014 to 2021. In Figure 1, the age- and sex-standardized prevalence rates for ADHD using the top five algorithms increased over time. The three administrative data algorithms of “2 physician visits for ADHD in 1 year or 1 ADHD-specific prescription,” “1 hospitalization or 2 physicians visits for ADHD in 1 year or 1 ADHD-specific prescription,” and “1 hospitalization or 2 physicians visits for ADHD in 2 years or 1 ADHD-specific prescription” all followed the same prevalence trends with similar overlap of data points (Figure 1; eTable 5a). The post-test prevalence rate for ADHD which is the disease prevalence ascertained from the health administrative data varied from 6.27% to 6.32% using these three algorithms (Table 1) and closely approximates the pre-test prevalence in EMRALD at 5.92%. From 2014 to 2021, the age- and sex-standardized incidence rates of ADHD in children and youth gradually increased until 2018 then decreased in 2020 but increased the most in 2021 (Figure 2; eTable 5b). All top five performing ADHD algorithms produced overlapping incidence trends with almost identical incidence rates from 2014 to 2021 (Figure 2; eTable 5b).
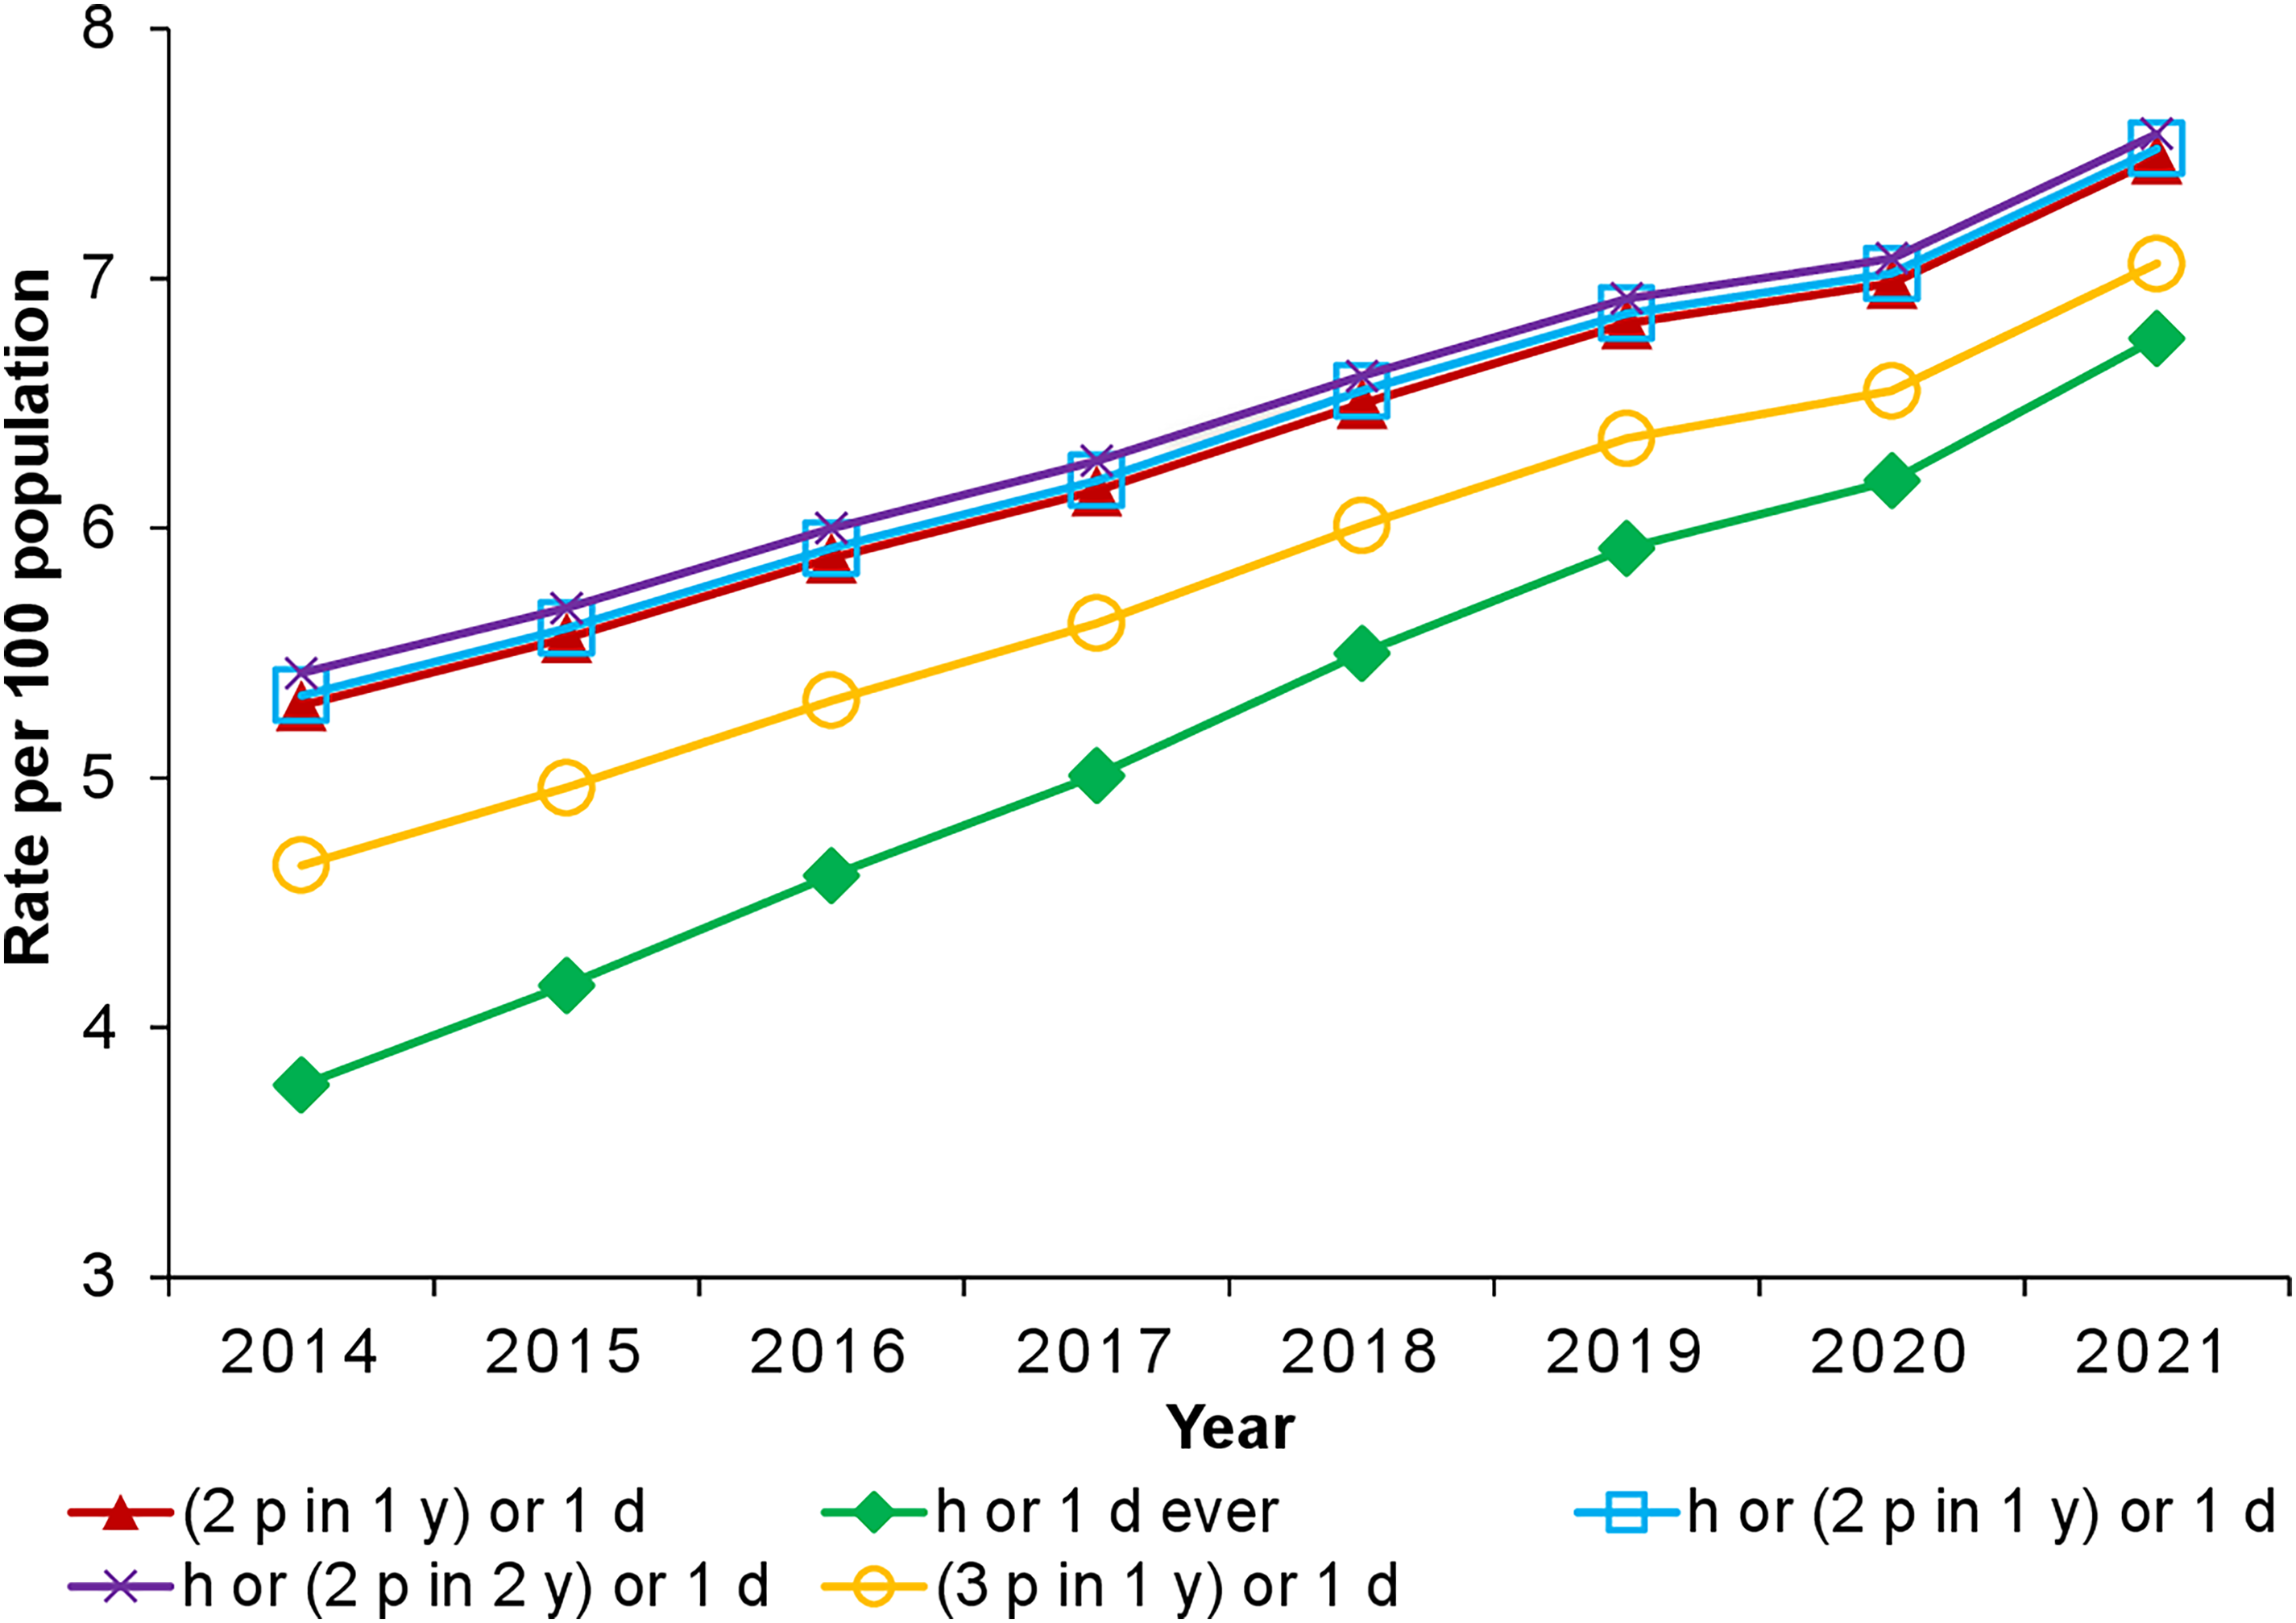
Age- and sex-standardized prevalence trends of ADHD per 100 population from 2014 to 2021 among children and youth aged 1–24 years in Ontario for the top 5 performing administrative data algorithms. Note. ADHD = attention-deficit/hyperactivity disorder; d = prescription for ADHD medication; h = hospitalization; p = physician billing claim; y = year.
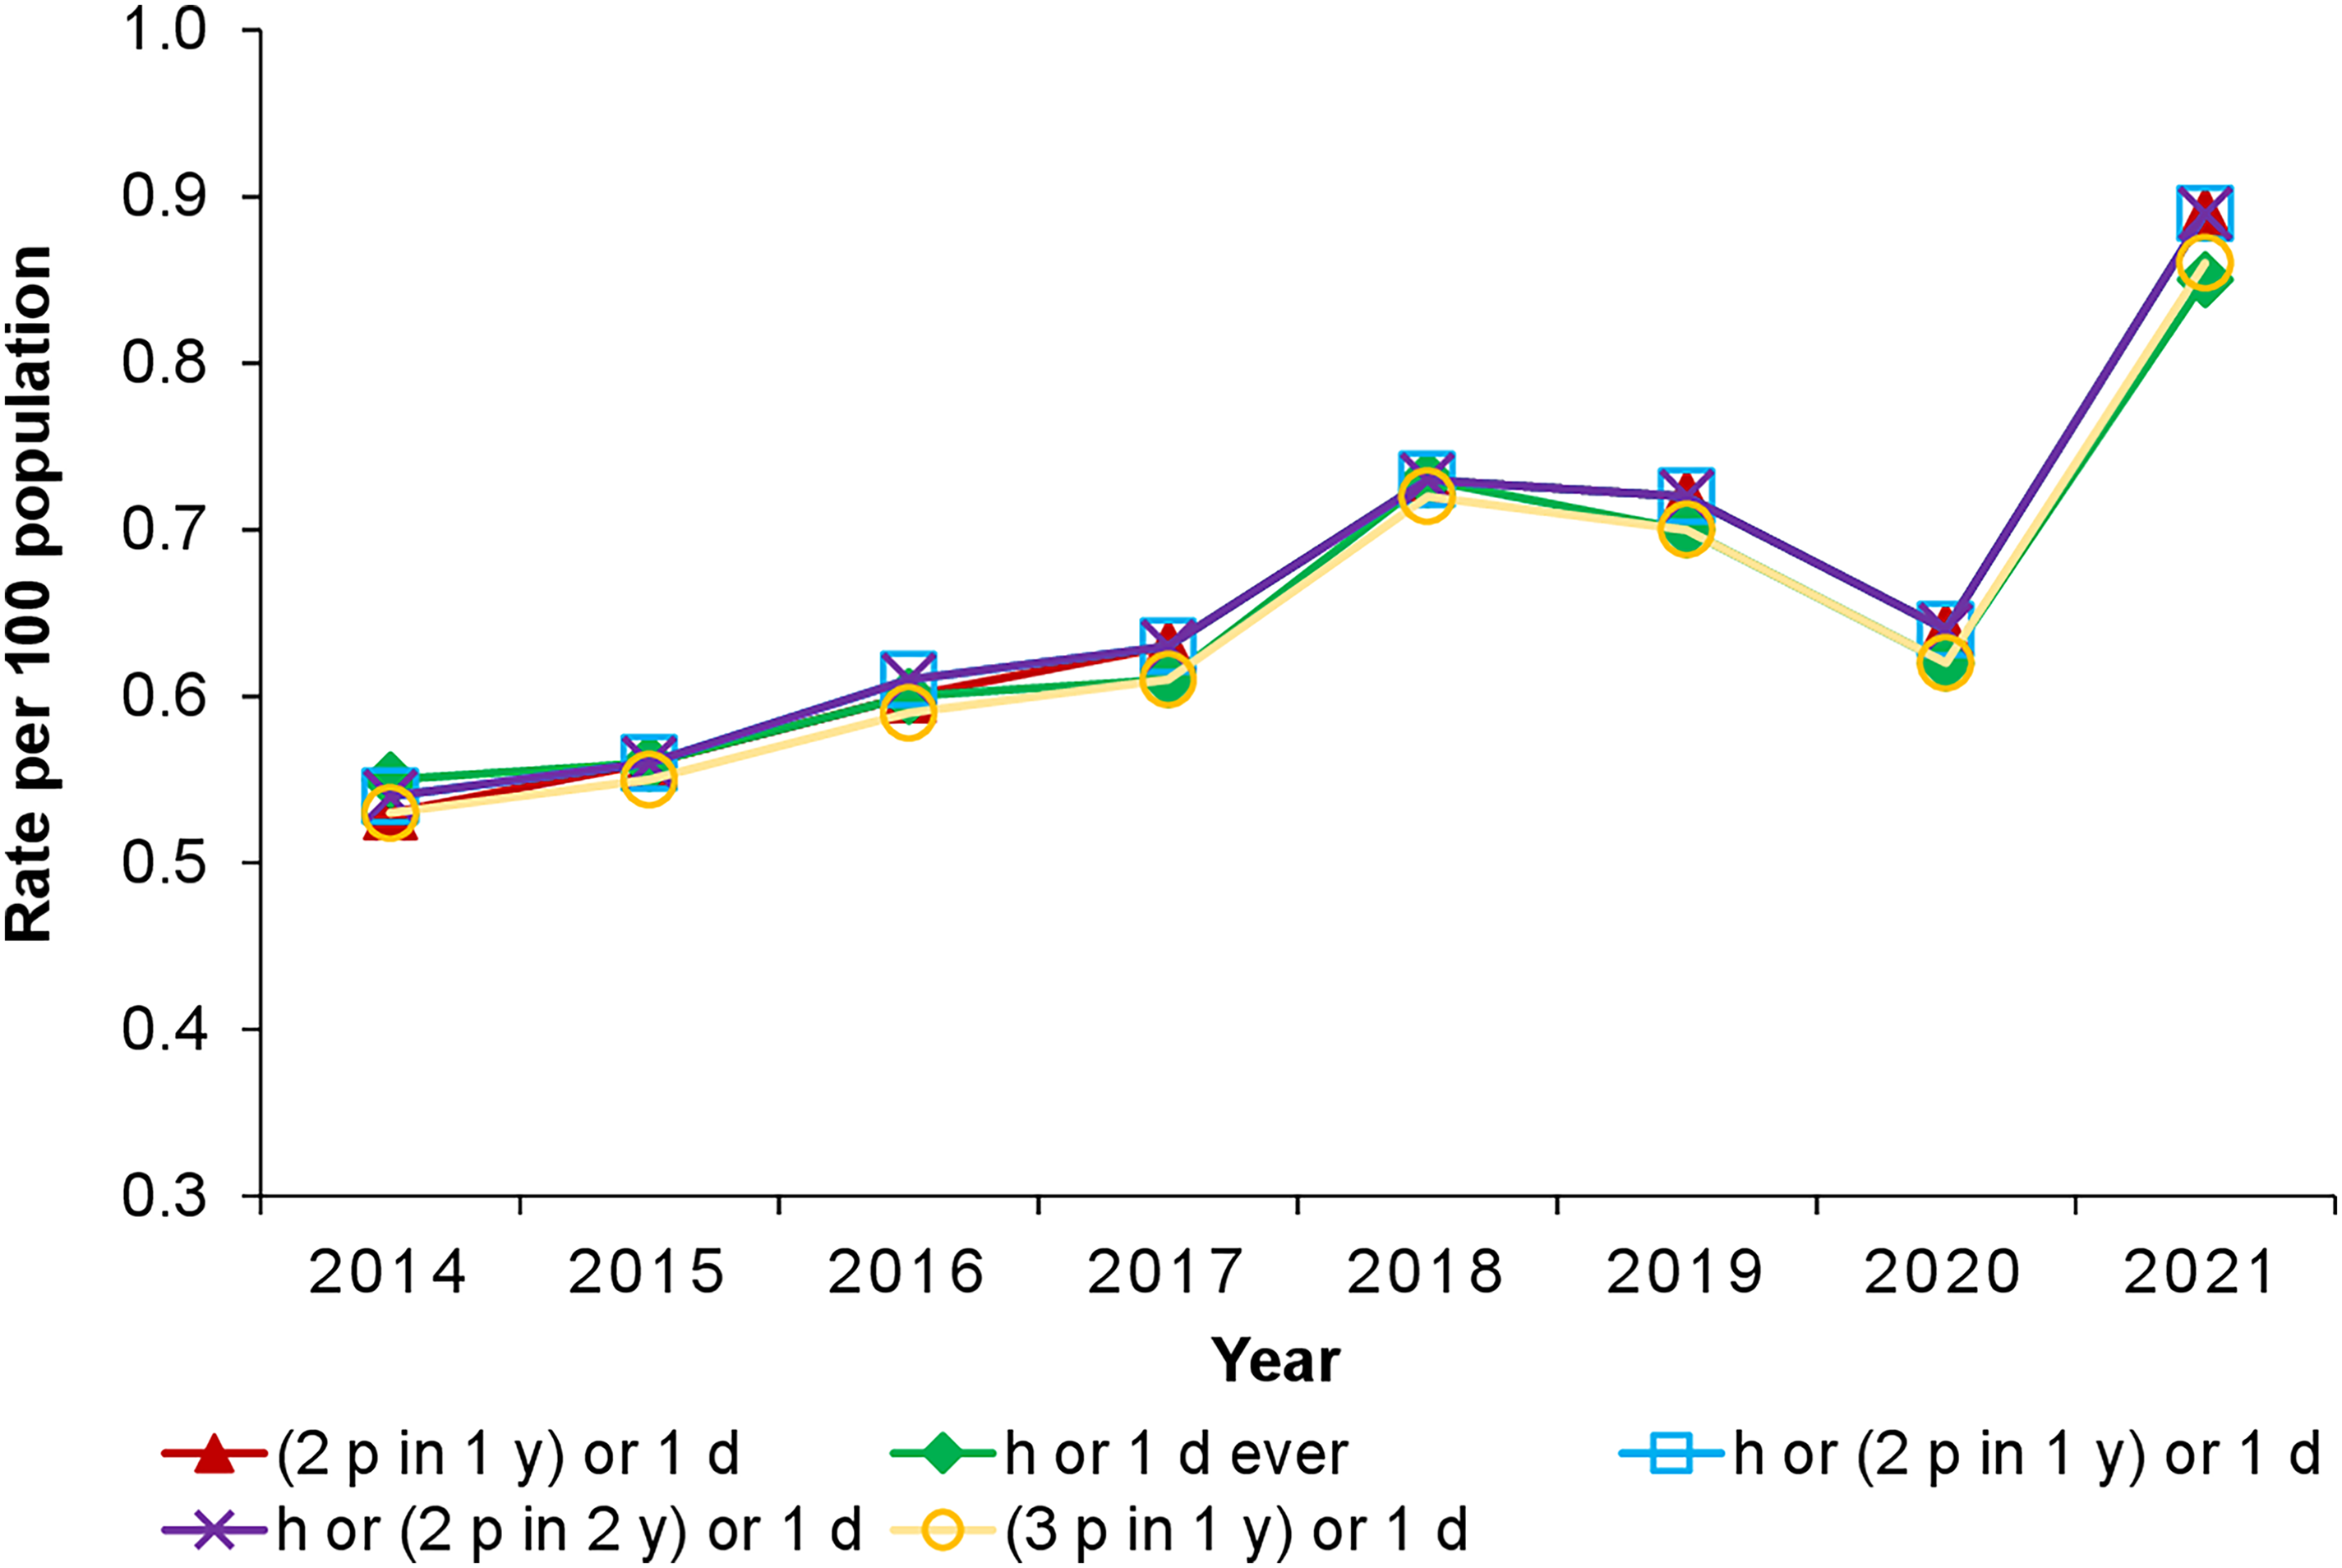
Age- and sex-standardized incidence trends of ADHD per 100 population from 2014 to 2021 among children and youth aged 1-24 years in Ontario for the top 5 performing administrative data algorithms. Note. ADHD = attention-deficit/hyperactivity disorder; d = prescription for ADHD medication; h = hospitalization; p = physician billing claim; y = year.
The optimal administrative data algorithm for ADHD is “2 physician visits for ADHD or 1 ADHD-specific prescription” with a relatively high degree of accuracy (Table 1). Figure 3 provides the annual age- and sex-standardized prevalence trends for males and females in Ontario using the optimal algorithm. The annual sex- and age-standardized prevalence rates for all children and youth with ADHD increased 1.4-fold from 5.29 per 100 population in 2014 (N = 202,740) to 7.48 per 100 population in 2021 (N = 288,248) (Figure 3; eTable 6a). The age-standardized prevalence rates for males were higher than females with a 1.3-fold increase from 7.49 per 100 population in 2014 to 9.59 per 100 population in 2021 (Figure 3; eTable 6a). However, there was a 1.8-fold increase in prevalence rates for females from 2.96 per 100 population in 2014 to 5.26 per 100 population in 2021 (Figure 3; eTable 6a). There was an increase in age- and sex-standardized incidence rates from 0.53 per 100 population in 2014 (N = 20,312 new cases) to 2018 at 0.73 per 100 population then decreased in 2020 to 0.64 per 100 population with an overall 1.7-fold increase in 2021 at 0.89 per 100 population (N = 34,297 new cases) (Figure 4; eTable 6b). Males had higher incidence rates compared to females from 2014 until 2020 and then females surpassed males in 2021 (Figure 4; eTable 6b). From 2014 to 2021, males had a 1.2-fold increase in age-standardized incidence rates from 0.70 per 100 population to 0.81 per 100 population whereas females had a 2.7-fold increase in incidence rates from 0.36 per 100 population to 0.97 per 100 population (Figure 4; eTable 6b).
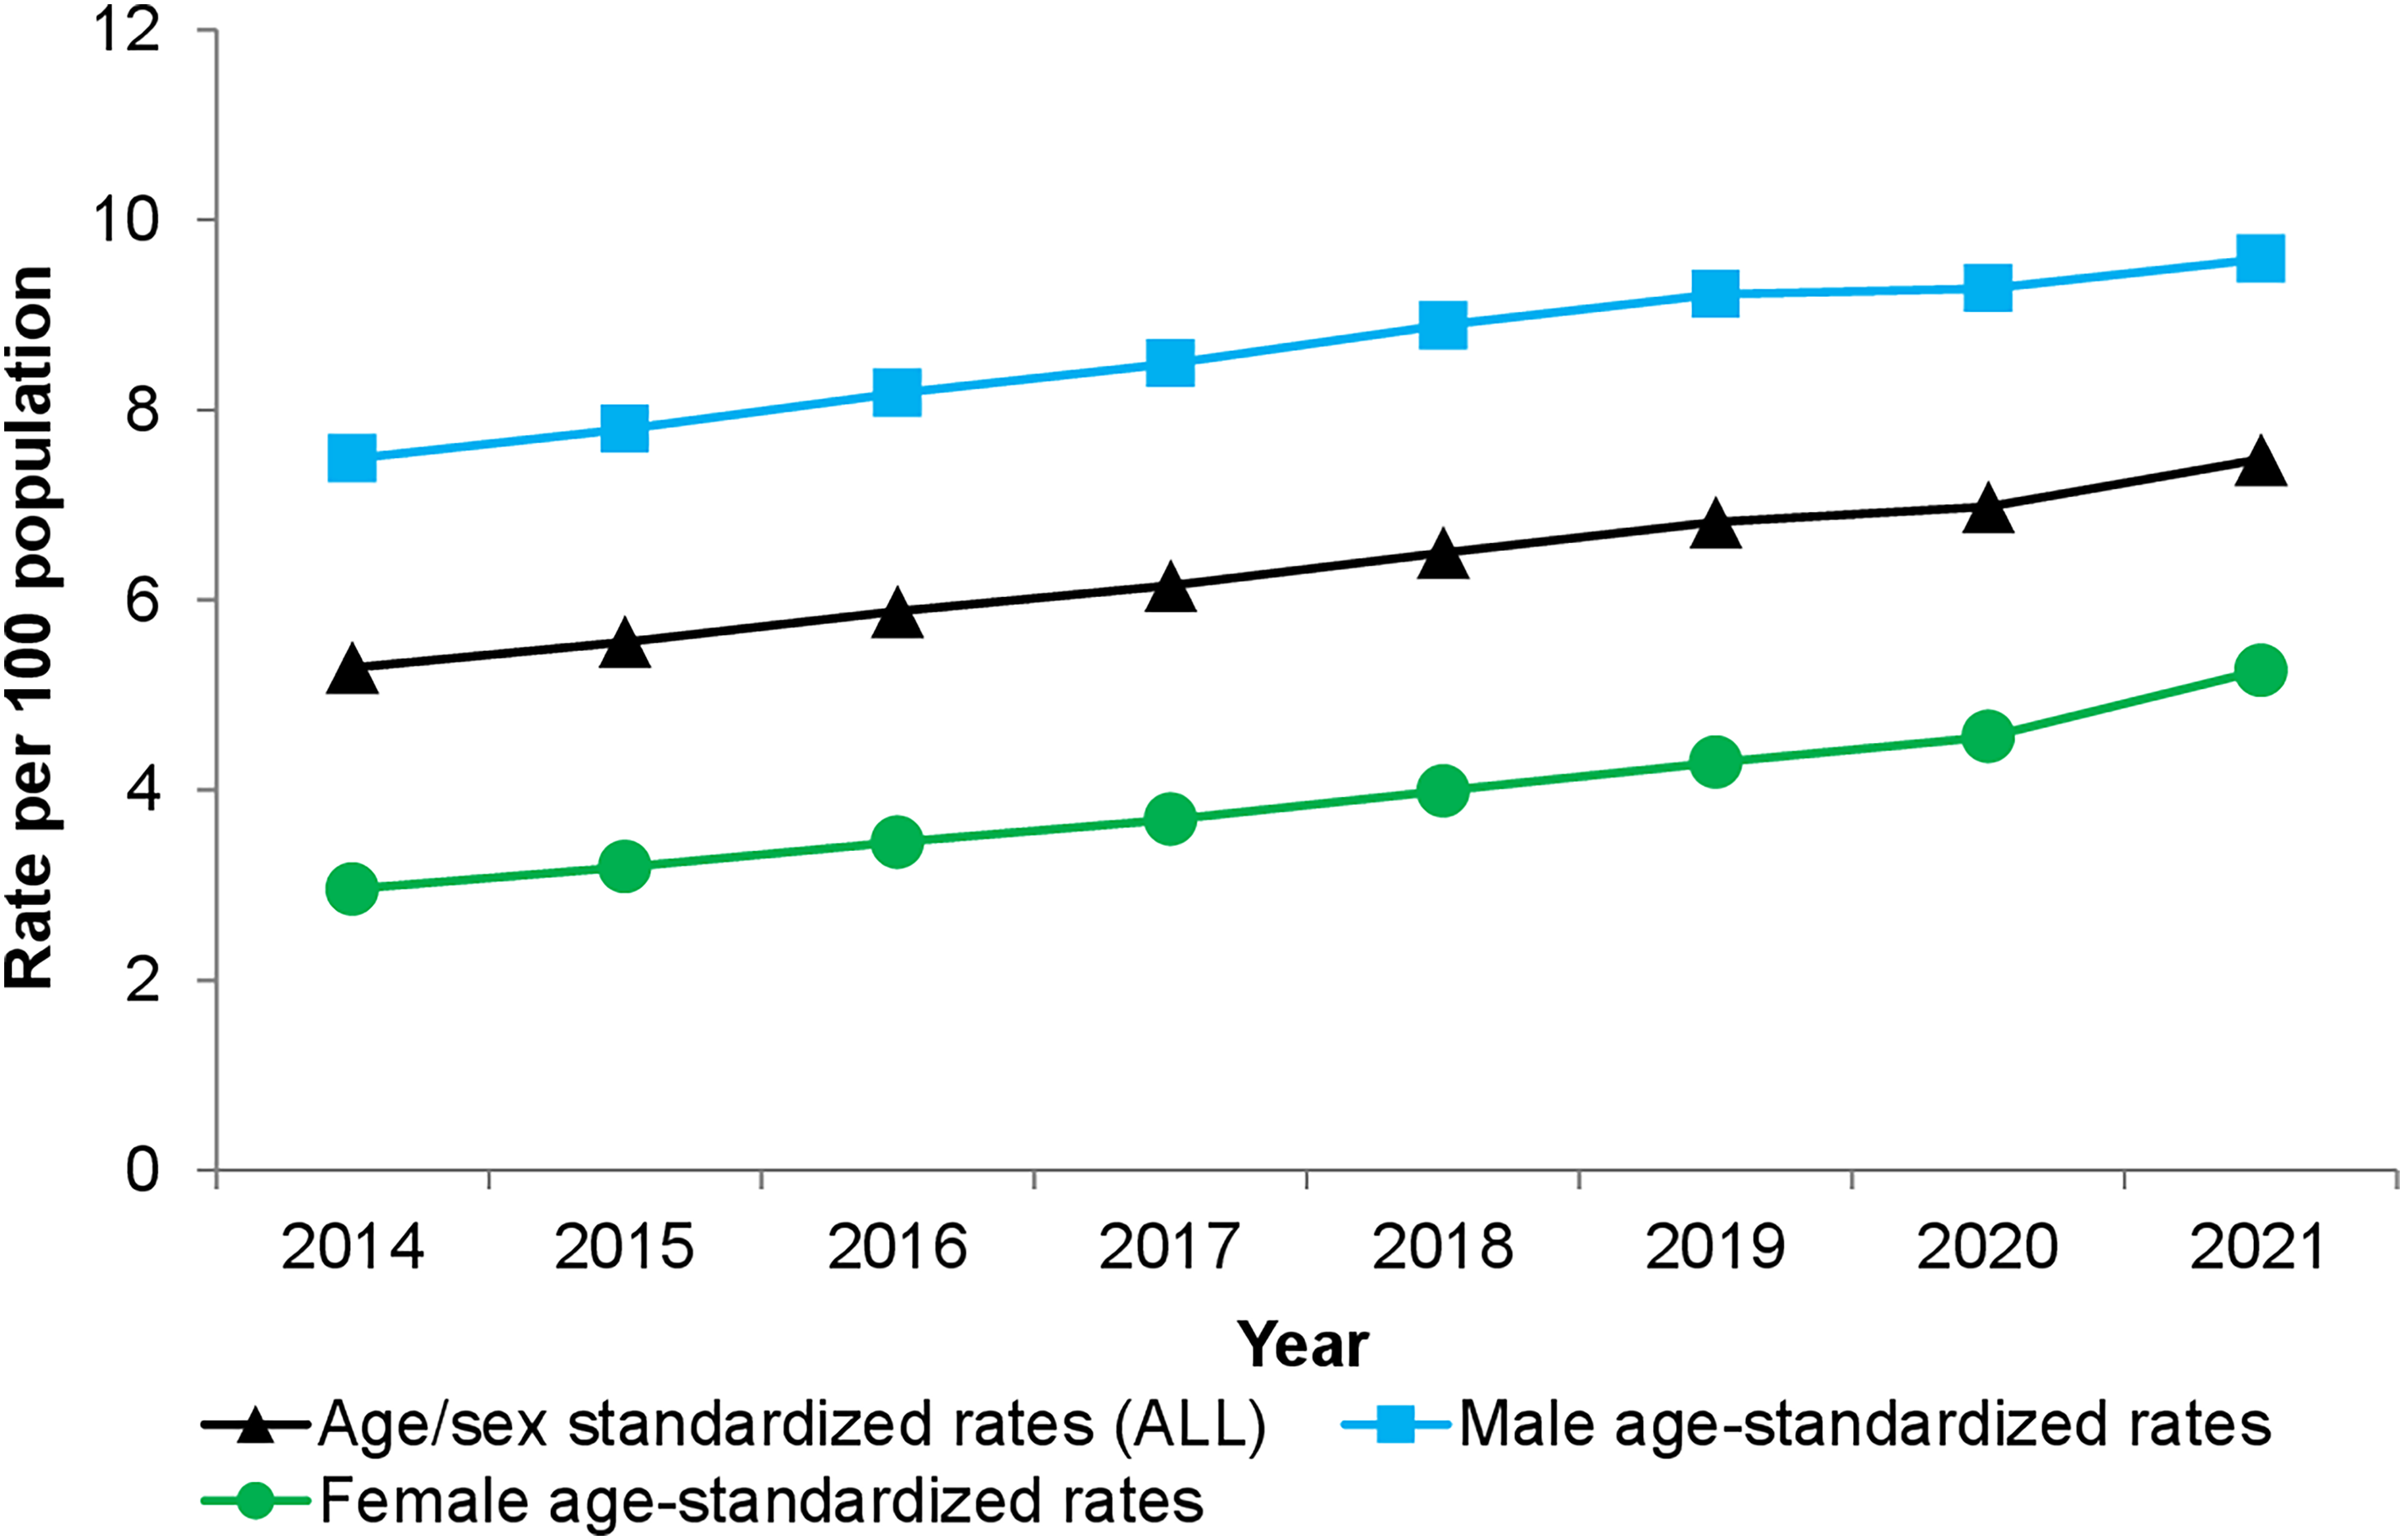
Annual age- and sex-standardized prevalence rates for attention-deficit/hyperactivity disorder (ADHD) per 100 population among children and youth aged 1–24 years in Ontario stratified by sex using the optimal administrative data algorithm.
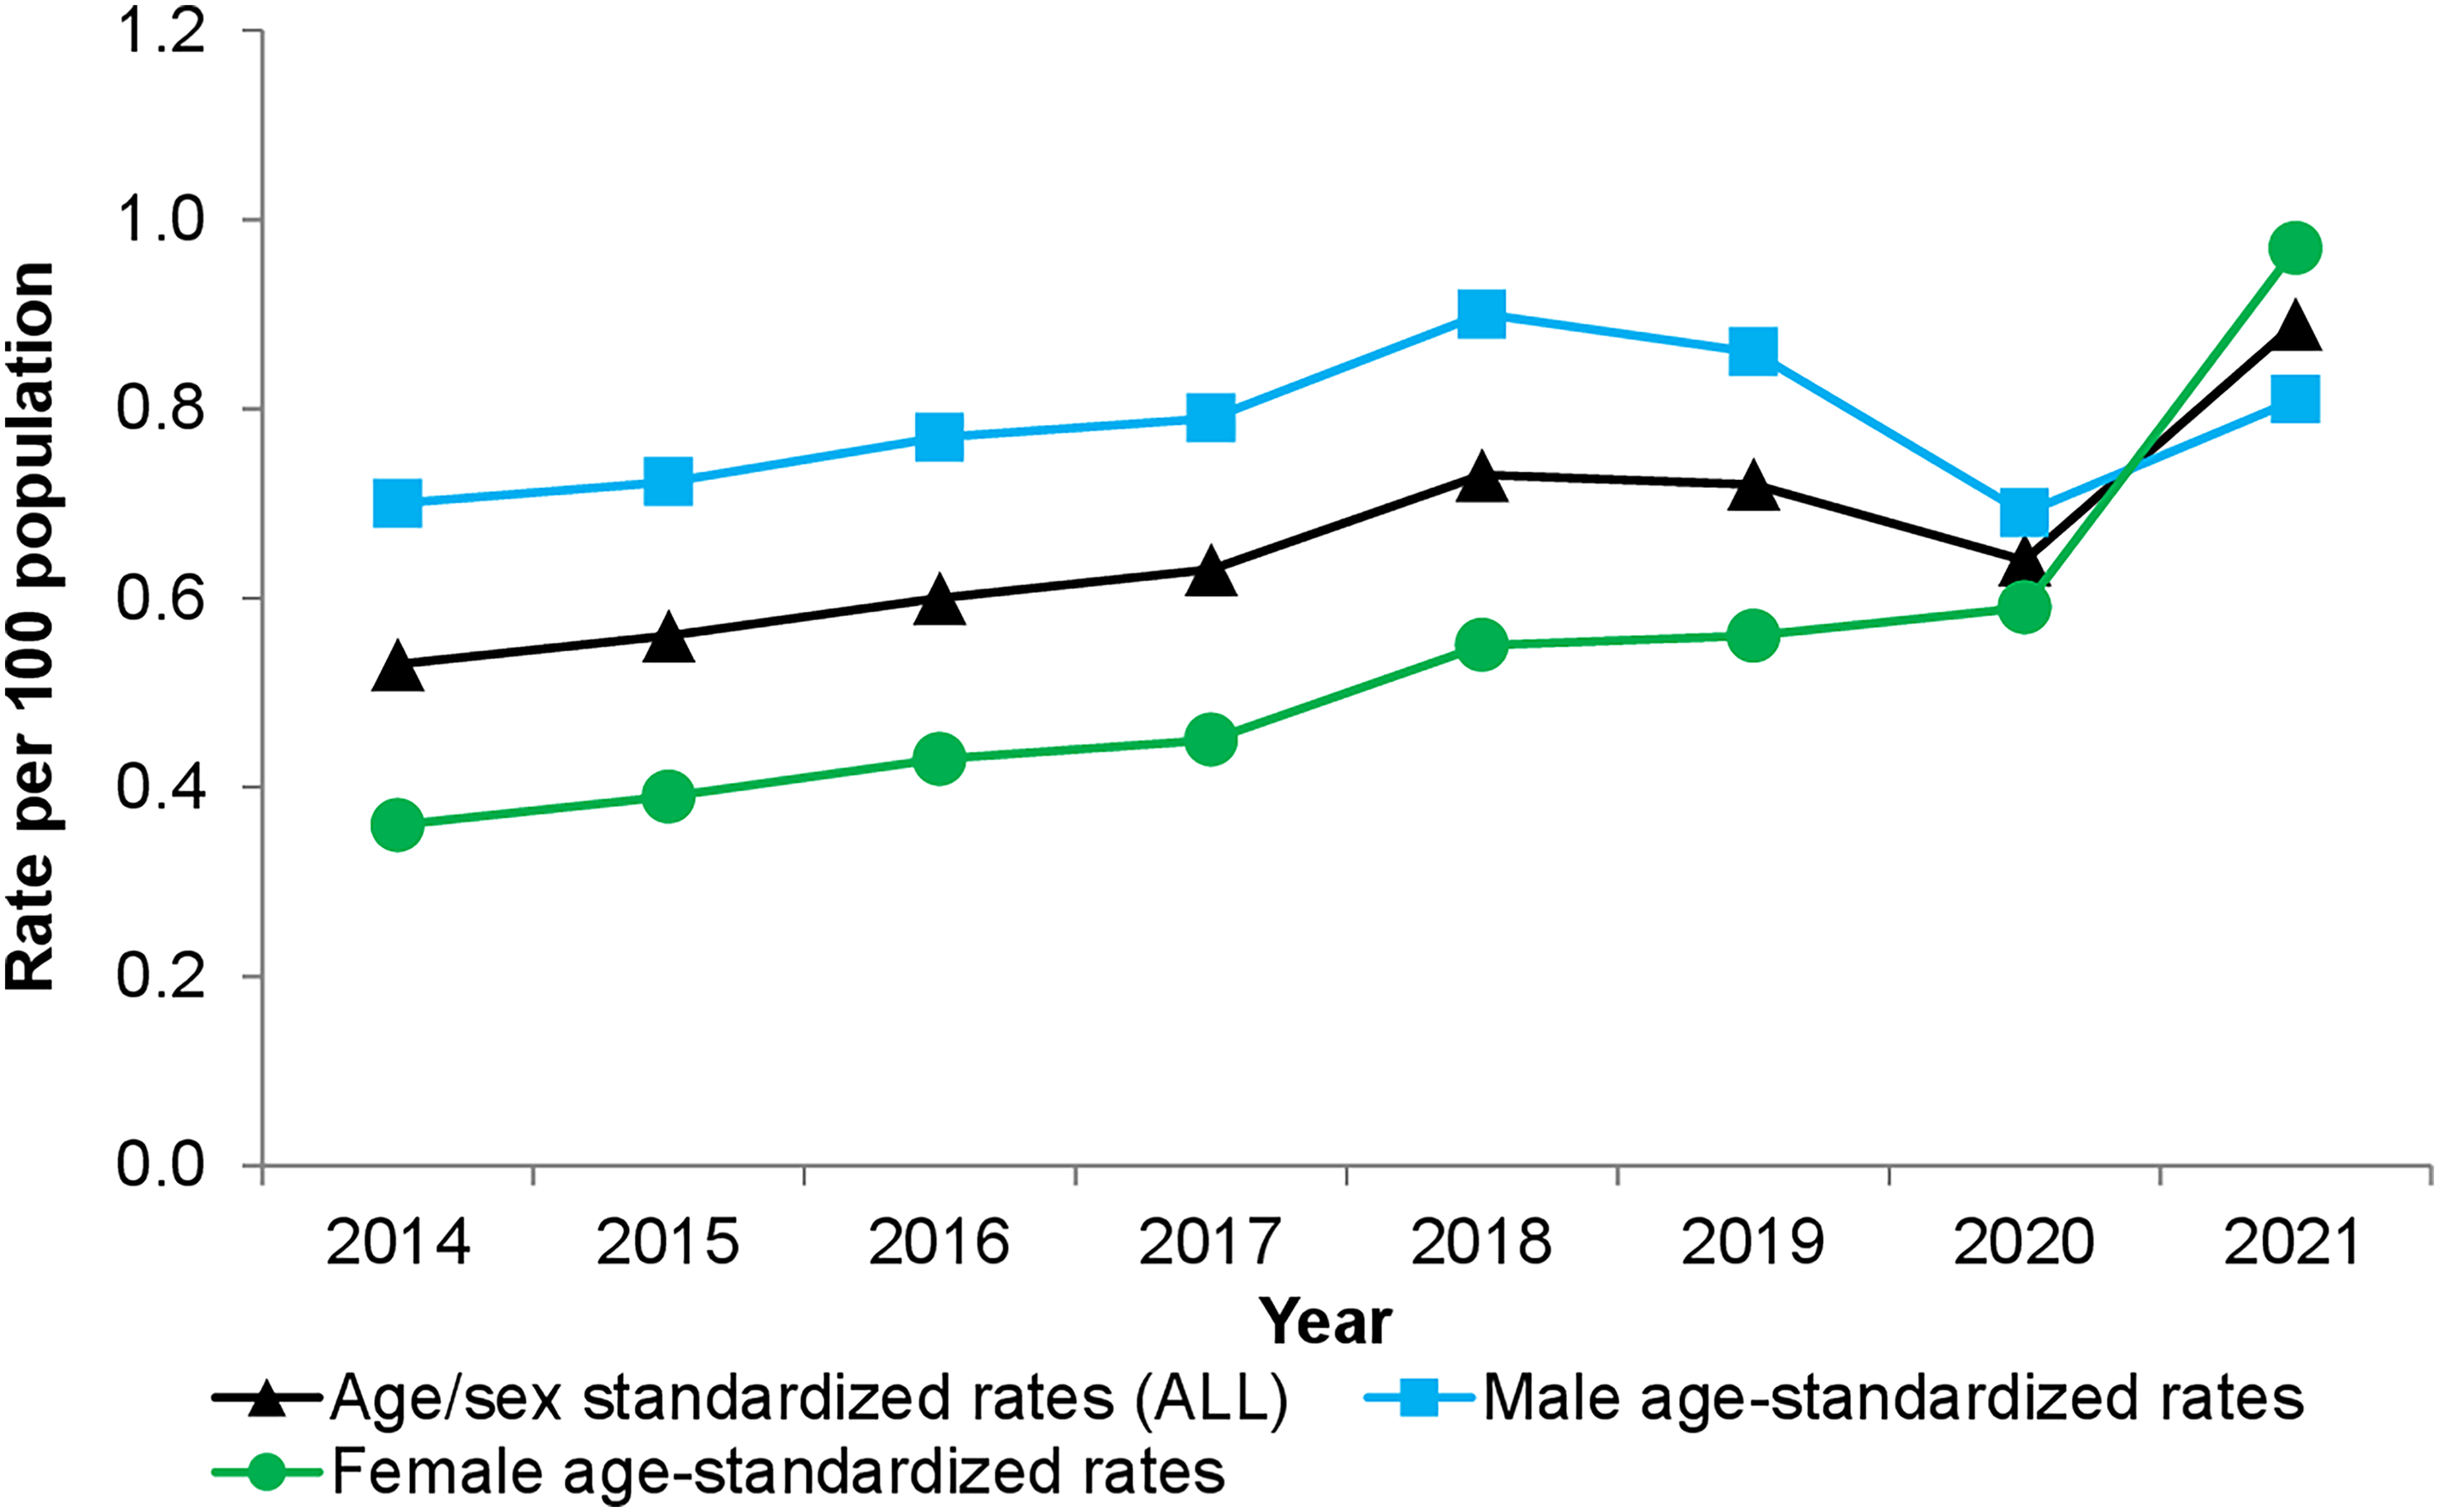
Annual age- and sex-standardized incidence rates for attention-deficit/hyperactivity disorder (ADHD) per 100 population among children and youth aged 1–24 years in Ontario stratified by sex using the optimal administrative data algorithm.
Given the impact of the COVID-19 pandemic on the years 2020 and 2021, we used the observed data from the pre-pandemic years 2014–2019 to predict the expected prevalence and incidence rates for ADHD in children and youth in 2020 and 2021. We found that the observed prevalence rate for ADHD in children and youth in Ontario, Canada was lower than the expected prevalence rate in 2020 and this was mainly driven by the lower than expected prevalence rate in males in 2020 which persisted in 2021. Whereas in contrast, the observed prevalence rate in females was higher than expected in 2021 (eFigure 1; eTable 7). Similarly, the observed incidence rates compared to the expected rates overall and by sex, followed the same patterns as the prevalence rates (eFigure 1; eTable 7).
Discussion
This is the first comprehensive validation study using administrative data algorithms for ADHD in children and youth performed prior to determining prevalence and incidence rates in Ontario, Canada. Using the optimal administrative data algorithm for ADHD, we found that annual age- and sex-standardized prevalence rates in children and youth aged 1–24 years are increasing from 2014 to 2021 with a cumulative prevalence rate of 7.48%. Although males have higher prevalence rates compared to females, females have demonstrated a 1.8-fold rise in prevalence rates from 2014 to 2021 which is greater than the change observed in males. This finding of increasing prevalence trends for ADHD in Canada is consistent with other studies.15,16,27–31 In a retrospective cohort study conducted in Ontario, Canada, using the EMRs of family physicians affiliated with the University of Toronto Practice-Based Research Network from 2017 to 2021, the prevalence rates of patient visits related to ADHD increased 2.3-fold in 2021. 27 Also, males had higher annual rates of ADHD-related visits and ADHD medications compared to females. 27
Previous Canadian studies have used different case-finding algorithms for ADHD to estimate prevalence rates in children and youth, but few have provided full measures of algorithm performance.14,15 An algorithm of “at least 1 visit with ICD-9 code 314 for ADHD and at least 1 ADHD-specific prescription or at least 2 visits with ICD-9 code 314” had a PPV of 95.9% and an NPV of 96.3% that could be measured directly. 16 Due to the non-random selection of patients in the reference standard, sensitivity had to be derived statistically and was found to be 19.9%. 16 This algorithm was then applied to a practice-based research network including data from Alberta, Manitoba, Ontario, Quebec, and Newfoundland and the prevalence estimates for ADHD in those aged 4–17 years were 6.92% to 8.57% from 2008 to 2015 with no reporting of incidence rates. 16 Although the prevalence estimates were much higher than our study findings (5.56 per 100 population in 2015), there were limitations with its validation method. 16
Three Canadian studies have all used the case finding algorithm for ADHD of “at least 1 physician visit or hospitalization for ADHD” using the ICD-9 code 314 or equivalent ICD-10 code (F90.x) for prevalence estimates in children and youth without performing a validation study or providing any measurements on the diagnostic accuracy of the algorithm.28–30 In our study, we found administrative data algorithms for ADHD without a drug component did not perform as well as those with a drug component and tended to have lower sensitivities compared to the algorithms that incorporated an ADHD-specific prescription. We also found that the algorithm “1 physician visit or hospitalization for ADHD” has a sensitivity of 66% and PPV of 62% with suboptimal measures for kappa statistic (0.618) and Youden index (0.64) and that having more physician visits for ADHD or hospitalization decreased the sensitivity of the algorithm to 52.9%. From a clinical perspective, individuals diagnosed with ADHD are unlikely to be hospitalized with ADHD as the most responsible reason for hospitalization or the admitting or discharge diagnosis. Also, individuals with ADHD usually require more than 1 clinical outpatient encounter to properly diagnose the condition, and if started on an ADHD-specific medication, regular follow-up is needed to monitor treatment so algorithms with “1 physician visit for ADHD” would lead to high false positives.
A different case-finding algorithm for ADHD involving health administrative data from British Columbia used “at least 1 physician visit or hospitalization with ICD-9 code 314 or equivalent ICD-10 code or 1 ADHD-specific prescription” in children and youth from birth to 19 years, without determining its diagnostic accuracy. 32 The overall prevalence rates from 1996 to 2016 were estimated for different age groups as 1.27% for 3–5 years, 9.20% for 6–12 years and 7.04% for 13–19 years. 32 In our study, using an algorithm of “1 physician visit or hospitalization for ADHD or 1 ADHD-specific prescription” provides a sensitivity of 88.9% and PPV of 64.8% with a high post-test prevalence of 8.13% indicating that such an algorithm if applied to health administrative data in Ontario would generate an overestimation of prevalence rates beyond those generated by our optimal algorithm.
Outside of Canada, there are also few studies on the validation of administrative data algorithms to accurately identify ADHD among children and youth where the majority of these studies consistently underreport key diagnostic measures of algorithm performance.12–14,33–37 In a validation study conducted in the United States among pediatric patients with ADHD from hospital records, the clinical case definition used for ADHD involved no drug component and was “at least 1 visit or hospitalization with ICD-9 code 314 or problem list diagnosis” with sensitivity 96%–97%, specificity 98%–99%, PPV 83%–98% and NPV 99%. 33 This study assumed that all inconclusive cases of ADHD (n = 300) were “true” diagnoses of ADHD and given the high prevalence of ADHD in the reference standard (pre-test prevalence 13%), the authors questioned the generalizability of their study findings. 33 Furthermore, an electronic health record rule-based algorithm with natural language processing text mining of a pediatric hospital-based healthcare network in the United States found that ICD codes for ADHD and ADHD-specific medications provided the most ADHD cases with a PPV of 95% with no other diagnostic indices reported. 34 In this study, we report on relatively good performance measures for our optimal algorithm to ensure the accurate determination of prevalence and incidence estimates for ADHD over time.
Also, our study is the first Canadian study to report incidence rates for ADHD in children and youth in Ontario from 2014 to 2021 using a validated administrative data algorithm. Our optimal algorithm provided an increase in age- and sex-standardized incidence rates from 2014 to 2018 and then decreased in 2020 with a steeper increase in 2021. A state of emergency was declared in Ontario, Canada on March 17, 2020, due to the COVID-19 pandemic to stop the spread and transmission of this virus. The decrease in the incidence rate observed in 2020 was likely due to the impact of the COVID-19 pandemic on primary care services for ADHD. The pandemic resulted in all schools and educational institutions being closed for 20 weeks; there were cancellations of public events and public gatherings; workplaces were closed; and there were bans on international travel in Ontario.38,39 These restrictions and lockdowns imposed by the COVID-19 pandemic brought about a switch to virtual learning, and social isolation among children and youth in Ontario.38–41 Given the significant disruption to the daily routines of children and youth during the pandemic and the drastic reduction in in-person contact in all settings, evidence supports not only the deterioration of mental health symptoms in those diagnosed with ADHD, and in those with undiagnosed and untreated ADHD. 40 Our study found that both observed prevalence and incidence rates for ADHD in children and youth in Ontario, Canada, were significantly lower than expected rates in 2020, where males with ADHD had lower observed prevalence and incidence rates in 2020 and 2021 compared to expected, and females with ADHD had significantly higher observed prevalence and incidence rates compared to expected in 2021. In 2021, there were more new cases of females with ADHD among children and youth aged 1–24 years (0.97 per 100 population) compared to males (0.81 per 100 population) and females had a 2.7-fold higher increase in incidence rates from 2014 to 2021. This demonstrates a major shift in sex-related diagnosis rates for ADHD. Historically, there have been concerns that females with ADHD are understudied 42 and overlooked in both clinical and research settings. 43 Using data from family physicians’ EMRs in Ontario, we found a 32% overall relative increase in total number of visits for ADHD in those 5–55 years in 2021 compared to expected, and this significantly higher visit rate occurred in females 5–9 years and those 20–24 years. 27 Similarly, according to the Centers for Disease Control and Prevention in the United States, there has been a rising trend in ADHD stimulant prescription refills in the last 5 years with a substantial increase observed particularly in females 15–44 years from 2020 to 2021.44,45 It is not clear if the observed prevalence and incidence trends in males and females during the COVID-19 pandemic (2020–2021) will continue and future research is needed to determine whether these differential sex-related prevalence and incidence rates of ADHD diagnoses persist.
This study has some limitations. We identified ADHD cases based physician diagnosis in their primary care medical records which included diagnoses from all specialists, and children and youth who have not received any primary care and/or received ADHD care only through uninsured services may not have been captured. Also, there is a potential risk of misclassification of ADHD if there is a lack of documentation in the patient medical record due to missing specialist consultations, and physicians may miss a diagnosis of ADHD or mistake the signs and symptoms for another mental health condition. Therefore, our results may under-represent the true prevalence and incidence rates of ADHD in children and youth aged 1–24 years of age in Ontario using administrative data due to unrecognized and untreated ADHD in the community.46,47 Our optimal algorithm for ADHD used a drug component and this may limit its use in other settings where information on the dispensing of ADHD-specific prescriptions is lacking, although several provinces do report ADHD-specific medications in their prescription monitoring systems.
Conclusion
We have a good quality administrative data algorithm for ADHD in children and youth derived from routinely collected health administrative data. This algorithm can be used by epidemiologists in other provinces and across Canada, as well as health services researchers to make ADHD surveillance a mental health priority given its rising prevalence and incidence rates.
Data Access
Data used to generate Figures 1–4 are provided online in the eTables 4–5 of the Supplemental file. The dataset from this study is held securely in coded form at ICES. While legal data sharing agreements between ICES and data providers (e.g., healthcare organizations and government) prohibit ICES from making the dataset publicly available, access may be granted to those who meet pre-specified criteria for confidential access, available at www.ices.on.ca/DAS (email: das@ices.on.ca). The full dataset creation plan and underlying analytic code are available from the authors upon request, understanding that the computer programs may rely upon coding templates or macros that are unique to ICES and are therefore either inaccessible or may require modification.
Supplemental Material
sj-docx-1-cpa-10.1177_07067437231213553 - Supplemental material for Prevalence and Incidence Trends of Attention Deficit/Hyperactivity Disorder in Children and Youth Aged 1–24 Years in Ontario, Canada: A Validation Study of Health Administrative Data Algorithms: Tendances de la prévalence et de l’incidence du trouble de déficit de l’attention/hyperactivité chez les enfants et les jeunes âgés de 1 à 24 ans, en Ontario, Canada: une étude de validation des algorithmes de données administratives de santé
Supplemental material, sj-docx-1-cpa-10.1177_07067437231213553 for Prevalence and Incidence Trends of Attention Deficit/Hyperactivity Disorder in Children and Youth Aged 1–24 Years in Ontario, Canada: A Validation Study of Health Administrative Data Algorithms: Tendances de la prévalence et de l’incidence du trouble de déficit de l’attention/hyperactivité chez les enfants et les jeunes âgés de 1 à 24 ans, en Ontario, Canada: une étude de validation des algorithmes de données administratives de santé by Debra A. Butt, Liisa Jaakkimainen and Karen Tu in The Canadian Journal of Psychiatry
Footnotes
Acknowledgements
The authors thank Mr Sumeet Kalia for his assistance with the statistical analysis and he granted us permission to do so. The analyses, conclusions, opinions, and statements expressed herein are solely those of the authors and do not reflect those of the funding or data sources; no endorsement is intended or should be inferred.
Declaration of Conflicting Interests
The authors declared no potential conflicts of interest with respect to the research, authorship, and/or publication of this article.
Funding
The authors disclosed receipt of the following financial support for the research, authorship, and/or publication of this article. This study was supported by ICES, which is funded by an annual grant from the Ontario Ministry of Health (MOH) and the Ministry of Long-Term Care (MLTC). DAB, LJ and KT received Research Investigator Awards from the Department of Family and Community Medicine and DAB and KT received funding from the Rathlyn Foundation Primary Care EMR Research and Discovery Fund at the University of Toronto. This document used data adapted from the Statistics Canada Postal CodeOM Conversion File, which is based on data licensed from Canada Post Corporation, and/or data adapted from the MOH Postal Code Conversion File, which contains data copied under license from ©Canada Post Corporation and Statistics Canada. Parts of this material are based on data and/or information compiled and provided by the MOH, the Canadian Institute for Health Information (CIHI), and IQVIA Solutions Canada Inc. We thank IQVIA Solutions Canada Inc. for use of their Drug Information File. This research was supported by grants from the Canadian ADHD Resource Alliance (CADDRA fund number 512754) and the Centre for ADHD Awareness Canada (CADDAC fund number 512753).
Ethical Approval
This study was approved by the Research Ethics Board at the University of Toronto.
Supplemental Material
Supplementary material for this article is available online.
References
Supplementary Material
Please find the following supplemental material available below.
For Open Access articles published under a Creative Commons License, all supplemental material carries the same license as the article it is associated with.
For non-Open Access articles published, all supplemental material carries a non-exclusive license, and permission requests for re-use of supplemental material or any part of supplemental material shall be sent directly to the copyright owner as specified in the copyright notice associated with the article.