
Abstract
Introduction:
Telepsychiatry can improve access to psychiatric services for those who otherwise cannot easily access care. Family physicians are gatekeepers to specialized care in Ontario, so it is essential to understand predictors relating to referrals to telepsychiatry to better plan services and increase telepsychiatry adoption.
Methods:
This study used an annual retrospective cross-sectional study design to compare physicians who referred their patients to telepsychiatry each year from fiscal year (FY) 2008 to FY 2016. A 1-year (FY 2016) comparison of family physicians who referred to telepsychiatry (FPTs) compared to family physicians who did not refer to telepsychiatry (FPNTs) matched (1:2) by region was also conducted. Finally, we used statistical modeling to understand the predictors of referring to telepsychiatry among physicians.
Results:
Between FY 2008 and FY 2016, the number of patients receiving telepsychiatry increased from 925 visits to 13,825 visits. Thirty-two percent of Ontario primary care physicians referred to telepsychiatry in 2016. Several characteristics were notably different between FPTs and FPNTs: FPTs were more likely to be from a residence with less than 10,000 people, to have more nurse practitioners in the practice, and to be from a family health team than FPNTs. Rostered patients of FPTs were more likely to reside in rural areas, have more clinical complexity, and to utilize more mental health services compared to FPNTs.
Conclusions:
There has been an increase in the use of telepsychiatry by patients and family physicians over the study period, although there remains opportunity for significant growth. Family physicians who live in rural areas, are part of an FHT, have more NPs, with more rural and complex patients were more likely to refer to telepsychiatry. As recent pro-telemedicine policies support the growth of telepsychiatry, this study will serve as an important baseline.
Introduction
Mental illness is among the world’s leading causes of sickness and disability; 1 in 5 Canadians (2 million Ontarians) and 1 in 4 people internationally will experience mental illness or addiction. 1 –3 However, only one third of Ontario patients reported having their mental health needs met or partially met within primary care. 1 Patients from lower income countries and socially disadvantaged groups had lower rates of mental health service utilization. 4 –6 Access to quality mental health services is often limited due to rurality, physician shortages, and variation in the availability of mental health services. 1,5,7 –10
Telepsychiatry, the delivery of psychiatry via secure videoconferencing, can reduce access barriers such as distance, cost of travel, weather, and workforce shortages. 11 –17 In particular, telepsychiatry can provide access to patients who otherwise are not able to easily access services, potentially reducing unnecessary hospitalizations and ED visits. 18,19 Several studies have deemed telepsychiatry effective for various mental health conditions and populations. 20 –24 Telemedicine has been shown to reduce isolation and increase the morale of rural primary care practitioners. 25,26 While there is significant potential for telepsychiatry to connect patients to psychiatrists throughout Ontario, recent evidence has shown minimal adoption by patients. 27 In Ontario during the time of this study, in order to deliver and bill for telepsychiatry, psychiatrists were typically required to use a centralized government-funded telemedicine platform, and patients were typically required to access their telepsychiatry visit at a patient host site (a clinical site that connects to the centralized provincial network). It is important to note that at the time this article was submitted, temporary policy changes to virtual care as a result of COVID-19 (introduced March 2020) have created more options for home-based care for patients and have allowed physicians to deliver virtual care via a variety of virtual platforms. These recent changes will be discussed in relation to study findings in the discussion section.
Family physicians are the gatekeepers to specialist care in Canada and other parts of the world. 28,29 Common reasons for family physician referral to psychiatry include obtaining medication recommendations, obtaining second opinions, or nonpharmacological treatment recommendations. 30 Evidence shows providers who are more isolated had more positive feelings about telemedicine. 25 Positive perceptions of telemedicine included convenience, perceived patient benefits, reduced wait time, cost-effectiveness, and access to medical expertise, while negative aspects included cost, reduced funding for in-person services, inconvenience, inadequate reimbursement and training, medical liability, and physician fear of practice change. 25,31 –34 Previous studies suggest nurses may be more enthusiastic about telemedicine than physicians, referring physicians tend to be more satisfied than specialists, satisfaction increases relative to use and time, and that providers do not recommend telemedicine in all circumstances. 29,35,36 The objective of this study was to examine the characteristics of family physicians in Ontario who have referred patients to telepsychiatry (FPTs) compared to family physicians who have not referred to telepsychiatry (FPNTs) from fiscal year (FY) 2008 to FY 2016, in order to understand whether there are specific factors that make certain family physicians more likely to refer than others.
Methods
Setting and Study Design
We conducted an annual retrospective cross-sectional study assessing descriptive characteristics of FPTs for FYs (2008 to 2016). This time horizon was used because it includes data from the Ontario Health Insurance Plan (OHIP), when physician fee schedule telemedicine codes were introduced, until the most recent data available from Institute for Clinical Evaluative Sciences. Referring physician and patient information were ascertained using the OHIP claims database; if referral information was not available, we looked back within the past 12 months to identify the most frequently seen family physician and, if not available, the most recently seen family physician. These data were linked to population-level health administrative databases held at ICES. Additionally, a 1-year (FY2016) comparison of FPTs versus FPNTs matched (1:2) by the 14 Local Health Integration Networks (LHIN). LHINs are artificially divided regions of Ontario which were designed to support local approaches to strategic planning, funding, and regional coordination of clinical care and are used in administrative data to classify provincial regions. This study was approved by the Research Ethics Board of Sunnybrook Health Sciences Centre, Toronto.
Data Sources
This study used province-wide health administrative databases that were linked using unique encoded identifiers and analyzed at ICES. OHIP data were used to collect family physician details, including physician number, fee code, service date, and location of service provided, and patient information, including patient ID, diagnosis, service date, and location. The National Ambulatory Care Reporting System was used to collect data on emergency department visits. The Ontario Mental Health Reporting System was used to obtain information on psychiatric hospitalizations. The ICES Physician Database and the Primary Care Population database were used to analyze data on primary care providers and teams, including the number of years since medical school graduation, years of practice since graduation, provider type, interprofessional team details, and total physicians per practice. The Client Agency Program Enrolment database was used to analyze data on physician practice type (defined as patient enrollment type). The Ontario Census Area Profiles and the Registered Persons Database were used to analyze patient-level demographic variables (such as age, sex, the region of residence) as well as geographic details (rurality, income quintiles). Primary care providers who had missing age or sex data and patients with missing health card numbers, missing age, or missing sex were excluded from the analysis.
Provider Characteristics
We selected primary care provider characteristics based on 2 things: availability within the ICES data set, and previous literature within the field that assessed predictors using these measures. 34 The primary care provider characteristics used to compare FPTs versus FPNTs included age group, sex, number of years since medical school graduation, years of practice since graduation, rurality of residence, physician practice type (Family Health Team a or other), average number of nurse practitioners within the practice, and average number of social workers within the practice.
Patient Characteristics
We examined patient demographic and service utilization characteristics for patients rostered within each physician group (FPT vs. FPNT). Patient demographic characteristics included age, sex, neighborhood income quintile (NIQ 1% = 0 to 20%; NIQ 2 = 20% to 40%, NIQ 3 = 40% to 60%, NIQ 4 = 60% to 80%, NIQ 5 = 80%+), and whether they live in a rural or urban area. Patient utilization and medical complexity were considered within each annual cross section by assessing: number of primary care provider visits (total, mental health and non-mental health); number of emergency department visits (total, mental health and non-mental health-related); number of hospitalizations (total, mental health and non-mental health-related); and comorbidities using the Johns Hopkins’ Aggregated Diagnosis Groups (ADG). Mental health primary care visits were defined using a validated algorithm to identify adults accessing care for a mental health disorder, which included adult mental health diagnostic codes 295 to 298, 300 to 304, 306, 309, 311, 897 to 902, 904, 905 (which represents a broad range of adult mental health and addiction diagnoses as defined by the International Classification of Diseases 10 [ICD-10-CA]). 37 Hospitalizations and ED visits included ICD-10-CA codes F04-F99 (which excludes dementia). The Johns Hopkins ADG’s are categorized based on 5 clinical dimensions, including the duration, the severity, the etiology, the diagnostic certainty and the specialty care involvement of the condition. 38
Analysis
Descriptive Analysis
Annual outputs and trends over time
Annual panels containing physician and patient characteristics were described, including counts, column percentages, and means with standard deviations. Additionally, changes over time were evaluated for each of the physician characteristics.
Matched physician comparison
Matched comparisons between FTPs and FTNPs were presented as counts, column percentages, and standardized mean differences (SMD). We compared between-group differences using the SMD. Cohen suggests a small effect size is equal to 0.2 SMD, but recent studies suggest that a more prudent threshold for assessing effect size is 0.1 SMD, especially with large data sets. 39,40 Using this threshold (0.1 SMD), this study identifies significant differences between groups.
The model covariates included physician age (categorical; <34, 35 to 44, 45 to 54, 55 to 64, 64+), sex (male/female), number of years after graduation (categorical: 1 to 10, 11 to 20, 21 to 30, 31 to 40, 41+ years), rural residence (living in community with less than 10,000 people: yes/no), total nurse practitioner on the team (continuous), total social workers on the team (continuous), if the family physician is a Canadian medical graduate (yes/no), the physician practice type (FHT/other), patient age (categorical: 0 to 10, 11 to 20, 21 to 30, 31 to 40, 41 to 50, 51 to 60, 61 to 70, 71 to 80, 81+ years), patient sex (male/female), patient NIQ (categorical: 1 to 5), if the FP has more patients in low NIQ areas (yes/no), patient residence (urban/rural), if the FP has more urban patients than rural (yes/no), if the FP has more patients with at least 1 psychosocial ADG (yes/no), patient region (categorical: LHIN1-14), total number of ED visits (categorical: 0 to 59, 60 to 156, 157 to 257, 258 to 414, 415+), total number of mental health ED visits (categorical: 0 to 3, 4 to 9, 10 to 19, 20+ visits), total hospitalizations (categorical: 0, 1 to 2, 3 to 5, 6 to 10, 11+), total mental health hospitalizations (categorical: 0, 1 to 2, 3 to 5, 6 to 10, 11+), total primary care visits (categorical: 0 to 59, 60 to 156, 157 to 257, 258 to 414, 415+), and total mental health primary care provider visits (categorical: 0 to 59, 60 to 156, 157 to 257, 258 to 414, 415+).
Statistical analysis
We used statistical modeling to understand the predictors of referring to telepsychiatry among physicians. We used generalized estimating equations (GEE) for the statistical model, as it accounts for patient clustering at the provider level. 41 All analyses were carried out using SAS Version 9.4 (SAS Institute, Cary, NC). All results were presented as adjusted odds ratios (ORs) with corresponding 95% confidence intervals (CIs).
Results
Descriptive Analysis of FTPs
In FY 2016, there were 13,290 family physicians in Ontario; this analysis includes a subset of those family physicians who have referred to telepsychiatry. 42
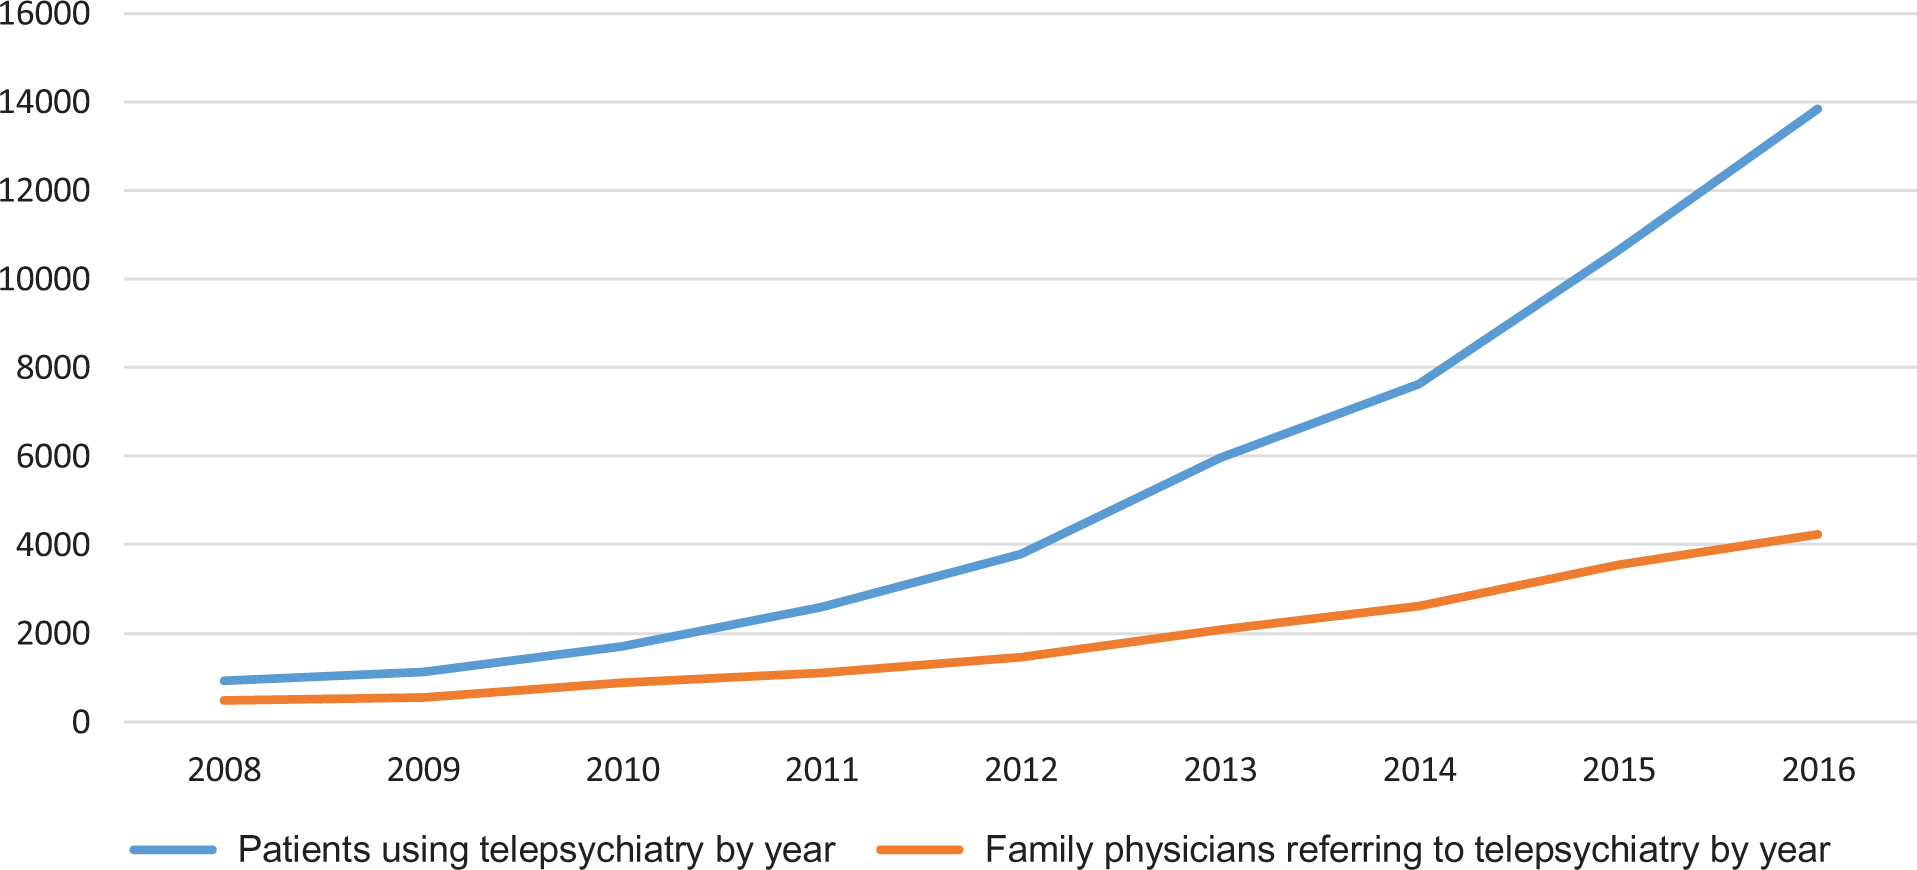
Increase in patients accessing and family physicians referring to telepsychiatry
The number of patients receiving telepsychiatry increased from 925 patients in FY 2008 to 13,845 patients in FY 2016, which represents approximately a 15-fold increase (see Table 1). There was substantial growth in the number of FPTs from 474 to 4224, which represents a 9-fold increase from FY 2008 to FY 2016 (see Table 1). Of all physicians in Ontario, 32% referred to telepsychiatry in FY 2016 (4,224/13,290). Less than 1% of total patients rostered to FPTs had a telepsychiatry visit in FY 2016 (n = 12,449/3,513,638).
Comparative Analysis of Family Physicians that Refer to Telepsychiatry Compared to 2016.
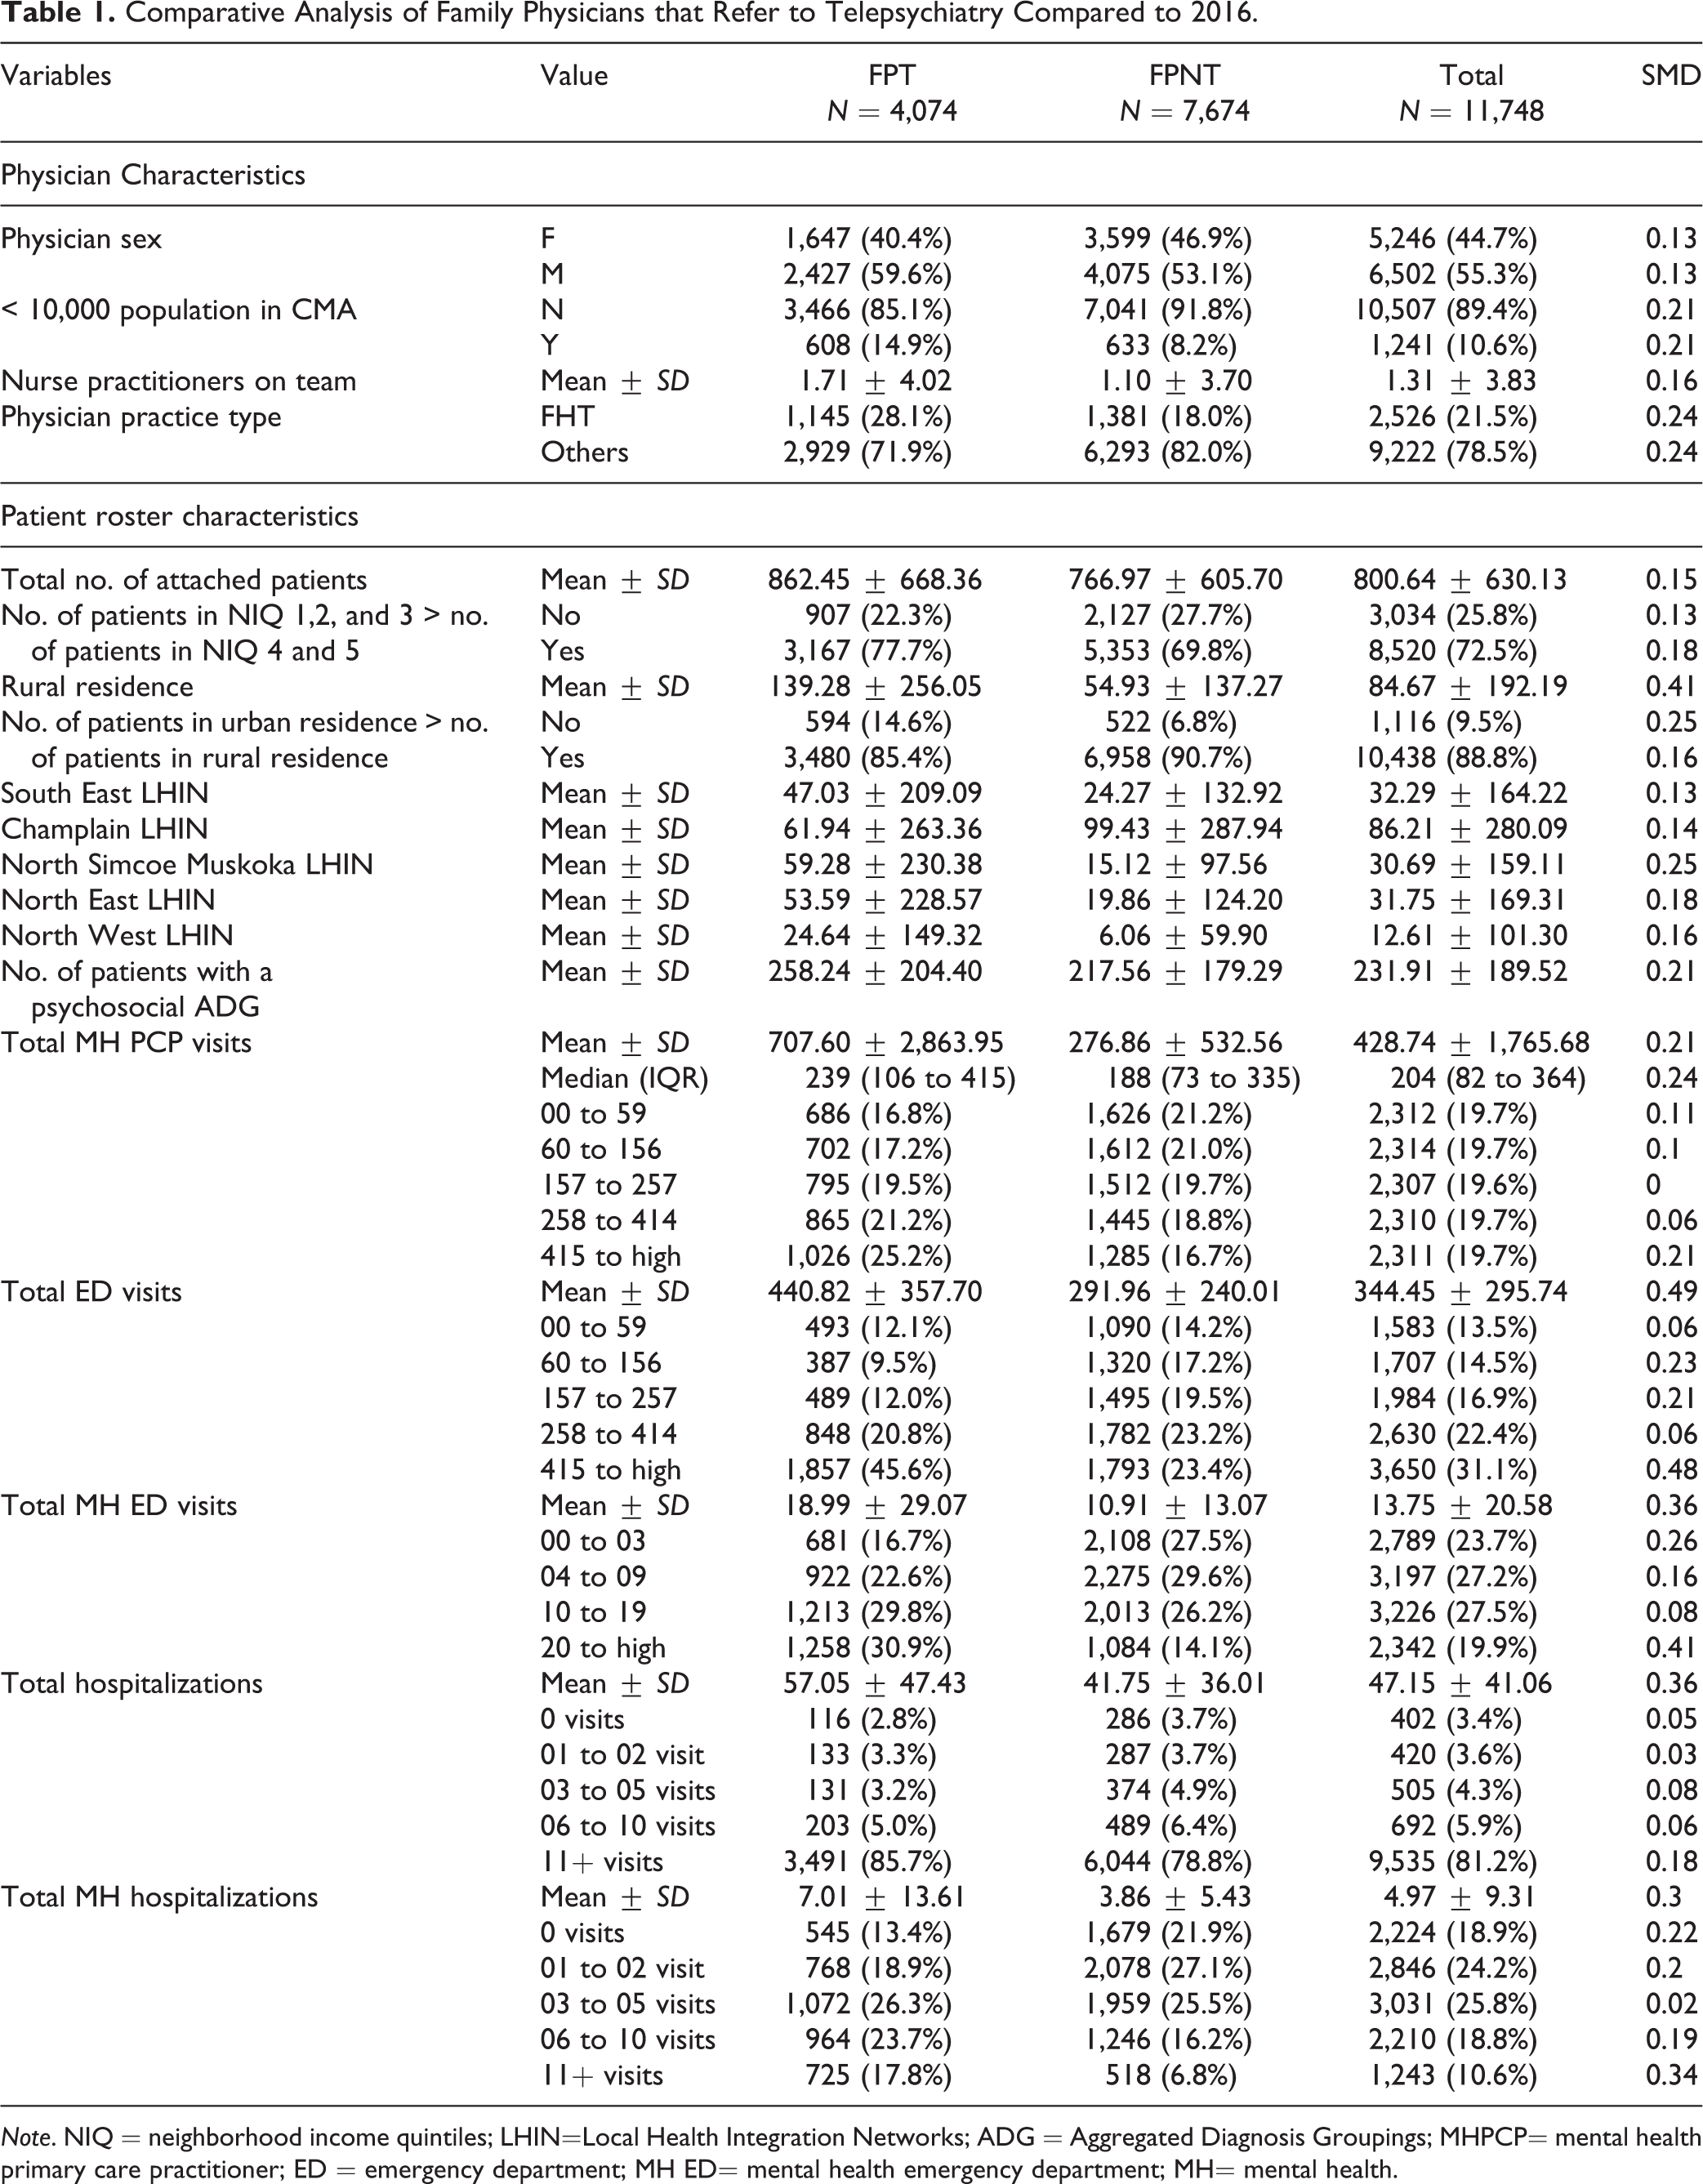
Note. NIQ = neighborhood income quintiles; LHIN=Local Health Integration Networks; ADG = Aggregated Diagnosis Groupings; MHPCP= mental health primary care practitioner; ED = emergency department; MH ED= mental health emergency department; MH= mental health.
Physician rurality
In FY 2008, the percentage of total telepsychiatry visits was highest in the North East LHIN (20%, n = 94), followed by the North West LHIN (16%, n = 74; Ontario’s most northern regions), followed by the South West LHIN (15%, n = 70). In FY 2016, those numbers shifted, so the highest percentage of telepsychiatry referrals came from family physicians in regions such as Hamilton Niagara Haldimand Brant (10%, n = 433), Central East (10%, n = 421), and Toronto Central (10%, n = 420) LHINs, with the Central (n = 393) and North East (n = 379) LHIN’s family physicians referring 9% each. All LHINs ranged between 4% and 10% of total telepsychiatry delivery in FY 2016, compared to FY 2008, where the range spread from 0% (in Mississauga Halton LHIN) to 20% (in the North East LHIN). This shows a more evenly distributed adoption of telepsychiatry from northern regions to all regions of Ontario, many of which still have highly rural and remote communities.
Telepsychiatry adoption by year (FY 2008 and FY 2016).
Comparative Analysis
Family physician characteristics
A larger percentage of FPTs were male, compared to FPNTs (59.6% [n = 2,427] vs. 53.1% [n = 4,075], SMD = 0.13). A greater percentage of FPTs were from communities with a population that had less than 10,000 people (14.9% [n = 608] vs. 8.2% [n = 633], SMD = 0.21). FPTs had a larger mean number of nurse practitioners and FPNTs (1.71 [±4.02] vs. 1.10 [±3.70], SMD = 0.16); finally, a greater percentage of FPTs belonged to FHTs than FPNTs (28.1% [n = 1,145] vs. 18% [n = 1,381], SMD = 0.24).
Comparing patient roster characteristics
There were a few notable differences in patient roster characteristics between FPTs and FPNTs. FPTs had a larger mean number of attached patients than FPNTs (862.45 [± 668.36] vs. 766.97 [±605.70], SMD = 0.15). A greater percentage of FPTs had patients on their roster from lower NIQs than FPNTs (1 to 3) (77.7% [n = 3,167] vs. 69.8% [n = 5,353], SMD = 0.18). FPTs had a larger mean number of patients from a rural residence compared to FPNTs (139.28 [±256.05] vs. 54.93 [±137.27], SMD = 0.41). A greater percentage of FPTs had more patients from rural areas than urban areas (14.6% [n = 594] vs. 6.8% (n = 522), SMD = 0.25). FPNTs had a higher patient mean in the Champlain LHIN (which includes Ottawa, a large urban region in Ontario; FPT = 61.94 [±263.36], FPTN = 99.43 [±287.94], SMD = 0.14). FPTs had higher patient means in 4 LHINs (mostly northern regions): South East (SE) LHIN (FPT = 47.03 [±209], FPTN = 24.27 [±132.92], SMD = 0.13), North Simcoe Muskoka (NSM) LHIN (FPT = 59.28 [±230.38], FPNT = 15.12 [±97.56], SMD =0.25), North East (NE) LHIN (FPT = 53.59 [±228.57], FPNT = 19.86 [±124.20], SMD =0.18), North West (NW) LHIN (FPT = 24.64 [±149.32], FPNT = 6.06 [±59.90], SMD = 0.16).
The mean number of patients with psychosocial ADGs was higher for FPTs compared to FPNTs (258.24 [±204.4] vs. 217.56 [±179.29], SMD = 0.21).The mean mental health primary care provider (MHPCP) visits was higher in FPTs compared to FPNTs (707.60 [±2,863.95] vs. 276.86 [±532.56], SMD = 0.21). Due to the large standard deviation, we also examined the median for MHPCP; FPTs had a higher median MHPCP visits than FPNTs (229 [IQR = 106 to 415] vs. 189 [IQR = 73 to 335], SMD = 0.24). FPTs have a higher percentage of patients with 415+ MHPCP visits compared to FPNTs (25.2% [n = 1,026] vs. 16.7% [n = 1,285], SMD 0.21).
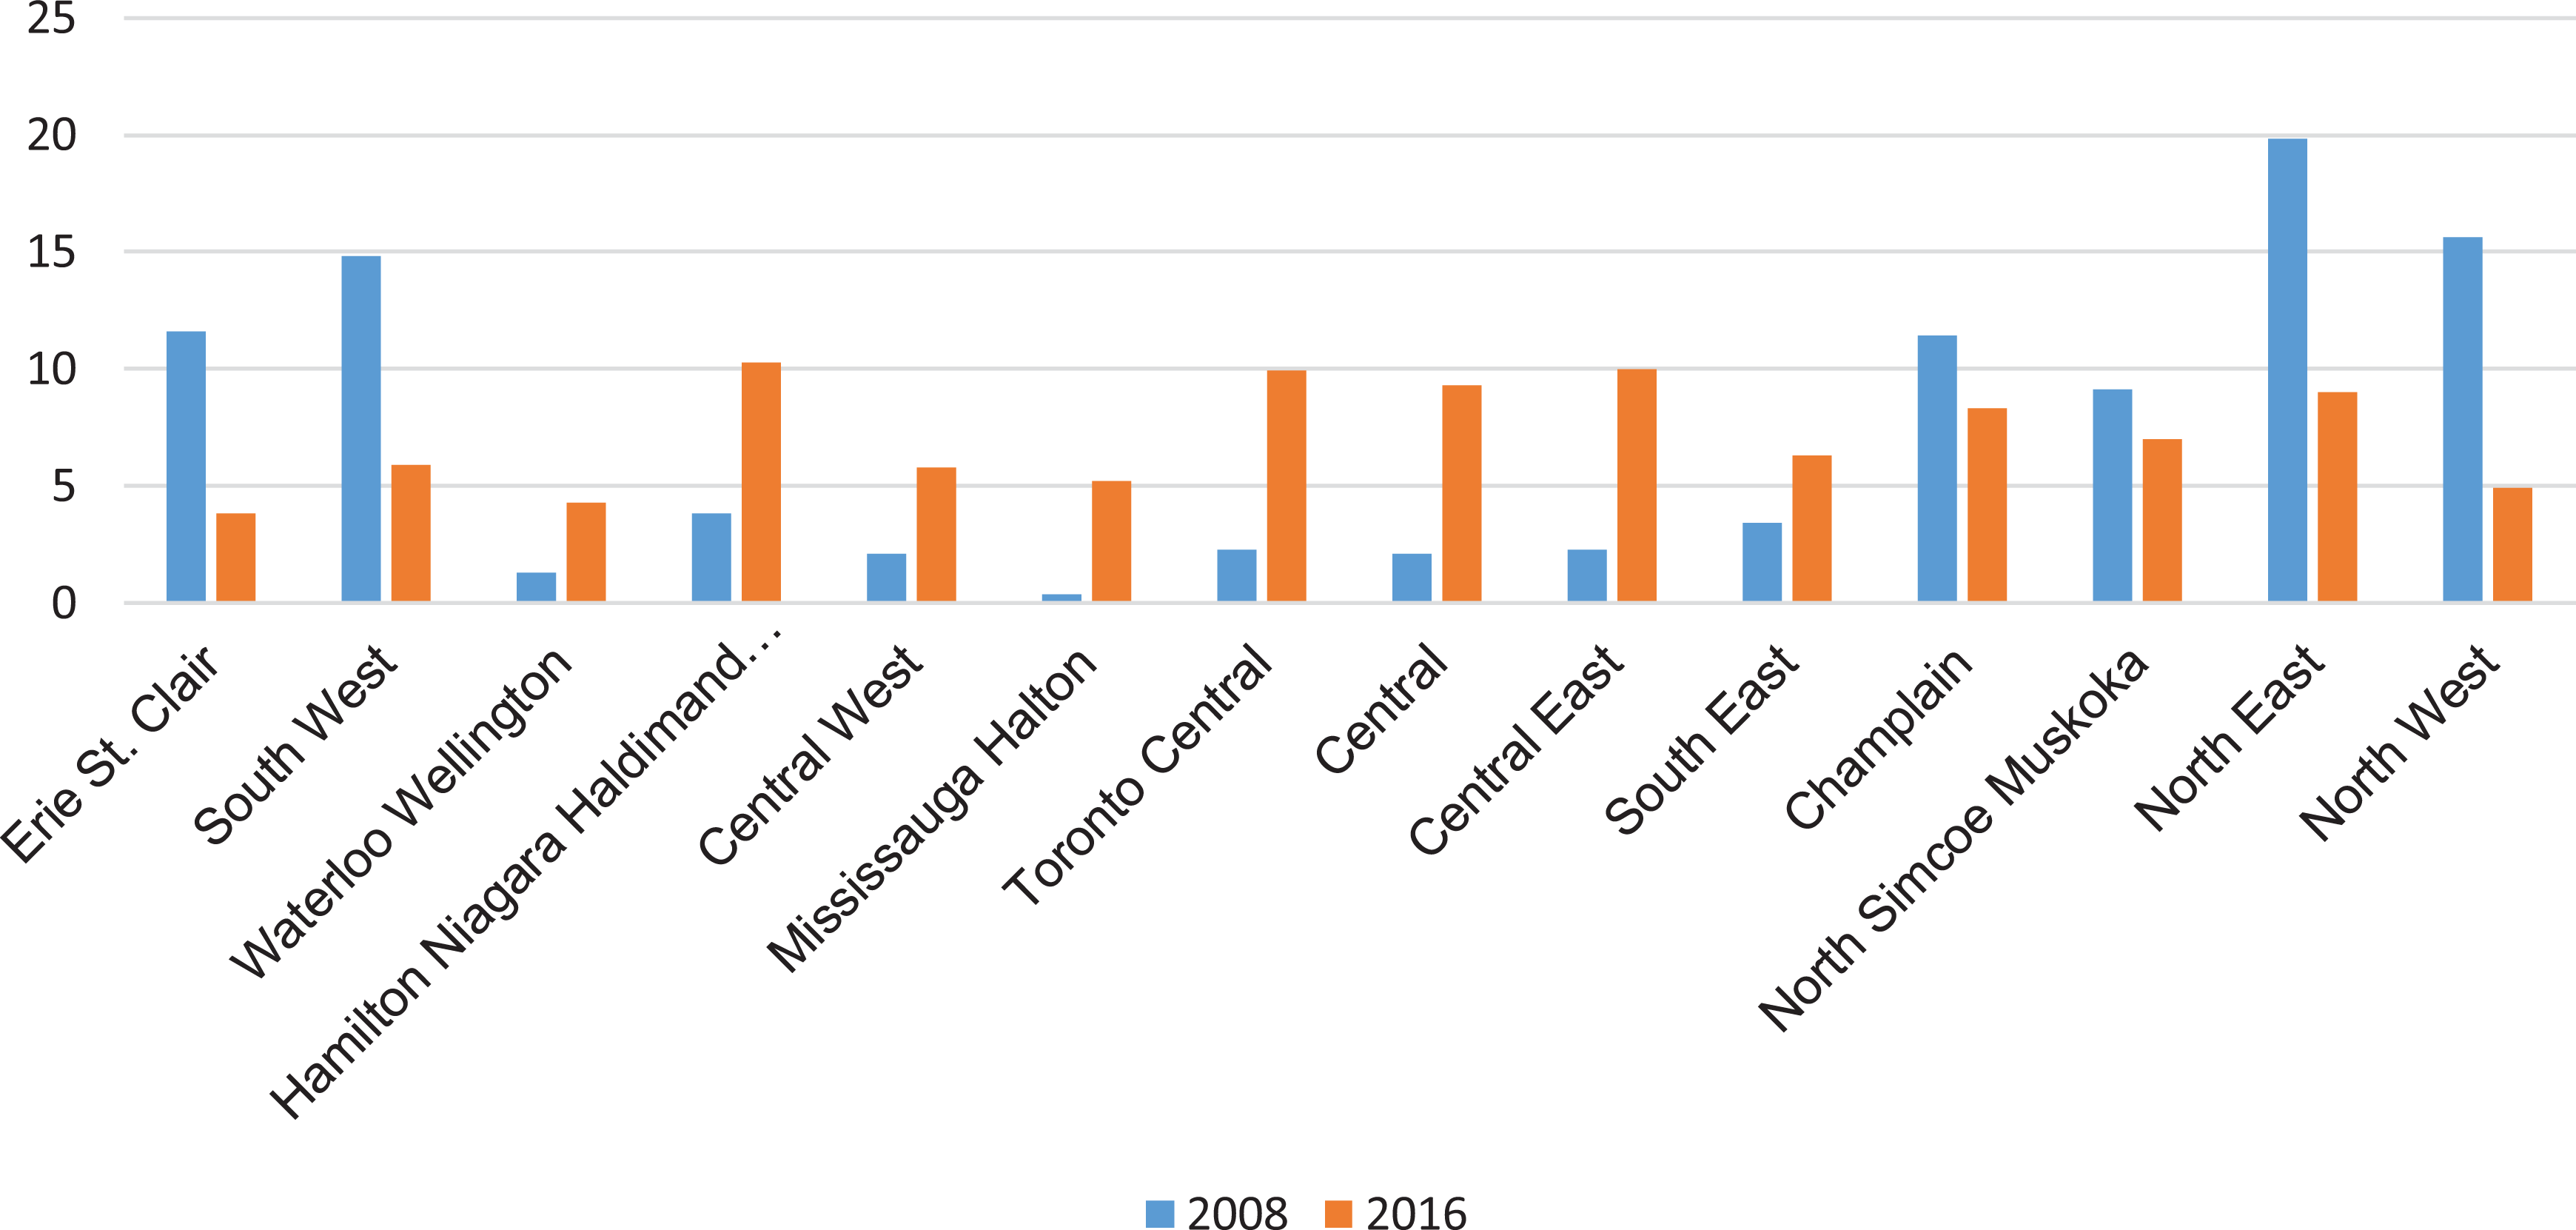
Percentage of referring physicians by region (2008 and 2016).
The mean number of ED visits was higher for FPTs compared to FPTNs (440.82 [±357.7] vs. 291.96 [±240.01], SMD = 0.49). Table 1 describes the difference between all categories, but the most notable differences are for patients that had 60 to 156, 157 to 257, and 415+ visits. FPTs had a lower percentage of patients with 60 to 156 ED visits than FPNTs (9.5% [n = 387] vs. 17.2% [n = 1,320], SMD = 0.23) and patients with 157 to 257 visits (12.0% [n = 489] vs. 19.5% [n = 1,495], SMD = 0.21). FPTs has a greater percentage of patients with 415+ ED visits compared to FPNTs (45.6% [n = 1,857] vs. 23.4% [n = 1,793], SMD = 0.48).
FPTs had a larger mean number of MHED visits for rostered patients compared to FPNTs (18.99 [±29.07] vs. 10.91 [±13.07], SMD = 0.36). Full details within each category are in Table 1, but the most notable difference was the group that had 0 to 3 and 20+ MHED visits. FPTs had a lower percentage of patients with 0 to 3 MHED visits than FPNTs (16.7% [n = 681] vs. 27.5% [n = 2,108], SMD = 0.26) and a higher percentage of patients with 20+ MHED visits than FPNTs (30.9% [n = 1,258] vs. 14.1% [n = 1,084], SMD = 0.41).
FPTs had a greater mean of hospitalizations compared to FPNTs (57.05 [±47.43] vs. 41.75 [±36.01], SMD = 0.36). Full details within each category are in Table 1, but the most notable difference was that FPTs had a larger percentage of patients with 11+ hospitalizations, compared to FPNTs (85.7% [n = 3,491] vs. 78.8% [n = 6,044], SMD = 0.18). Of those hospitalizations, mental health–specific hospitalizations (MHH) were measured. FPTs had a greater mean of MHH visits compared to FPNTs (7.01 [±13.61] vs. 3.86 [±5.43], SMD = 0.3). The most striking differences were the groups that had zero visits and those with 11+ visits. FPTs had a lower percentage of patients with zero MHH visits compared to FPNTs (13.4% [n = 545] vs. 21.9% [n = 1,679], SMD = 0.22). FPTs had a higher percentage of patients with 11+ MHH visits compared to FPNTs (17.8% [n = 725] vs. 6.8% [n = 518], SMD = 0.34).
Statistical Modeling
Regression using generalized estimating equations
A full description of the findings is listed in Table 2. Within this model, a number of significant correlates of FPTs were identified, including physician age group of 55 to 64 (OR = 0.85; 95% CI, 00.74 to 0.97), physician age-group of 64+ (OR = 0.73; 95% CI, 0.62 to 0.85), and FPTs were more likely to be located in rural areas (OR = 1.38; 95% CI, 1.17 to 1.62). Compared to patient rosters of FPNTs, FPT rostered patients were: almost half as likely to be urban (OR = 0.55; 95% CI, 0.43 to 0.70), more likely to have psychiatric ADGs (OR = 1.2, 95% CI, 0.86 to 1.66), and more likely to have 4 to 9 mental health ED (MHED) visits (OR = 1.33; 95% CI, 1.03 to 1.72), patients with 10 to 19 MHED visits (OR = 1.54; 95% CI, 1.14 to 2.07), patients with 20+ MHED visits (OR = 2.17; 95% CI, 1.60 to 2.94), patients with 3 to 5 MHH (OR = 1.21; 95% CI, 1.08 to 1.35), patients with 6 to 10 MHH (OR = 1.32; 95% CI, 1.15 to 1.51), patients with 11+ MHH (OR = 1.77; 95% CI, 1.28 to 2.43), patients with 157 to 257 mental health primary care (MHPC) visits (OR = 1.24; 95% CI, 1.00 to 1.54), patients with 258 to 414 MHPC visits (OR = 1.38; 95% CI, 1.09 to 1.76), patients with 415+ MHPC visits (OR = 1.61; 95% CI, 01.33 to 1.94).
Model Using Generalized Estimating Equations Comparing FPTs versus FPNTs (2016).
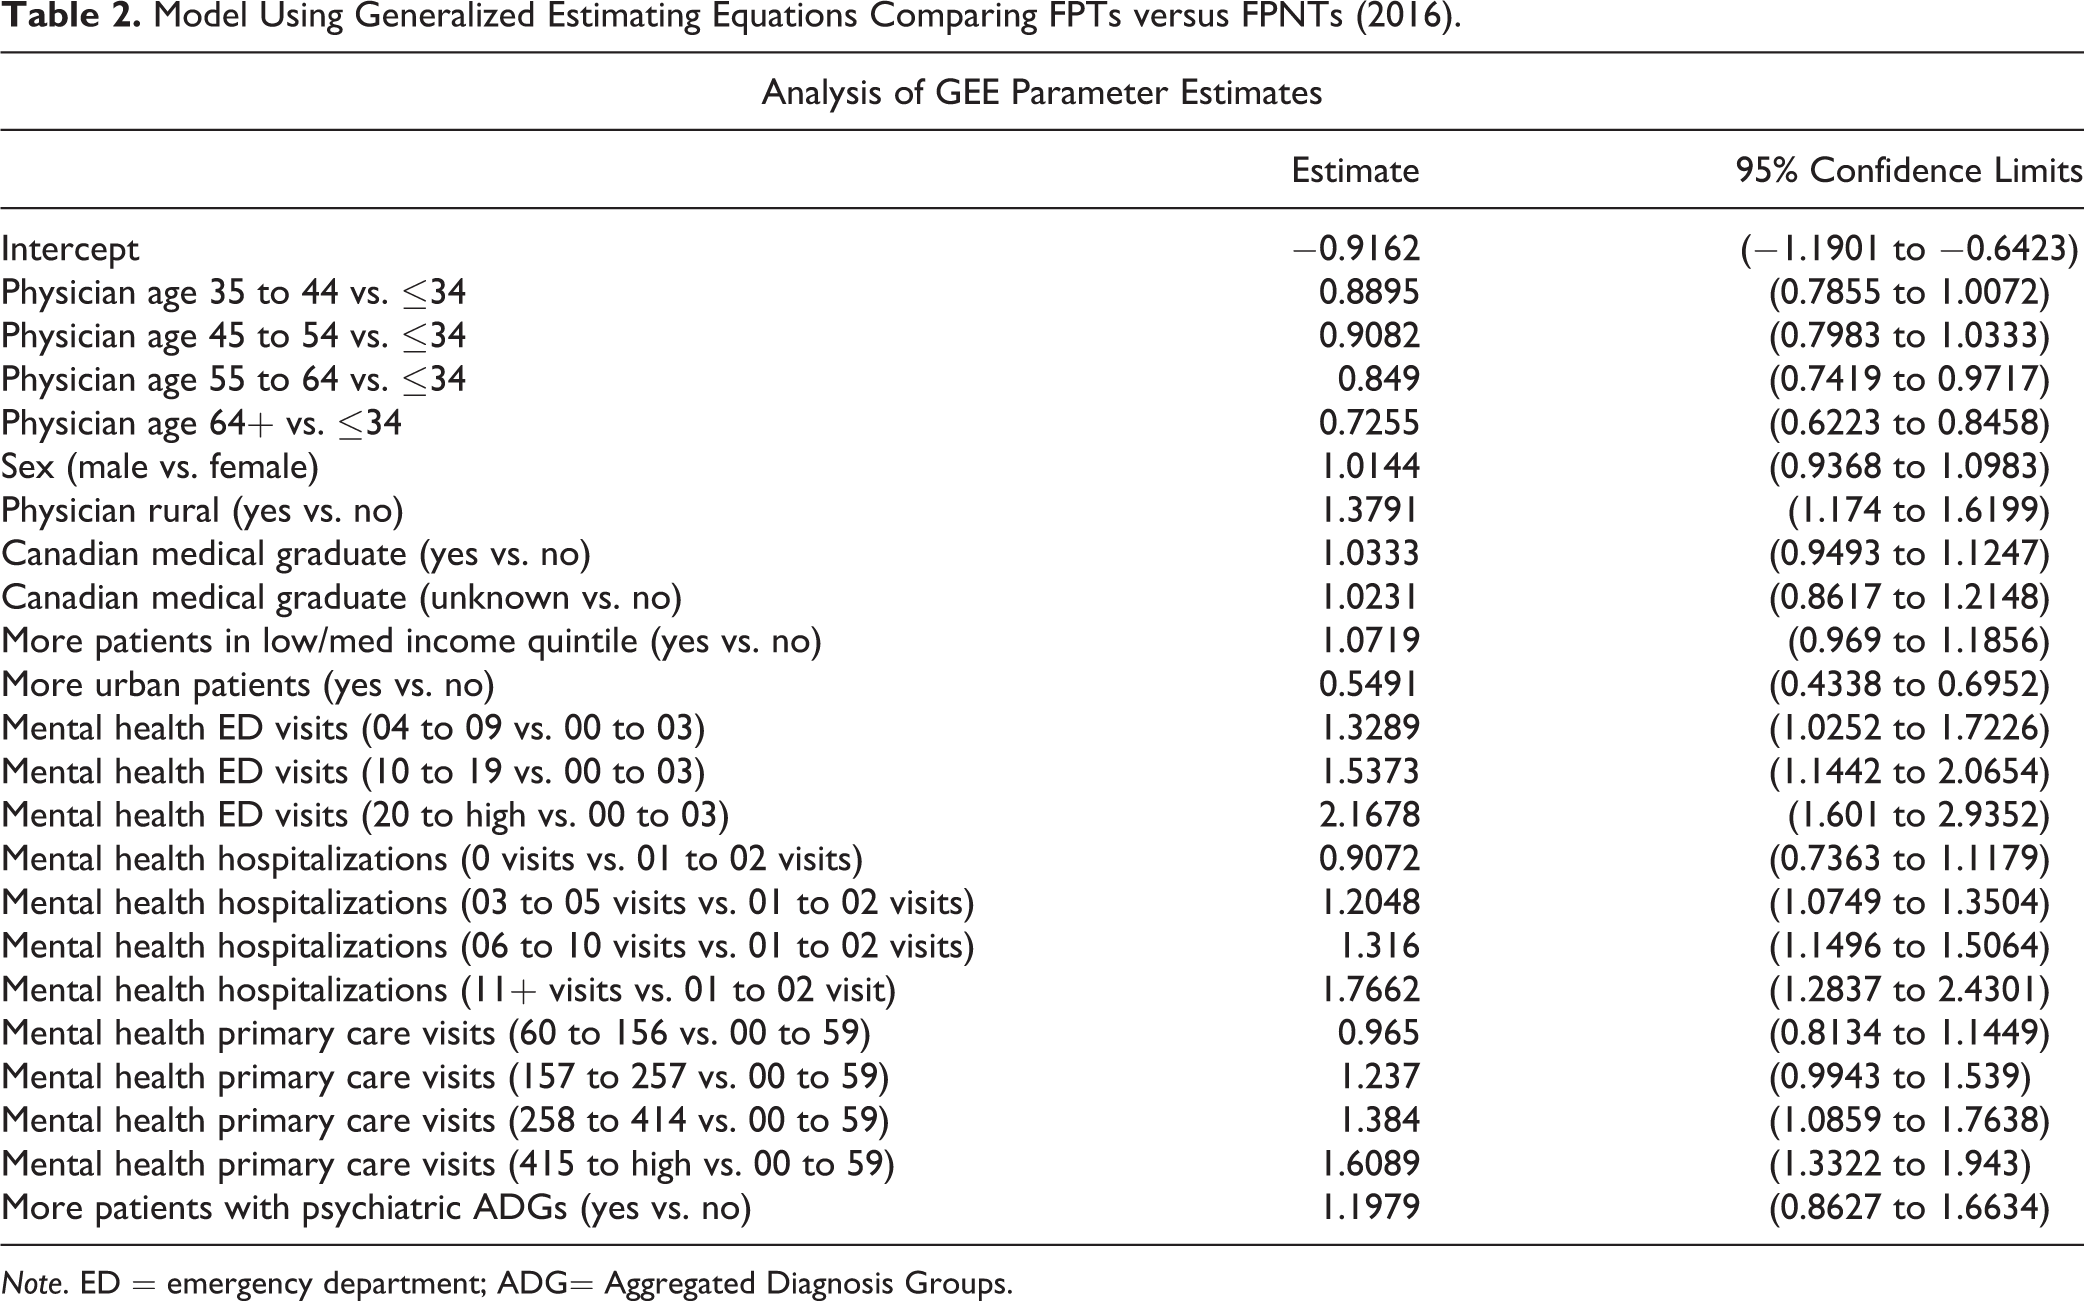
Note. ED = emergency department; ADG= Aggregated Diagnosis Groups.
Discussion
To our knowledge, this is the first study that investigates trends and predictors of family physicians referring to telepsychiatry at a system level. Between FY 2008 and FY 2016, there was a 9-fold increase in the number of primary care physicians referring to telepsychiatry and a nearly 15-fold increase in the number of primary care patients referred to telepsychiatry; 32% of family physicians referred to telepsychiatry, while less than 1% of patients rostered to FPTs utilized telepsychiatry. While patient adoption of telepsychiatry continued to increase in Ontario during the study period, it still represents a very small percentage of patients in Ontario. These visits represent, for the most part, patients that were required to go to a health care site to access care and psychiatrists that are required to use the provincial telemedicine platform. It is evident that there remains a large opportunity to increase patient adoption. As discussed in the Introduction, it is likely that the recent COVID-19-related temporary policy changes to virtual care will present an opportunity for significant growth and adoption of telepsychiatry. This study provides an essential benchmark for future analyses, comparing how these policy changes have shifted adoption patterns with patients and family physician referrals.
Physicians who referred to telepsychiatry in FY 2008 were mainly from northern regions, whereas in FY 2016, more referrals from southern regions emerged, many of which still have rural areas within their catchments. Referral to telepsychiatry was more evenly distributed throughout the province in FY 2016. While historically telepsychiatry was used to support rural populations, in later years of the study, there were increasing provincially funded telepsychiatry projects that aimed to increase adoption of telepsychiatry within more populous regions. While it is important to create access and choice for patients in both rural and urban areas, policy makers and funders should consider aspects of digital health equity, 43 allowing the use of diverse secure virtual platforms, funding home-based visits, and establishing mechanisms to support the appropriate distribution of virtual care throughout the province.
Past studies have suggested that physicians who were more isolated and were part of an integrated health system had positive feelings about telemedicine and that nurses were more enthusiastic about telemedicine than physicians. 25,36 As such, unsurprisingly, this study found that predictors of family physician referrals to telepsychiatry include rurality of residence (for both provider and patient), team-based practice models, nurse practitioners on the team, and clinical complexity of patient rosters.
This study has numerous strengths; it utilizes a large, multiyear, linked data set of family physician and patient data to help understand important characteristics that are common in physicians who refer to telepsychiatry. Additionally, since this study uses administrative data, the study was conducted rapidly using a retrospective analysis. However, the study also has several limitations. The identification of telepsychiatry visits is contingent upon psychiatrists using telepsychiatry billing codes and billing fee for service, so it is possible that there is missing data or an underrepresentation of visits completed by physicians paid by salary or alternate funding. Another potential limitation is that while this study includes nurse practitioners as a covariate in the analysis, it does not take into account actual nurse practitioner referrals to telepsychiatry, which could lead to an underestimate of our total telepsychiatry visits. We believe, however, that this will have minimal impact on our study because it is likely that nurse practitioner referrals will be captured within total telepsychiatry visits but rostered (as defined in our methods) to a family physician instead.
Conclusion
While telepsychiatry has seen continued growth over recent years, there remains significant opportunities for increased adoption. This study shows that certain factors, including rurality, provider practice type, the number of nurse practitioners on the provider’s team, as well as patient health care and hospital utilization characteristics are more likely in FPTs than FPNTs. This study provides a baseline from which to assess recent rapid mobilization of telepsychiatry and a means of doing so using administrative health data.
Footnotes
Declaration of Conflicting Interests
The author(s) declared no potential conflicts of interest with respect to the research, authorship, and/or publication of this article.
Funding
The author(s) received no financial support for the research, authorship, and/or publication of this article.