
Abstract
Objective:
To investigate the degree to which psychiatrists are accessible to new outpatients and the factors that predict whether psychiatrists will see new outpatients.
Methods:
We used administrative health data on all practicing full-time psychiatrists in Ontario, Canada, over a 5-year period (2009-2010 to 2013-2014). We used a regression model to estimate the number of new outpatients seen, accounting for case mix, outpatient volume, and psychiatrist practice characteristics.
Results:
Approximately 10% of full-time psychiatrists are seeing 1 or fewer new outpatients per month, and another 10% are seeing between 1 and 2 new outpatients per month. Our model identified psychiatrists in 3 distinct practice styles. One practice style (representing 29% of psychiatrists), on average, saw fewer than 2 new outpatients per month and 69 unique outpatients annually. Relative to other practice styles, they tended to see fewer patients with a previous psychiatric hospitalization and fewer patients who lived in lower income neighbourhoods.
Conclusions:
Nearly 1 in 3 full-time psychiatrists in Ontario see very few new outpatients. This has implications for access to care, particularly for outpatients with newly diagnosed mental illness. It also highlights the continued need to address access issues by assessing the role of psychiatrists within the Canadian health care system.
Timely specialist mental health care is important for patients with newly diagnosed mental illness and those recently discharged from a psychiatric hospitalization. 1,2 Access to such care may reduce relapse and rehospitalization, 3 which are important outcomes for patients and health systems. In Canada, access to psychiatric care has been raised as an important policy concern, 4,5 which has been precipitated by a series of scholarly articles that have studied the supply and distribution of psychiatric care in Canada. 6 –8 One study demonstrated that 60% of patients with newly diagnosed schizophrenia do not see a psychiatrist within 30 days. 6 Another study found that 60% of patients do not see a psychiatrist within 6 months of a suicide attempt. 7 Another study suggested that 70% of psychiatrists in Vancouver were unable to accept referrals. This was, in part, due to subspecialization, where psychiatrists only accepted certain types of patients. 8 Access to psychiatric care is also important for low-income and other socially disadvantaged groups. With minor exceptions, psychiatric care is the only specialized mental health care service in Canada that is publicly insured.
Some have argued that a psychiatrist shortage is mainly to blame for supply shortfalls 9 ; however, studies suggest that access barriers are, at least in part, a result of variation in psychiatrist supply. 10,11 One study found that 24% to 40% of psychiatrists in high-supply regions of Ontario, Canada (i.e., regions with high numbers of psychiatrist practices per capita), saw fewer than 100 patients per year (compared to 15% in other regions) and that these patients were, on average, healthier than those seen in other practices. 10
The literature on small-area variations suggests unique provider practice styles can influence the supply of health care services. 12 –15 Practice style may reflect a provider’s belief about the efficacy of treatment, and environmental and contextual factors, such as local practice culture or regional supply, may influence practice style choice. In Canada, most psychiatrists own and operate independent practices. While they receive public funding for medically necessary services, they have administrative and clinical independence over how and in what environment they deliver care. In this context, psychiatrists are free to self-select into practice styles that match their own preferences for care delivery. There are a wide variety of potential practice styles that psychiatrists can take on. Practice style can vary in terms of intensity of care, patient case mix, and area of focus. For instance, psychiatrists may choose to specialize in emergency care, consultation and medication management with complex and high-risk patients, and/or psychotherapy.
One area related to the supply of psychiatric care that has not yet received attention in the Canadian context is the extent to which psychiatrists are accepting new patients. In this study, we investigate whether psychiatrists are open to new patients and the factors that predict whether psychiatrists will see new outpatients. The factors associated with seeing new patients may vary across these distinct practice styles, and standard analytic techniques may obscure this variation. We used a mixture modelling approach (or a latent profile analysis). 16 The advantage of this approach is that it allows us to account for practice style, which is unobserved in the data. The findings of this study have important implications for access to specialist psychiatric care, particularly for persons with newly diagnosed and complex mental illness.
Methods
Data Sources
We used health administrative data collected by the Ontario Ministry of Health and Long-Term Care and shared via contractual agreement with ICES (a data centre in Toronto). We accessed the Ontario Health Insurance Plan (OHIP) claims database for physician billing data, the Ontario Mental Health Reporting System for information on adult psychiatric inpatient care in psychiatric designated beds, and the Discharge Abstract Database for information on all other inpatient hospitalizations. We accessed the Corporate Provider Database and ICES Physician Database for psychiatrist demographic information, the Registered Persons Database for patient demographic information, and census data for geographic and neighbourhood-level socioeconomic variables. We also accessed information on immigration status from the Immigrant, Refugees, and Citizenship Canada Permanent Resident Data. The data sets described were all linked using encoded identifiers and analyzed at ICES. The institutional review board at Sunnybrook Health Sciences Centre in Toronto, Ontario, approved the study.
Psychiatrist Cohort
We collected annual observations from 2009-2010 to 2013-2014 for all practicing psychiatrists in Ontario, Canada, using the specialty code for psychiatrist in the Corporate Provider Database. We indexed the data on April 1 of each year and constructed a 5-year study cohort to account for changes in practice style over time. To ensure we observed all psychiatrists for the entire study period and that we were looking at comparable psychiatrist practices, we restricted our analysis to psychiatrists who were in full-time fee-for-service practices in all 5 years. We coded psychiatrists as full-time in accordance with the Health Canada definition. This included full-time psychiatrists above the 30th percentile for annual fee-for-service billings. 17 We also excluded psychiatrists with missing data on key variables. As a sensitivity analysis, we included full-time fee-for-service psychiatrists observed in any study year but this did not result in material changes to our findings.
Variable Selection and Definition
Our outcome variable was the number of new outpatients seen annually. We defined new outpatients as those who a psychiatrist had not seen in the previous 2 years. We selected model covariates based on previous studies that have identified important predictors of psychiatrist supply. 10,11 These included psychiatrist age, gender, practice rurality, whether they trained in Canada, and outpatient case mix. We also included psychiatrist practice characteristics that would be associated with seeing new outpatients, including the number of unique outpatients seen in the current year, the number of outpatient visits provided annually, and the proportion of total visits that were for inpatient care. We measured rurality using the Rurality Index of Ontario (RIO) score. 18 In line with previous studies of physician supply in Ontario, psychiatrist practices were coded as “rural” if they had a RIO score greater than zero and were otherwise coded as “urban.” 19
We captured practice case mix using aggregated patient-level characteristics. We included proportion of outpatients who had a psychiatric hospitalization in the previous year. We treated this as proxy for the severity of psychiatric illness encountered by psychiatrists. 10 General medical complexity was captured by measuring the proportion of patients seen with 9 or more diagnosis categories. Diagnoses were determined using the 33 ACG System Aggregated Diagnosis Groups (ADGs) developed for the Adjusted Clinical Group Morbidity Index. 20 We also included the proportion of outpatients with immigrant status and the proportion residing in the lowest neighbourhood income quintile. We used the Statistics Canada’s Postal Code Conversion File to assign postal code of residence to census dissemination areas to generate neighbourhood income values. 21
Analysis
We estimated a concomitant mixture model, 22 where the probabilities that a psychiatrist was allocated to a particular class (or practice style) were conditioned on observed covariates. Previous work suggests that psychiatrist practice styles can vary considerably in intensity of care and in the severity of mental illness amongst outpatients. 10 Thus, we assumed that psychiatrist classes would vary along these dimensions. We conditioned the class assignment on the number of outpatient visits and the proportion of outpatients seen with a psychiatric hospitalization in the previous 12 months.
We estimated the outcome variable (annual number of new outpatients seen), controlling for relevant covariates, for each of the practice styles using a mixture of generalized linear models with a log link function. We assumed the distribution of the dependent variable was negative binomial. Other distributional forms, including Poisson and Gaussian, were also tested, but these did not improve model fit. We specified starting values for the mixture model by randomly assigning psychiatrists to initial classes, reproduced this process 25 times, and selected the estimation with the best log-likelihood. We produced all estimates using the finite mixture model (fmm) command in Stata 15. Model fit was determined using log-likelihood, Akaike information criterion (AIC), and Bayesian information criterion (BIC) statistics. Best practice suggests that the optimal number of discrete classes generated by the model should be the quantity that produces the best fit with the observed data. 23,24 All regression results were reported as average marginal effects (AMEs), which represents the average change in the dependent variable for a 1-unit change (or a change from zero to 1 for binary variables) in the independent variable. We also estimated robust standard errors with clustering at the individual psychiatrist level to account for repeated observations on individual psychiatrists.
Results
We captured 10,524 observations on 2301 unique psychiatrists over the 5-year study period. In total, 1803 psychiatrists were in full-time fee-for-service practices at some point during the 5-year study period. After restricting the analysis to psychiatrists who were full-time in all study years, 5850 observations on 1170 psychiatrists remained (see Figure 1).
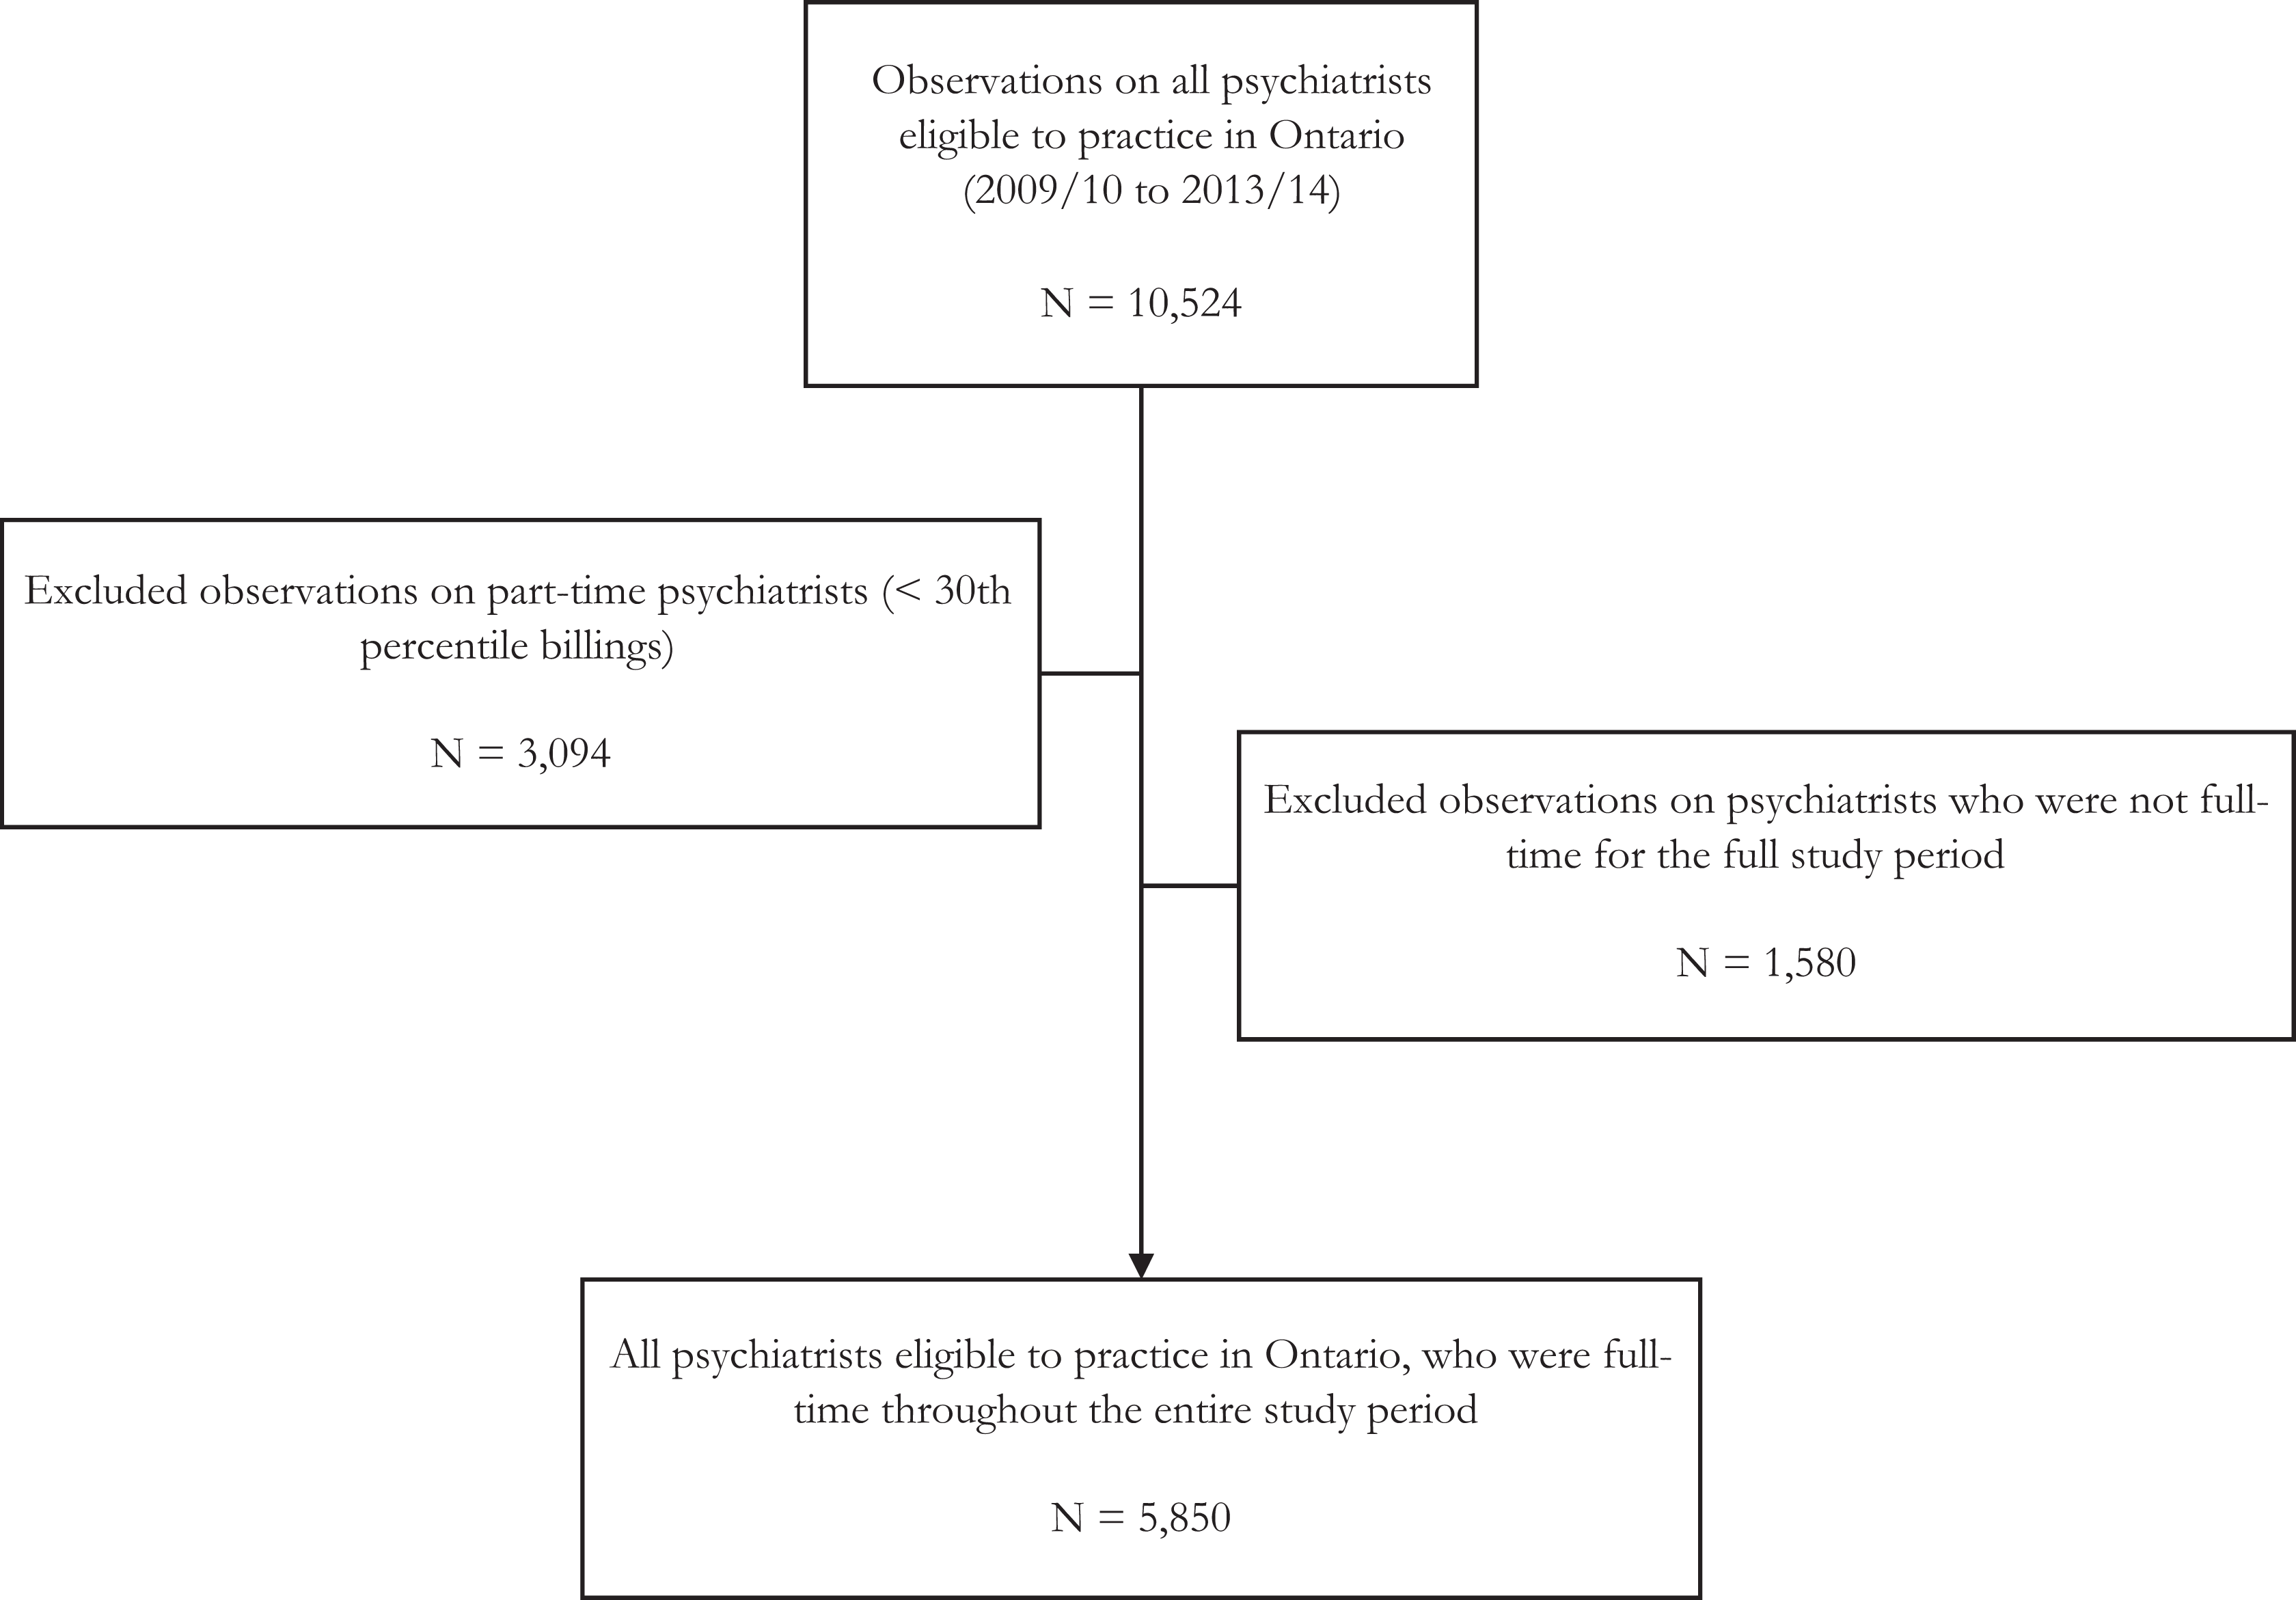
Psychiatrist cohort flow diagram.
Figure 2 is a cumulative function of the number of new outpatients seen annually for all included psychiatrists. The figure demonstrates that 20% of full-time psychiatrists saw 25 or fewer new outpatients annually, while 10% saw 13 or fewer.
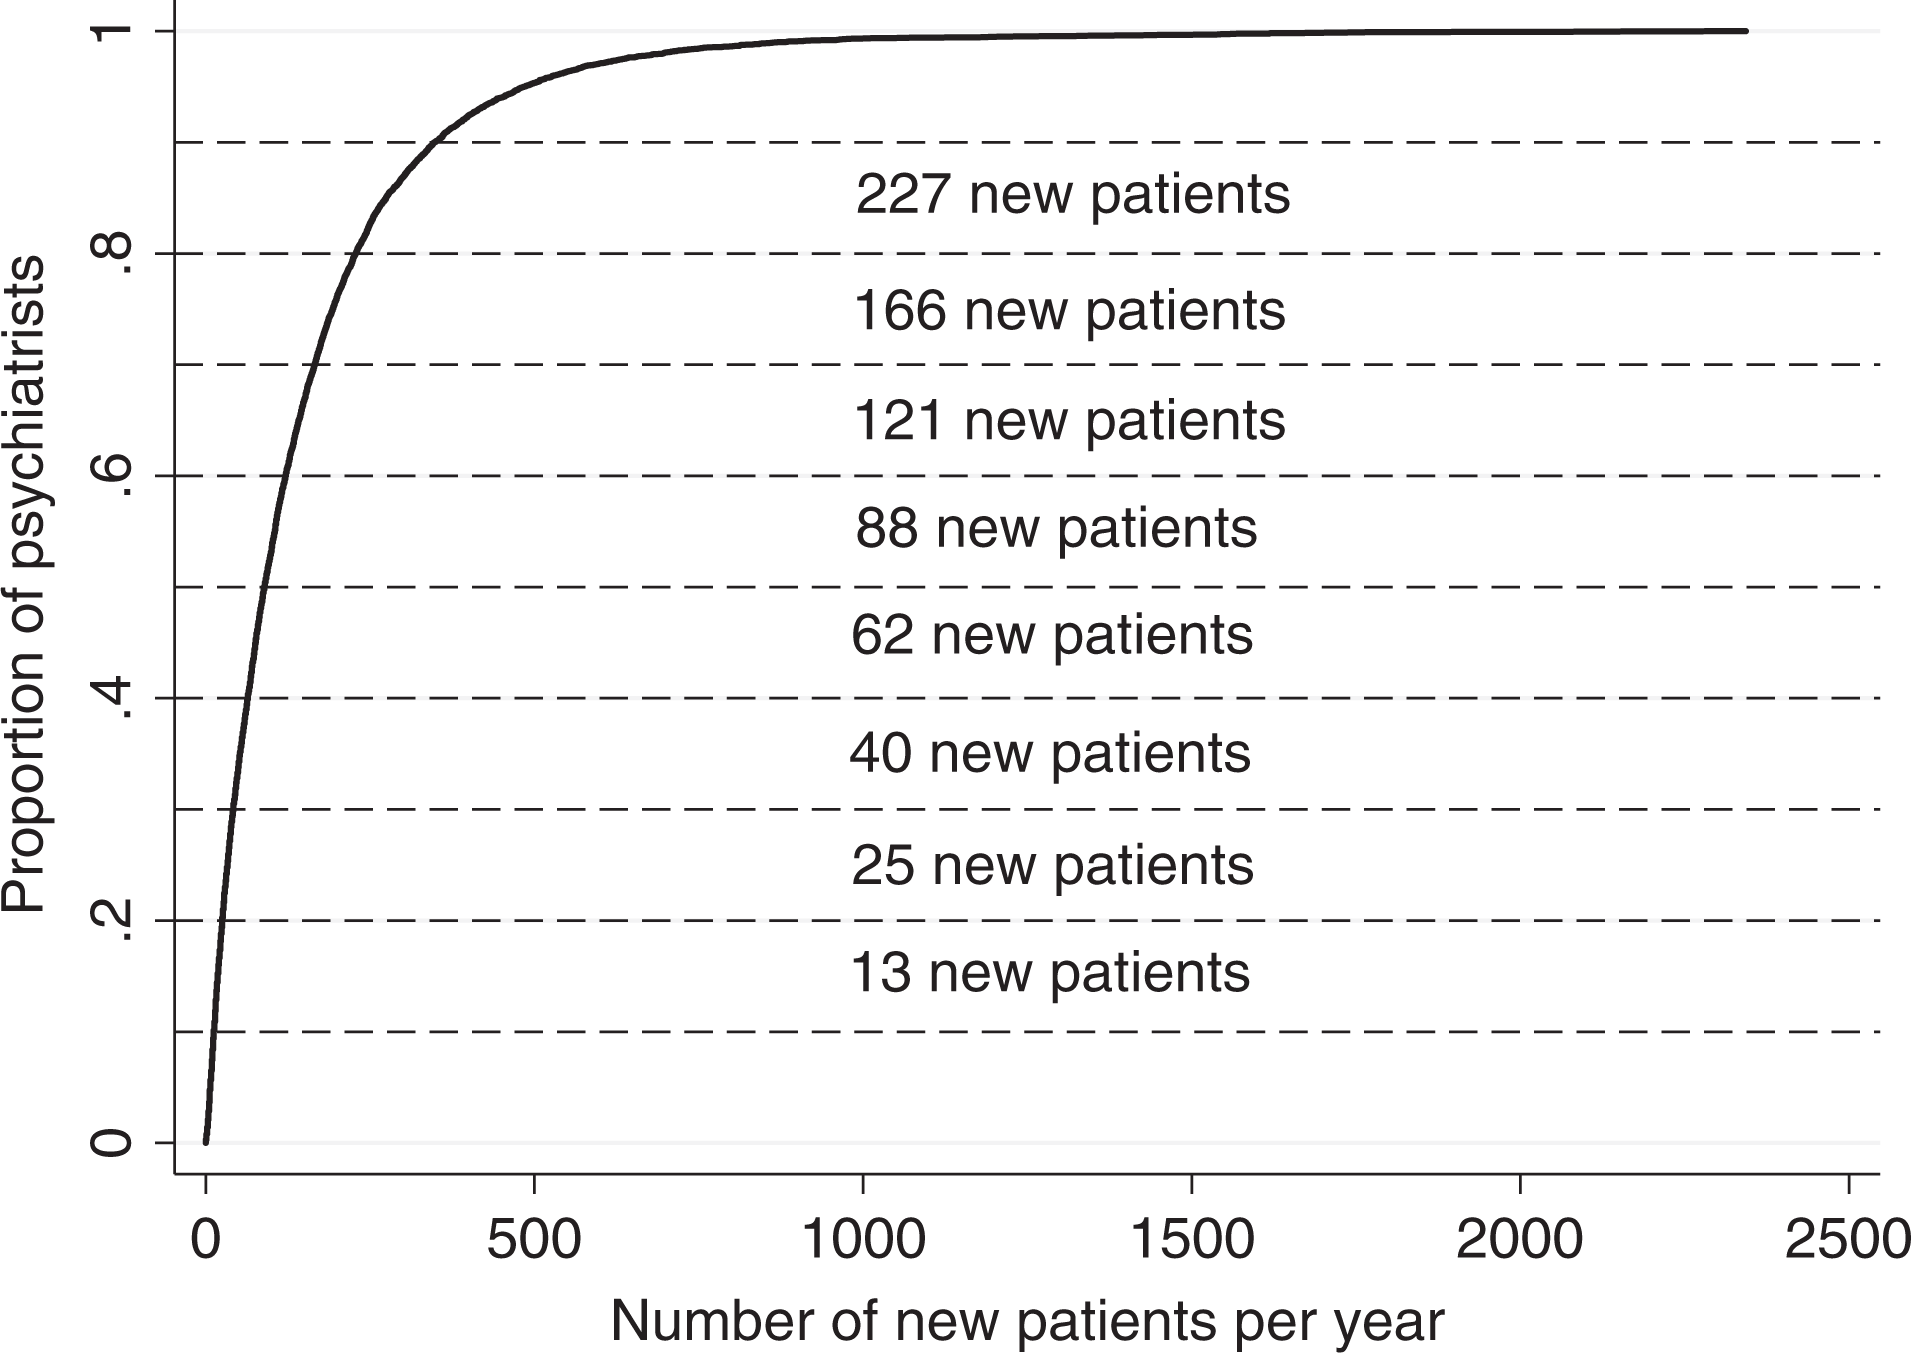
Cumulative distribution of the number of new patients seen per year. The y-axis is the proportion of full-time practicing psychiatrists in Ontario, Canada, in all years of the study period (2009-2010 to 2013-2014). The x-axis is the number of new patients seen per year.
Concomitant Mixture Model Estimation
Table 1 shows the fit statistics for the mixture model. The log-likelihood and AIC statistics improved as the number of classes increased; however, the BIC statistic was lowest and, therefore, the best at 3 classes. Model fit also improved when we estimated a concomitant model. To limit the chance of overfitting, we interpreted the 3-class concomitant model, which was the most parsimonious model suggested by the fit statistics.
Fit Statistics for Mixture Model.
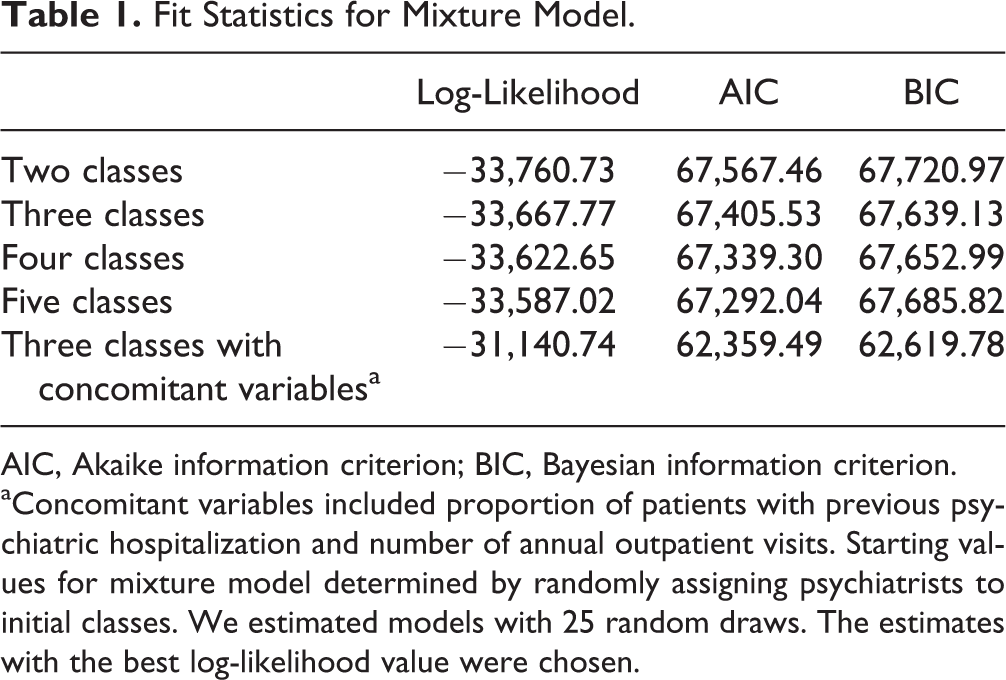
AIC, Akaike information criterion; BIC, Bayesian information criterion.
aConcomitant variables included proportion of patients with previous psychiatric hospitalization and number of annual outpatient visits. Starting values for mixture model determined by randomly assigning psychiatrists to initial classes. We estimated models with 25 random draws. The estimates with the best log-likelihood value were chosen.
The estimated probabilities of class assignment generated by the mixture model were used to assign psychiatrists to 1 of 3 classes. Class 1 was the largest, accounting for 2564 observations (43.3% of the sample). Class 2 was the smallest, accounting for 1576 observations (27.4% of the sample). Class 3 accounted for 1710 observations (29.2% of the sample). These groups were largely consistent over time; 72% of psychiatrists remained in one practice style (or class) over the study period.
Table 2 contains descriptive statistics comparing psychiatrist classes. We standardized differences and treated class 1 as the base case for all comparisons.
Descriptive Statistics by Psychiatrist Class.
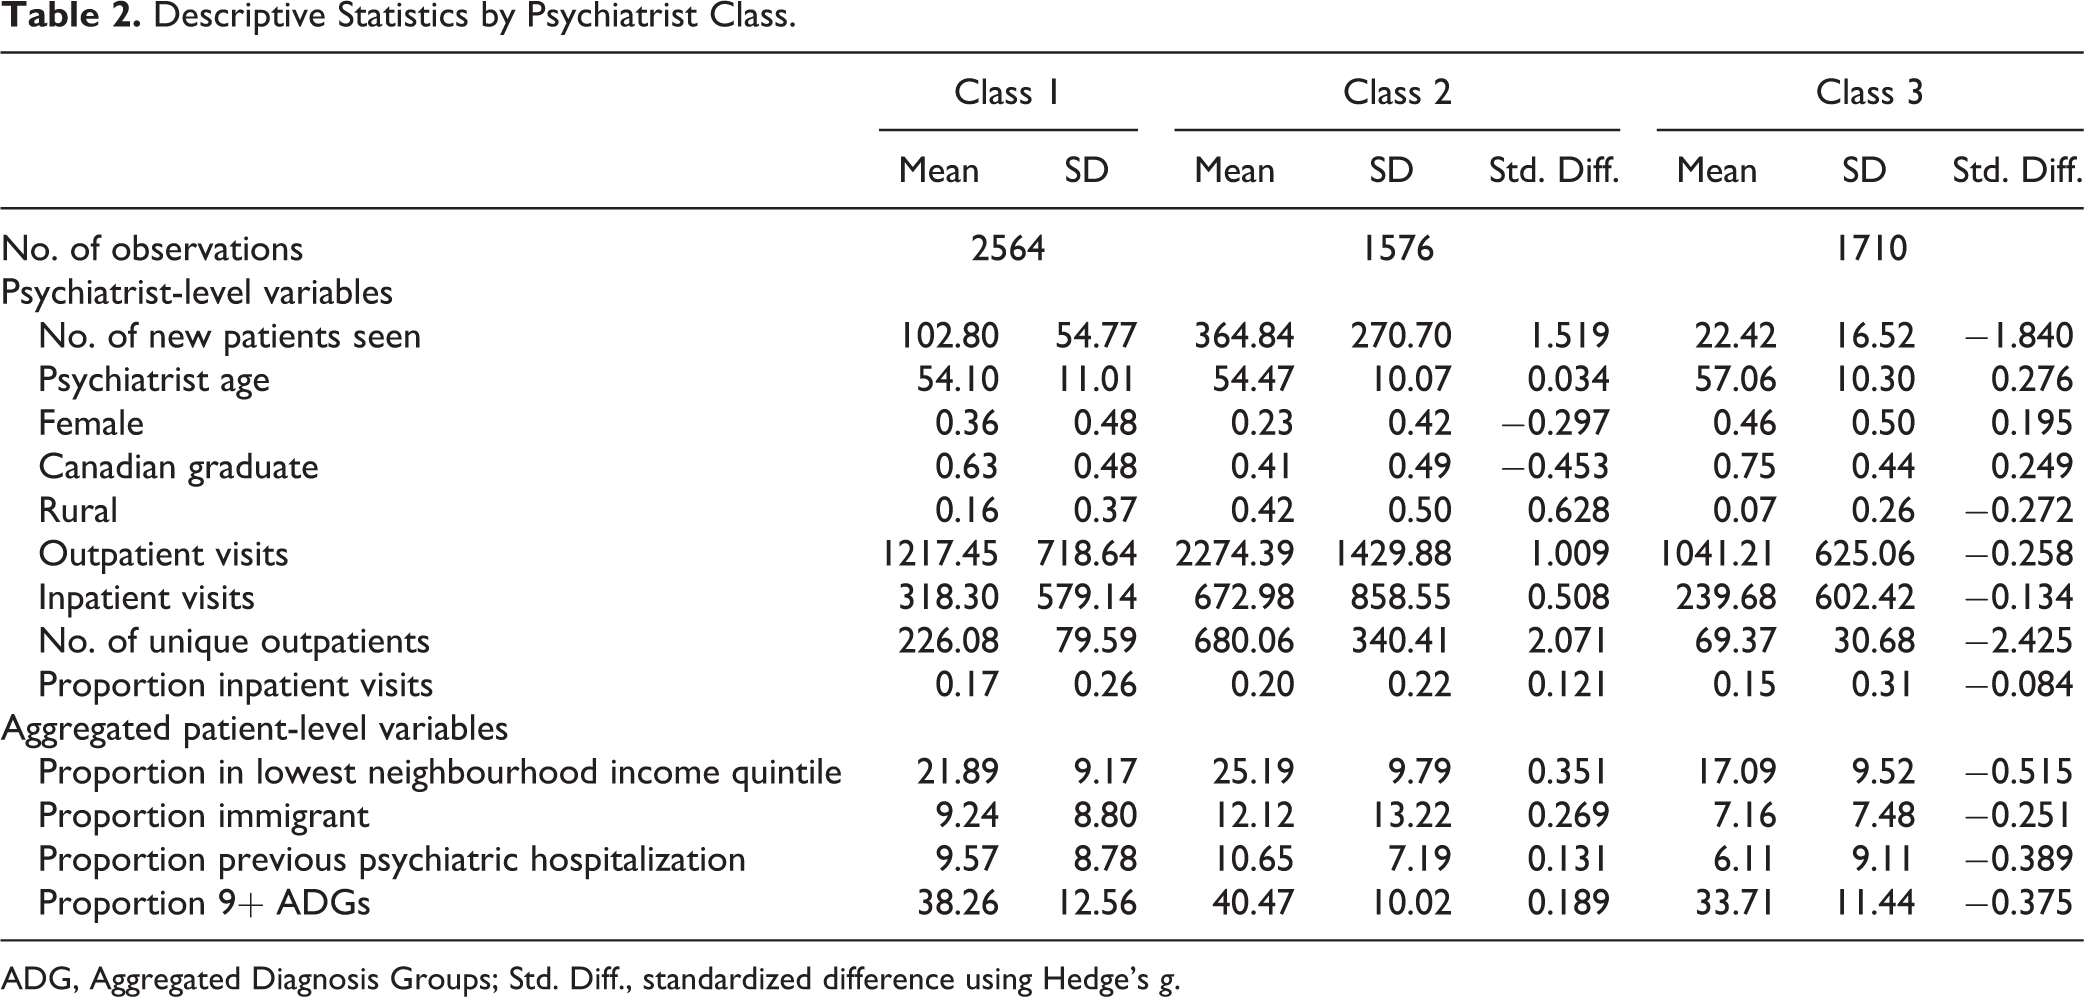
ADG, Aggregated Diagnosis Groups; Std. Diff., standardized difference using Hedge’s g.
Class 1: High-volume urban practice, with complex patient population
On average, class 1 psychiatrists saw 103 new outpatients annually. The minority were female (36%), the majority trained in Canada (63%), and the minority practiced in rural settings (16%). Class 1 psychiatrists saw 226 unique outpatients annually and provided 1217 outpatient visits. Approximately 17% of their total visits were dedicated to inpatient care. As a percentage of their total practice, 22% of their outpatients lived in the lowest income neighbourhoods, 9% were immigrants, 10% had a psychiatric hospitalization in the previous year, and 38% had 9 or more ADGs.
Class 2: High-volume practice, with complex patient population
On average, class 2 psychiatrists saw a greater number of new outpatients annually than class 1 psychiatrists (365 vs. 103, standardized difference = 1.519). Relative to class 1, psychiatrists in class 2 were less likely to be female (23% vs. 36%, standardized difference = −.297) and less likely to be trained in Canada (41% vs. 63%, standardized difference = −.453). They were also more likely to practice in rural communities (42% vs. 16%, standardized difference = .628). They also provided a greater quantity of outpatient visits (2274 vs. 1217, standardized difference = 1.009) and saw more unique outpatients (680 vs. 226, standardized difference = 2.071).
Aggregated outpatient characteristics were also different across classes. As a proportion of their practice, psychiatrists in class 2 saw more outpatients in the lowest neighbourhood income quintile (25% vs. 22%, standardized difference = .351) and more outpatients who were immigrants (12% vs. 9%, standardized difference = .269) compared to class 1 psychiatrists. However, the standardized differences were not as pronounced with respect to the proportion of outpatients with a psychiatric hospitalization in the previous year (11% vs. 10%, standardized difference = .131) or the proportion of outpatients with 9 or more unique diagnoses (40% vs. 38%, standardized difference = .189).
Class 3: Low-volume urban practice, with healthier patient population
On average, class 3 psychiatrists saw fewer new outpatients annually (22 vs. 103, standardized difference = −1.840) than class 1 psychiatrists. Relative to class 1, class 3 psychiatrists tended to be older (57 vs. 54, standardized difference = .276), were more likely to be trained in Canada (75% vs. 63%, standardized difference = 0.249), were less likely to practice in rural communities (7% vs. 16%, standardized difference = −.272), provided fewer outpatient visits (1041 vs. 1217, standardized difference = −.258), and saw fewer unique outpatients (69 vs. 226, standardized difference = −2.425).
As a proportion of their practice, psychiatrists in class 3 saw fewer outpatients in the lowest neighbourhood income quintile (17% vs. 22%, standardized difference = −.515), fewer outpatients who were immigrants (7% vs. 9%, standardized difference = −.251), fewer outpatients with a psychiatric hospitalization in the previous year (6% vs. 10%, standardized difference = −.389), and fewer outpatients with 9 or more unique diagnoses (34% vs. 38%, standardized difference = −.375).
Mixture Model Estimation: Negative Binomial
Table 3 contains the results of the mixture of regression models. The concomitant variable results suggest that the proportion of outpatients seen with a previous psychiatric hospitalization and the number of outpatient visits were positively associated with being assigned to class 2 and negatively associated with being assigned to class 3 (compared to class 1).
Finite Mixture Model Results.
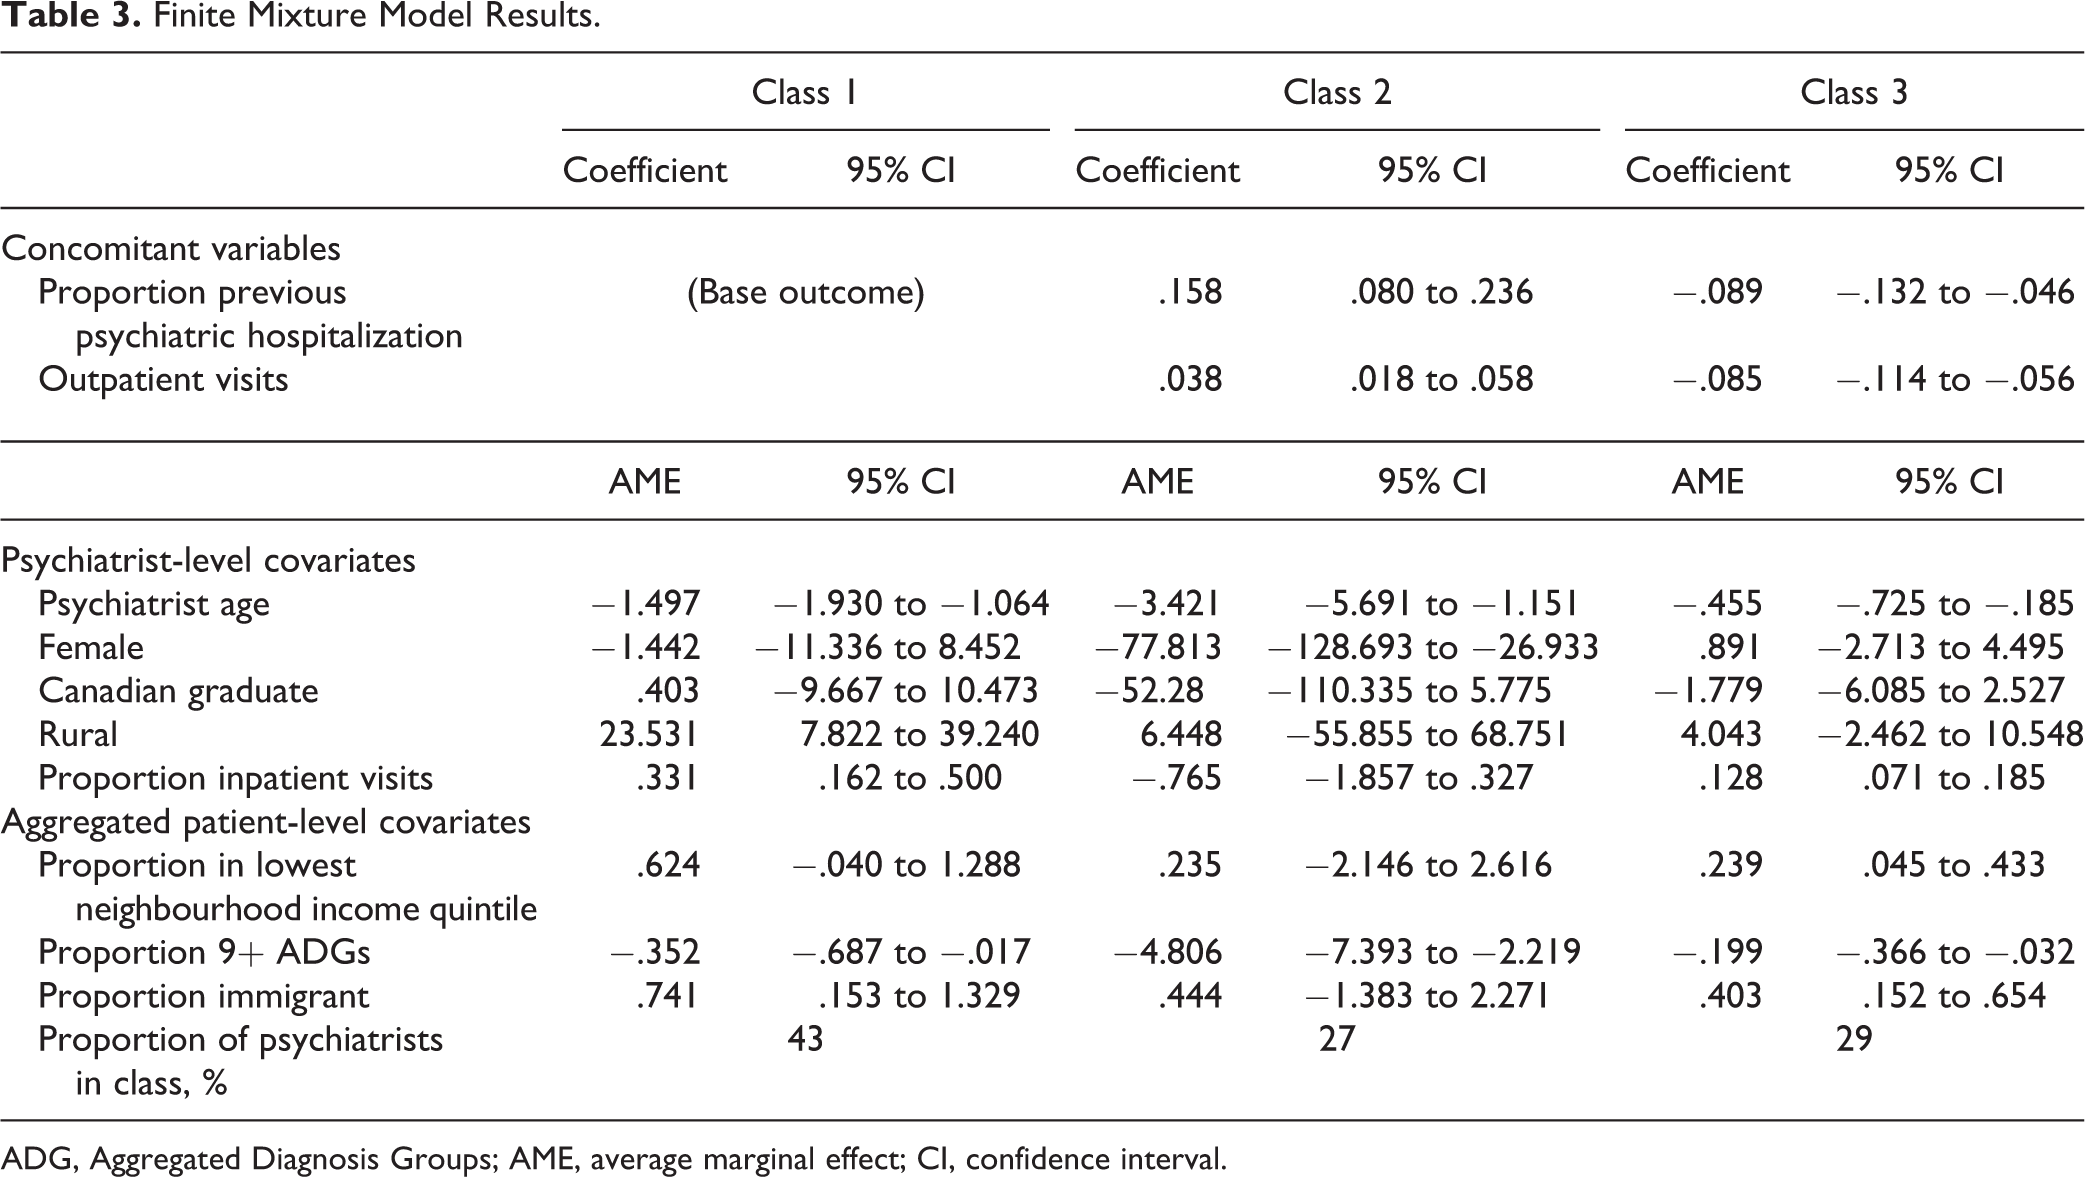
ADG, Aggregated Diagnosis Groups; AME, average marginal effect; CI, confidence interval.
Results of the negative binomial estimates suggest that psychiatrist age was negatively associated with seeing new outpatients in class 1 (AME = −1.497; 95% confidence interval [CI], −1.930 to −1.064), class 2 (AME = −3.421; 95% CI, −5.691 to −1.151), and class 3 (AME = −.455; 95% CI, −.725 to −.185). Female psychiatrists saw fewer new outpatients (AME = −77.813; 95% CI, −128.693 to −26.933) than their male counterparts in class 2 but not in the other 2 classes. Being trained in Canada was also associated with seeing fewer new outpatients (AME = −52.280; 95% CI, −110.335 to 5.775), but only in class 2. A 1% increase in the proportion of total visits dedicated to inpatient care was associated with seeing .331 (95% CI, .162 to .500) and .128 (95% CI, .071 to .185) new outpatients in classes 1 and 3, respectively.
Aggregated outpatient characteristics were also important factors. A 1% increase in the proportion of outpatients seen who lived in the lowest income neighbourhoods was associated with seeing .624 (95% CI, −.040 to 1.288) and .239 (95% CI, .045 to .433) new outpatients in classes 1 and 3, respectively. Similarly, a 1% increase in the proportion of outpatients seen who were immigrants was associated with a .741 (95% CI, .153 to 1.329) and .403 (95% CI, .152 to .654) increase in the number of new outpatients seen in classes 1 and 3, respectively. We observed the opposite effect with comorbidity. As a proportion of all outpatients seen, seeing more outpatients with 9 or more diagnoses was negatively associated with seeing new outpatients in class 1 (AME = −.352; 95% CI, −.687 to −.017), class 2 (AME = −4.806; 95% CI, −7.393 to −2.219), and class 3 (AME = −.199; 95% CI, −.366 to −.032).
Discussion
Our analysis of the population of full-time psychiatrists in Ontario, Canada, revealed that approximately 10% of full-time psychiatrists are seeing about 1 new outpatient per month, and 20% are seeing about 2 or fewer new outpatients per month. While these psychiatrists are not operating strictly closed practices, they are focusing most of their time on existing patients.
A mixture model of the number of new outpatients seen revealed at least 3 different psychiatrist styles. Furthermore, the majority of psychiatrists remained in the same practice style over the 5-year study period. The psychiatrists who saw the least new outpatients belong to a practice style (representing 29% of psychiatrists) that is almost exclusively based in urban communities (93%) and comprises mostly Canadian-trained psychiatrists. They deliver high-intensity care to a small number of outpatients (69 on average), and relative to other practice styles, their outpatients tend to be healthier, are less likely to live in low-income neighbourhoods, and are less likely to be immigrants.
These psychiatrists are not the dominant style of psychiatric practice in Ontario. Two other practice styles provide higher volume care to more complex patient populations, and their practices are more accessible to new patients. The most common practice style (representing 43% of psychiatrists) is typically urban (84%) and provides a moderate volume of care (relative to the other practice styles) in terms of the number of unique outpatients seen, the number of new outpatients seen, and the number of total outpatient visits provided.
A third practice style (representing 27% of psychiatrists) is more likely to practice in rural communities (42%) and sees a higher volume of outpatients, new outpatients, and total outpatient visits. It is possible that psychiatrists in rural communities have less control over their practice volume than those in urban communities, where there are more alternative sources of psychiatric and other mental health services. Despite the differences in volume, the case mix of the outpatients in the latter 2 practice styles was similar in terms of the severity of mental illness and comorbidity.
The predictors of seeing new outpatients were also different across practice styles, which highlights the benefits of the mixture modelling approach. Previous studies have demonstrated that female psychiatrists tend to supply lower volumes than their male counterparts. 10 Similarly, we find that female psychiatrists are more likely to practice in classes 1 and 3 than in class 2. However, controlling for other covariates, they tend to perform similarly to their male counterparts within classes 1 and 3. On the other hand, in the highest volume practices (i.e., class 2), we find that being a female psychiatrist is negatively associated seeing new outpatients. In addition, conditional on other covariates, Canadian training is associated with seeing fewer new outpatients in the highest volume practices. In lower volume practices, important predictors of seeing new outpatients include seeing a higher proportion of immigrants and patients living in low-income communities. Within these practices, there is a relationship between being open to new patients and providing care to potentially disadvantaged populations.
Closed and Partially Closed Practices
Our findings regarding partially closed psychiatrist practices are consistent with self-reported physician data from the National Physician Survey. 25 In 2010, 7% of psychiatrists reported having closed practices and 36% reported having partially closed practices. Of those with closed practices, 39% reported seeing 20 or fewer new patients annually.
These statistics resemble those reported by primary care physicians, 41% of whom reported having a partially closed practice, with 21% of those seeing 20 or fewer new patients annually. Psychiatrist practices look different from other medical specialties. For instance, only 14% of internal medicine specialists (including cardiology, medical oncology, and general internal medicine) reported having closed or partially closed practices.
These comparisons raise questions about the role of psychiatrists within publicly funded health care systems. Should they provide care in a similar way as other medical specialists? Or should they focus on providing continuous care? Our findings on case mix, in particular the low rate of prior hospitalizations in the low-volume class, also raise questions about the degree to which psychiatrists, as a group, align their practice styles with need for specialty mental health care. In other advanced health care systems, policy makers have contended with these questions. For instance, in Australia, the national government cut insurance rebates for patients who received more than 50 psychiatry visits per year. 26 In the United States, behavioural health carve-outs introduced incentives to permit other mental health providers (e.g., psychologists) to deliver ongoing psychotherapy at lower costs. 27,28
Decisions around the appropriate role of psychiatrists may be controversial since it would imply an infringement on independent physician practice and clinical autonomy, but similar policy approaches could be considered in Canada to address access issues. Other jurisdictions have improved the availability of alternative specialist mental health services to complement consultative psychiatric care and provide lower cost substitutes for psychotherapy. 27 Access to alternative specialist mental health care may hold some potential to address access concerns. Currently, provincial health insurance plans largely exclude these professionals.
Limitations and Strengths
This study has some limitations. First, information on psychiatrist practice characteristics was limited in the administrative data. As a result, some of our variables may suffer from construct validity. For instance, we used previous psychiatric hospitalization as a proxy for severity of mental illness. We also did not capture data on psychiatrists who practice under alternative payment plays (e.g., salary). In 2015-2016, alternative payments accounted for 8.2% of total clinical payments to psychiatrists in Ontario. 29 Second, mixture modelling approaches are highly data driven and are subject to potential overfitting. To counter this, we relied on AIC and BIC statistics to guide our model selection. Where these statistics conflicted, we chose the most parsimonious model. Another potential limitation of the mixture modelling approach is that we must assume the distribution of the outcome is the same for all practice styles. It could be the case that different practice styles have different distributions for the outcome. Finally, our model is descriptive in that it does not demonstrate causal relationships between any of the covariates and the number of new outpatients seen. All results should be interpreted as associations.
Our study also has a number of strengths. We believe the mixture modelling approach was successful in identifying 3 unique psychiatrist practice styles. This added considerable insight to previous studies of psychiatrist supply and provides new information about the accessibility of psychiatric care, particularly for patients with a recent diagnosis of mental illness. Our results also have a high degree of external validity, as we were able to conduct this analysis on the full population of full-time fee-for-service psychiatrists in Ontario.
Conclusion
In summary, we provide evidence that nearly a third of psychiatrists have selected a style of practice where they accept few new patients annually. These psychiatrists also see patients who are healthier and less likely to live in low-income neighbourhoods. This has implications for access to care, particularly for newly diagnosed patients. It also highlights the continued need to address access issues by assessing the role of psychiatrists within the Canadian health care system.
Supplemental Material
Supplemental Material, 828963Table_A1 - Closed for Business? Using a Mixture Model to Explore the Supply of Psychiatric Care for New Patients: Fermé au public? Utiliser une densité mélange pour explorer l’offre de soins psychiatriques à de nouveaux patients
Supplemental Material, 828963Table_A1 for Closed for Business? Using a Mixture Model to Explore the Supply of Psychiatric Care for New Patients: Fermé au public? Utiliser une densité mélange pour explorer l’offre de soins psychiatriques à de nouveaux patients by David Rudoler, Claire de Oliveira, Juveria Zaheer and Paul Kurdyak in The Canadian Journal of Psychiatry
Footnotes
Acknowledgements
We thank Maria Eberg for her help with the data set creation process.
Data Access Statement
The data set from this study is held securely in coded form at ICES. While data-sharing agreements prohibit ICES from making the data set publicly available, access may be granted to those who meet prespecified criteria for confidential access, available at www.ices.on.ca/DAS. The full data set creation plan and underlying analytic code are available from the authors upon request, understanding that the programs may rely upon coding templates or macros that are unique to ICES.
Declaration of Conflicting Interests
The author(s) declared no potential conflicts of interest with respect to the research, authorship, and/or publication of this article.
Funding
The author(s) disclosed receipt of the following financial support for the research, authorship, and/or publication of this article: This study was supported by ICES, which is funded by an annual grant from the Ontario Ministry of Health and Long-Term Care (MOHLTC). The opinions, results, and conclusions reported in this article are those of the authors and are independent from the funding sources. No endorsement by ICES or the Ontario MOHLTC is intended or should be inferred. Parts of this material are based on data and information compiled and provided by the Canadian Institute for Health Information (CIHI). However, the analyses, conclusions, opinions, and statements expressed herein are those of the authors and not necessarily those of CIHI.
Supplemental Material
Supplemental material for this article is available online.
References
Supplementary Material
Please find the following supplemental material available below.
For Open Access articles published under a Creative Commons License, all supplemental material carries the same license as the article it is associated with.
For non-Open Access articles published, all supplemental material carries a non-exclusive license, and permission requests for re-use of supplemental material or any part of supplemental material shall be sent directly to the copyright owner as specified in the copyright notice associated with the article.