
Abstract
Background:
The abnormally high incidence of disorders of glucose metabolism (DGM) in psychotic-spectrum disorders (PSD) has often been attributed to the side effects of antipsychotics and unhealthy lifestyles. The influence of social determinants of health has been largely ignored, despite ample evidence linking social adversity with both PSD and DGM. The aim of this study is to examine the influence of well-established social determinants of health on preclinical levels of glycated hemoglobin (HbA1c) in a sample of first-episode psychosis (FEP) patients.
Methods:
In a sample of newly admitted FEP patients, univariate analyses were used to select the main predictors of HbA1c levels from the following social determinants of health: childhood trauma, immigrant background, visible minority status, and indices of social and material deprivation. The predictors identified in the univariate analyses were tested in multivariate linear regression models including age, sex, BMI, depression, and physical anergia (proxy of sedentary behaviour) as covariates.
Results:
Univariate analyses identified visible minority status and childhood physical abuse as predictors of HbA1c. After controlling for covariates, minority status significantly predicted higher levels of glycated hemoglobin (β = 0.23; P = 0.01), and physical abuse had a marginally significant effect (β = 0.23; P = 0.06). Other predictors were not significantly associated.
Conclusion:
FEP patients from a visible minority or who were victims of childhood physical abuse have higher levels of HbA1c at admission compared with other patients. This might suggest an increase in risk for the development of future DGM. If confirmed, preventive strategies could be tailored for these groups.
Patients with psychosis-spectrum disorders (PSD) have twice the risk of developing diabetes mellitus compared to the general population. 1 This is a concerning public health problem directly implicated in the increased cardiovascular morbimortality and reduced life expectancy observed in PSD. 2,3 The epidemiological association between PSD and disorders of glucose metabolism (DGM), such as diabetes mellitus, has been attributed to the secondary effects of second-generation antipsychotics 4 and lifestyle changes associated with the negative symptoms of psychosis. 5 However, it has been known for more than a century (already in the preneuroleptic era) that schizophrenia and diabetes mellitus often co-occur. 6,7 More recently, meta-analytical evidence has documented the presence of different prediabetic anomalies in first-episode psychosis (FEP) patients. 8 Thus, some patients with PSD might bear an increased vulnerability for the development of DGM—independent of, but aggravated by—the secondary effects of antipsychotic medications and sedentary behaviours. The origin of such shared vulnerability is unknown, but an exploration of potential etiological factors implicated in both syndromes might provide some answers.
Environmental factors known to increase the risk for both syndromes might (partially) account for this relationship. Notably, social determinants of health occurring during childhood and adolescence have been documented to increase the risk for the emergence of both syndromes, providing a conceptual framework to explain this association. Specifically, the most studied social risk factors common to PSD and DGM (examined in each patient population independently) are socioeconomic deprivation, 9 –12 first- and second-generation migration background, 13,14 ethnic minority status, 15 –17 and childhood trauma. 18 –20 The level of evidence linking each of these factors with either PSD or DGM comes from meta-analytic studies (e.g., childhood sexual abuse victim: odds ratio [OR] = 2.38 for psychosis 19 ; OR = 1.43 for obesity 20 ) and national cohort studies (e.g., second-generation migrants: hazard ratio [HR] = 2.25 for psychosis 14 ; OR = 1.49 for obesity 13 ) and has been replicated in different countries (e.g., material deprivation and psychosis: relative risk [RR] = 1.75 in Montreal, Canada 9 ; incidence rate ratio (IRR) = 3.79 in London, England 10 ; IRR = 3.4 in Dublin, Ireland 12 ).
Thus, since social adversity has been demonstrated to be associated with an increased risk in both PSD and DGM, it is plausible that social factors might (partially) explain their frequent coexistence. The objective of the present study is to determine the extent to which social adversity is associated with the physiological control of glucose levels in FEP patients at entry to treatment. We hypothesize that in FEP patients with little or no previous exposure to antipsychotic medication, greater degrees of childhood trauma, higher levels of socioeconomic deprivation, being part of a visible minority, and being an immigrant (first or second generation) will impair preclinical glucose regulation as indicated by higher levels of glycated hemoglobin (HbA1c). The FEP context is ideal to test this hypothesis given the limited prior exposure to antipsychotic medication or to longstanding sedentary lifestyles.
Methods
Participants and Setting
The Prevention and Early Intervention Program for Psychosis (PEPP-Montréal) provides specialized care for all potential cases of FEP in an urban catchment area of just over 300,000 inhabitants in Montreal, Canada. 21 Services comprise assertive case management, psychological and psychosocial interventions, and low-dose antipsychotic medication for a period of 2 years. 21 Inclusion criteria for follow-up at PEPP are age 14 to 35 years, and DSM-IV diagnosis of nonaffective or affective psychotic disorder. Exclusion criteria are organic causes (e.g., epilepsy), IQ lower than 70, and previous exposure to antipsychotic medication of greater than 1-month duration. The Research Ethics Board of the Douglas Mental Health University Institute approved this study; all included participants granted written informed consent.
A research team conducts regular structured assessment of symptoms (Scale for the Assessment of Positive Symptoms [SAPS] 22 ; Scale for the Assessment of Negative Symptoms [SANS] 23 ), social and vocational function (Social and Occupational Functioning Assessment Scale [SOFAS] 24 ), duration of untreated psychosis/illness, 25 medication adherence, and side effects. Interrater reliability coefficients for symptoms range between 0.60 and 0.84.
Outcome Variable: Glycated Hemoglobin
Since FEP patients are young, the presence of a fully developed DGM is not expected. Instead, we relied on detecting variability in HbA1c levels as an indication of the state of glycemic control. 26 The percentage of HbA1c is a function of the amount of plasma glucose available to chemically react (spontaneously) with the circulating hemoglobin molecule during the previous 8 to 12 weeks, 27 acting as an indirect marker of insulin resistance. Clinically, HbA1c levels reflect the average state of glycemic regulation, hence its use for treatment monitoring in diabetes. Thus, measuring HbA1c at admission reflects the state of glycemic control over the previous 3 months (i.e., before entry) while marginally overlapping with previous medication exposure. This minimizes the potential influence of prior medication exposure. HbA1c levels were obtained from standardized clinical laboratory tests.
Predictor Variables: Social Determinants of Health
A brief description of the social adversity variables most consistently associated with both PSD and DGM follows.
The Childhood Trauma Questionnaire (CTQ) 28 was used to assess the degree of exposure to 5 different types of childhood trauma: physical abuse or neglect, emotional abuse or neglect, and sexual abuse. This questionnaire consists of 25 items pertaining to trauma exposure during childhood (5 questions per type of trauma). Individual type and composite scores, as well as critical exposure thresholds, were computed following the authors’ guidelines.
Social and material deprivation indices were obtained from the Institut National de Santé Publique (INSPQ) in Quebec, Canada. 29 These indices are developed from the Canadian census data using 6 socioeconomic indicators that strongly predict health outcomes: the proportions of the population aged 15 years or older with secondary education or equivalent, employment, living alone, and without a stable relationship (separated, divorced, or widowed); the average income of the population aged 15 years or older; and the proportion of single-parent families. These neighbourhood-level indicators of socioeconomic disadvantage are obtained by matching the participants’ postal codes with the INSPQ database.
Visible ethnic minority status was ascribed as being part of a visible minority (dichotomized yes/no) following the Statistics Canada definition: “persons, other than Aboriginal peoples, who are non-Caucasian in race or non-white in colour.” 30 Participants were considered as belonging to a visible minority if they were of non-European ancestry.
Finally, immigrant background refers to a familial history of recent immigration to Canada, either as a first-generation (migrating to Canada after being born elsewhere) or second-generation immigrant (being born in Canada and having at least 1 parent who was born elsewhere).
Potential Confounders
Levels of inactivity (depicting sedentary lifestyle) and depression scores were selected as potential clinical confounders. Scores at entry of physical anergia from the SANS scale 23 were used as a proxy of sedentary lifestyle and those from the Calgary Depression Scale for Schizophrenia 31 as a measure of depressive symptoms. Three biological covariates are included in the analyses: age, sex, and body mass index (BMI). BMI was calculated upon entry into the service by treating clinicians, and it aims to control for differences in body composition. 32 Although patients need to have less than 30 days of pharmacological treatment to be admitted to the program, we assessed the influence of previous pharmacological exposure given the metabolic side effects of antipsychotics and antidepressants. Thus, an index of previous medication exposure was calculated by multiplying the number of days of pharmacological treatment (from date of first treatment to date of HbA1c analysis) by a medication adherence coefficient for the first month of treatment. Medication adherence was rated in percentages (0%, 25%, 50%, 75%, or 100%) by trained research staff. 33
Statistical Analyses
Univariate analyses were conducted first to determine whether each of the social determinants of health and the medication exposure index had a potential influence on the levels of HbA1c. Univariate analyses consisted either of Pearson product-moment correlations between HbA1c and continuous predictors (childhood trauma categories, deprivation indices, medication exposure) or t tests for nominal variables (ethnic minority status, immigrant background). Continuous variables with skewed distributions were treated with logarithmic transformations. The different categories of childhood abuse (physical neglect, physical abuse, emotional neglect, emotional abuse, and sexual abuse) were studied separately as evidence shows that specific types of abuse differentially influence distinct physical and behavioural outcomes. 34,35 Results from univariate analyses were used to select the main predictors in the multivariate analyses. A p value <0.1 was set as the threshold for inclusion. The multivariate hierarchical models follow a theoretical path in which, apart from the relevant social determinants of health, biological, environmental, and psychosis-associated factors are included by blocks, controlling for potential confounding effects. Thus, the first block includes biological confounders (i.e., age, sex, and BMI). The second block includes the indices of material and social deprivation as standalone environmental predictors given their strong association with other examined social determinants of health. 36 The third block includes the main predictors (i.e., the social determinants of health identified in the univariate analyses). The final block includes depression and anergia scores, representing psychosis-associated factors known to be linked to glucose disturbances. Finally, descriptive analyses of each subsample assess their representativeness vis-à-vis the main sample. Data were analyzed using SPSS Statistics 22 (SPSS, Inc., an IBM Company, Chicago, IL).
Results
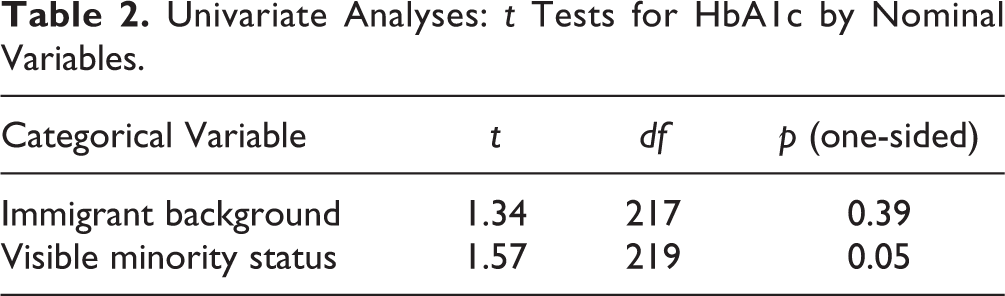
Univariate effects of the predictors of HbA1c are shown in Tables 1 and 2. Childhood physical abuse had a marginally significant positive correlation with HbA1c (r = 0.17; n = 100; P = 0.08). Visible minority status significantly predicted higher levels of HbA1c (t = 1.63; n = 219; P = 0.05). Other social determinants of health did not predict levels of HbA1c. The average number of days of pharmacological treatment prior to the HbA1c testing was 22.8 days (95% confidence interval [CI], 16.9 to 28.7, N = 179), the mean ± SD medication adherence coefficient was 0.81 ± 0.36, and the average medication exposure coefficient was 18.6 (95% CI, 14.2 to 23.0; N = 171). The medication exposure index was not significantly correlated with HbA1c (r = –0.14; n = 130; P = 0.12). No significant difference was found in the levels of childhood physical abuse between visible minority and white participants (t = 0.94; df = 201; P = 0.17). None of the participants had abnormal levels of hemoglobin (Suppl. Table S1). A diagnosis of substance abuse at admission did not significantly predict levels of HbA1c (Suppl. Table S2).
Univariate Analyses: Correlations for Continuous Variables.
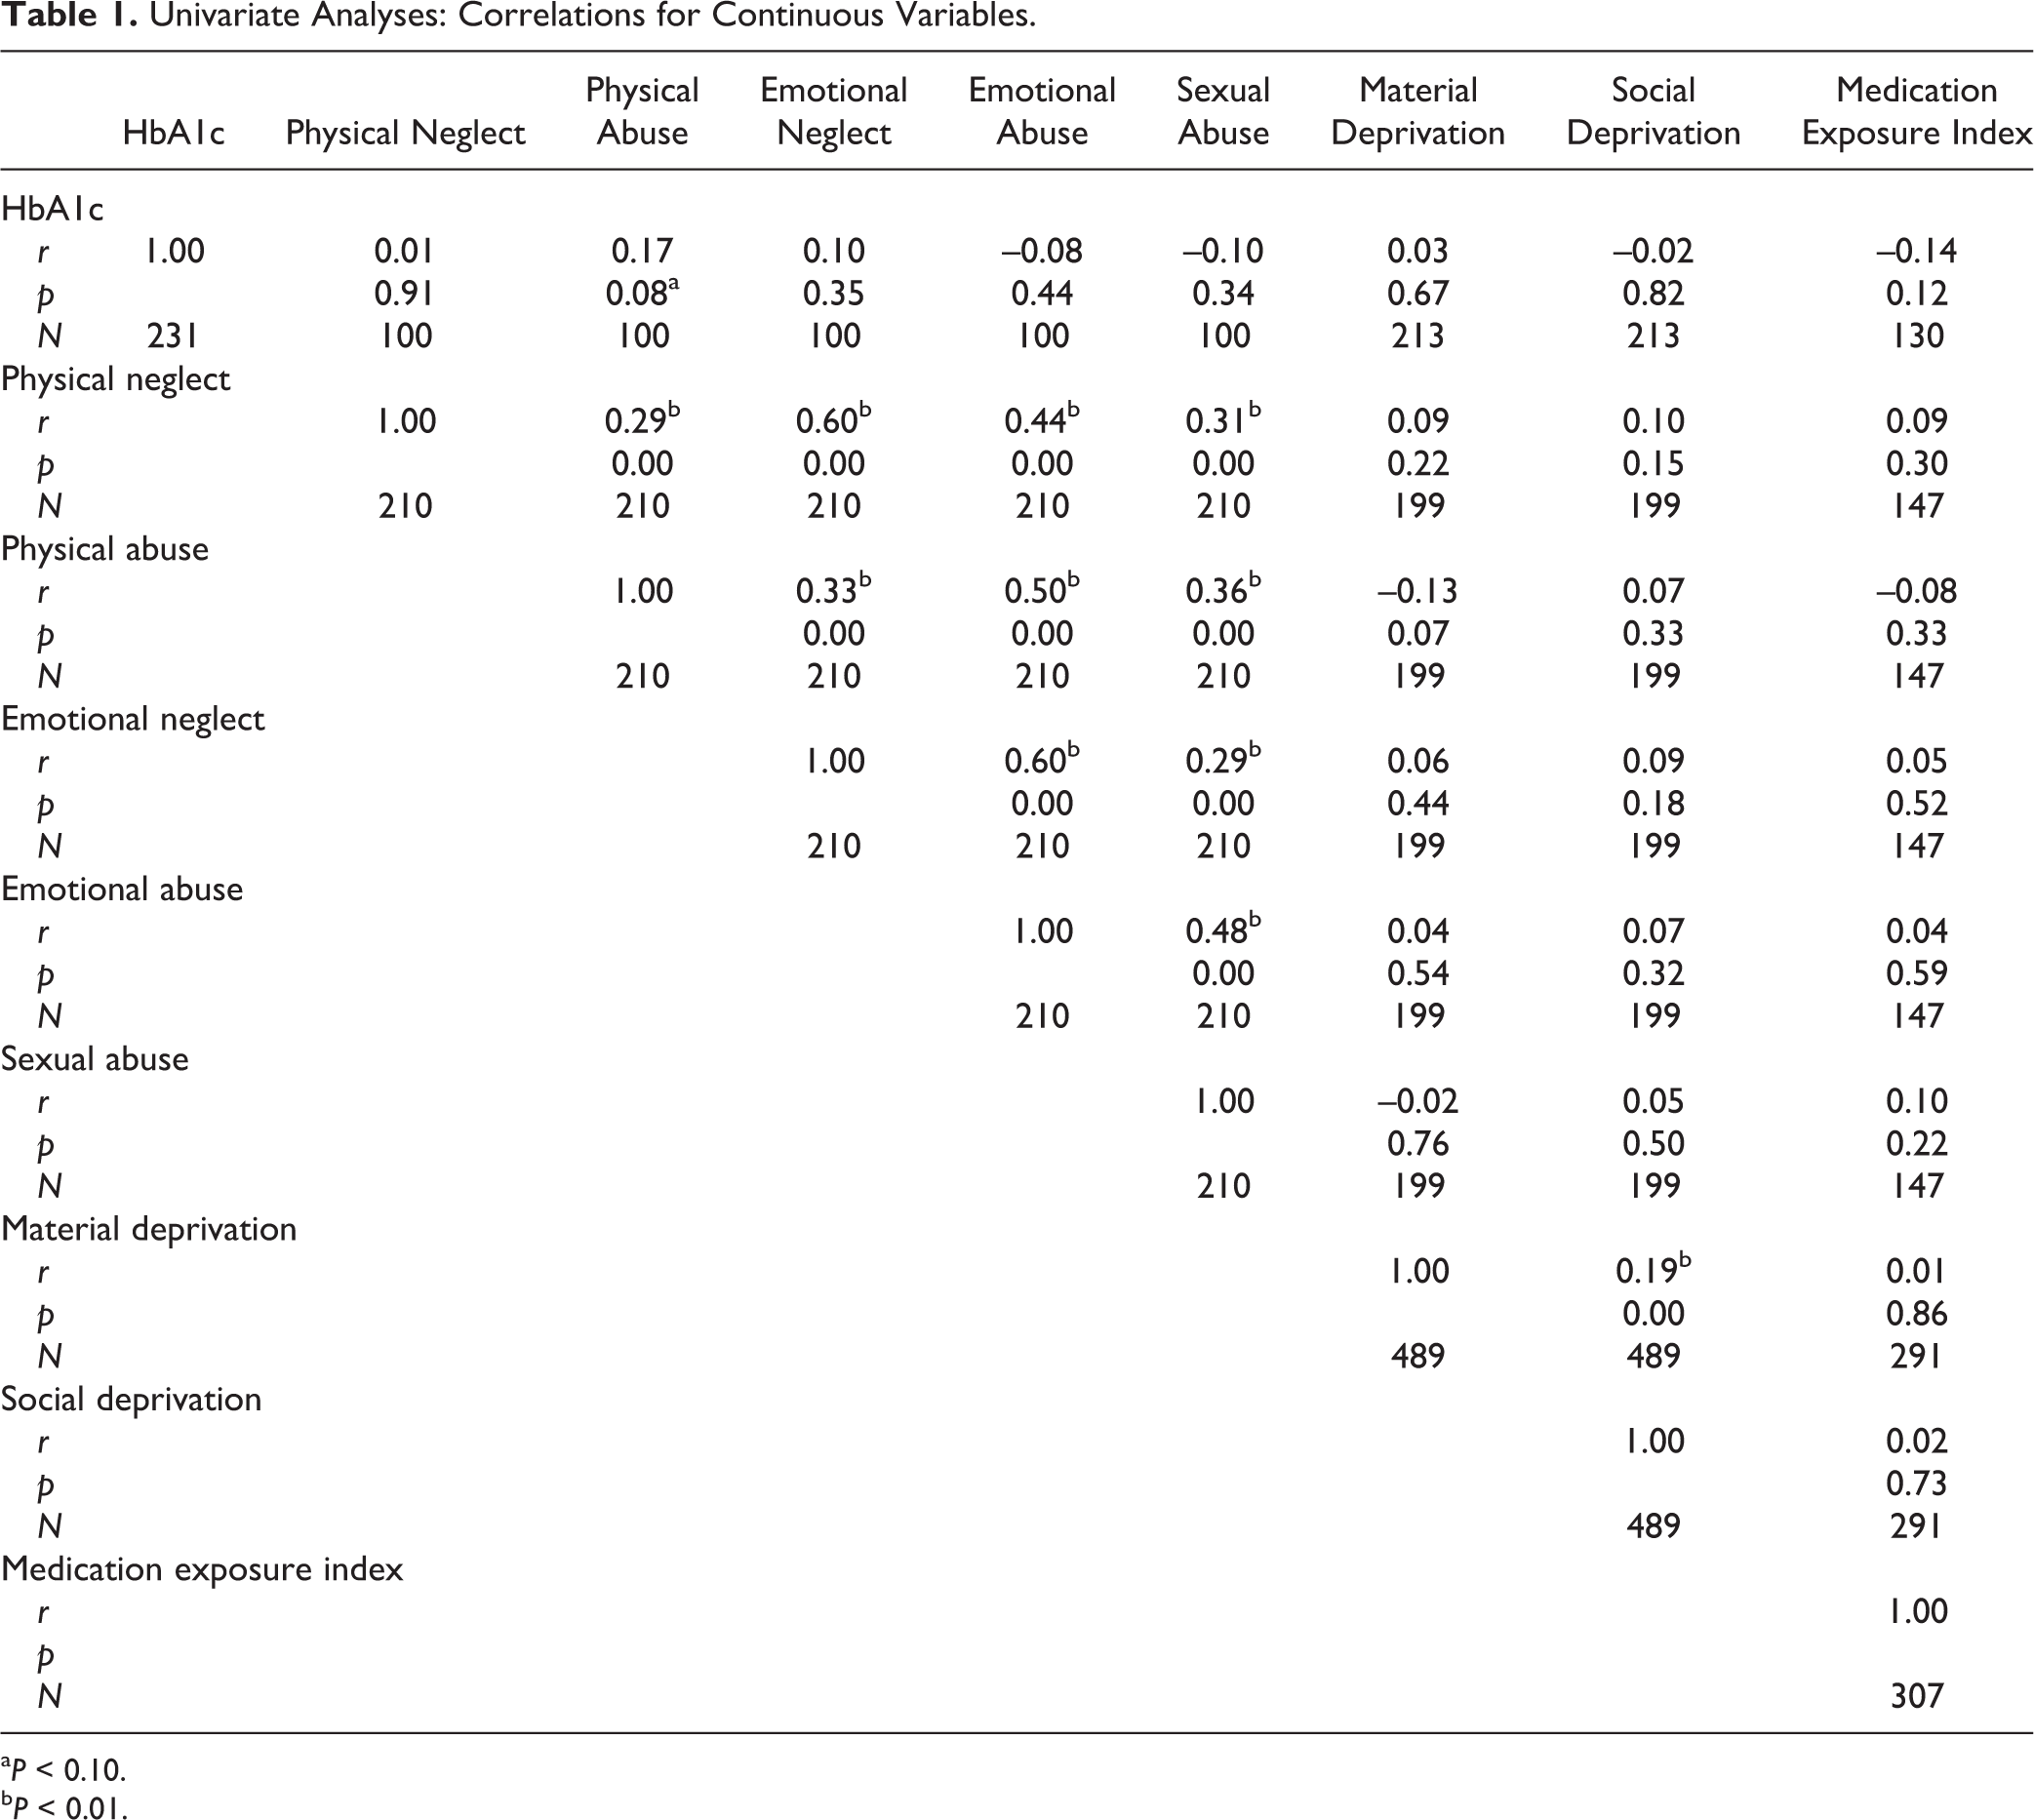
a P < 0.10.
b P < 0.01.
Univariate Analyses: t Tests for HbA1c by Nominal Variables.
Based on the results of the univariate analyses, 2 main multivariate models were analyzed: one testing visible minority status and another testing physical abuse as main predictors. With all other variables controlled for, participants from visible minorities had significantly higher levels of HbA1c (Table 3). Given the reduced number of participants who had answered the CTQ, the neighbourhood indices of deprivation (second block) were dropped in the physical abuse model. The relationship between childhood physical abuse and HbA1c was significant when age, sex, and BMI were accounted for in the model and became marginally significant when adding depression and physical anergia scores (Table 4).
Baseline HbA1c by Visible Minority Controlling for Associated Factors (n = 144).
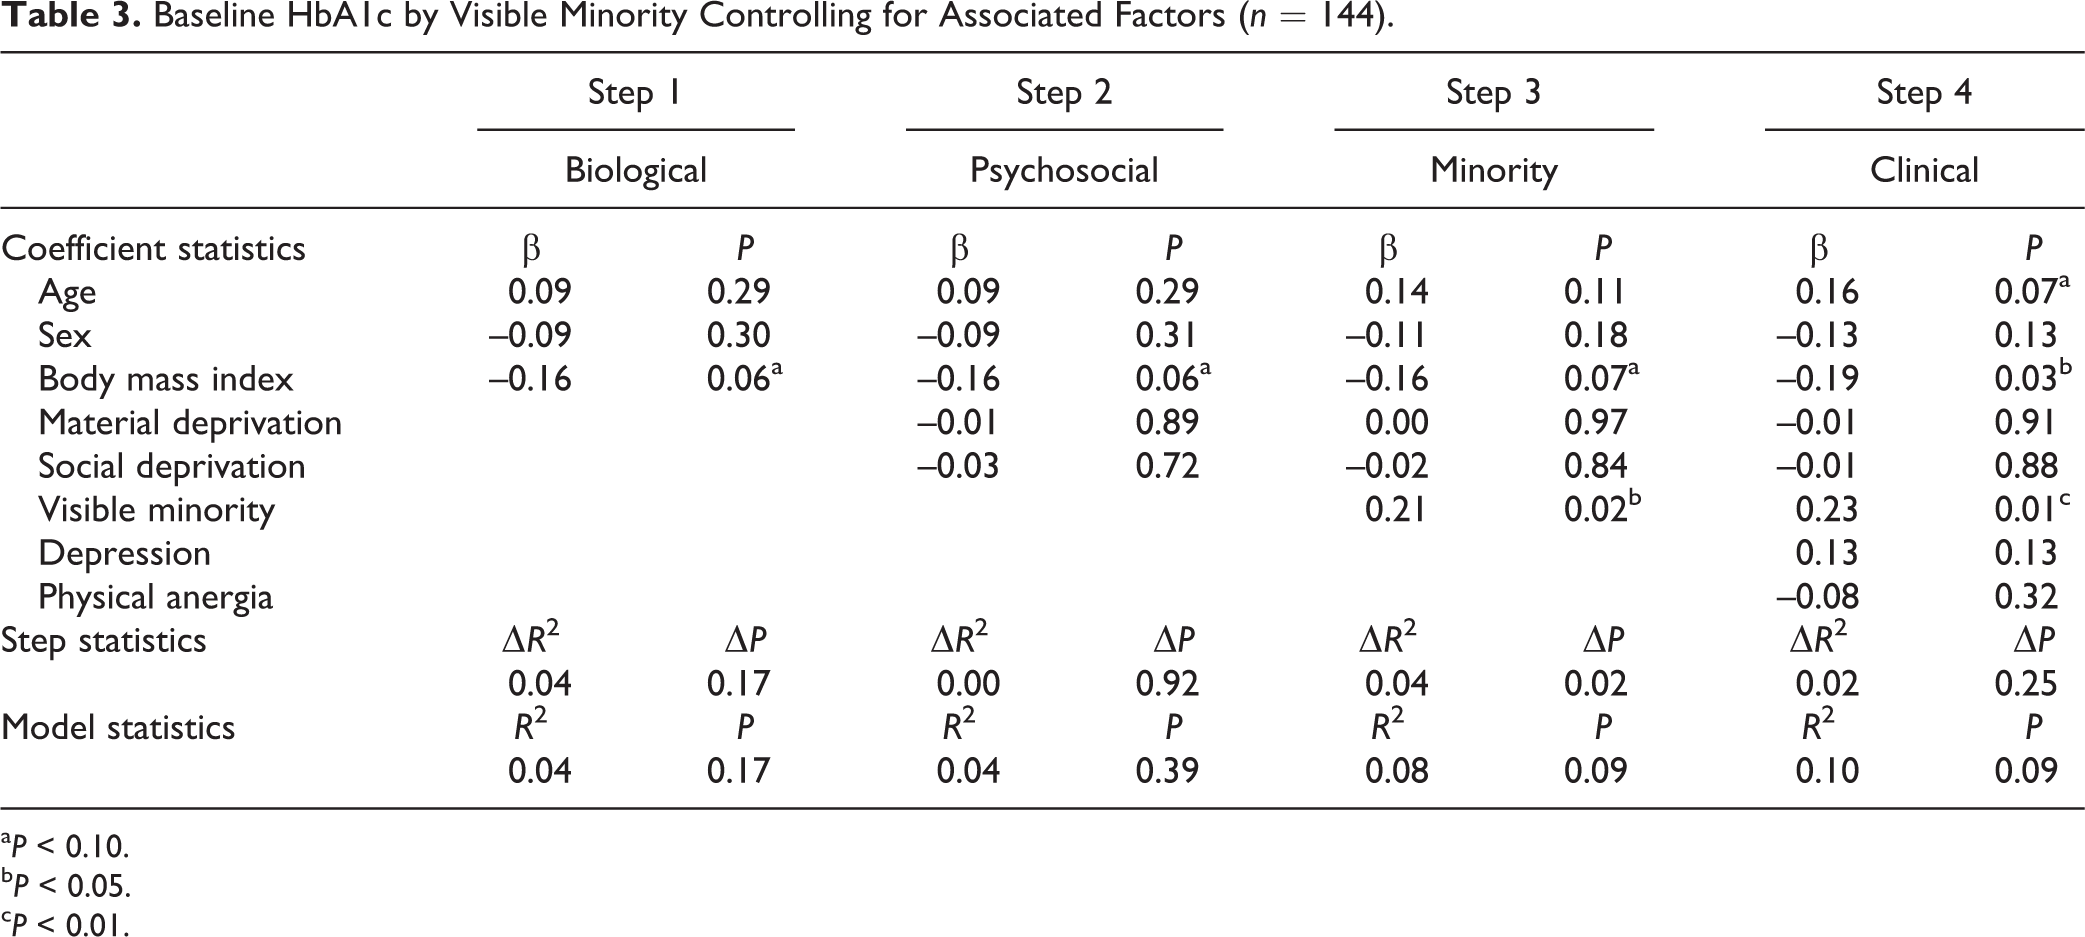
a P < 0.10.
b P < 0.05.
c P < 0.01.
Baseline HbA1c by (log) Physical Abuse in Childhood Controlling for Associated Factors (n = 69).
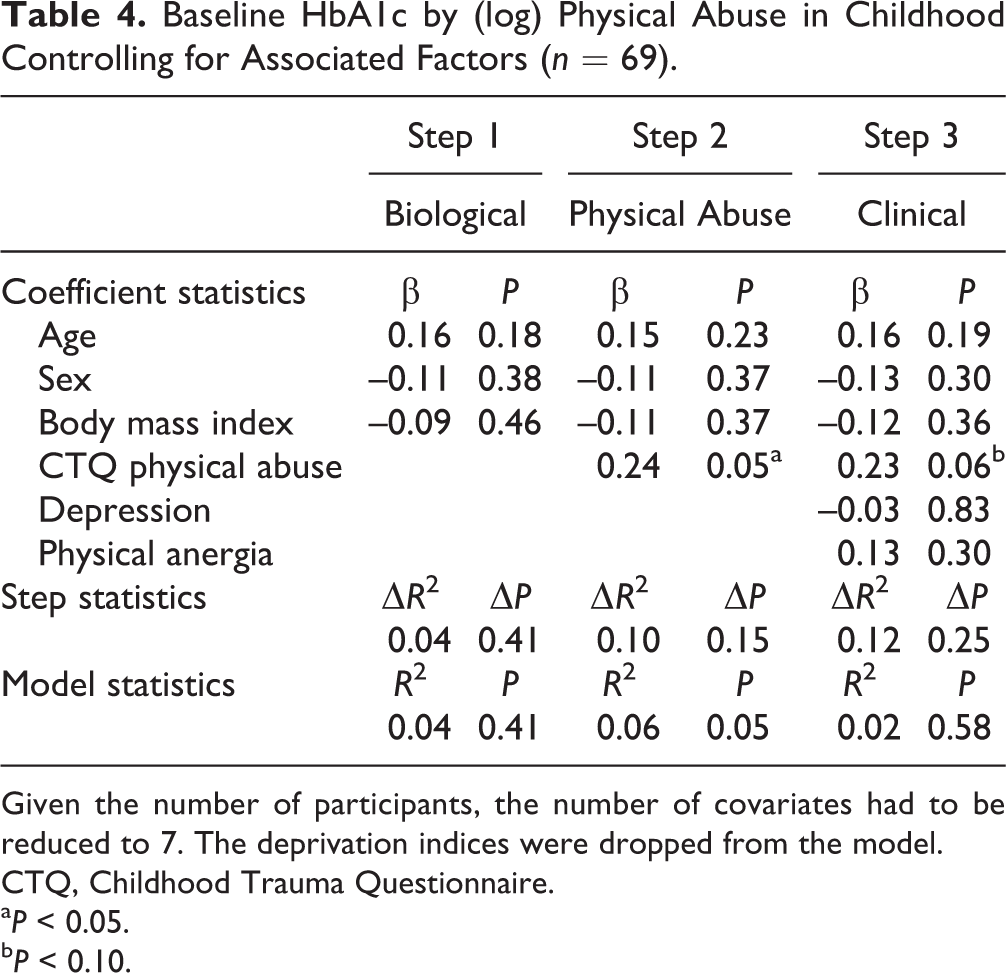
Given the number of participants, the number of covariates had to be reduced to 7. The deprivation indices were dropped from the model.
CTQ, Childhood Trauma Questionnaire.
a P < 0.05.
b P < 0.10.
Not all participants had information on the entire set of variables. Hence, multivariate models have a different number of participants. Demographic comparisons of the subsamples employed in both models versus the main sample were conducted to assess their representativeness (Table 5). In the visible minority model subsample, a significantly lower proportion of participants with a migrant background was found, and a mean age difference of 11 months was marginally significant (included participants were older). There was a nonsignificant trend towards a lower proportion of participants from visible minorities. In the physical abuse model subsample, the average ages varied similarly, but the difference was not statistically significant. No significant differences were found in this subsample.
Demographic Comparisons between the Model Subsamples and the Main Sample.
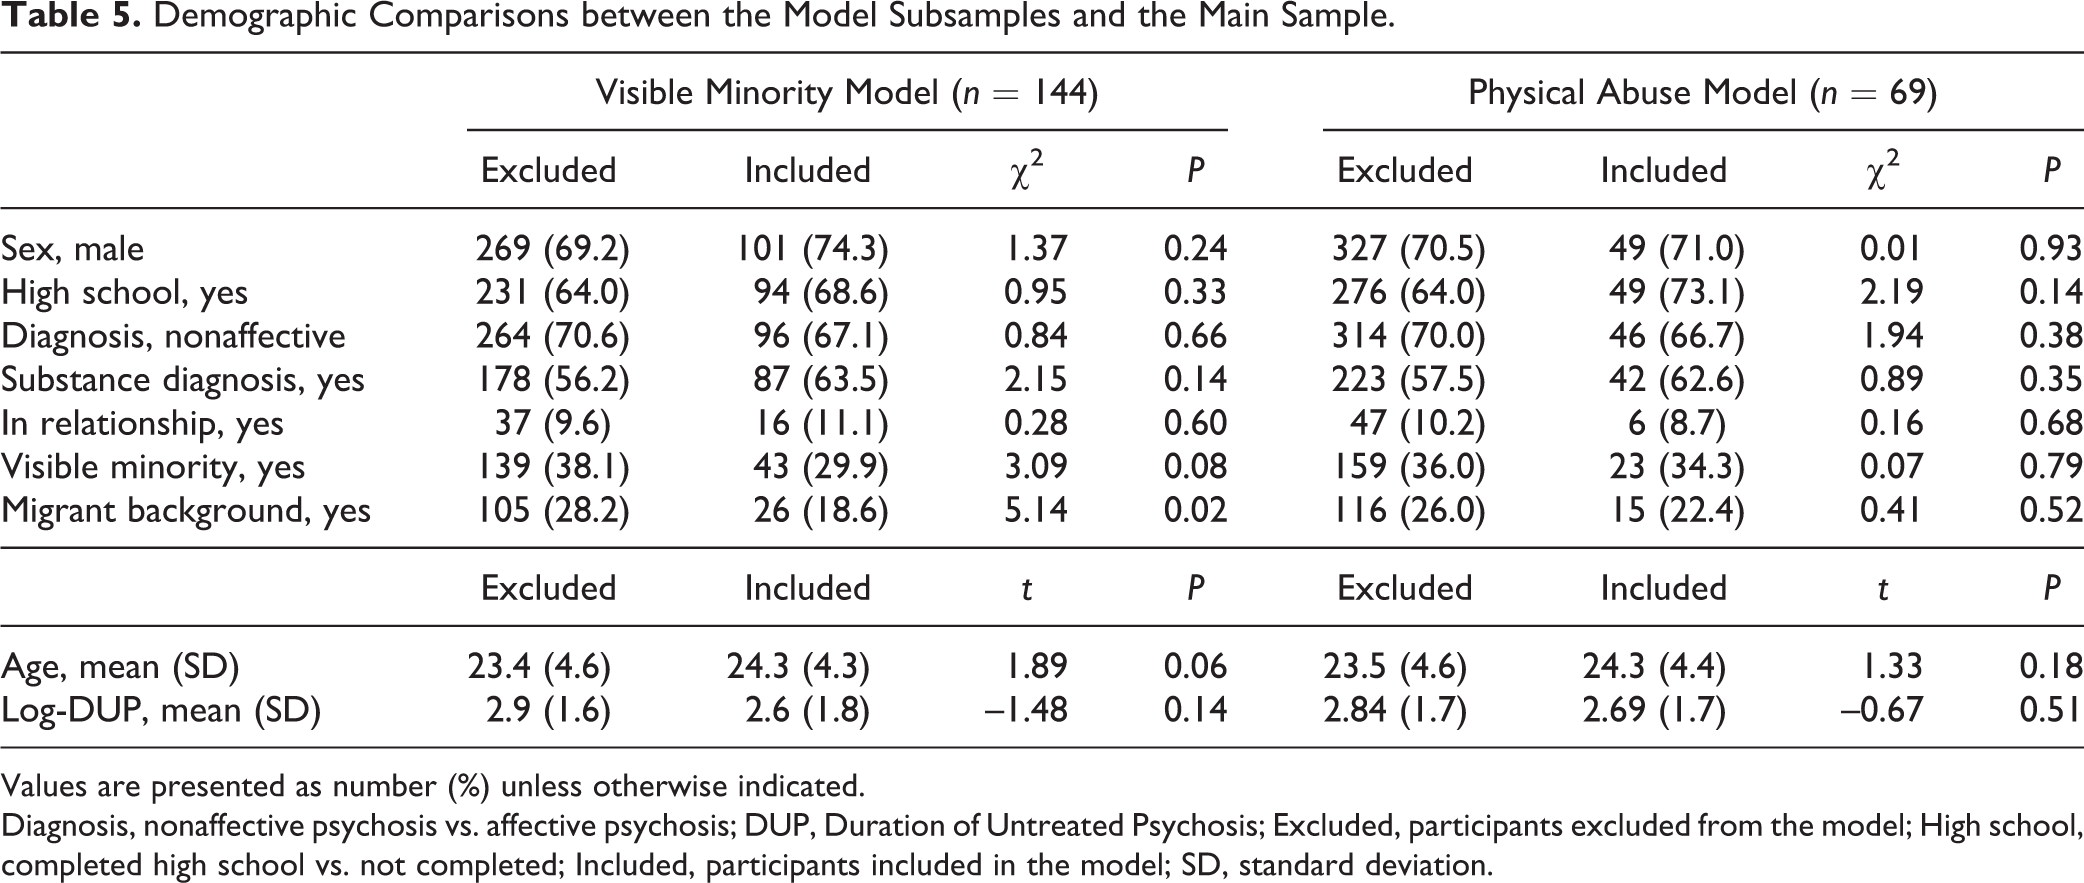
Values are presented as number (%) unless otherwise indicated.
Diagnosis, nonaffective psychosis vs. affective psychosis; DUP, Duration of Untreated Psychosis; Excluded, participants excluded from the model; High school, completed high school vs. not completed; Included, participants included in the model; SD, standard deviation.
Discussion
We examined the effect of 5 different social determinants of health on the physiological control of glucose in patients newly diagnosed with a psychotic disorder. Based on our hypothesis, and given the demographic characteristics of our sample, we sought to document preclinical variability rather than conduct diagnostic screening. We tested how childhood trauma subtypes, social and material deprivation, immigrant background, and visible minority status influenced HbA1c levels at admission. The initial univariate analyses demonstrated that visible minority status and childhood physical abuse were the only factors significantly associated with levels of HbA1c at admission. After controlling for sex, age, BMI, indices of social and material deprivation, and scores of depression and physical anergia, the effects of visible minority status remained significant and in fact became more robust. A similar trend was observed for the effect of childhood physical abuse on HbA1c levels, although without controlling for socioeconomic deprivation. After controlling for depression and anergia, a slight decrease in significance was observed, putting it just over the 0.05 cutoff.
Controlling for sex differences was fundamental given the important variability observed in body composition 37 (e.g., percent body fat) and glucose levels between females and males, 38 as well as their differential susceptibility to different forms of childhood trauma. 34,35,39 The purpose of adding BMI to the models was to control for differences in body composition. This was particularly important in the visible minority model, due to the association that ethnicity has with both body composition 40 and HbA1c. 41 Indeed, BMI was significant in the visible minority model but not in the physical abuse one. Thus, adjusting for BMI was a way to control for biological and thus genetic variability. This suggests that part of the observed effect of ethnic minority status might originate from other nonbiological, ethnicity-associated circumstances (i.e., social factors). Including the deprivation indices in the multivariate model (despite not being significant in univariate analyses) provided a way to control for the influence of neighbourhood-level socioeconomic factors linked with metabolic disease. It has been documented that this association can be mediated by food quality, 42 food availability, 43 and neighbourhood resources for physical activity. 44 Moreover, some evidence indicates that the relationship between deprivation and obesity is not significantly influenced by gender or ethnicity. 45 Again, this was of particular importance for the minority status model, as some studies indicate that the excessive metabolic disease observed in minority groups is largely attributable to their higher rates of deprivation. 46 Finally, although most of our population fell into the young adult age range category (with similar distributions of BMI), both models controlled for age, increasing their accuracy. 47
Since not all patients might have been tested for HbA1c within a short period of time after the introduction of pharmacological treatment (given the 23-day average of previous exposure), we also assessed if previous exposure to medication could have influenced the levels of HbA1c. The index combining number of days in pharmacological treatment with reported rates of adherence was not significantly correlated with the levels of HbA1c. While there was a significantly lower number of participants with a migrant background in the subsample from the visible minority model, this variable did not have an effect on HbA1c, and thus it is unlikely that this factor had affected the results. The trend showing a lower proportion of participants from visible minorities in this subsample should have acted against rather than for the documented results. By the same token, the age difference of this subsample was 11 months, which is not epidemiologically relevant for HbA1c.
Despite that the overall effects appear small, finding a significant change in the variability of HbA1c needs to be interpreted in the context of 2 observations. First, HbA1c has a numerically narrow range (4.2% to 6.2% in this sample), and clinical laboratories report only 1 decimal figure, making differences difficult to detect. Second, and more important, given the young age of FEP patients, a full-blown DGM was not expected; a clinical condition such as diabetes mellitus has been estimated to take around 15 years or more to develop. 48 While our finding cannot be automatically translated as an increase in the risk for the development of metabolic disease in the future (and thus it should be interpreted with caution), the observed increase in the level of HbA1c reflects a palpable preclinical alteration in glucose homeostasis, offering an opportunity for the prospect of early preventive interventions.
Strengths of the present study include the systematic and detailed phenotyping conducted at PEPP by a well-trained, experienced research team. An example of such phenotyping is the CTQ, a widely used validated instrument for the assessment of childhood trauma. Our phenotyping also allowed us to control for levels of depression and physical anergia as possible confounders. The neighbourhood-level social and material deprivation indices are methodologically robust (derived from census data) and supported by extensive research linking neighbourhood characteristics with health outcomes. 49 In addition, participants’ mean levels and 95% confidence intervals of red blood cells and hemoglobin measures reflected those of the international norms, validating the levels of HbA1c. Finally, our sample was representative of an FEP population.
Limitations of this study include the assessment of social factors associated with an increased risk for psychosis in a sample of patients with psychosis, which implies a selection bias (i.e., individuals with psychosis are more likely to come from socially burdened environments). This phenomenon has been demonstrated across multiple settings, including our catchment area. 9 Indeed, in our sample, the proportions of participants belonging to the worst quintiles of social and material deprivation were 50% and 34%, respectively, which contrasts with the corresponding proportions for the catchment area (2006 census) estimated to be 24% and 22%, respectively. 50 Such proportions of deprivation in the sample reduced variability, which might have made the detection of these effects more difficult given the sample size. We also tested if individual levels of socioeconomic deprivation had a significant influence on the levels of HbA1c using the Hollingshead index of social position. 51 As it was the case for the social and material deprivation indices, this indicator was also not predictive of HbA1c (Suppl. Table S3). The number of participants with overlapping data on HbA1c, childhood abuse, and minority status did not allow for the analysis of both main adversity predictors in the same regression model due to the number of covariates. However, there were no significant differences in the degree of experienced physical abuse between migrants and nonmigrants, and thus both variables seemed to be independent. Controlling for differences in body composition with BMI has some limitations. Other measures more directly associated with visceral abdominal fat such as the waist-to-hip ratio would have provided a more accurate way to control for variability in percent body fat, which in turn is associated with insulin resistance. 37 However, when comparing differences across ethnicities in young adults, the differences in percent body fat between blacks, Hispanics, and whites at the same BMI levels ranged only between 2% and 6%, 52 suggesting an acceptable accuracy. In addition, at the same BMI values, the risk for diabetes varies across ethnicities. 53,54 Nevertheless, contrary to what happens with waist circumference, there is no consensus regarding BMI cutoff values by ethnicity, and experts advise caution. 55 Moreover, these cutoffs are calculated after controlling for age, sex, and socioeconomic status, which were already included in the multivariate equations. Controlling for these cutoffs would have duplicated their effects, distorting their true influence.
The number of participants was a limitation, which forced the dichotomization of the visible minority variable. This hindered the analysis of specific ethnic differences beyond body mass composition. We did not have information on the diets of the participants, due to the potential differences in nutritional composition, particularly of energy-rich foods, found by ethnicity. Nevertheless, these differences are highly dependent on the rate of acculturation, where higher levels of acculturation have been associated with lower fruit and vegetable consumption. 56 The same study found this outcome to also be predicted by food insecurity, which might have been partially controlled for by the indices of social and material deprivation in the multivariate model. In addition, since we only had access to participants’ current postal codes, the influence of social mobility could not be accounted for. Information on neighbourhood environment in childhood might have provided a cleaner picture of the developmental influence of deprivation. This would have been particularly meaningful in the case of first-generation immigrants. Information on previous smoking status was not available. Smoking has been correlated with HbA1c, although smokers have multiple associated unhealthy risk factors. 57 On the other hand, our ancillary analysis of the influence of the diagnosis of abuse at admission showed that the latter did not significantly influence levels of HbA1c. Finally, it is expected that a greater number of participants might had produced more robust results.
While our results do not allow us to pinpoint the exact origin of our findings, we can hypothesize that after controlling for age, sex, and BMI, the effect of visible minority status might have depended on nonbiological factors associated with this variable. Moreover, since we also controlled for the indices of social and material deprivation, the association between social disadvantage and ethnic minorities was also adjusted for in the analysis. Thus, other social determinants of health might have been driving the effect of visible minority. Two important societal factors associated with ethnicity are known to significantly predict differences in health outcomes. First, ethnic minorities often encounter barriers that affect their access to health services. 58 Second, racial victimization has been linked to increased visceral fat 59 and a higher incidence of obesity. 47 In the case of childhood physical abuse, the connection with chronic stress becomes more discernible, although in both cases, this might be one of the common underlying mechanisms. Chronic stress has been linked with the development of metabolic alterations, which might be mediated through different pathophysiological pathways such as changes in oxidative stress, increased inflammation, and circadian disruption. 60 The above-mentioned root factors were not measured in this sample, and thus these arguments remain hypothetical.
In conclusion, at the same age, sex, socioeconomic conditions, and BMI levels, patients with a diagnosis of FEP who belong to a minority or who were victims of childhood physical abuse already present with comparatively increased levels of glycated hemoglobin at admission, which might indicate an increase in risk for the development of future disorders of glucose metabolism such as diabetes mellitus. These effects were present after 1) minimizing biological differences in body composition (sex, age, BMI), which are in turn dependent on physiological and genetic factors and linked to ethnicity, and 2) reducing the potential influence of some neighbourhood-linked environmental factors such as diet quality, food insecurity, and available resources for physical activity (indices of social and material deprivation). Thus, in the case of minority status, it is plausible to hypothesize that factors other than genetic differences or low income were driving this relationship. One of the possible candidates is racial victimization, which has already been documented outside of the context of psychosis. If true, patients with a diagnosis of psychosis who belong to a minority group or who have been victims of physical abuse have an additional burden on their physiological control of glucose (on top of medication side effects and sedentary behaviours), explaining their increased risk for developing DGM. Such burden would be environmental in origin and developmental in nature, indicating that it acts through gene-by-environment mechanisms such as epigenetic changes. While the physiological and clinical significance of the present findings remains to be determined, further studies should therefore test epigenetic differences in genes responsible for metabolic control in FEP populations, while clinical research should examine the behaviour of glucose regulation after 2 or 5 years of treatment and explore its interaction with social determinants of health.
Supplemental Material
Supplemental Material, CJP-2017-236-OR_Veru-Lesmes_et.al_Supplementary_Tables_02Dec2017 - Social Determinants of Health and Preclinical Glycemic Control in Newly Diagnosed First-Episode Psychosis Patients
Supplemental Material, CJP-2017-236-OR_Veru-Lesmes_et.al_Supplementary_Tables_02Dec2017 for Social Determinants of Health and Preclinical Glycemic Control in Newly Diagnosed First-Episode Psychosis Patients by Franz Veru-Lesmes, Aldanie Rho, Suzanne King, Ridha Joober, Marita Pruessner, Ashok Malla, and Srividya N. Iyer in The Canadian Journal of Psychiatry
Footnotes
Author Contribution
Drs. Ashok Malla and Srividya Iyer are both senior authors to this work. Drs. Franz Veru, Ashok Malla and Srividya Iyer conceived and devised the main design of the study. All the authors listed contributed with the design, analysis and interpretation of data, and provided comments and editorial proofing during the process of drafting the manuscript. Acquisition of data was made possible by Drs Malla, Pruessner, King and Rho. Franz Veru conducted the literature review, proposed the main hypotheses, conducted the main data analyses and interpretation of data, and wrote the manuscript. All authors contributed with a critical revision and final approval of the version to be submitted for publication.
Declaration of Conflicting Interests
The authors declared the following potential conflicts of interest with respect to the research, authorship, and/or publication of this article: Dr. Iyer has nothing to disclose. Dr. Malla reports grants from Roche and Bristol-Myers Squibb, and other funding support for consulting and conference lectures from Otsuka, Lundbeck, and Janssen-Ortho, all of it outside the submitted work. Dr. Joober reports grants from BMS, Otsuka, Lundbeck, Astra Zeneca and HLS, has made part of consulting committees for Pfizer, Janssen, BMS, Sunovian and Myelin, has been a speaker for Pfizer, Janssen Myelin, Otsuka, Lundbeck, Shire and Perdue, and has received royalties from Henry Stewart talks, all of it outside the submitted work. Dr. Pruessner has nothing to disclose. Dr. King has nothing to disclose. Dr. Rho has nothing to disclose. Dr. Veru-Lesmes has nothing to disclose.
Funding
The authors disclosed receipt of the following financial support for the research, authorship, and/or publication of this article: The present project was funded by operating grants from the Canadian Institutes of Health Research and the National Institute of Mental Health (MH093303). Dr. S.N. Iyer has received salary awards from the Fonds de recherche du Québec – Santé and from the Canadian Institutes of Health Research. Dr. A. Malla is supported by the Canada Research Chairs Program. Dr. R. Joober has received salary awards from the Fonds de recherche du Québec – Santé. Dr. F. Veru-Lesmes is supported through a doctoral training award granted by the Fonds de recherche du Québec-Santé, and a doctoral studentship from the Schizophrenia Society of Canada Foundation and Canadian College of Neuropsychopharmacology.
Supplemental Material
Supplemental material for this article is available online.
References
Supplementary Material
Please find the following supplemental material available below.
For Open Access articles published under a Creative Commons License, all supplemental material carries the same license as the article it is associated with.
For non-Open Access articles published, all supplemental material carries a non-exclusive license, and permission requests for re-use of supplemental material or any part of supplemental material shall be sent directly to the copyright owner as specified in the copyright notice associated with the article.