
Abstract
Background:
The purpose of this study was to compare the prevalence of self-reported mental health factors, mental health service use, and unmet needs across the 4 largest ethnic groups in Ontario, Canada: white, South Asian, Chinese, and black groups.
Methods:
The study population was derived from the Canadian Community Health Survey, using a cross-sectional sample of 254,951 white, South Asian, Chinese, and black residents living in Ontario, Canada, between 2001 and 2014. Age- and sex-standardized prevalence estimates for mental health factors, mental health service use, and unmet needs were calculated for each of the 4 ethnic groups overall and by sociodemographic characteristics.
Results:
We found that self-reported physician-diagnosed mood and anxiety disorders and mental health service use were generally lower among South Asian, Chinese, and black respondents compared to white respondents. Chinese individuals reported the weakest sense of belonging to their local community and the poorest self-rated mental health and were nearly as likely to report suicidal thoughts in the past year as white respondents. Among those self-reporting fair or poor mental health, less than half sought help from a mental health professional, ranging from only 19.8% in the Chinese group to 50.8% in the white group.
Conclusions:
The prevalence of mental health factors and mental health service use varied widely across ethnic groups. Efforts are needed to better understand and address cultural and system-level barriers surrounding high unmet needs and to identify ethnically tailored and culturally appropriate clinical supports and practices to ensure equitable and timely mental health care.
Mental illness is increasingly being recognized as a global public health issue, with an estimated lifetime prevalence ranging from 18% to 36% worldwide. 1 In more diverse jurisdictions, such as Ontario, Canada, in which 26% of the nearly 13 million residents identify as a visible minority, 2 understanding how mental health experiences vary across ethnic groups living within the same macro-environment is important. Few past studies suggest that compared to white Canadians, Chinese, other Asian, black, and ethnic minority populations are less likely to report depression or major depressive episode, 3,4 mental distress, 5 suicidal thoughts, 6,7 and mental health service use 3,8 –10 but are more likely to report poorer self-rated mental health 11 and a weaker sense of belonging to one’s local community, 11,12 which has been associated with higher levels of depression and poorer mental health. 13,14 Many of these past studies, however, have often included populations that were limited to 1 or 2 ethnic groups, immigrant populations, or a combination of multiple ethnicities into a single category. 3,8 –10,12 Given recent investments made by the Ontario government to increase funding towards mental health and addictions services, 15 a unique opportunity exists to uncover potential differences in the mental health status and experiences among the major ethnic minority groups in Ontario (i.e., those of South Asian, Chinese, and black descent) compared with those of white ethnicities.
There is also limited evidence around how unmet needs for mental health care varies across major ethnic groups in Ontario, which is particularly important given that previous literature has identified unmet needs as a persisting problem. 16 Evidence from studies of populations in the United States has reported that among those in need of care, Asian and black populations are less likely to receive mental health treatment compared to non-Hispanic white individuals. 17,18 Literature has often cited barriers such as lack of health insurance and costs of mental health services for those of black descent. 17,19 Whether similar findings are seen in other jurisdictions such as Ontario, in which there are less out-of-pocket costs related to mental health care, is less clear. Previous studies have noted that unmet needs for mental health care appear to be higher among ethnic minority individuals compared to nonimmigrants, longer-term immigrants, and white Canadians; however, these studies only focused on specific mental illness populations. 20,21 Furthermore, the role that sociodemographic factors, such as age, income, and immigrant status, play in explaining potential variation is important to understand, as these factors are independently associated with mental health issues and ethnicity. 22,23
It is therefore necessary to explore the interrelationship between diagnosed psychiatric conditions, self-reported mental health issues, and whether needs for mental health care are being adequately met across ethnic groups. The primary objective of the present study was to compare the prevalence of self-reported 1) mental health status, 2) mental health service use, and 3) unmet needs for care across a population-based sample of white, South Asian, Chinese, and black Canadians living in Ontario, Canada. A secondary objective was to examine whether ethnicity is an independent risk factor of self-reported mental health status and mental health service use.
Methods
Data Sources and Study Population
The study population was derived from a pooled sample of participants of Statistics Canada’s cross-sectional Canadian Community Health Survey (CCHS) from cycles 1.1 (2001), 2.1 (2003), 3.1 (2005), and the CCHS–Annual components for 2007, 2008, 2009, 2010, 2011, 2012, 2013, and 2014 (response rates ranged from 75.1% to 94.4%). The CCHS survey waves were combined using the pooled approach without rescaling of sampling weights as described in Thomas and Wannell. 24 Details about the survey methodology are described elsewhere. 25,26 Briefly, these surveys used a consistent multistage stratified cluster sampling strategy to collect self-reported sociodemographic and health-related information from a representative sample of persons in private dwellings.
In this study, we analyzed people living in Ontario who were aged 12 years or older and who identified themselves as white, Chinese, South Asian (i.e., those of Indian, Pakistani, Bangladeshi, or Sri-Lankan origin), or black. Those who responded with other or multiple ethnicities were excluded from the study population.
Study Variables
Sociodemographic characteristics included ethnicity, age, sex, marital status, highest level of education attained by the individual, annual household income in Canadian dollars, living in a broader urban area, and immigrant status.
We analyzed mental health-related factors that were collected consistently across CCHS survey waves using all years for which the data were available. Mental health–related factors included fair or poor self-rated mental health (compared to good, very good, and excellent), lifetime and past-year suicidal ideation (i.e., suicidal thoughts), and very weak or somewhat weak sense of belonging to one’s local community (compared to very strong and somewhat strong). In addition to self-reported factors related to mental health, we also examined self-reported lifetime physician-diagnosed mood disorder (e.g., depression or bipolar disorder) and anxiety disorder (e.g., obsessive-compulsive disorder or panic disorder) and mental health service use (i.e., seen or talked to a health professional about emotional or mental health) in the past 12 months and from whom individuals received care: family doctor, psychiatrist, allied health (i.e., psychologists, nurses, and social workers or counsellors), and other health professionals. Last, to explore unmet needs for care, we examined mental health service use within the past year among individuals reporting 1) past-year suicidal ideation or 2) fair or poor self-rated mental health. The CCHS surveys examined in this study only asked about mental health service use in the past year. Therefore, we chose to explore service use among individuals reporting current or past-year mental health issues—this is in contrast to the self-reported diagnosed mood and anxiety disorders measures, which assessed lifetime diagnoses.
Statistical Analyses
We calculated the crude prevalence of sociodemographic characteristics and age- and sex-standardized prevalence of mental health–related factors and mental health service use in each of the 4 ethnic groups using the indirect standardization method and 2001 to 2014 Ontario CCHS respondents as the standard population. Indirect standardization uses age- and sex-specific rates from a standard population to calculate the expected number of events in a study population by using the age and sex distribution of the study population. 27 Estimates were further stratified by sex, age (12-24, 25-64, ≥65 years), and immigrant status (immigrant vs. nonimmigrant) to investigate ethnic variations within these relevant dimensions. Preliminary analysis showed no significant differences in the prevalence of mental health factors and mental health service use between recent immigrants (less than 10 years in Canada) and long-term immigrants (10 or more years in Canada) across ethnic groups; therefore, we present results for immigrant versus nonimmigrant.
Missing values for mental health factors and mental health service use variables (≤4.8% missing for all variables) were excluded when calculating prevalence estimates. We also performed logistic regression to compare the associations between ethnicity and the prevalence of 3 self-reported outcomes: fair or poor mental health, diagnosed mood or anxiety disorder, and past-year mental health service use. Crude, age- and sex-adjusted, and multivariate-adjusted odds ratios controlling for potential confounders, including age, sex, income, education, immigrant status, and CCHS survey year, were calculated. Odds ratios were presented for South Asian, Chinese, and black individuals with white individuals as the reference group.
Statistical analyses were performed using the SAS v9.4 statistical software (SAS Institute, Cary, NC). All analyses were weighted by Statistics Canada’s sample weights to account for the complex survey sampling design and to improve generalizability of the estimates. Bootstrap methods were used to test statistical significance with the 95% confidence interval (CI) defined as the 2.5th and 97.5th percentiles of the 500 bootstrap rates or the natural logarithm of rate ratios. The P values comparing ethnic-specific prevalence estimates and odds ratios to the reference white population were derived from the standard z test, in which the rate or the logarithm of the rate ratio was divided by the standard deviation of this statistic across the 500 bootstrap samples. All tests were 2-sided, and P < 0.05 (or nonoverlapping 95% CIs when available) was considered statistically significant.
Our study was approved by the Research Ethics Board at Sunnybrook Health Sciences Centre. Informed consent was obtained by Statistics Canada from all study participants.
Results
Study Population and Demographics
Our study population consisted of 238,392 white, 6779 South Asian, 5073 Chinese, and 4707 black respondents. The weighted proportions of the 4 ethnic groups in the CCHS sample were representative of these groups in the overall Ontario census population. 2 The 3 ethnic minority groups were younger than the white population, with mean ages ranging from 37.8 to 40.4 years compared with 44.7 years for white respondents (Table 1). Most respondents lived in urban areas and had more than a high school education. Compared to white respondents, nonwhite respondents were less likely to have an annual income of $60,000 or more, and a greater proportion reported being of immigrant status.
Prevalence of Sociodemographic Characteristics, by Ethnic Group, Ontario, Canada, 2001 to 2014.a
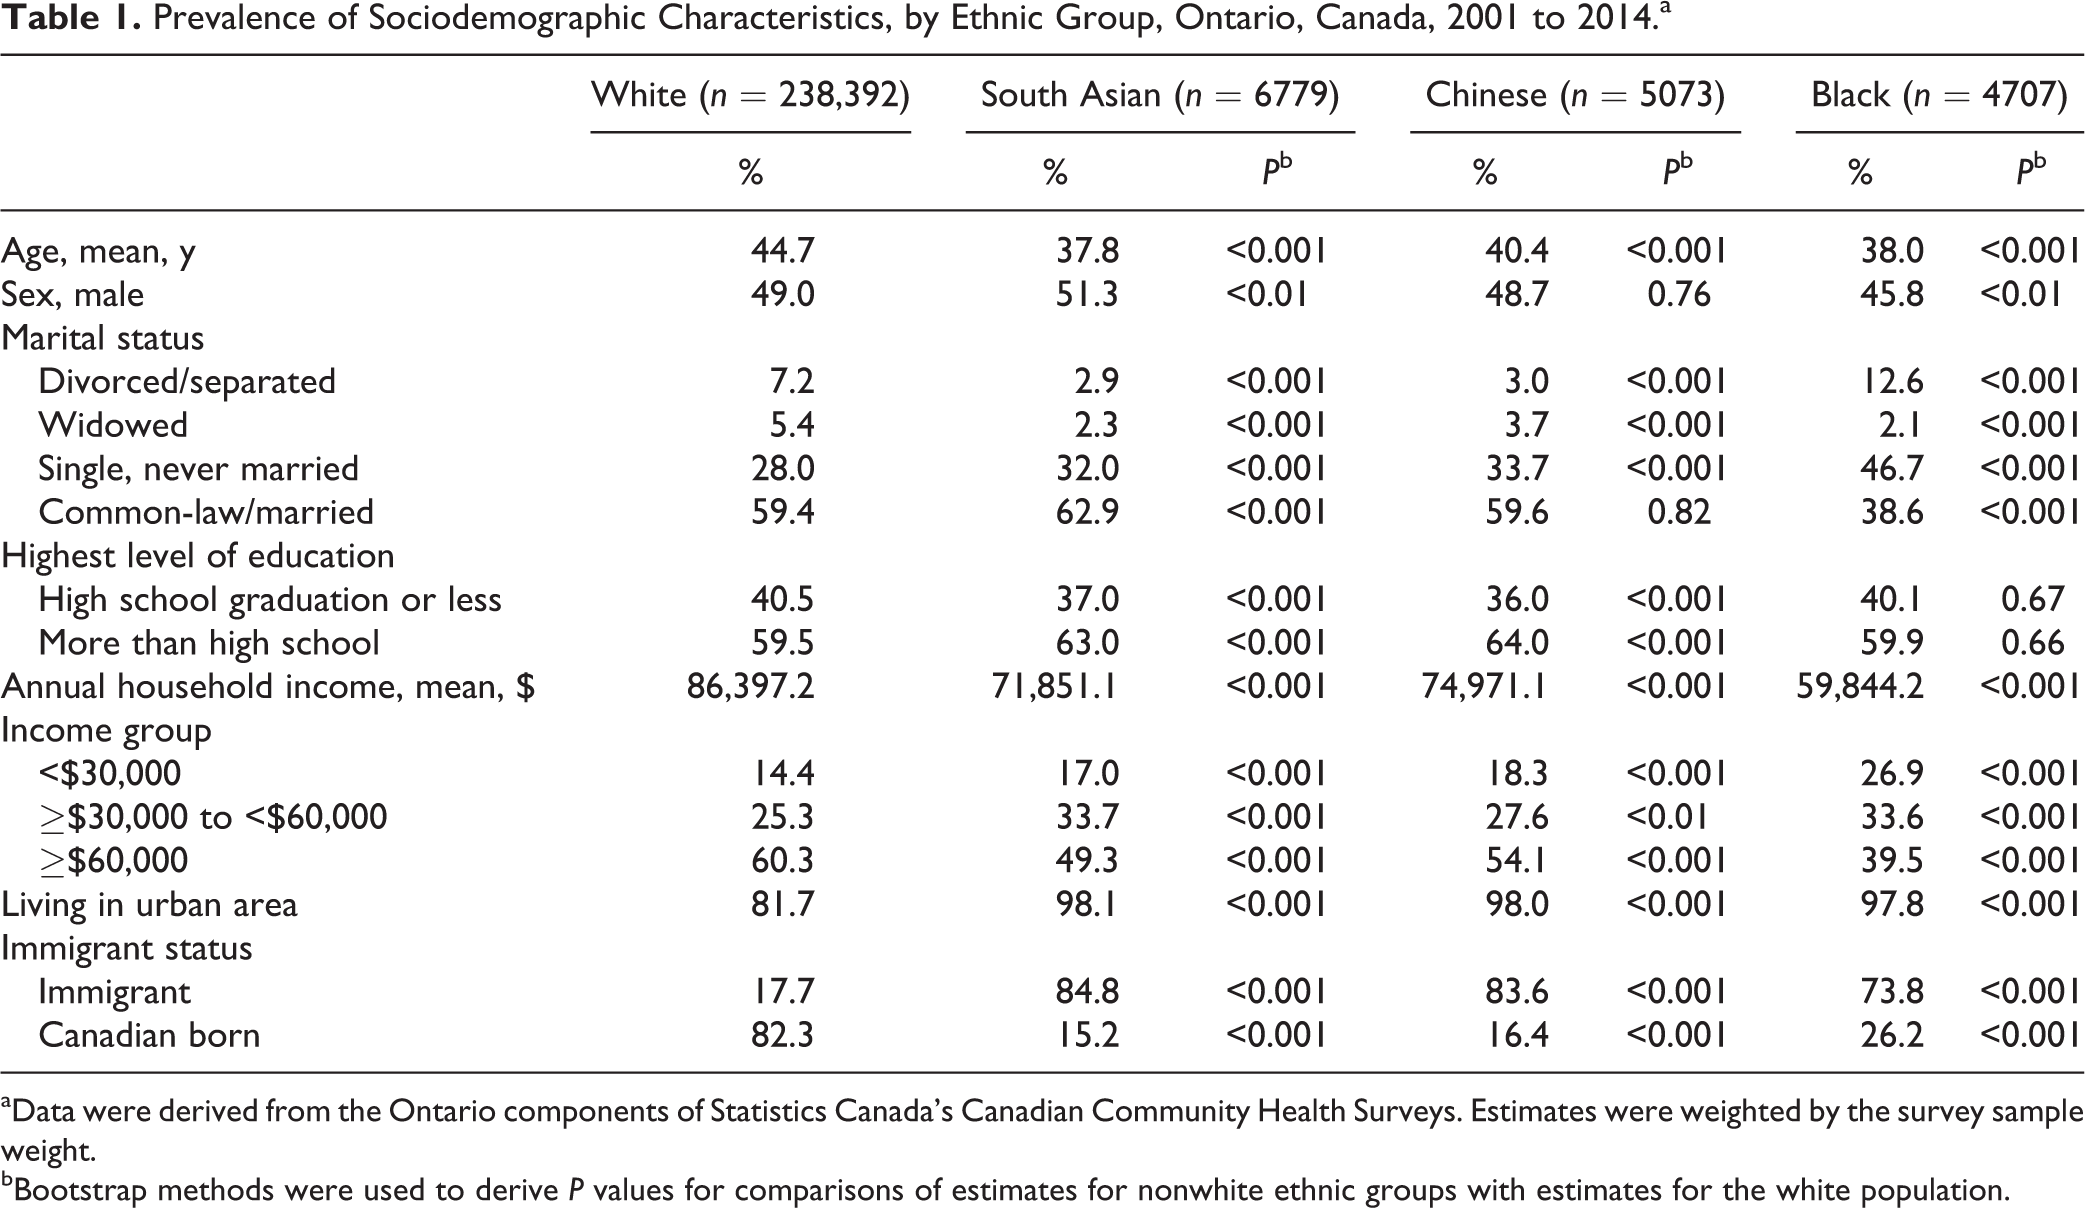
aData were derived from the Ontario components of Statistics Canada’s Canadian Community Health Surveys. Estimates were weighted by the survey sample weight.
bBootstrap methods were used to derive P values for comparisons of estimates for nonwhite ethnic groups with estimates for the white population.
Mental Health Factors
Overall
We found marked ethnic differences in mental health factors. Chinese respondents had the weakest sense of belonging (49.5%) and poorest self-rated mental health (7.5%) compared to all other ethnic groups (Table 2). Conversely, South Asians had the strongest sense of belonging (28.2%), and black individuals showed no difference compared to the white population. South Asian, Chinese, and black respondents were significantly less likely to report either lifetime suicidal ideation or lifetime diagnosis of mood or anxiety disorder compared to white respondents; however, for past-year suicidal ideation, no statistically significant difference was found between Chinese and white respondents (1.6% vs. 1.9%, respectively).
Age- and Sex-Standardized Prevalence of Mental Health Factors, by Ethnic Group and by Sex, Ontario, Canada, 2001 to 2014.a
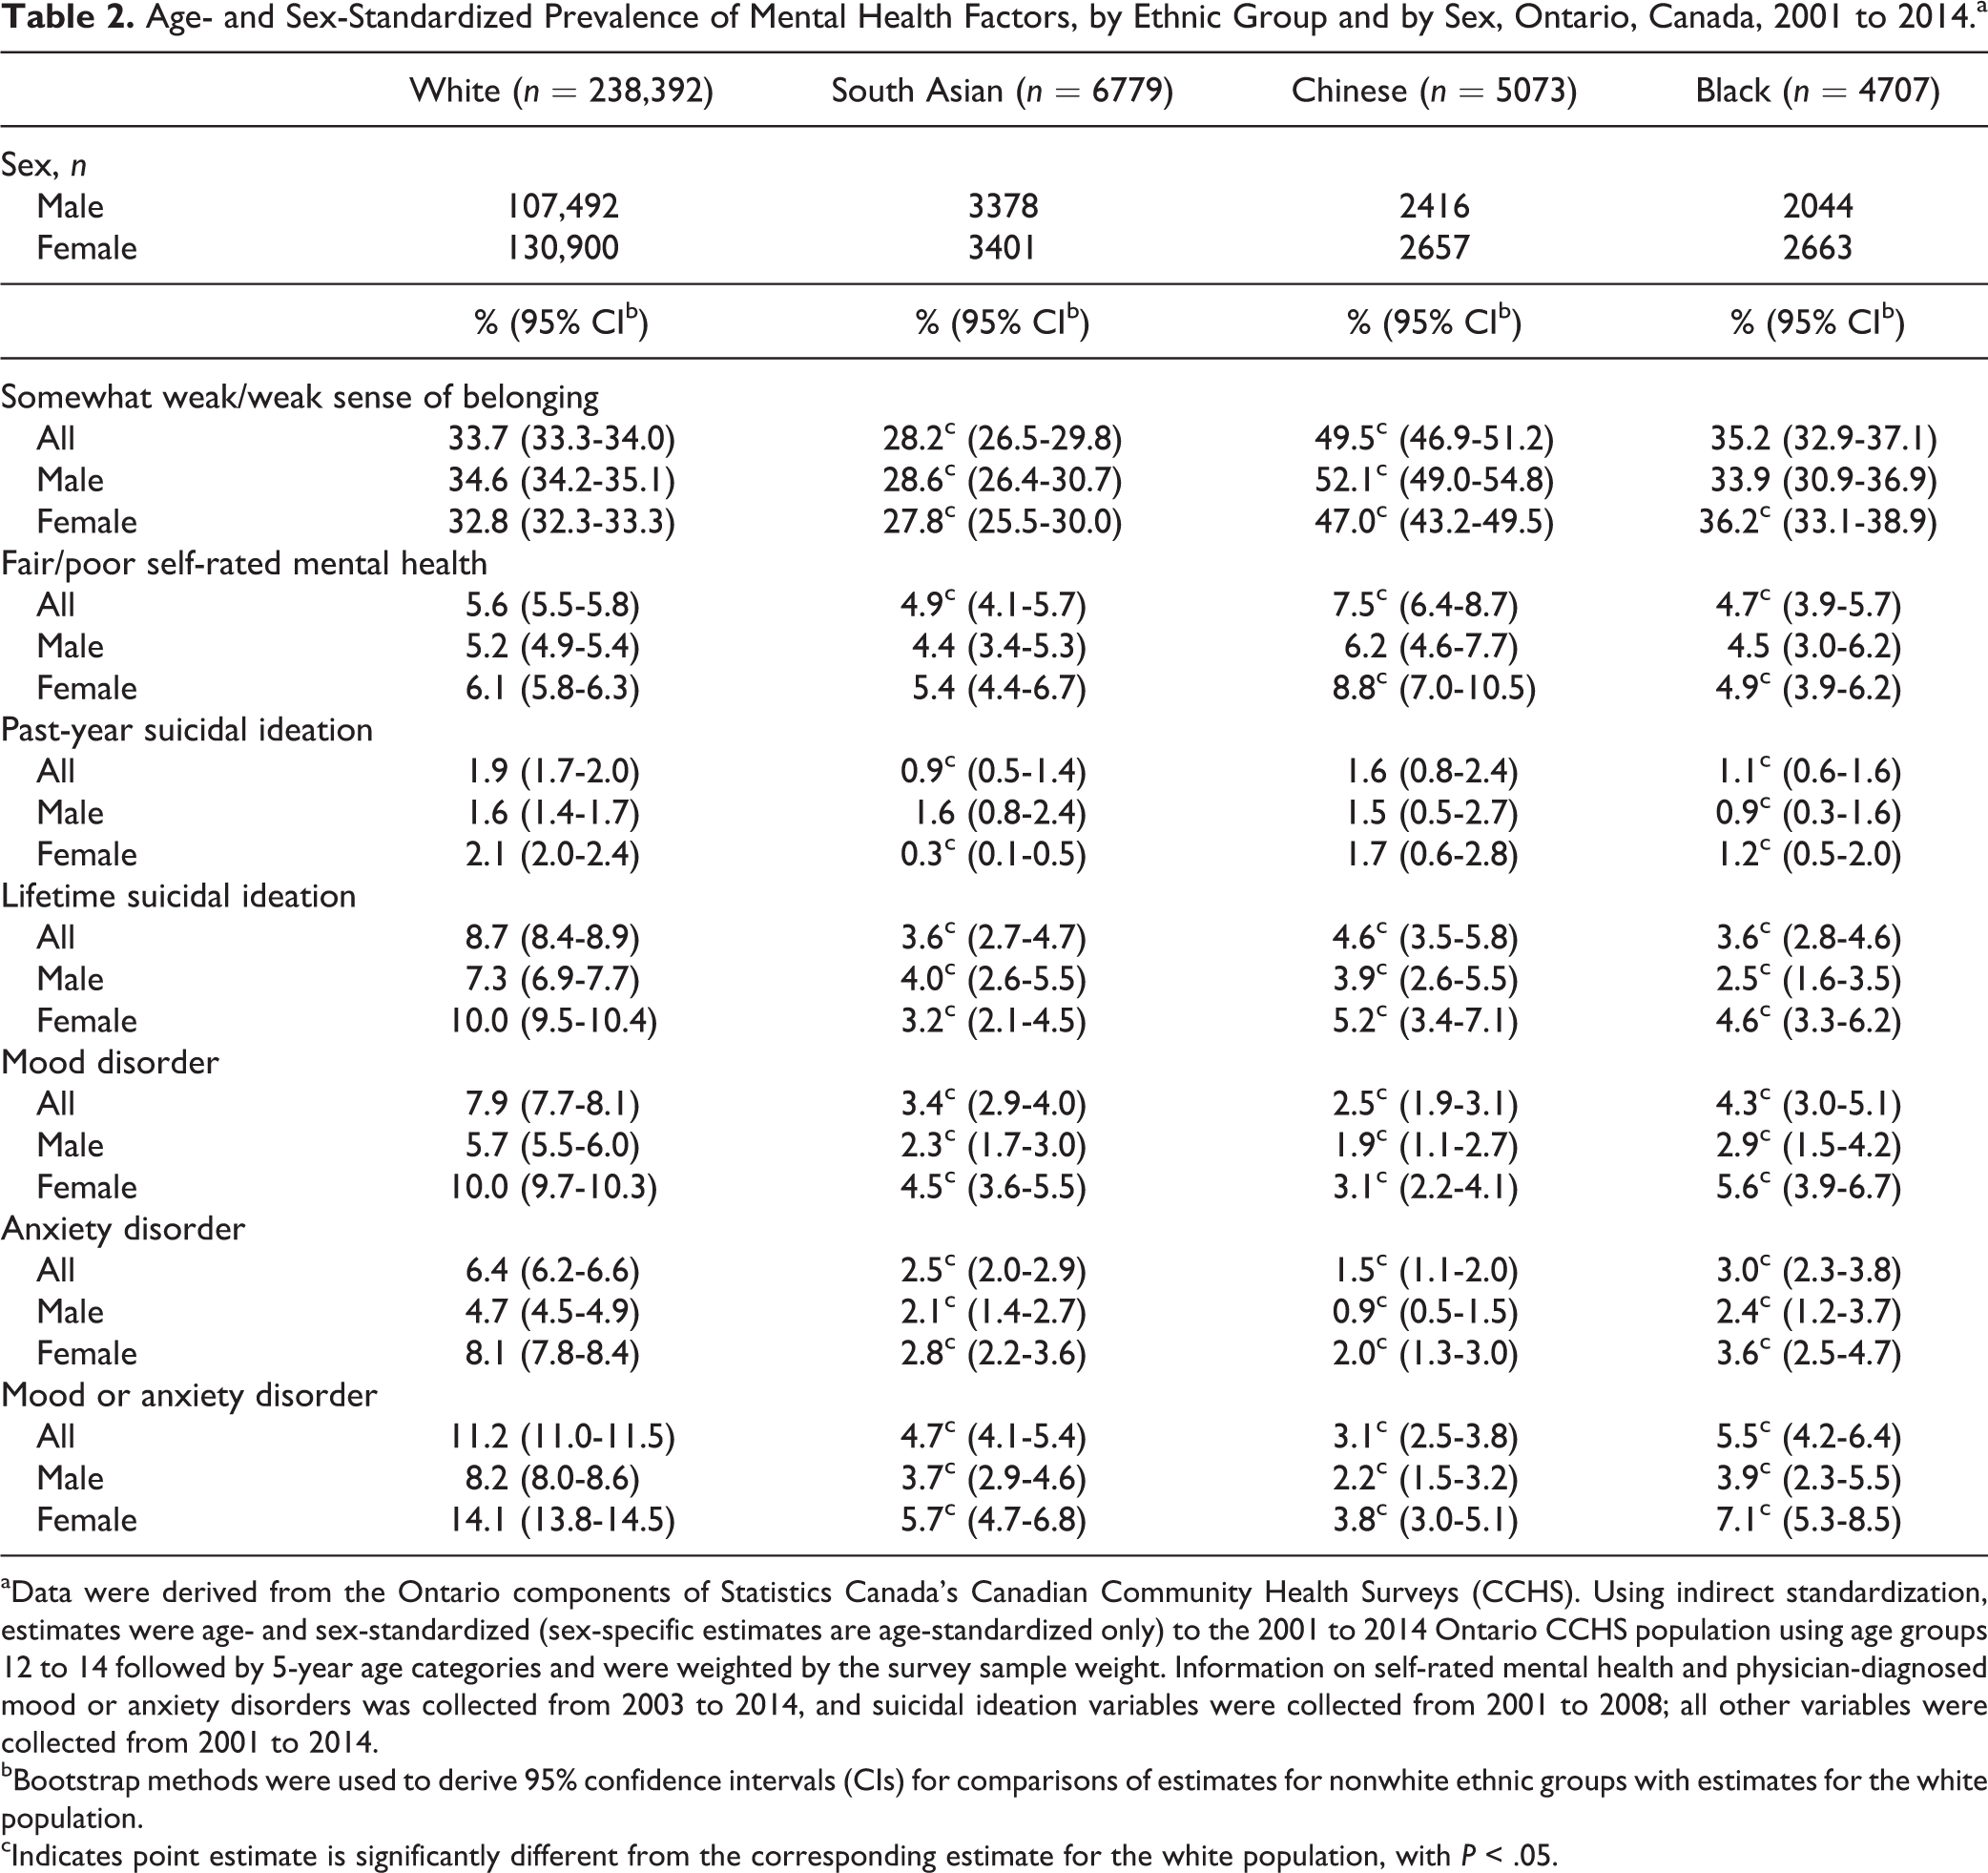
aData were derived from the Ontario components of Statistics Canada’s Canadian Community Health Surveys (CCHS). Using indirect standardization, estimates were age- and sex-standardized (sex-specific estimates are age-standardized only) to the 2001 to 2014 Ontario CCHS population using age groups 12 to 14 followed by 5-year age categories and were weighted by the survey sample weight. Information on self-rated mental health and physician-diagnosed mood or anxiety disorders was collected from 2003 to 2014, and suicidal ideation variables were collected from 2001 to 2008; all other variables were collected from 2001 to 2014.
bBootstrap methods were used to derive 95% confidence intervals (CIs) for comparisons of estimates for nonwhite ethnic groups with estimates for the white population.
cIndicates point estimate is significantly different from the corresponding estimate for the white population, with P < .05.
By age and sex
Similar to overall rates, sense of belonging was the weakest among Chinese respondents and generally stronger among South Asian respondents, irrespective of sex and across most age groups (Table 2, Appendix Table 1). The highest prevalence of fair or poor self-rated mental health was among Chinese adults aged 65+ years. In general, lifetime suicidal ideation and self-reported diagnosed mood or anxiety disorders were significantly lower among most ethnic minority groups, irrespective of age and sex.
By immigrant status
White and Chinese immigrants reported significantly higher rates of weak sense of belonging compared to their Canadian-born counterparts (Table 3). Regardless of immigrant status, ethnic minority groups reported a lower prevalence of mood or anxiety disorders compared to white people. However, Chinese immigrants reported the highest prevalence of poor self-rated mental health (8.2%) compared to other immigrant groups. The prevalence of lifetime suicidal ideation was lower among all ethnic minority immigrants and Chinese and South Asian nonimmigrants compared to their white counterparts.
Age- and Sex-Standardized Prevalence of Mental Health and Addictions Factors, by Ethnic Group and by Immigrant Status, Ontario, Canada, 2001 to 2014.a
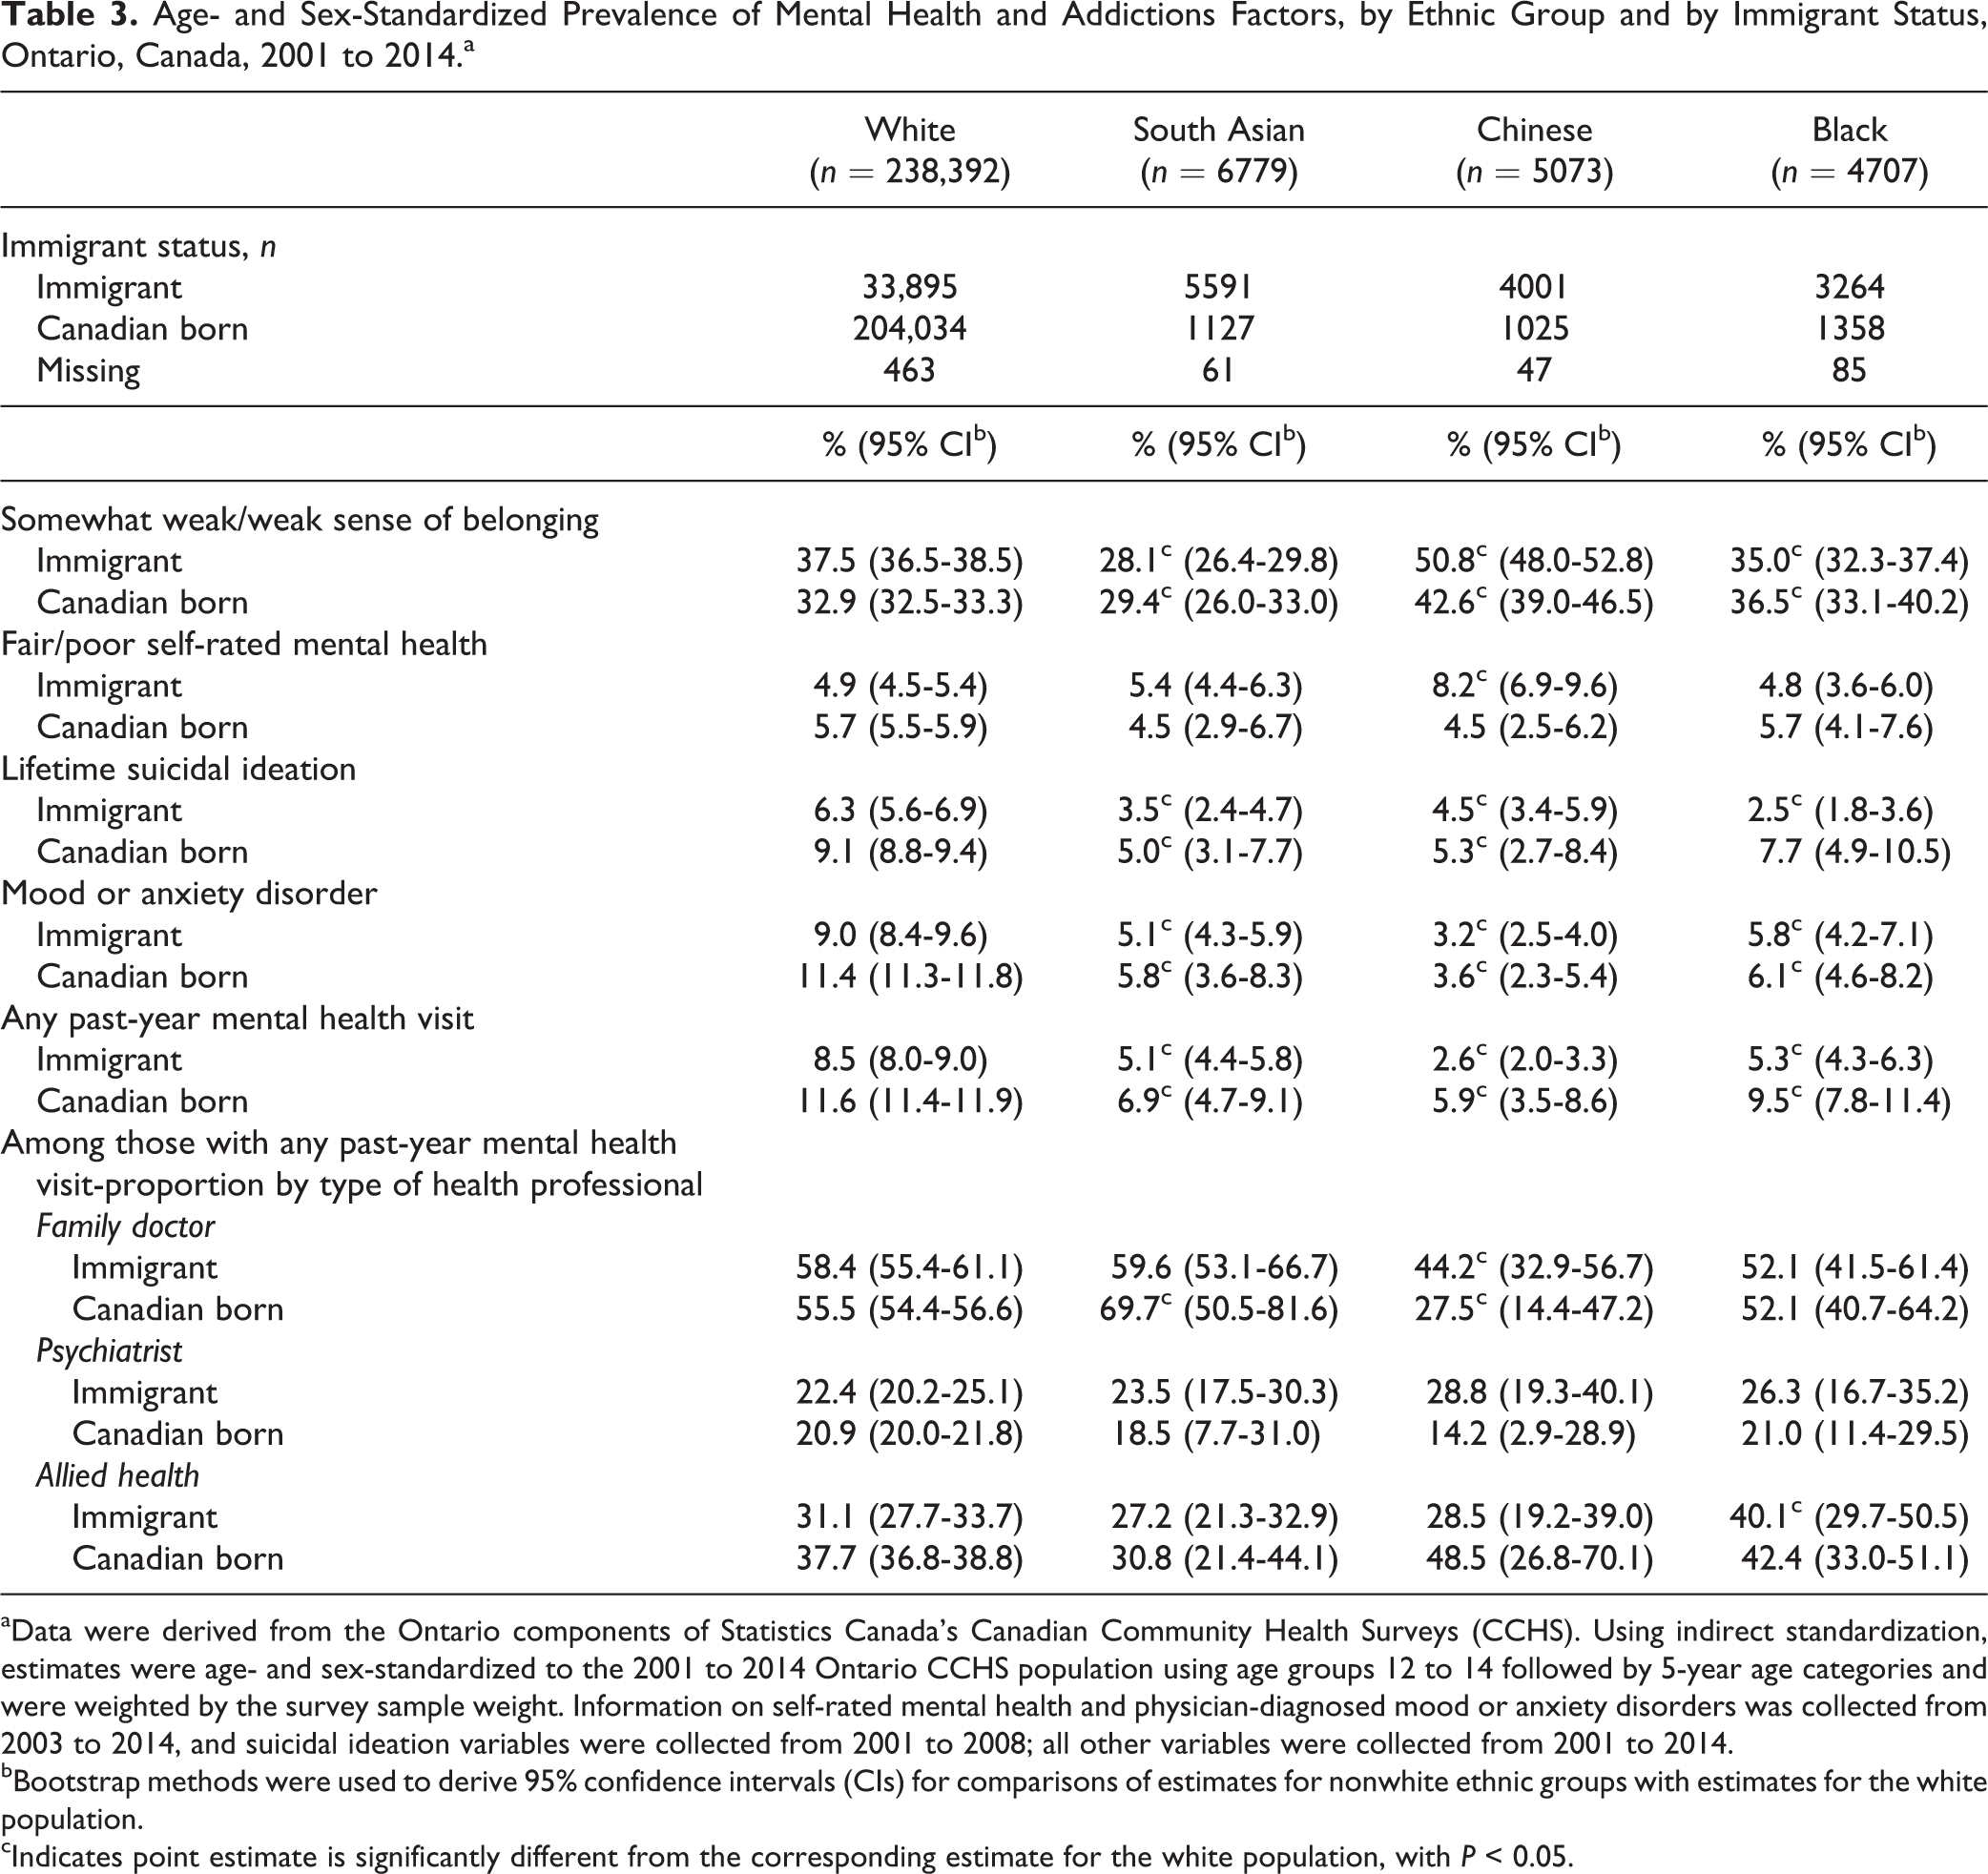
aData were derived from the Ontario components of Statistics Canada’s Canadian Community Health Surveys (CCHS). Using indirect standardization, estimates were age- and sex-standardized to the 2001 to 2014 Ontario CCHS population using age groups 12 to 14 followed by 5-year age categories and were weighted by the survey sample weight. Information on self-rated mental health and physician-diagnosed mood or anxiety disorders was collected from 2003 to 2014, and suicidal ideation variables were collected from 2001 to 2008; all other variables were collected from 2001 to 2014.
bBootstrap methods were used to derive 95% confidence intervals (CIs) for comparisons of estimates for nonwhite ethnic groups with estimates for the white population.
cIndicates point estimate is significantly different from the corresponding estimate for the white population, with P < 0.05.
Mental Health Service Use Overall and among Those in Need
White respondents were significantly more likely to use mental health services in the past year compared to ethnic minorities, irrespective of age, sex, and immigrant status (Tables 3 and 4; Appendix Table 1). White and South Asian individuals were significantly more likely to see their family doctors for their mental health services than any other professional; however, Chinese respondents were just as likely to see a family doctor, psychiatrist, or allied health professional, and black respondents were similarly likely to see their family doctor or allied health professional.
Age- and Sex-Standardized Prevalence of Mental Health Service Utilization, by Ethnic Group, Ontario, Canada, 2001 to 2014.a
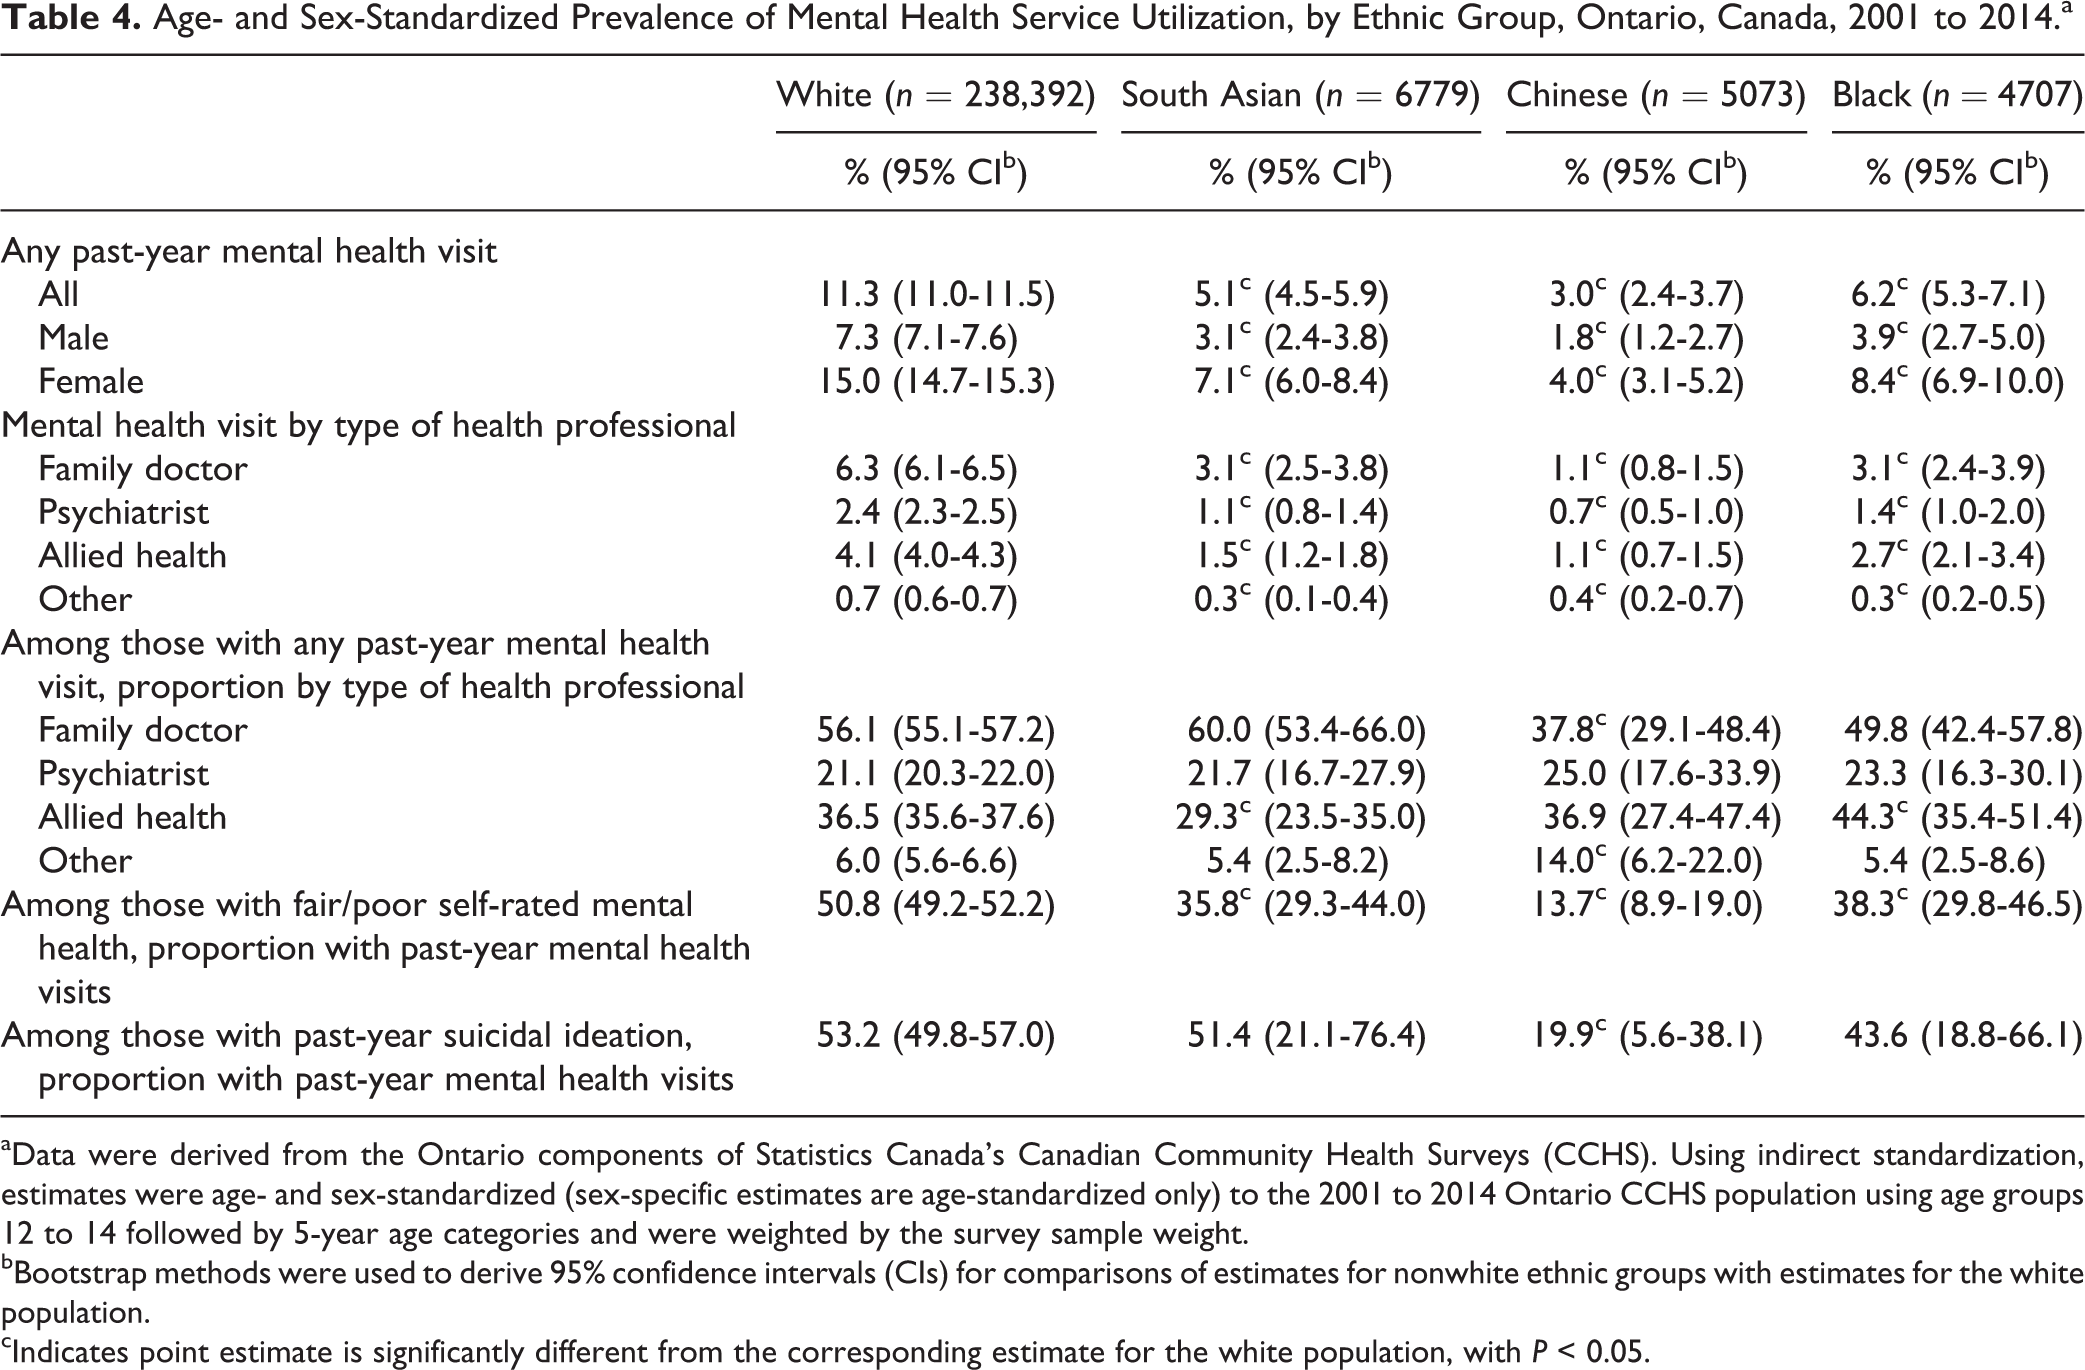
aData were derived from the Ontario components of Statistics Canada’s Canadian Community Health Surveys (CCHS). Using indirect standardization, estimates were age- and sex-standardized (sex-specific estimates are age-standardized only) to the 2001 to 2014 Ontario CCHS population using age groups 12 to 14 followed by 5-year age categories and were weighted by the survey sample weight.
bBootstrap methods were used to derive 95% confidence intervals (CIs) for comparisons of estimates for nonwhite ethnic groups with estimates for the white population.
cIndicates point estimate is significantly different from the corresponding estimate for the white population, with P < 0.05.
Among those self-reporting fair or poor mental health, only half of respondents sought help in the past year. This percentage was particularly low among the nonwhite ethnic groups, including only 14% of Chinese respondents. Among individuals reporting suicidal thoughts in the past year, mental health service use was still low with a similar percentage of white (53.2%), South Asian (51.4%), and black individuals (43.6%) reporting seeking help in the past year; however, Chinese respondents reported a significantly lower percentage (19.9%) than the white group. It should be noted that these estimates were based on a small number of ethnic minorities reporting past-year suicidal ideation.
Odds Ratios
Crude and multivariate odds ratios indicated that compared to the white reference group, Chinese respondents were significantly more likely to report fair or poor self-rated mental health, while black individuals were significantly less likely to report this (Figure 1). Prior to adjustment, South Asian individuals had significantly lower odds of reporting fair or poor self-rated mental health than white individuals; however, after adjusting for age, sex, and other sociodemographic covariates, the odds ratios were no longer significant. For the remaining outcome variables, all ethnic minority groups were consistently less likely to have a diagnosed mood or anxiety disorder or a past-year mental health visit compared to the white reference population even after controlling for covariates.
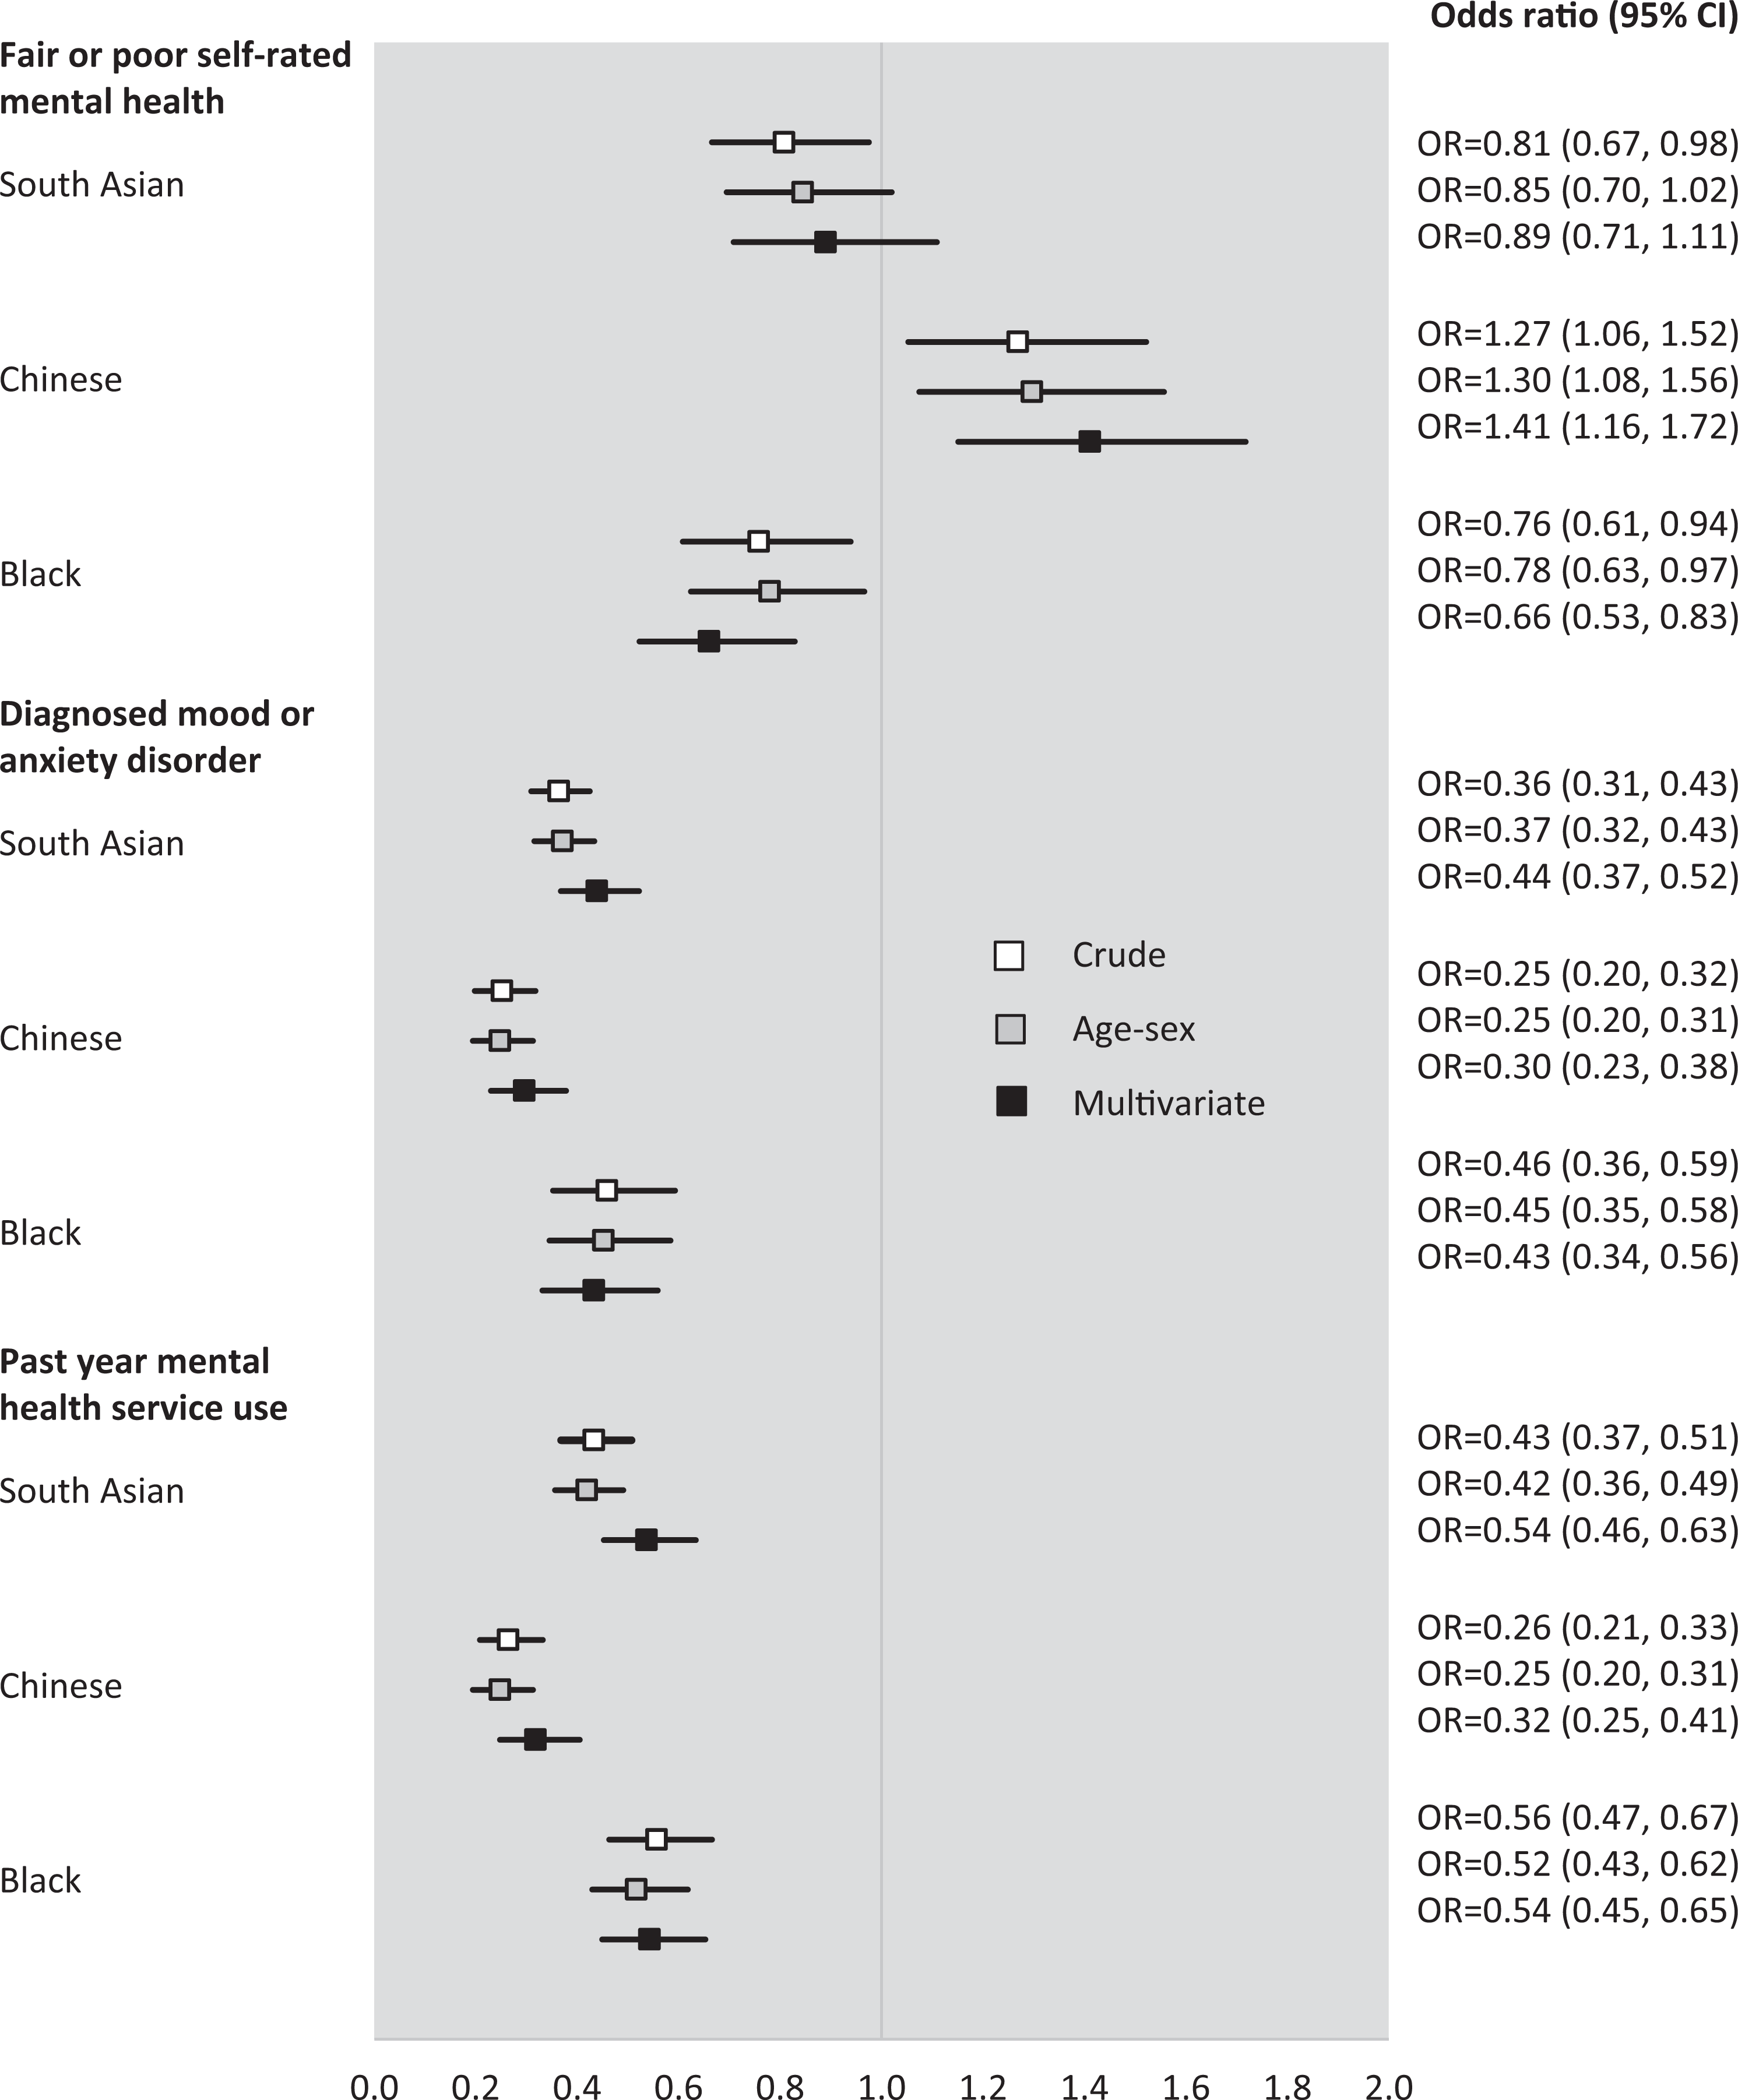
Forest plot of crude and multivariate-adjusted odds ratios (ORs) of the association between ethnicity and mental health factors and service utilization, Ontario, Canada, 2001 to 2014. Data were derived from the Ontario components of Statistics Canada’s Canadian Community Health Surveys (CCHS). Bootstrap methods were used to derive 95% confidence intervals. Multivariate ORs were adjusted for age, sex, income, education, immigrant status, and CCHS cycle/survey year. Odds ratios (OR) for South Asian, Chinese, and Black individuals are in comparison to a White reference population. ORs were considered to be statistically significant when confidence intervals did not overlap with 1.0.
Discussion
In this population-based study, we found that compared to ethnic minorities, white individuals had a significantly higher prevalence of lifetime suicidal ideation, physician-diagnosed mood or anxiety disorders, and past-year mental health service use, which remained consistent even after controlling for several factors. However, Chinese respondents had the poorest self-rated mental health and the weakest sense of belonging. Unmet needs for care were high across all 4 ethnic groups, with more than half not seeking help despite reporting mental health issues. This was even higher among ethnic minorities, particularly those of Chinese descent. The ethnic differences found in this study may be a result of differences in mental illness reporting, help-seeking behaviours, or access to health services or may reflect true differences in mental health burden across ethnic groups.
We found a lower prevalence of diagnosed mood and anxiety disorders and lifetime suicidal ideation among South Asian, Chinese, and black respondents compared to white individuals, which is consistent with previous Canadian and US-based studies. 3 –5,28 –32 However, Chinese respondents were unique in that, despite a lower prevalence of the aforementioned illnesses and factors, they had the weakest sense of belonging, poorest self-rated mental health, the lowest use of mental health services, and the highest level of unmet needs. It is difficult to explain these differences among Chinese individuals, but part of this may be due to traditional beliefs about mental health. In many Chinese cultures, mental illness is believed to be caused by lack of harmony of emotions or by evil spirits, resulting in the seeking of more nontraditional or non-Western methods of treatment. 33 Indeed, our study found that among those who sought mental health treatment, Chinese respondents were the only group to have a significantly higher prevalence of mental health care visits to other or alternative health professionals compared to white individuals (14% vs. 6.0%, respectively).
Sense of belonging is associated with positive well-being and mental health and lower rates of depression. 13,14 Black individuals reported a similar sense of belonging as white individuals, while South Asians reported the strongest sense of belonging across all ethnic groups. South Asians represent the largest visible minority population in Ontario, and as noted in a 2010 study, a high proportion of the South Asian population lives in ethnic enclaves. 34 This may have contributed to our finding of a lower prevalence of fair or poor self-rated mental health among South Asians as studies of populations in Europe have shown that psychopathology is lower among immigrants and ethnic minorities who live in areas that have a higher proportion of residents of their own racial background. 35,36 Although ethnic enclaves were not reported to be common among the black population in the study by Qadeer et al., 34 past literature has reported that living in more racially diverse neighbourhoods was associated with a stronger sense of belonging to Canada. 37 Thus, the racial diversity of Ontario may help explain the positive self-rated mental health reported by black individuals in our study.
Similar to South Asians, a large proportion of the Chinese population in Ontario lives in ethnic enclaves. However, our study, along with previous evidence, has found that Chinese individuals had a weak sense of belonging and poor self-rated mental health, 12,28 suggesting that living in an ethnic enclave does not provide the same protection towards positive mental health across all ethnic groups. Indeed, Wu et al. 37 noted that among those living in more racially diverse communities, Asians reported a stronger sense of belonging towards their own ethnic group (in-group belonging) but a weaker sense of belonging to Canada as a whole. This same study found that the opposite was true for white individuals living in racially diverse areas (i.e., they reported a stronger sense of belonging to Canada but a weaker sense of in-group belonging). 37 In our study, we found that 1 in 3 white individuals reported a weak sense of belonging despite being the majority ethnic group. The reasons for this are unclear, and further work is needed to explore the association between racial diversity and sense of belonging and how this association might vary across ethnic groups.
The lower use of mental health services among ethnic minorities found in our study and supported by previous literature 3,8,9,38 may reflect a reluctance to seek help. For example, we found that even among those in need of mental health care, unmet needs—while high across all ethnic groups—were even higher among ethnic minorities. Few previous Canadian studies reported similar findings, with Chen et al. 20 noting high unmet needs among Chinese immigrants in British Columbia, while another study reported that individuals of black, Japanese, Chinese, Korean, and South Asian descent who had major depressive episode were all significantly less likely to seek treatment compared to white individuals. 21 Studies in the United States have also similarly reported higher unmet needs in both black and Asian populations. 17,18 Reluctance to seek help may be due to increased shame and stigma among ethnic minorities. Barriers to mental health service use that have been noted in the literature include individual and family factors, such as shame and stigma, as well as system-level factors, such as lack of culturally sensitive mental health services or institutional racism. 39 –41 Previous studies have indicated that Chinese and South Asian patients present to hospital with far more severe psychiatric symptoms, indicating a delay in seeking help, while other studies suggest that among black patients, multiple hospitalizations and involuntary admissions result in distrust with the mental health system. 42,43
A major strength of this study was the population-based sample and the use of survey weights, which allowed for greater generalizability. We had a large sample of over 16,000 ethnic minorities, which enabled us to not only compare across these major ethnic groups living in the same macro-environment but also examine the effects of age and immigration within each ethnic group. Although past studies have assessed a limited number of mental health–related factors among single ethnic groups or immigrants of various ethnicities and have largely been unable to disaggregate Chinese from South Asians, the present study was able to assess a list of key mental health factors simultaneously and across the Canada’s 4 major ethnic groups. Another strength of the study was that the CCHS survey was conducted in over 25 languages, which is especially important given the ethnic and immigrant focus of this study. In addition, we were able to examine the types of mental health services individuals sought more broadly, including those provided by psychologists, social workers, and other allied health professionals that are not currently captured in provincial administrative health data.
Limitations
The present study is not without limitations. First, this study relied on self-reported data and may be influenced by cultural differences in reporting or perceptions around mental health. Self-report, however, may be the best method to assess certain mental health factors, such as self-rated mental health, sense of belonging, and suicidal ideation, which cannot be measured using administrative or clinical databases and do not rely on an individual making contact with the health care system. Second, due to limitations with the questions asked in the CCHS, we were unable to disentangle whether the observed ethnic differences in self-reported diagnosed mental health conditions were the result of differences in reporting, help-seeking behaviours, or access to health services or reflected true differences in mental health burden. Third, this study combined multiple survey waves to acquire a large sample of ethnic minorities and therefore may have masked temporal trends in mental health status. Last, results were restricted to Ontario only, which may not necessarily be generalizable to less racially diverse regions in Canada.
Conclusion
In this large, population-based study, our results highlight the importance of ethnic-specific analysis as we found marked ethnic variations in self-reported mental health factors, service utilization, and unmet needs. The considerably lower use of mental health services among ethnic minorities with poor mental health is cause for concern. Further work is needed to better understand and address cultural and system-level barriers surrounding high unmet needs and to identify ethnically tailored and culturally appropriate clinical supports and practices to ensure equitable and timely mental health care. Moreover, as funding towards mental health services increases in Ontario, our results provide baseline estimates that can be compared to future estimates to ensure that any improvements to mental health care provisions and outcomes are equitably shared across all ethnic groups.
Footnotes
Acknowledgments
This study was supported by the Institute for Clinical Evaluative Sciences (ICES), which is funded by an annual grant from the Ontario Ministry of Health and Long-Term Care (MOHLTC). All decisions regarding study design, publication, and data analysis were made independent of the funding or sponsoring agencies. The authors acknowledge that the data used in this publication are from Statistics Canada’s Canadian Community Health Survey (CCHS). We thank all the participants of the CCHS and the staff from Statistics Canada who assisted in the survey data collection and management. We also acknowledge the Mental Health and Addictions Scorecard and Evaluation Framework grant from the Ontario MOHLTC.
Author Contributions
M. Chiu was the principal investigator, conceived the study, and prepared the first draft of the manuscript. A. Amartey performed the literature review. X. Wang performed the statistical analyses. All authors interpreted the data, critically revised the manuscript for important intellectual content, and approved the final version of the manuscript. X. Wang had full access to all the data in the study and takes responsibility for the integrity of the data and the accuracy of the data analysis.
Declaration of Conflicting Interests
The author(s) declared no potential conflicts of interest with respect to the research, authorship, and/or publication of this article.
Funding
The author(s) disclosed receipt of the following financial support for the research, authorship, and/or publication of this article: The Institute for Clinical Evaluative Sciences (ICES) is funded by the Ontario MOHLTC. The study results and conclusions are those of the authors and should not be attributed to any of the funding agencies or sponsoring agencies. No endorsement by ICES or the Ontario MOHLTC is intended or should be inferred. All decisions regarding study design, publication, and data analysis were made independent of the funding agencies.
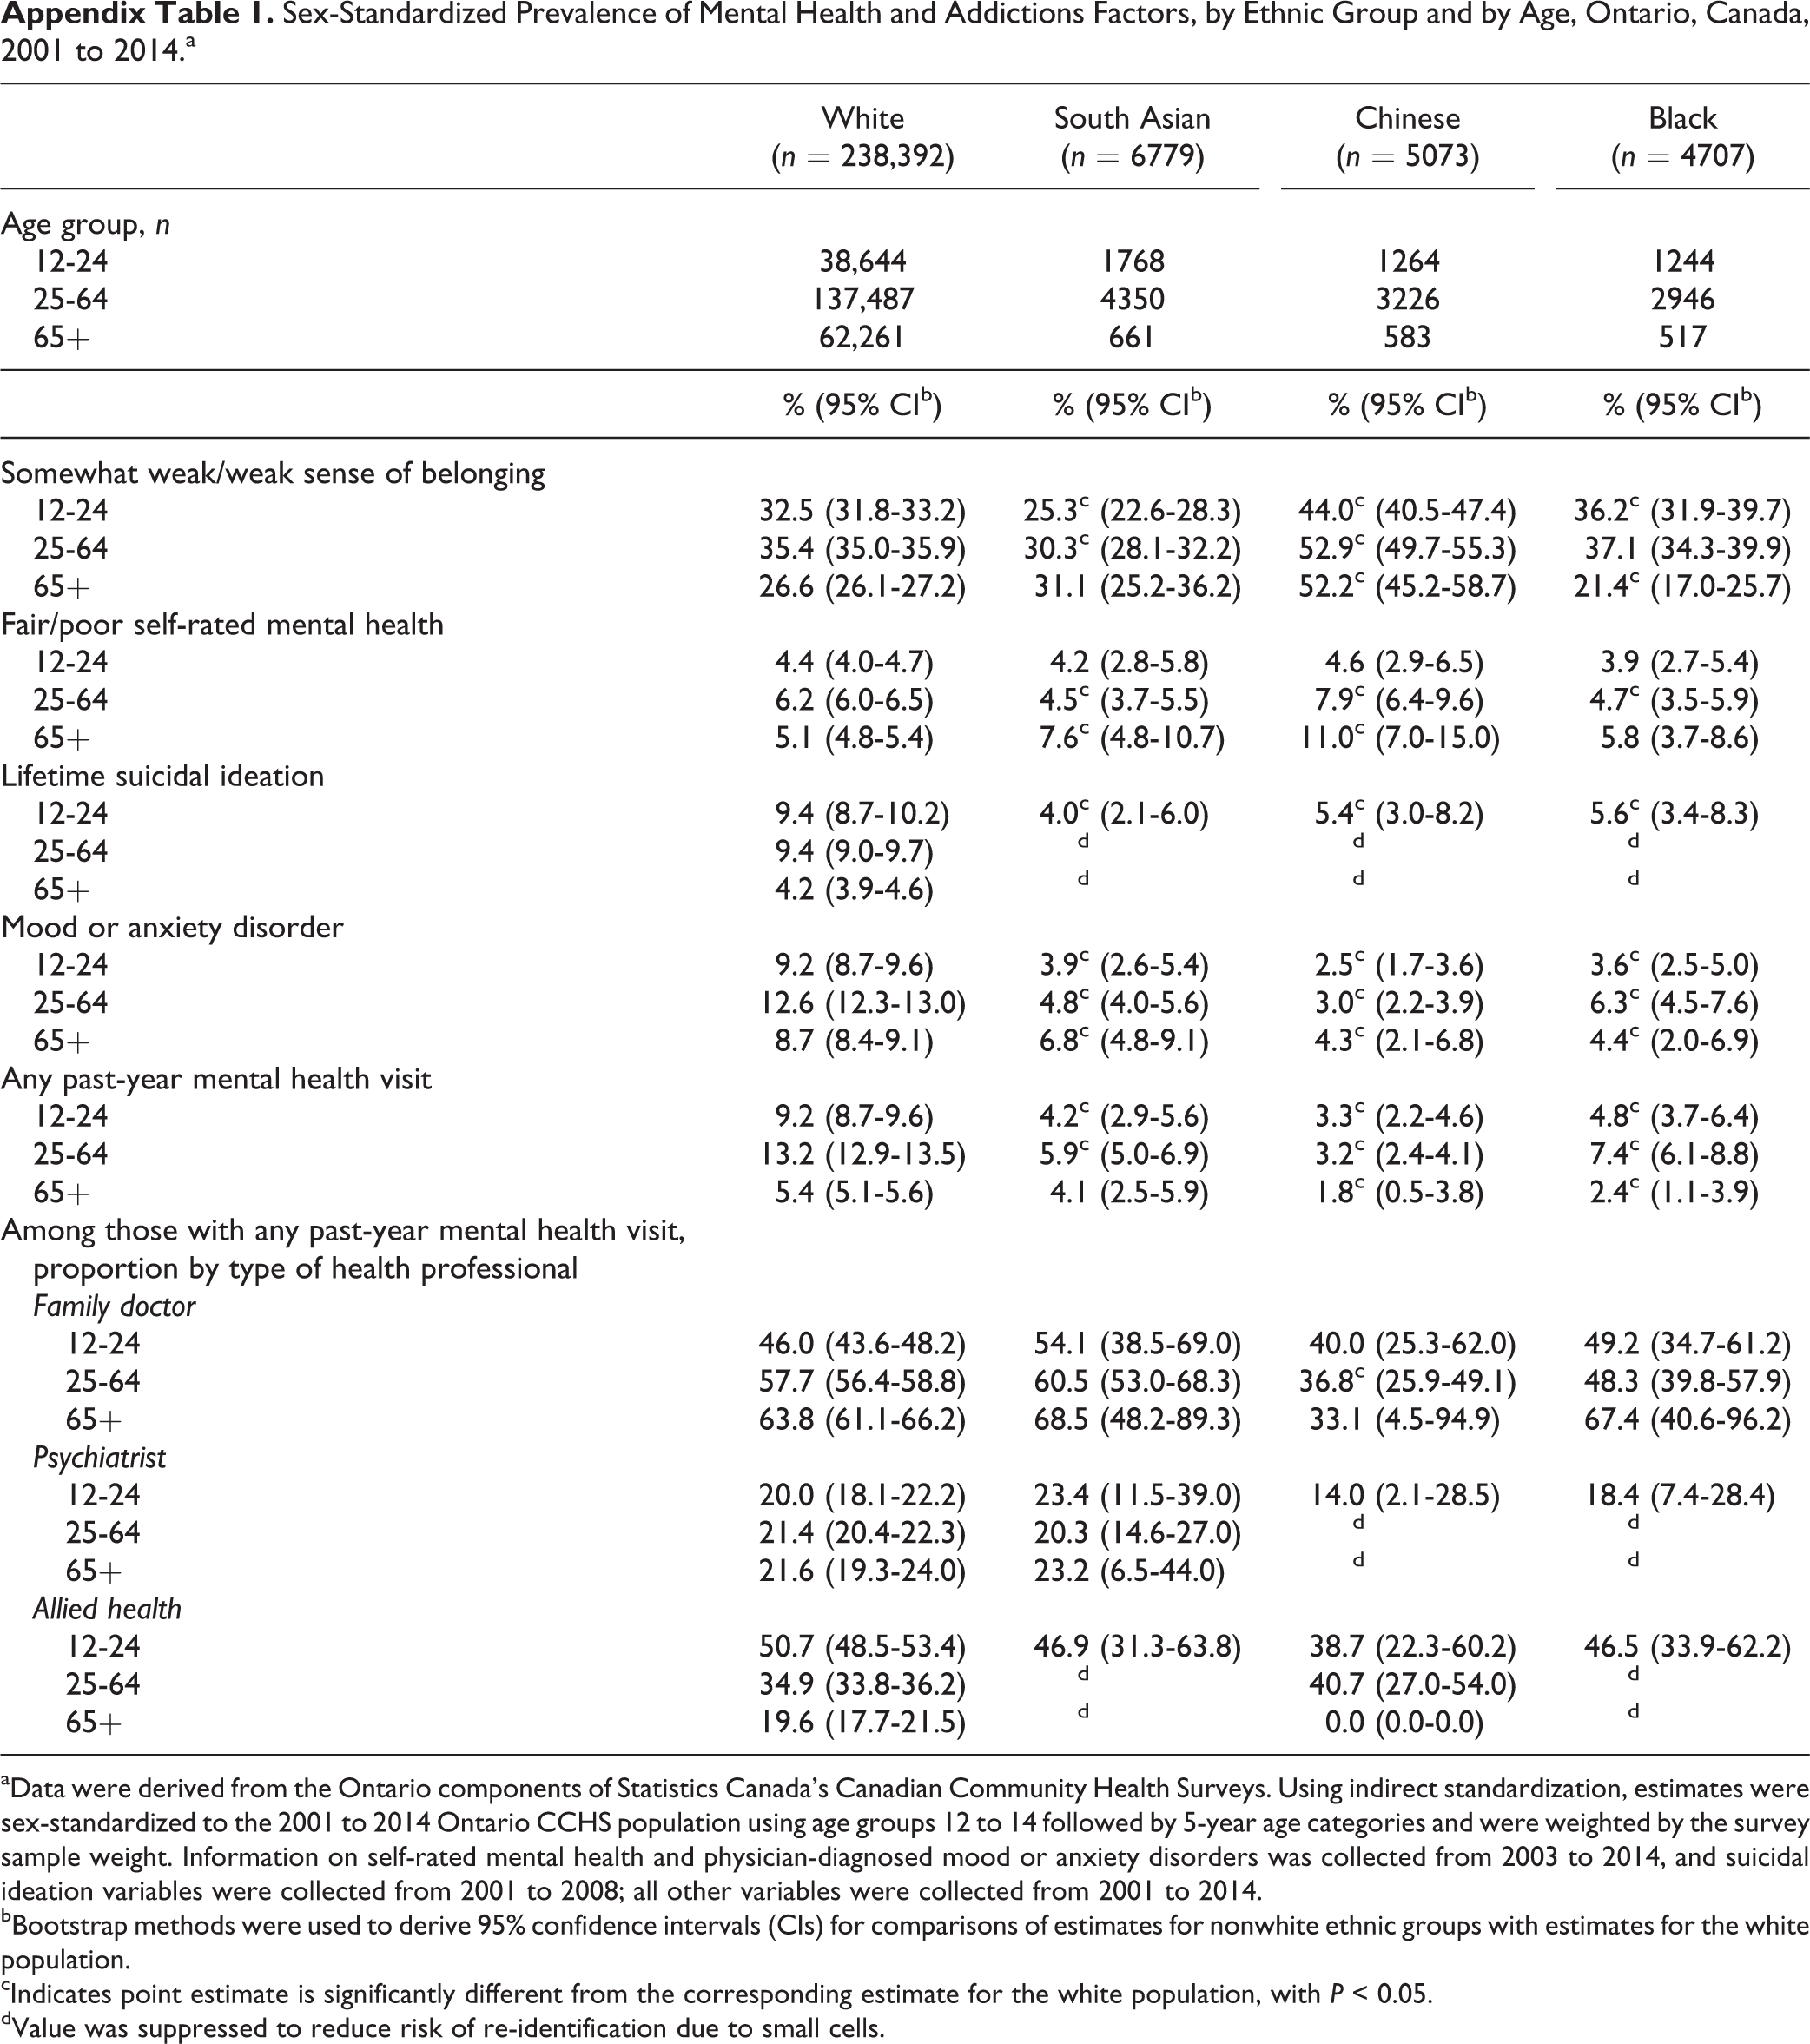
Sex-Standardized Prevalence of Mental Health and Addictions Factors, by Ethnic Group and by Age, Ontario, Canada, 2001 to 2014.a
| White (n = 238,392) | South Asian (n = 6779) | Chinese (n = 5073) | Black (n = 4707) | |
|---|---|---|---|---|
| Age group, n | ||||
| 12-24 | 38,644 | 1768 | 1264 | 1244 |
| 25-64 | 137,487 | 4350 | 3226 | 2946 |
| 65+ | 62,261 | 661 | 583 | 517 |
| % (95% CIb) | % (95% CIb) | % (95% CIb) | % (95% CIb) | |
| Somewhat weak/weak sense of belonging | ||||
| 12-24 | 32.5 (31.8-33.2) | 25.3c (22.6-28.3) | 44.0c (40.5-47.4) | 36.2c (31.9-39.7) |
| 25-64 | 35.4 (35.0-35.9) | 30.3c (28.1-32.2) | 52.9c (49.7-55.3) | 37.1 (34.3-39.9) |
| 65+ | 26.6 (26.1-27.2) | 31.1 (25.2-36.2) | 52.2c (45.2-58.7) | 21.4c (17.0-25.7) |
| Fair/poor self-rated mental health | ||||
| 12-24 | 4.4 (4.0-4.7) | 4.2 (2.8-5.8) | 4.6 (2.9-6.5) | 3.9 (2.7-5.4) |
| 25-64 | 6.2 (6.0-6.5) | 4.5c (3.7-5.5) | 7.9c (6.4-9.6) | 4.7c (3.5-5.9) |
| 65+ | 5.1 (4.8-5.4) | 7.6c (4.8-10.7) | 11.0c (7.0-15.0) | 5.8 (3.7-8.6) |
| Lifetime suicidal ideation | ||||
| 12-24 | 9.4 (8.7-10.2) | 4.0c (2.1-6.0) | 5.4c (3.0-8.2) | 5.6c (3.4-8.3) |
| 25-64 | 9.4 (9.0-9.7) | d | d | d |
| 65+ | 4.2 (3.9-4.6) | d | d | d |
| Mood or anxiety disorder | ||||
| 12-24 | 9.2 (8.7-9.6) | 3.9c (2.6-5.4) | 2.5c (1.7-3.6) | 3.6c (2.5-5.0) |
| 25-64 | 12.6 (12.3-13.0) | 4.8c (4.0-5.6) | 3.0c (2.2-3.9) | 6.3c (4.5-7.6) |
| 65+ | 8.7 (8.4-9.1) | 6.8c (4.8-9.1) | 4.3c (2.1-6.8) | 4.4c (2.0-6.9) |
| Any past-year mental health visit | ||||
| 12-24 | 9.2 (8.7-9.6) | 4.2c (2.9-5.6) | 3.3c (2.2-4.6) | 4.8c (3.7-6.4) |
| 25-64 | 13.2 (12.9-13.5) | 5.9c (5.0-6.9) | 3.2c (2.4-4.1) | 7.4c (6.1-8.8) |
| 65+ | 5.4 (5.1-5.6) | 4.1 (2.5-5.9) | 1.8c (0.5-3.8) | 2.4c (1.1-3.9) |
| Among those with any past-year mental health visit, proportion by type of health professional | ||||
| Family doctor | ||||
| 12-24 | 46.0 (43.6-48.2) | 54.1 (38.5-69.0) | 40.0 (25.3-62.0) | 49.2 (34.7-61.2) |
| 25-64 | 57.7 (56.4-58.8) | 60.5 (53.0-68.3) | 36.8c (25.9-49.1) | 48.3 (39.8-57.9) |
| 65+ | 63.8 (61.1-66.2) | 68.5 (48.2-89.3) | 33.1 (4.5-94.9) | 67.4 (40.6-96.2) |
| Psychiatrist | ||||
| 12-24 | 20.0 (18.1-22.2) | 23.4 (11.5-39.0) | 14.0 (2.1-28.5) | 18.4 (7.4-28.4) |
| 25-64 | 21.4 (20.4-22.3) | 20.3 (14.6-27.0) | d | d |
| 65+ | 21.6 (19.3-24.0) | 23.2 (6.5-44.0) | d | d |
| Allied health | ||||
| 12-24 | 50.7 (48.5-53.4) | 46.9 (31.3-63.8) | 38.7 (22.3-60.2) | 46.5 (33.9-62.2) |
| 25-64 | 34.9 (33.8-36.2) | d | 40.7 (27.0-54.0) | d |
| 65+ | 19.6 (17.7-21.5) | d | 0.0 (0.0-0.0) | d |
aData were derived from the Ontario components of Statistics Canada’s Canadian Community Health Surveys. Using indirect standardization, estimates were sex-standardized to the 2001 to 2014 Ontario CCHS population using age groups 12 to 14 followed by 5-year age categories and were weighted by the survey sample weight. Information on self-rated mental health and physician-diagnosed mood or anxiety disorders was collected from 2003 to 2014, and suicidal ideation variables were collected from 2001 to 2008; all other variables were collected from 2001 to 2014.
bBootstrap methods were used to derive 95% confidence intervals (CIs) for comparisons of estimates for nonwhite ethnic groups with estimates for the white population.
cIndicates point estimate is significantly different from the corresponding estimate for the white population, with P < 0.05.
dValue was suppressed to reduce risk of re-identification due to small cells.