
Abstract
Objective:
Although antidepressants and antipsychotics are valuable medications in the treatment of select psychiatric disorders, there is increasing focus on the balance of risks and benefits of these drugs as prescribed, particularly in the pediatric population. We examined recent national trends and interprovincial variation in dispensing of antipsychotic and antidepressant prescriptions to the Canadian pediatric population.
Method:
We conducted a population-based cross-sectional study of antidepressant and antipsychotic prescriptions dispensed by Canadian pharmacies to the pediatric population (≤18 years) between 2010 and 2013. Prescription volumes were obtained from IMS Health. Analysis was stratified by drug, year, quarter, and province and population-standardized using age-adjusted population estimates.
Results:
From the first quarter of 2010 to the fourth quarter of 2013, dispensing of antipsychotics to the pediatric population increased 33% (from 34 to 45 prescriptions per 1000) and dispensing of antidepressants increased 63% (from 34 to 55 per 1000). We observed a 1.5-fold interprovincial difference in dispensing rates for antidepressants (range: 189 per 1000 to 275 per 1000) and a 3.0-fold difference for antipsychotics (range: 85 per 1000 to 253 per 1000) in 2013. Among antidepressants, selective serotonin reuptake inhibitors were the most dispensed (76%), with fluoxetine being the leading agent. Among antipsychotics, atypical antipsychotics were the most dispensed (97%), with risperidone being the leading agent.
Conclusions:
Antipsychotic and antidepressant dispensing to the Canadian pediatric population increased from 2010 to 2013, with considerable interprovincial variation. Future research is required to explore reasons for observed patterns to optimize care for the Canadian pediatric population.
Use of psychotropic medications to treat mental health disorders in the pediatric population has steadily increased. 1,2 Antidepressants and antipsychotics, specifically, are among the most commonly used drug classes in this population 3 and have several overlapping indications. 4 Studies in Canada, 5,6 the United States, 7 –9 and Europe 10,11 have found increased use of antidepressants and antipsychotics in the pediatric population, although no Canadian studies report data beyond 2009. 5,6
Concurrently, there has been increased focus on the risk-benefit profile of these medications in the pediatric population. Both the effectiveness and the potential for selective serotonin reuptake inhibitor (SSRI)–related increase in suicidal ideation in youth have been extensively researched. 12 –15 The effects of the Food and Drug Administration 16 and Health Canada 17,18 warnings regarding SSRI-related adverse effects on rates of prescriptions and suicide have also been studied. This extant research on efficacy and risk has recently been synthesized by Garland et al 19 and supports the ongoing use of SSRIs in the pediatric population for select indications, with close clinical monitoring for adverse events. In addition, studies have reported that the increased use of antipsychotics in the pediatric population is mostly due to increased prescribing for behavioural and affective indications, specifically. 7,10 Yet, the efficacy of antipsychotics for some of these indications has not been firmly established, 20,21 and concerns have been raised regarding associated adverse events, such as metabolic syndrome. 22,23 As such, broadening clinical indications, as well as debate regarding the risk-benefit profile of antidepressants and antipsychotics in the pediatric population, may result in inadvertent medication overuse and cause selection of medications to be influenced by many factors, including prescribing attitudes, 24 standards of care, 25 access to mental health care, 26 disease prevalence, 27 and pharmaceutical marketing. 28 These factors differ from province to province, resulting in potential for inconsistency in prescribing across Canada.
Previous Canadian research examining regional variation in prescription rates of other drug classes in other populations (such as high-dose opioids in the general population 29 and antipsychotics in the elderly population 30 ) demonstrates large variations among provinces. In 2008, Mitchell et al 24 investigated the use of antidepressants and stimulants in the pediatric population in Manitoba and British Columbia and found considerable variation between the provinces. As such, broadening the work of Mitchell et al 24 to an analysis of all Canadian provinces will provide useful insights into regional prescribing, as no previous study has explored this topic nationally. Therefore, we sought to characterize recent trends and interprovincial variation in antidepressant and antipsychotic dispensing to the Canadian pediatric population.
Methods
We conducted a population-based cross-sectional study of all antidepressants and antipsychotics dispensed by Canadian retail pharmacies to individuals ≤18 years of age between January 1, 2010, and December 31, 2013, to understand temporal trends in use. Further, we compared provincial dispensing rates of these drugs in 2013, specifically, to better understand geographic variability and preference for specific agents. The individual drugs examined and their class groupings are listed in Table S1 of the supplementary appendix. We used the IMS Geographic Prescription Monitor (GPM) 12 data to determine the number of prescriptions dispensed from retail pharmacies across Canada. The IMS GPM 12 data were stratified by drug, province, age group, month, and year. We grouped cyclic antidepressants and monoamine oxidase inhibitors together because of the relatively low usage of individual agents within these subclasses. We also omitted asenapine, lurasidone, and paliperidone in analyses of dispensing by province and drug as the number of prescriptions for these agents was negligible.
Data Source
The source of information supporting IMS Brogan’s GPM 12 is the IMS retail prescription database, which contains prescription transactions from Canadian drug stores for all branded and generic dispensed products. At the national level, more than 78% of total prescriptions dispensed are captured by a panel composed of approximately 5900 pharmacies. The monthly estimates are created using IMS Brogan’s patented geospatial projection methodology. The survey design yields a sampling error of about 3% for the psychotherapeutics class. At the provincial level, the sampling error can reach slightly higher levels, although it will not exceed 5% to 10% in the vast majority of cases (Josiane Gaudet, personal communication, February 12, 2016). This data source is regularly used for research purposes. 29,31
This data source does not provide clinical information such as associated indications and patient information (i.e., age, sex), precluding analysis of prescribing appropriateness. The data source also only made 4 years of data available, preventing an analysis over a longer period of time. However, the data present prescriptions from all payers and are not affected by regional reimbursement policies. Additionally, the data source provides prescription dispensing data from pharmacies, which ensures that it does not inappropriately include prescriptions recommended by physicians, but not filled, in the estimates. Ethics approval and informed written consent was not required because the data were deidentified, aggregated prescription volumes.
Statistics Canada CANSIM Database
We used the Statistics Canada CANSIM database to obtain population estimates stratified by province, year, and age group for the years 2010 to 2013. 32 These estimates were used to population-standardize prescription data from the IMS GPM 12 for only the pediatric population. 12
Statistical Analysis
We used descriptive statistics to report the total number of antidepressant and antipsychotic prescriptions dispensed per 1000 population for those ≤18 years of age for each quarter of the study period. In addition, we calculated the number of prescriptions dispensed per 1000 population for each drug class (antidepressants and antipsychotics) and for each agent within each class for the most recent year available (2013), in order to compare provincial prescription dispensing rates. We completed all analysis using SPSS 18. 33
Results
Antidepressants
Overall, 5 094 095 antidepressant prescriptions were dispensed to the Canadian pediatric population between 2010 and 2013. The national dispensing rate increased 63%, from 34 per 1000 in the first quarter (Q1) of 2010 to 55 per 1000 in the fourth quarter (Q4) of 2013 (Figure 1). The provinces below the national rate of prescriptions dispensed in 2013 (201 per 1000) were British Columbia, Alberta, Manitoba, and Quebec (Figure 2). The rates for Ontario, Nova Scotia, New Brunswick, Prince Edward Island, and Newfoundland and Labrador were above the national rate, while the dispensing rate in Saskatchewan was equal to the national rate. We observed considerable interprovincial variation in dispensing rates of antidepressants, with a 1.5-fold difference between the lowest dispensing rate (British Columbia: 189 per 1000) and highest dispensing rate (Newfoundland: 275 per 1000; Figure 2). SSRIs were the dominant class of antidepressant dispensed (76%; Figure 3). The leading antidepressant dispensed nationally was fluoxetine, representing 27% of all antidepressants dispensed, followed by citalopram (16%), sertraline (16%), and escitalopram (12%; Figure 4).
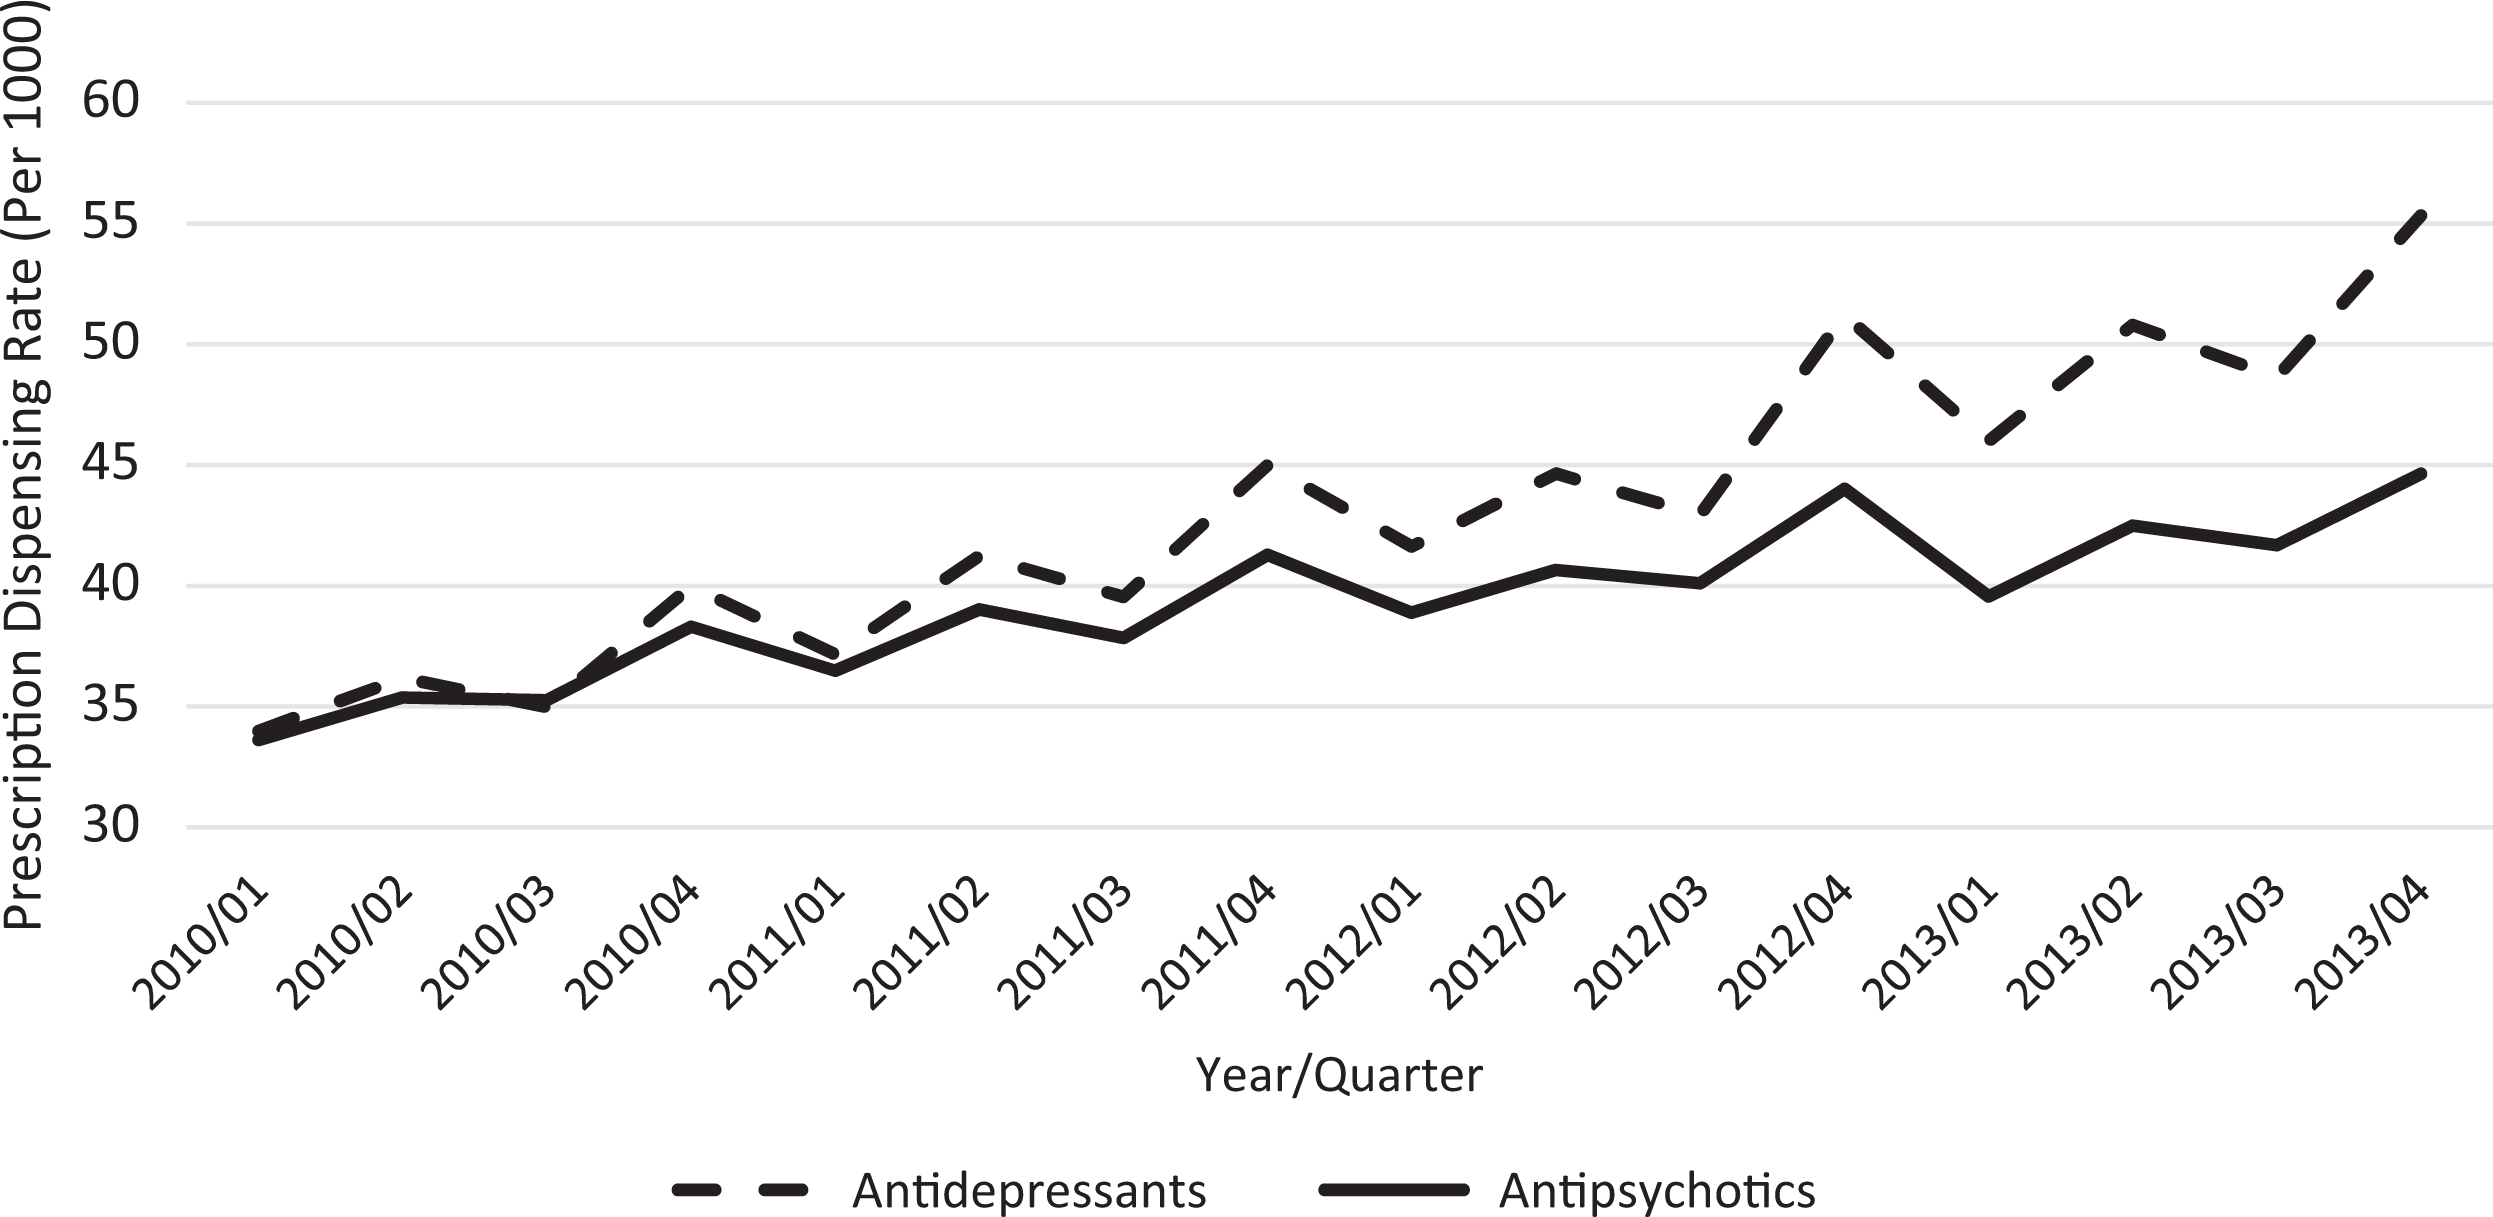
National antipsychotic and antidepressant dispensing rates from 2010 to 2013.
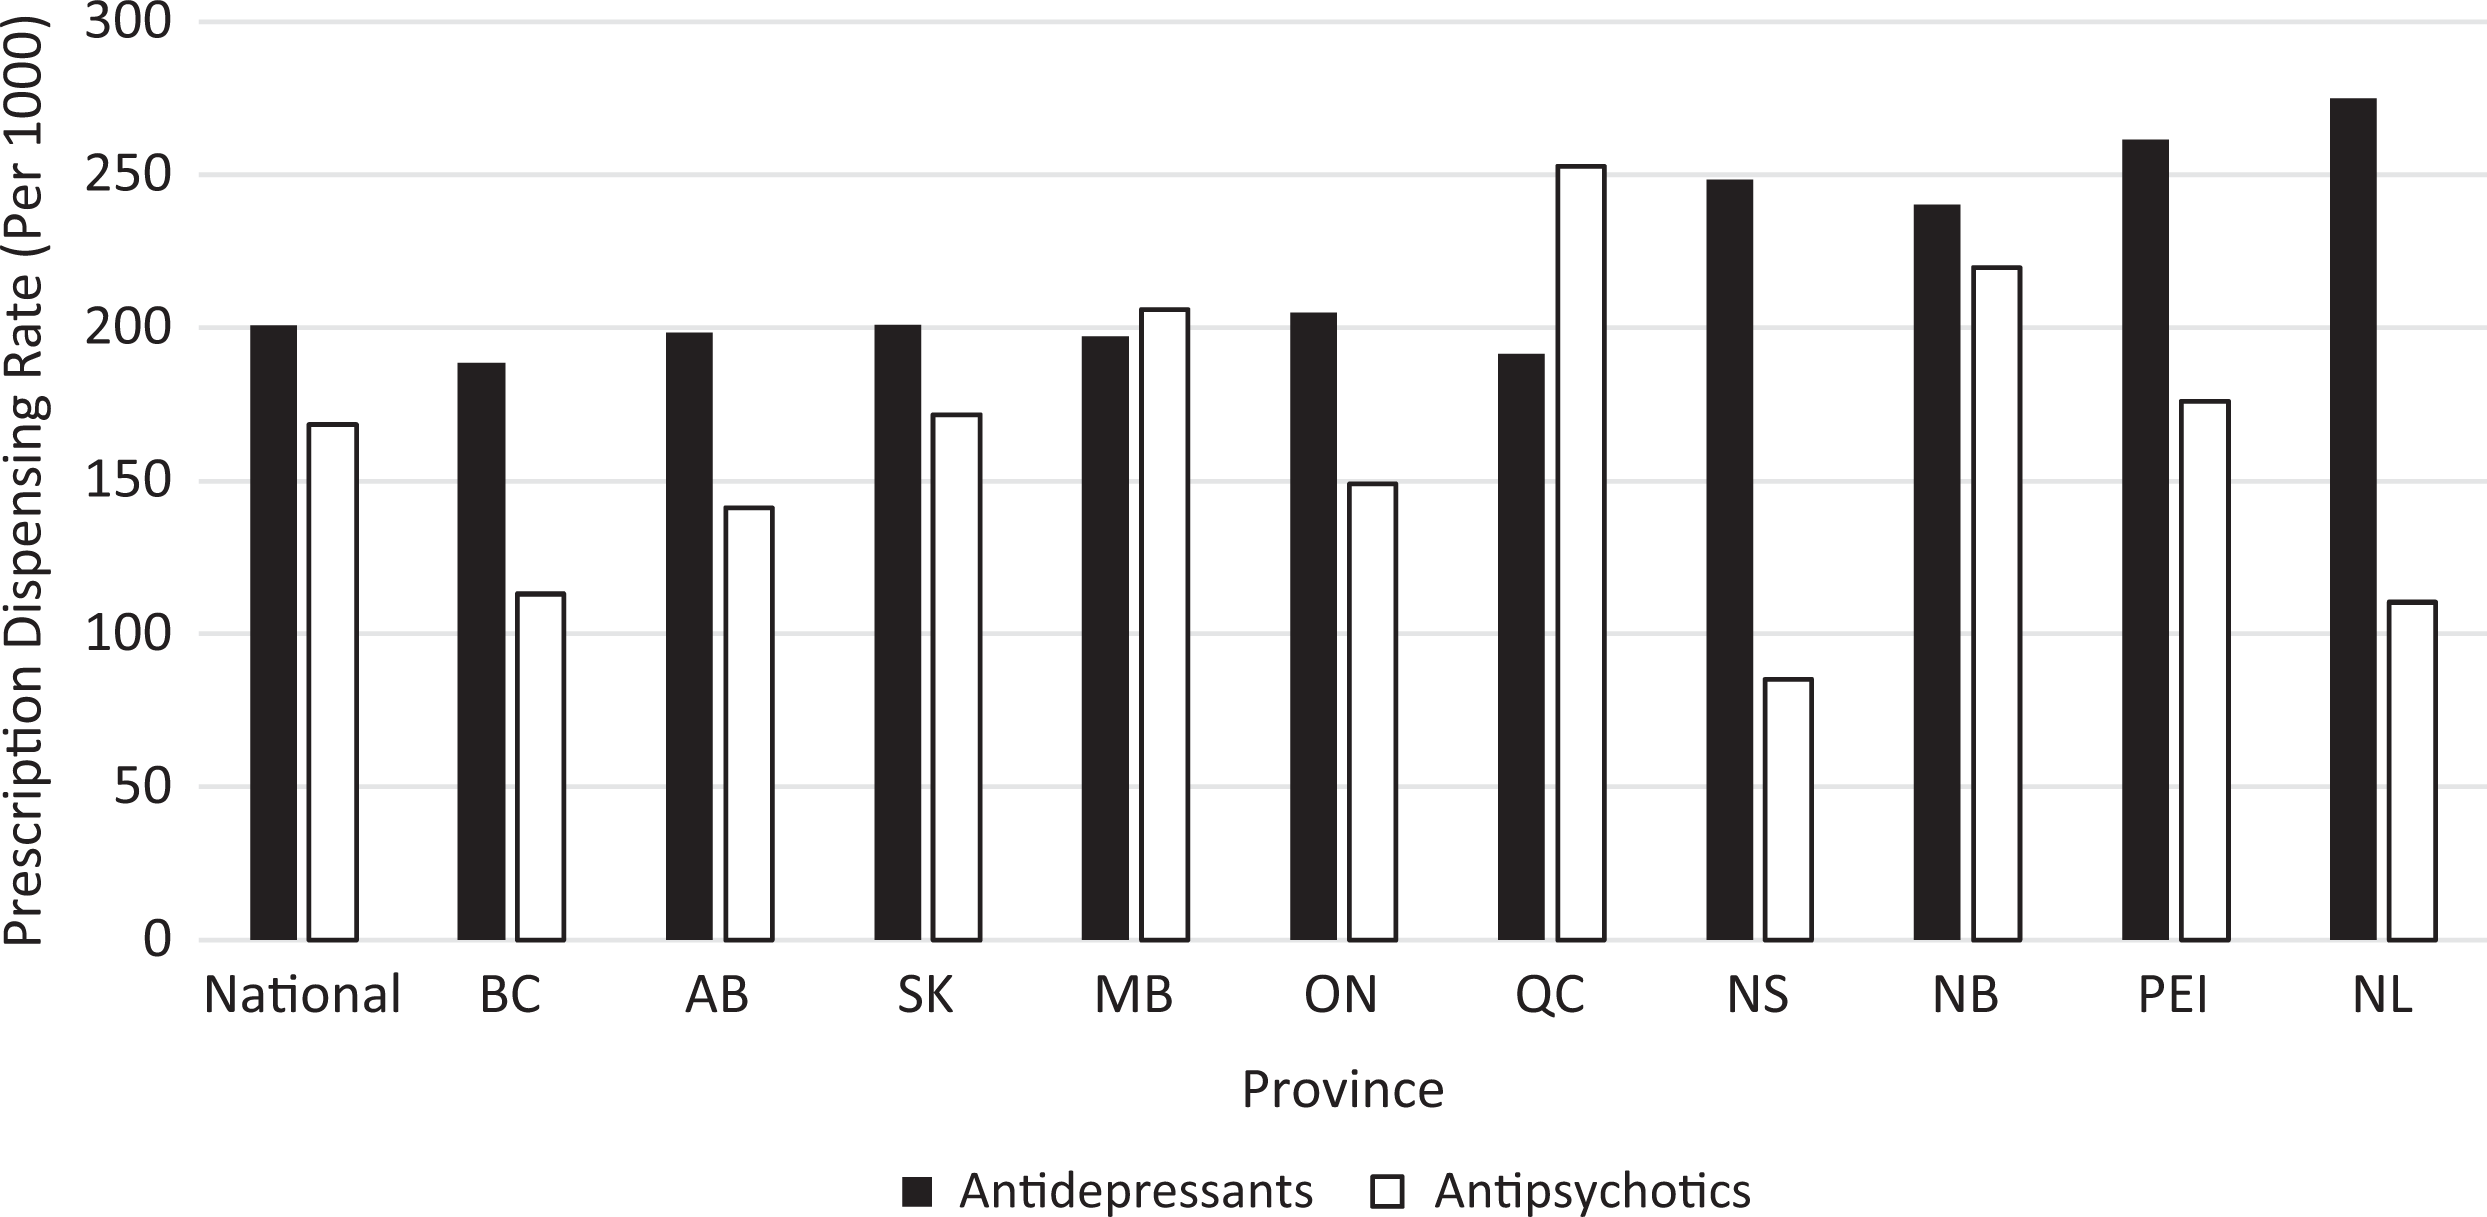
Antipsychotic and antidepressant dispensing rates in 2013, by province.
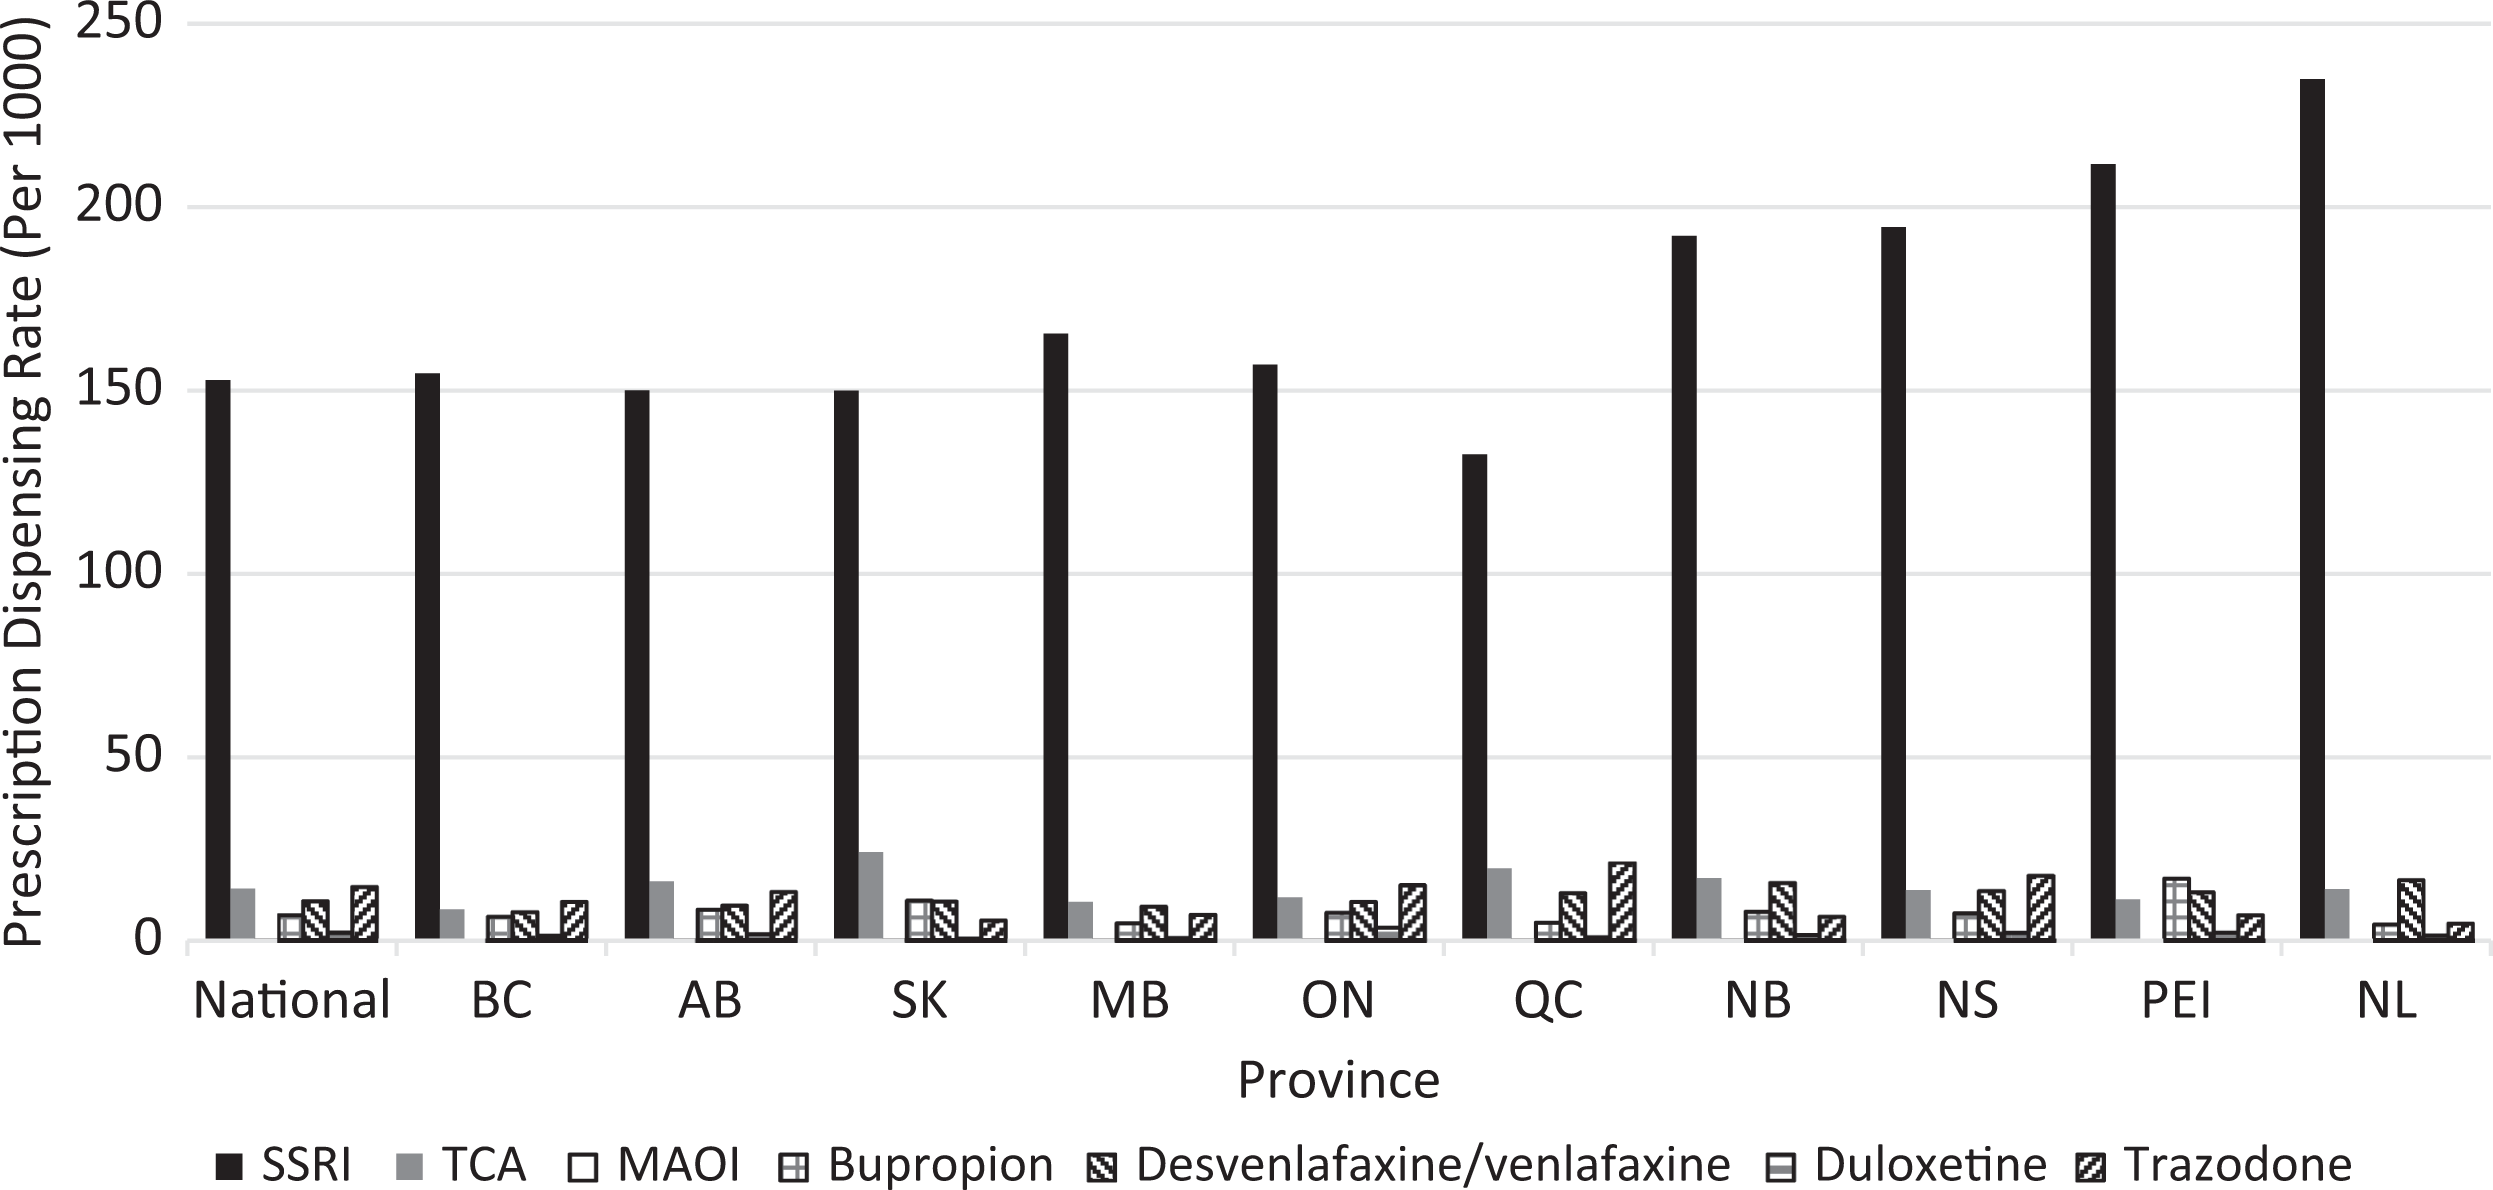
Antidepressant dispensing rates in 2013, by agent and province.
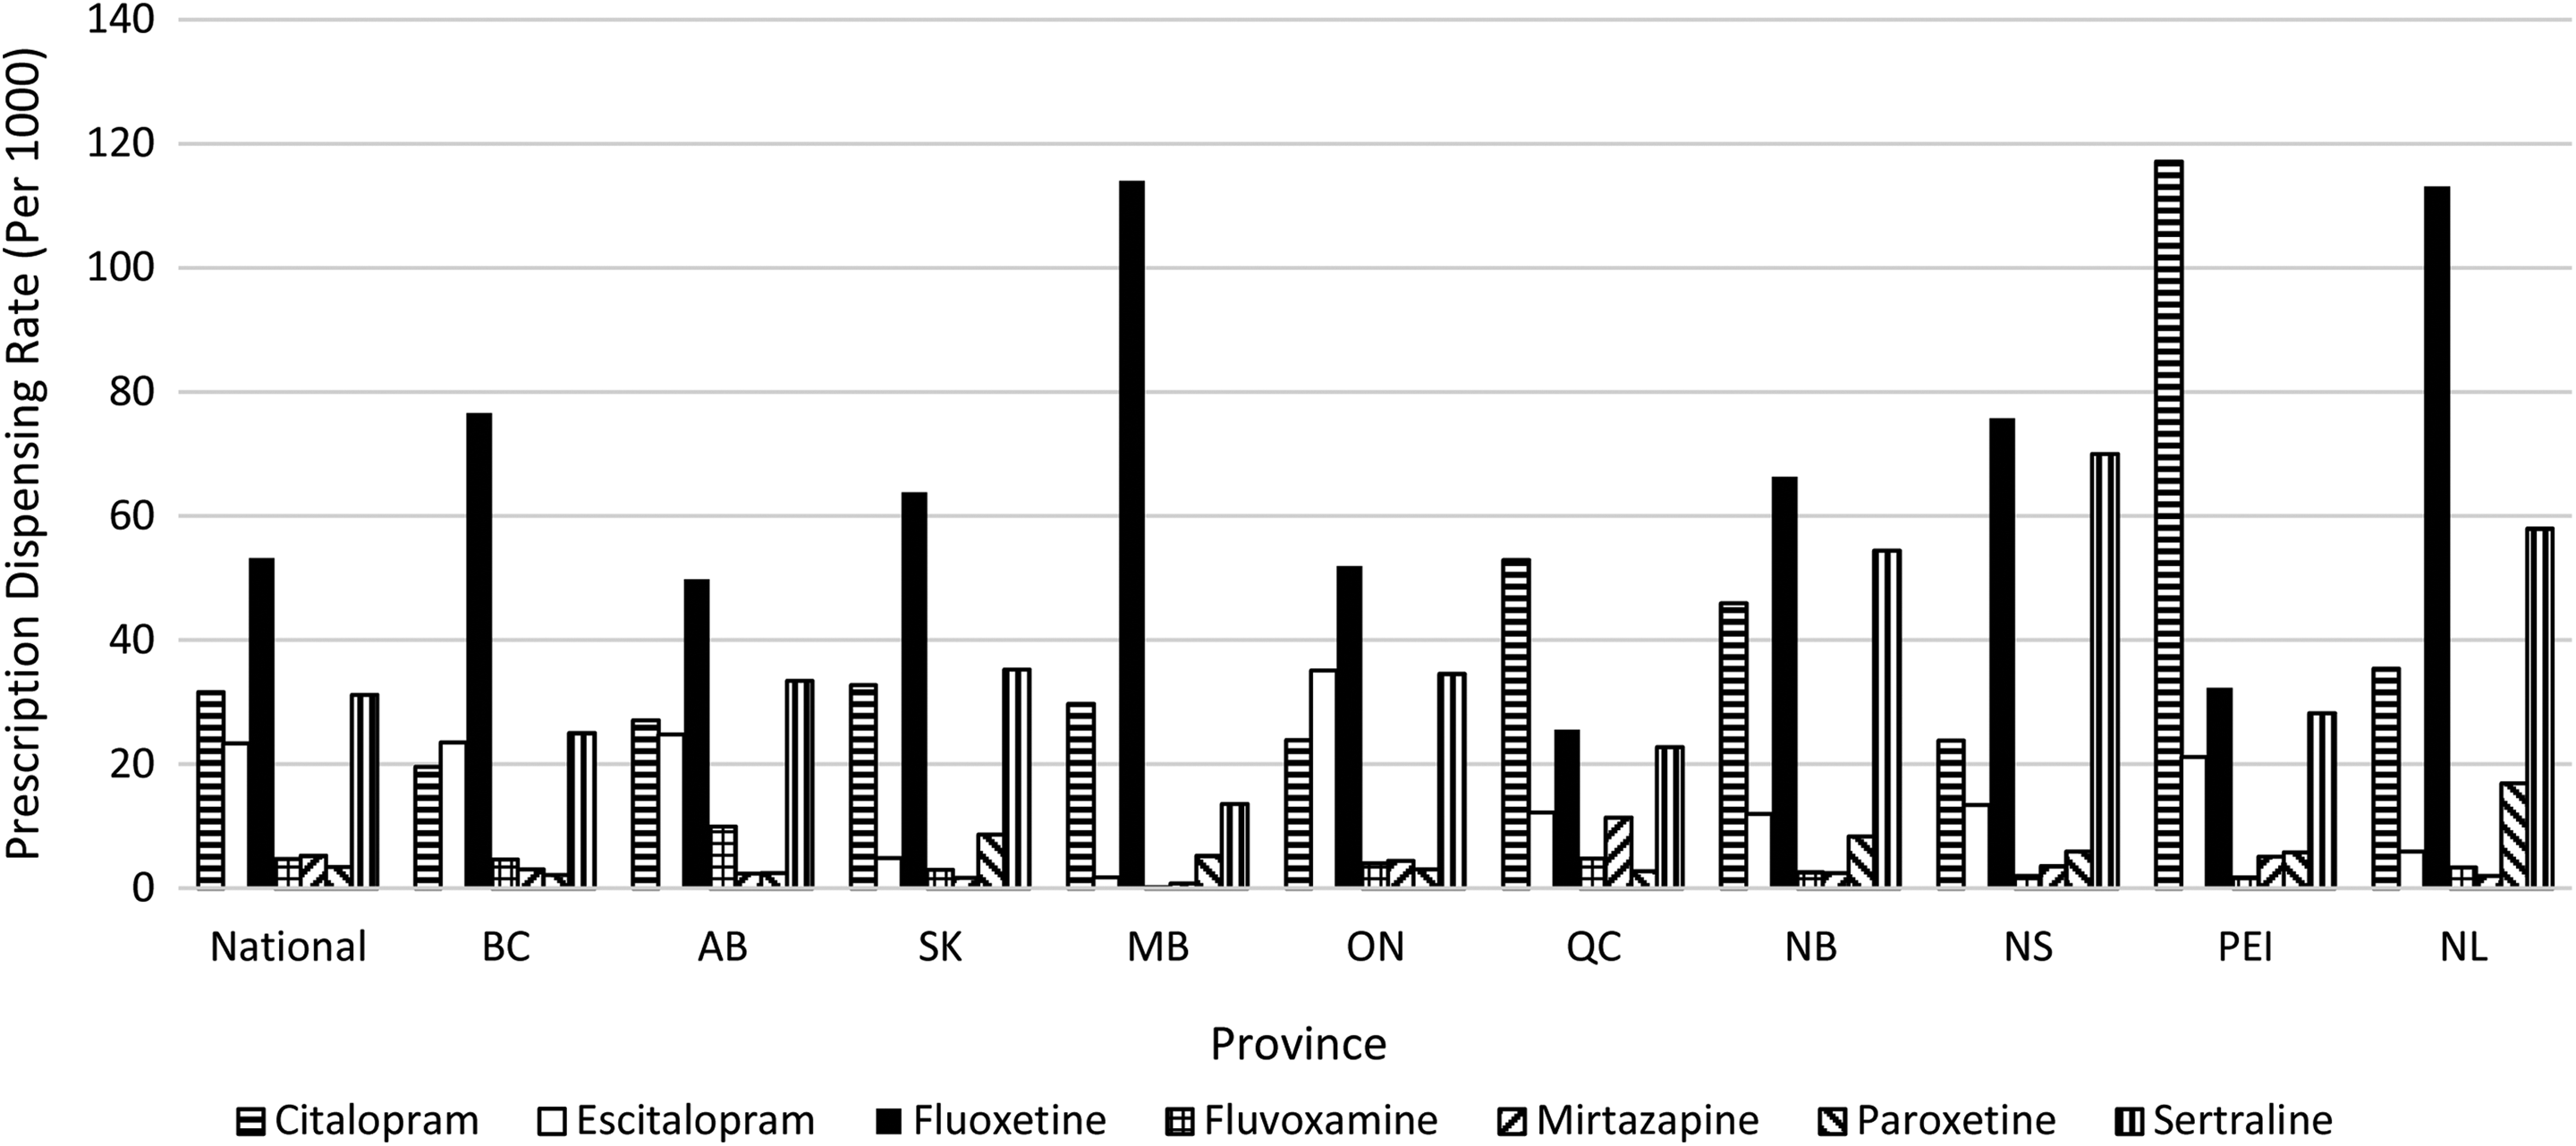
Selective serotonin reuptake inhibitor dispensing rates in 2013, by agent and province.
Antipsychotics
Overall, 4 651 256 antipsychotic prescriptions were dispensed to the Canadian pediatric population between 2010 and 2013. The antipsychotic prescription dispensing rate increased by 33% over the study period, from 34 per 1000 in Q1 2010 to 45 per 1000 in Q4 2013. The provinces that fell below the national rate of prescriptions dispensed in 2013 (168 per 1000) were British Columbia, Alberta, Ontario, Nova Scotia, and Newfoundland and Labrador. The provinces that dispensed above the national rate were Saskatchewan, Manitoba, Quebec, New Brunswick, and Prince Edward Island. We observed a 3-fold difference between the highest (Quebec: 253 per 1000) and lowest dispensing rates (Nova Scotia: 85 per 1000). Atypical antipsychotics were the dominant class of antipsychotic dispensed (97%; Figure 5). The leading antipsychotic dispensed nationally was risperidone, representing 50% of all antipsychotics dispensed, followed by quetiapine (25%), aripiprazole (14%), and olanzapine (4%).
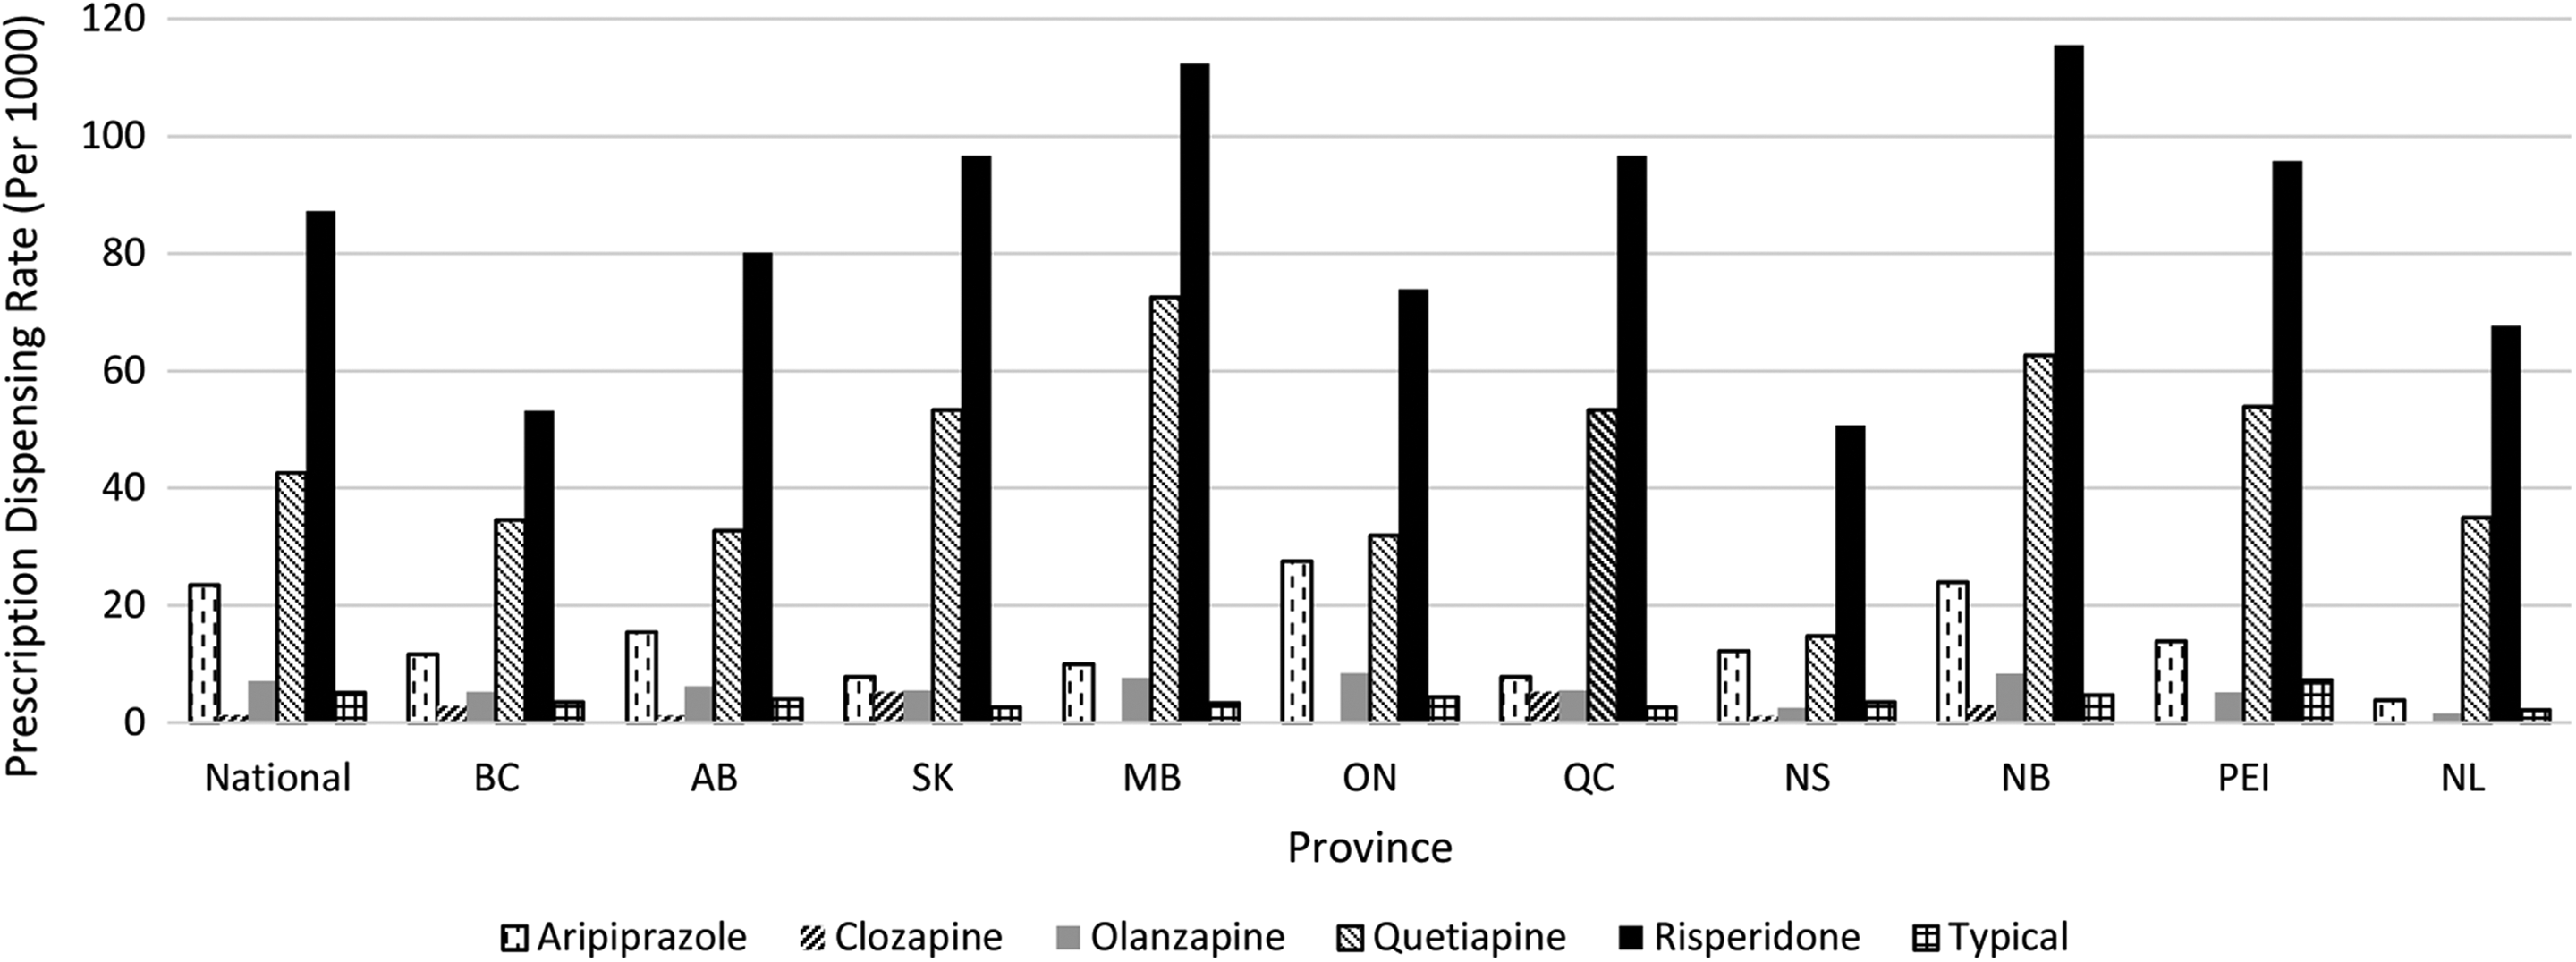
Antipsychotic dispensing rates in 2013, by agent and province.
Discussion
In this descriptive cross-sectional study, we found that dispensing rates for antidepressants and antipsychotics to the Canadian pediatric population increased by 63% and 33%, respectively, from Q1 2010 to Q4 2013. We also found significant interprovincial variation in dispensing rates for antidepressants and antipsychotics. This study builds on previous research that explored utilization trends until 2009 and expands on this research by comparing use among provinces.
The increase in prescription dispensing rates from 2010 to 2013 described in our study shows that previous trends in drug utilization among the pediatric population have continued. However, our study should be compared with the previous Canadian and international evidence with caution because of varying types of data used to measure medication use, including rate of prescription recommendations by physicians, rate of users of a given drug, and rate of prescriptions dispensed by pharmacies. Previous Canadian studies examining antidepressant use generally indicated a small decrease in use after regulatory warnings were released by Health Canada in 2004, as evidenced by a 23.4% decrease in users found by Tournier et al 34 and a relative risk of antidepressant prescriptions of 0.86 found by Katz et al in 2006 compared with 2001. 18 However, in a study examining recent national data, Lam et al 5 presented a subsequent increase of 29% in physician antidepressant prescription recommendations from 2005 to 2009. A similar increase in use of antidepressants has been reported recently in the United States, 35 as well as in Europe. 36
In the antipsychotics domain, large increases have been documented in Canada, as a Manitoba study found a 289% increase in users from 1996 to 2001, 1 and a more recent national study by Pringsheim et al 6 found a 114% increase in physician prescription recommendations from 2005 to 2009. 6 International literature has documented large increases as well, finding increases ranging from 96% to 97% when examining users and prescriptions per 1000 patient-years in the United States and Europe, respectively, 7,10 while a US-based study by Cooper et al 8 examining prescriptions dispensed found a 358% increase.
By using data representing prescriptions actually dispensed by pharmacies, our study builds on Canadian evidence by Pringsheim et al 6 and Lam et al, 5 which used data on prescription recommendations (that may or may not have been filled), and our study confirms findings of increased use reported internationally. 8 Although a comparable study examining national antipsychotic and antidepressant prescription dispensing data for the pediatric population has not yet been conducted in Canada, the study by Cooper et al 8 using dispensing data from the United States reported a rate of 39.4 per 1000 in 2002 for antipsychotics. This is in contrast to the rate of 168 per 1000 reported by our study, which may reflect a difference between countries as well as an increase over time. No such previous studies examining antidepressants were found.
The increase in pediatric psychotropic drug dispensing found by our study warrants further exploration and may be related to a variety of factors. This increase may indicate better case ascertainment in the pediatric population, translating to better care. 37 This hypothesis may be encouraging, considering that only a minority of young people who require mental health services actually access them. 38,39 Alternatively, the findings may indicate poor access to nonpharmacologic treatments and subsequent increased use of medications. 40 A study examining mental health services across Canada reported that only 31.4% of mental health agencies for children and adolescents met the benchmarks for wait times designed by the Canadian Psychiatric Association. 41 A Quebec study seeking to quantify wait times found mean wait times for outpatient clinics to be 5.7 months and 4.8 months for specialized clinics. 42 In contrast, there is no delay to access pharmacologic treatments, which may contribute to a higher propensity to use medications, especially in regions with inadequate access to psychosocial treatment services. A third factor that may be driving the increased dispensing rates of psychotropic medications is a broadening of clinical indications for which these medications are prescribed. 1,43,44 Lam et al 5 reported a 139% increase in SSRI use for pediatric anxiety disorders between 2005 and 2009, proposing increasing clinician comfort with prescribing SSRIs for broadening clinical indications. In addition, Alessi-Severeni et al 1 reported that the percentage of patients who were prescribed an antipsychotic in combination with a stimulant in Manitoba increased from 12% to 43% from 1999 to 2008, suggesting increased use of antipsychotics off-label in children with attention-deficit hyperactivity disorder as a possible driver of increased use. Other possible contributors to increased use of antidepressants and antipsychotics include an increase in physician caution and closer monitoring when prescribing in response to the literature, resulting in a reduction in median prescription volume and increased number of prescriptions, or, alternatively, changes in treatment adherence over time.
Further, although previous studies have focused on utilization in individual provinces, 1,44 –46 or compared 2 provinces only, 24 our study examined all provinces and found wide variations in antipsychotic and antidepressant dispensing across the Canadian provinces. We found that antipsychotics had the greatest variation in prescription dispensing rates (3.0-fold), while antidepressants exhibited a lower but still considerable variation (1.5-fold). These findings are similar to those described in other Canadian studies examining interprovincial variation in high-dose opioid dispensing in adults, in which a 3-fold difference was found between Ontario, the highest prescriber, and Quebec, the lowest prescriber. 29 A similar difference was found by an Ontario Drug Policy Research Network report examining antipsychotic prescriptions to elderly persons, in which Quebec dispensed 3-fold more prescriptions compared with Alberta. 30 Although the amount of variation in these studies was similar to the variation in antipsychotic dispensing found by our study, the provinces that prescribed the most or fewest prescriptions differed. The one exception to this is Quebec, where the antipsychotic dispensing rate among the elderly population was the highest, similar to our findings in the pediatric population.
It is probable that prescribing varies by jurisdiction due to a variety of factors. While pediatric data on access to mental health treatment is limited, adult data from the Canadian Community Health Survey (CCHS) found that rates of psychiatric help seeking were lowest in Newfoundland and Labrador and highest in the territories and that unavailability of services was cited as a reason for not seeking help most commonly in Newfoundland and Labrador, New Brunswick, Manitoba, and the territories. 26 As such, the observed high antidepressant prescription rates in Newfoundland and Labrador and New Brunswick could be associated with inadequate access to appropriate psychosocial treatment and/or differing mental health policies across Canadian provinces. 25 However, this pattern does not follow for antipsychotics and thus does not explain the differential impact of inadequate access on one drug class. Differences in the prevalence of depression, mania, panic disorder, social phobia, and agoraphobia have also been reported by a study using the CCHS, which may contribute to variation in dispensing rates. 27 Other factors such as regional prescribing attitudes or regional thought leaders 24 and increased influence of pharmaceutical industries through funding and marketing to physicians 28 have been proposed, but further work is required to investigate the impact of these factors on prescription rates. Because of the extensive debate within the literature regarding the risk-benefit profile of the antipsychotic drug class for the pediatric population, expanding clinical indications, and lack of consensus within the evidence, the antipsychotic drug class may be especially vulnerable to the effect of these factors on selection of medications.
Patterns of dispensing for individual agents were similar across provinces. The majority of antidepressant prescriptions dispensed were for SSRIs (76%), which are first line in treatment of depression, anxiety, and obsessive-compulsive disorder in the pediatric population. 47 –51 Among antipsychotics, we found that atypical antipsychotics were dispensed most frequently (97%), which is in line with evidence and guidelines indicating that they should be prescribed first line for schizophrenia, psychoses, and bipolar disorder in this population. 52,53
This study had several limitations. First, the study used IMS GPM 12 data, which did not allow us to calculate the number of users taking prescription medications. Second, there was no clinical information such as exact age, sex, and indication, to inform the appropriateness of prescribing. Third, we had no data on prescriptions from Nunavut, the Yukon, and the Northwest Territories. Finally, the IMS GPM 12 data allow access to 4 years of data at a time, which prevented analysis over a longer period of time.
Conclusion
We found that antipsychotic and antidepressant dispensing rates in the Canadian pediatric population increased from 2010 to 2013, with considerable variation among provinces. Future research should examine the clinical information associated with dispensing data to better understand the increased use of these drugs and regional variation observed across Canada. Assessing physician attitudes, preferences, or other possible contributing factors may further clarify the large regional variation in dispensing of these agents as well. Lastly, future work should investigate the use of other psychotherapeutic drug classes (such as mood stabilizers, stimulants, and sedative-hypnotics), in order to provide a broader understanding of overall psychotherapeutic use in the pediatric population. This will help to improve and standardize care for the pediatric population throughout Canada.
Footnotes
Authors’ Note
The statements, findings, conclusions, views, and opinions contained and expressed in the report are based in part on data obtained under license from IMS Health Canada Inc. concerning the following information service(s): GPM12, data period October 1, 2009, to August 31, 2014. All Rights Reserved. The statements, findings, conclusions, views, and opinions expressed herein are not necessarily those of IMS Health Canada Inc. or any of its affiliated or subsidiary entities. Josiane Gaudet provided permission for the use of the description of methodological details of the IMS GPM 12 provided in the article.
Declaration of Conflicting Interests
The author(s) declared the following potential conflicts of interest with respect to the research, authorship, and/or publication of this article: Dr. Mamdani reports receiving honoraria for serving on Advisory Boards for Astra Zeneca, Bristol-Myers Squibb, Eli Lilly and Company, Glaxo Smith Kline, Hoffman La Roche, Novartis, Novo Nordisk, and Pfizer, outside the submitted work. The remaining authors declared no potential conflicts of interest with respect to the research, authorship, and/or publication of this article.
Funding
The author(s) disclosed receipt of the following financial support for the research, authorship, and/or publication of this article: This research was supported by the Ontario Drug Policy Research Network, which is funded by grants from the Ontario Ministry of Health and Long-Term Care Health System Research Fund.
References
Supplementary Material
Please find the following supplemental material available below.
For Open Access articles published under a Creative Commons License, all supplemental material carries the same license as the article it is associated with.
For non-Open Access articles published, all supplemental material carries a non-exclusive license, and permission requests for re-use of supplemental material or any part of supplemental material shall be sent directly to the copyright owner as specified in the copyright notice associated with the article.