
Abstract
Objective:
Because health care resources are constrained, decision-making processes often require clarifying the potential costs and savings associated with different options. This involves calculating a program’s costs. The chosen costing perspective defines the costs to be considered and can ultimately influence decisions. Yet reviews of the literature suggest little attention has been paid to the perspective in economic evaluations. This article’s purpose is to explore how the costing perspective can affect cost estimates.
Method:
As a vehicle for our discussion, we use service use data for clients enrolled in 6 Ontario early psychosis intervention programs. Governmental and nongovernmental payer costing perspectives are considered. We examine annual costs associated with early psychosis intervention clients enrolled for ≤12 months versus those enrolled for >12 months. This also allows for an assessment of the impact that choice of time horizon can make on the results.
Results:
The difference in total between group cost for hospital, emergency room, and physicians is $2499; the >12-month group has relatively higher mean costs. When all governmental and nongovernmental costs are considered, there is a mean between-group cost difference of $1272, with lower mean costs for the >12-month group.
Conclusions:
Although the Ministry of Health bears a large proportion of costs, other governmental agencies and the private sector can incur a sizeable share. This example demonstrates the potential importance of including other cost perspectives with the hospital sector in analyses as well as the impact of time horizon on cost estimates.
Clinical Implications
Physicians are often asked to assume a decision maker role. It is important for them to understand how the costing perspective and costing time horizon choices can influence estimates.
When perspectives other than health are not considered in costing estimates, the implicit assumption is that there are no costs differences between the groups being compared with regard to the costs from the other perspectives.
The Ministry of Health is not the only governmental sector that is affected by community mental health (CMH) programs. Other sectors such as the social services and justice sectors can also be affected.
Limitations of the Study
We did not illustrate a full societal costing perspective. This perspective would have included the costs borne by the family with regard to lost work hours, caregiving, and other private health care services.
Another limitation relates to the generalizability of cost estimates. Canada does not have a standardized list of unit costs (UCs). As a result, there may be variation in the estimates among fiscal jurisdictions.
Clients who participated in these interviews may not necessarily be representative of all clients in early psychosis intervention (EPI) programs, and the EPI programs may not be representative of programs in other contexts.
The sample included only people who were enrolled in early intervention for psychosis programs. Results may be different for people experiencing their first psychotic episode who do not receive services from a program specializing in first psychotic episode cases.
In health care, the costs of treatment innovations are important because resources are limited and budgets are constrained. Decision making often necessitates clarifying a program’s cost drivers. This involves calculating a program’s costs with a focus on the perspective from which costs will be considered. The perspective guides the included costs.
Standard economic evaluation texts advocate a societal perspective that is a comprehensive approach. It accounts for all costs without regard to whom the payer is (i.e., government, patient, caregiver). However, in practice, the societal perspective is often not taken. An early review of the mental health economic evaluation literature found that less than 10% of articles published between 1966 and 1995 reported the perspective used. 1 This suggests that economic evaluations have not been careful in the reporting of the perspective. But the perspective has potential to influence the results and the conclusions.
In his systematic review of the economic evaluation literature for early psychosis intervention programs, Amos 2 identified 9 economic evaluations of EPI programs. The majority focused solely on health care costs (i.e., inpatient care and outpatient care). Based on these studies that used narrow costing perspectives, Amos 2 concluded that the literature does not support the assertion that EPI programs are less costly than treatment as usual (TAU). He also asserts the evidence suggests costs are higher in the early years of treatment. Given that the economic evaluations Amos 2 reviewed focus on hospital sector costs, his conclusion should be qualified. That is, when compared with TAU, EPI is not less costly for the hospital sector. This raises the question about whether the same conclusion would hold if a broader perspective were considered.
The purpose of this article is to explore how the costing perspective affects cost estimates. As a vehicle for discussion, we use service use data for clients enrolled in 6 Ontario EPI programs. Building on Amos’s 2 observation that costs may be higher for new clients, we examine annual costs associated with new EPI clients enrolled for ≤12 months versus those enrolled for >12 months. As cost analyses related to a budget cycle are especially salient for decision makers, we focus on a 12-month time frame because this is a time frame for a typical fiscal year. Use of this time frame is informative for a decision maker who must decide how to distribute scarce public resources among multiple sectors for a budget year. Comparison of enrollment time also offers insight into potential changes in resources used by client groups by enrollment period. This approach is an example of a step toward projecting changes in resource use by groups over time. This type of approach allows for an assessment of how costing time horizon affects cost estimates for programs.
Our example addresses 2 main questions: (1) Are there cost differences between the EPI client groups based on costing perspective? Governmental and nongovernmental payer costing perspectives are considered. (2) For what types of services are there between-group cost differences (i.e., time horizon differences)?
Background
EPI programs have become accepted practices globally. 3 This is because of the accumulating evidence from large randomized clinical trials (i.e., OPUS and LEO) 3 –6 and with 10-y follow-up suggesting that compared with TAU, EPI programs are more effective for first-episode populations in terms of reduced hospital admissions and symptom reduction. 7 –10 The fundamental goals of EPI are to improve early detection and access to services, to promote recovery, and to improve long-term outcomes for youth experiencing psychosis. 11 –13
EPI is a complex intervention that includes many treatment components to facilitate recovery from a disorder that historically has been associated with very high levels of disability. 13 EPI services include comprehensive diagnostic assessment, treatment, psychosocial supports, and family education and support provided by an interdisciplinary team. 14
Evidence suggests clinical improvements can be observed by the end of the first year of enrollment. Malla and colleagues’ literature review reported that EPI enrollment was associated with improved short-term outcomes (e.g., high rates of remission, treatment retention, and higher community functioning and quality of life) at the 1-y follow-up. 15 In addition to the consideration about the definition of a fiscal year, these clinical findings also motivated the comparison of the new and ongoing enrollee groups.
Methods
Study Program Characteristics
Our example uses data from 6 Ontario EPI programs from both rural and nonrural regions. Each program provided outpatient services to clients experiencing their first episode of psychosis (FEP) or who were in early stages of psychosis. Focus was on new programs implemented in response to new funding from the 2004 Federal Health Accord allocations. 16 The purpose of choosing new programs was to understand the development of these new programs under the new funding. 16
The 6 geographic regions were selected based on the following: Presence of EPI programs that received Health Accord funding Local system stakeholders’ willingness to participate in the evaluation A geographical representation of the province
The 6 EPI programs were selected using the following criteria: Program staff willing to support evaluation activities The program had the capacity to enroll at least 64 clients at any one time The program was not involved in another local evaluation
Five programs were in established CMH agencies. One was a community-based program that was part of an acute care hospital. Staffing varied considerably, ranging from 3 part-time positions to 10 full-time–equivalent positions. Each program was developed using the guidelines and standards of the International Early Psychosis Association and other pioneers in the field. 17 –19 All programs also meet the Ontario Ministry of Health and Long-Term Care’s MOHLTC EPI Program Standards. 13
Three programs engaged clients 14 to 35 years old; the remaining 3 limited access to people who were at least 16 years old. Two programs enrolled only transitional aged youth 16 to 23 years.
Data Collection
The study protocol was approved by the Centre for Addiction and Mental Health’s Research Ethics Board. A cross-sectional data collection approach was used at 3 points in time during October 2005, 2006, and 2007.
Program case managers referred potential study participants. Interview inclusion criteria included the following: Willingness to be contacted by a study interviewer Ability to give informed consent to be interviewed Enrollment in one of the participating EPI programs ≥16 years of age
After obtaining informed written consent, trained interviewers administered face-to-face structured interviews. With participant permission, case managers and charts also were consulted for service use information. If permission was not granted, participants were asked service use questions.
In 2005, 161 clients were enrolled in participating programs; of these, 45 clients (28%) were eligible for contact. Of these, 33 (73%) were successfully interviewed, representing 20% of the total enrolled clients. In 2006, 302 EPI clients were enrolled; 106 (32%) were eligible for contact. There were 75 (71%) who were successfully interviewed, representing 25% of the total clients. In 2007, 162 (44%) of 370 early intervention clients were eligible for contact; 107 (66%) were successfully interviewed. They represented 29% of the total enrolled clients.
Length of Enrollment in EPI
A variable was created to indicate the length of EPI program enrollment. There were two categories: (1) enrolled for ≤12 months and (2) enrolled for >12 months.
Service Use
Three types of service use variables were collected: (1) health care, (2) social services, and (3) justice. Health care services information included inpatient stays, emergency room (ER) visits, physician visits, prescription psychotropic medications, and CMH services. Except where indicated, information about service use was collected based on the example of the Client Service Receipt Inventory. 20 All service use was standardized to an annual rate.
Health Service Use
Questions were asked about past 12-month hospital admissions, days in hospital, and number of ER visits.
Using the Matryoshka Service Needs Profile (SNP), 16 information was gathered about current monthly physician visits (primary care and psychiatry) and CMH program service use, including (1) vocational/employment supports, (2) educational supports, (3) social/recreational supports, (4) housing support, and (5) counselling visits. The Matryoshka SNP was adapted from an instrument developed for CMH service use planning in Ontario. 21 Frequency of visits responses were captured using 4 categories: (1) less than once/month, (2) 1 to 3 times/month, (3) 4 to 7 times/month, and (4) ≥8 times/month. These analyses use response categories’ midpoints to estimate the number of monthly visits. The exception was for the last category, for which 8 times/month rather than a midpoint was used as a conservative estimate for the visit frequency.
Psychotropic Medication Use
The 30-day psychotropic medication information was gathered using a medication log. The Canadian Pharmacists Association: Compendium of Pharmaceuticals and Specialties was used to identify the recommended ranges for the prescription medication used. 22 The midpoint of each range was assumed to represent the daily dosage.
Housing Use
To examine social services use, questions about past 12-month main housing type were asked. Information gathered included shelter use and boarding homes. Participants were also asked about the number of nights spent on the street. Question responses were in categories of 0 days, 1 to 6 days, 7 to 30 days, 31 to 90 days and >90 days. The response range midpoint was used as an estimate of the number of nights homeless. The exception was for the last category, for which 90 days was used as a conservative estimate of the number of nights homeless.
Justice Sector Involvement
Justice sector involvement was gathered for past 12-month legal contacts, including arrests and nights spent incarcerated (i.e., prison or jail).
Unit Costs
Two categories of UCs were used: (1) services covered by government and (2) services not covered by government. All costs were adjusted to 2014 real dollars based on the Statistics Canada’s Consumer Price Index for health care and personal care for Ontario. 23
Health Service Use UCs
MOHLTC covered services include hospital, emergency and physician visits. The 2009 UCs for hospital and ER services were obtained from the Canadian Institute for Health Information’s (CIHI’s) Canadian MIS Database. 24 Hospital and ER UCs were the calculated mean direct costs for an inpatient day and ER visit. The Ontario physician visit UCs were also obtained from CIHI. These UCs represent the mean cost per visit calculated using the National Physician Database.
Community Service UCs
The CMH services costs were obtained from the Toronto Central Local Health Integration Network (LHIN). They represent the mean UCs based on the funding received by LHIN-funded agencies and the number of service units these agencies provide. The UC for housing support services was estimated as the gross median hourly wage of a social worker; it was assumed each housing contact was 1 hour with a social worker. The UC for housing support services was estimated in this way because we could not obtain UCs for these housing support services not linked to a specific housing entity.
Psychotropic Medication UCs
The MOHLTC also covers prescription drug costs for Ontarians who qualify for the Ontario Drug Benefit (ODB) program. ODB covers people who are ≥65 years of age as well as people who are financially disadvantaged. 25 Prescription drug benefits are not universal. Participants were asked if they had insurance and whether they were covered by ODB. For those covered by ODB, UCs were taken from the ODB formulary.
Housing UCs
These analyses use 2 types of housing costs. The amount of housing subsidies was taken from study participant self-report. Shelter costs were from the City of Toronto’s 2014 operating budget. 26
Justice Sector UCs
Two types of justice costs were considered. One was arrest costs; these were taken from the Toronto Police Service. 27 The second category of justice sector costs comprised jail/prison costs. Our analyses do not distinguish between jail and prison. For these costs, the mean 2008/2009 direct operating expenditures for Ontario jails were applied. 28 This approach was conservative given that mean prison costs are comparatively higher. 28 It was adopted because the collected data did not allow for distinction between jail and prison stays.
Nongovernmental Costs
Information was collected on prescription drug use that may not be covered by the public health care system. Costs for psychotropic medications used by participants without ODB coverage were taken to be the costs of prescriptions incurred by the general public. 29 The exception is clonazepam, which is not available from public pharmacies; thus, ODB UCs were applied.
Total Costs of Services
Total costs for each service were estimated as the product of the respective service use and UC. To examine the between-group cost differences by perspective, 5 primary cost categories were estimated: (1) MOHLTC for hospital and ER use, (2) MOHLTC costs of hospital and ER use plus CMH supports, (3) total governmental costs (i.e., MOHLTC, Ontario Ministry of Community and Social Services (MCSS), and the justice sector), (4) nongovernmental costs (i.e., costs for non-ODB prescription drugs), and (5) the total of categories 1 through 4.
Analyses
Missing data were imputed using the mean values of the specific item and group. The exception was for hospital use. In the >12-months group, 3 cases were in hospital for ≥180 days. At the same time, the mode was 0. Missing values were imputed using the mean value for all the cases calculated excluding the 3 outliers.
The proportions of the sample using each type of service were calculated. Chi-square and Fisher exact tests were used to test the between-group differences for the categorical variables. Mean costs were calculated for the groups; t tests were used to test between-group differences.
The mean costs of the 5 primary costs categories were also estimated. The 95% confidence intervals for these primary cost categories were estimated based on parametric assumptions. When health economists analyze cost data, they use the mean; however, researchers from other disciplines (e.g., epidemiologists) prefer the median. When data are skewed (e.g., cost data), the median is thought of as a better approximation of the central location of the distribution, but the mean can be used to estimate total cost (e.g., total cost equals the product of the mean cost and quantity). As a sensitivity analysis, Wilcoxon 2-sample tests were employed to test for differences in the cost categories’ median values.
Results
The sample included 167 participants. Of these, 122 (73.1%) were in an EPI program for ≤12 months. The remainder (n = 45) were enrolled for >12 months.
Demographics
The majority of both groups were male (67% of ≤12-month v. 78% of >12-month group); the between-group difference was not significant (P = 0.187). Most of the sample was younger than 30 years (88% of ≤12-month v. 86% of >12-month group; P = 0.25). There was no significant difference in the between-group educational status (35% of ≤12-month v. 20% of >12-month group; P = 0.063).
Description of Service Use
About 54% of the ≤12-month group had at least 1 hospital admission during the past 12 months; 37% in the >12-month group did (Table 1). However, the between-group difference was not statistically significant (P = 0.063). Approximately 63% of the ≤12-month group used the ER versus 33% of the >12-month group; this difference was statistically significant (P = 0.0014).
Description of proportion of client service use by service.a
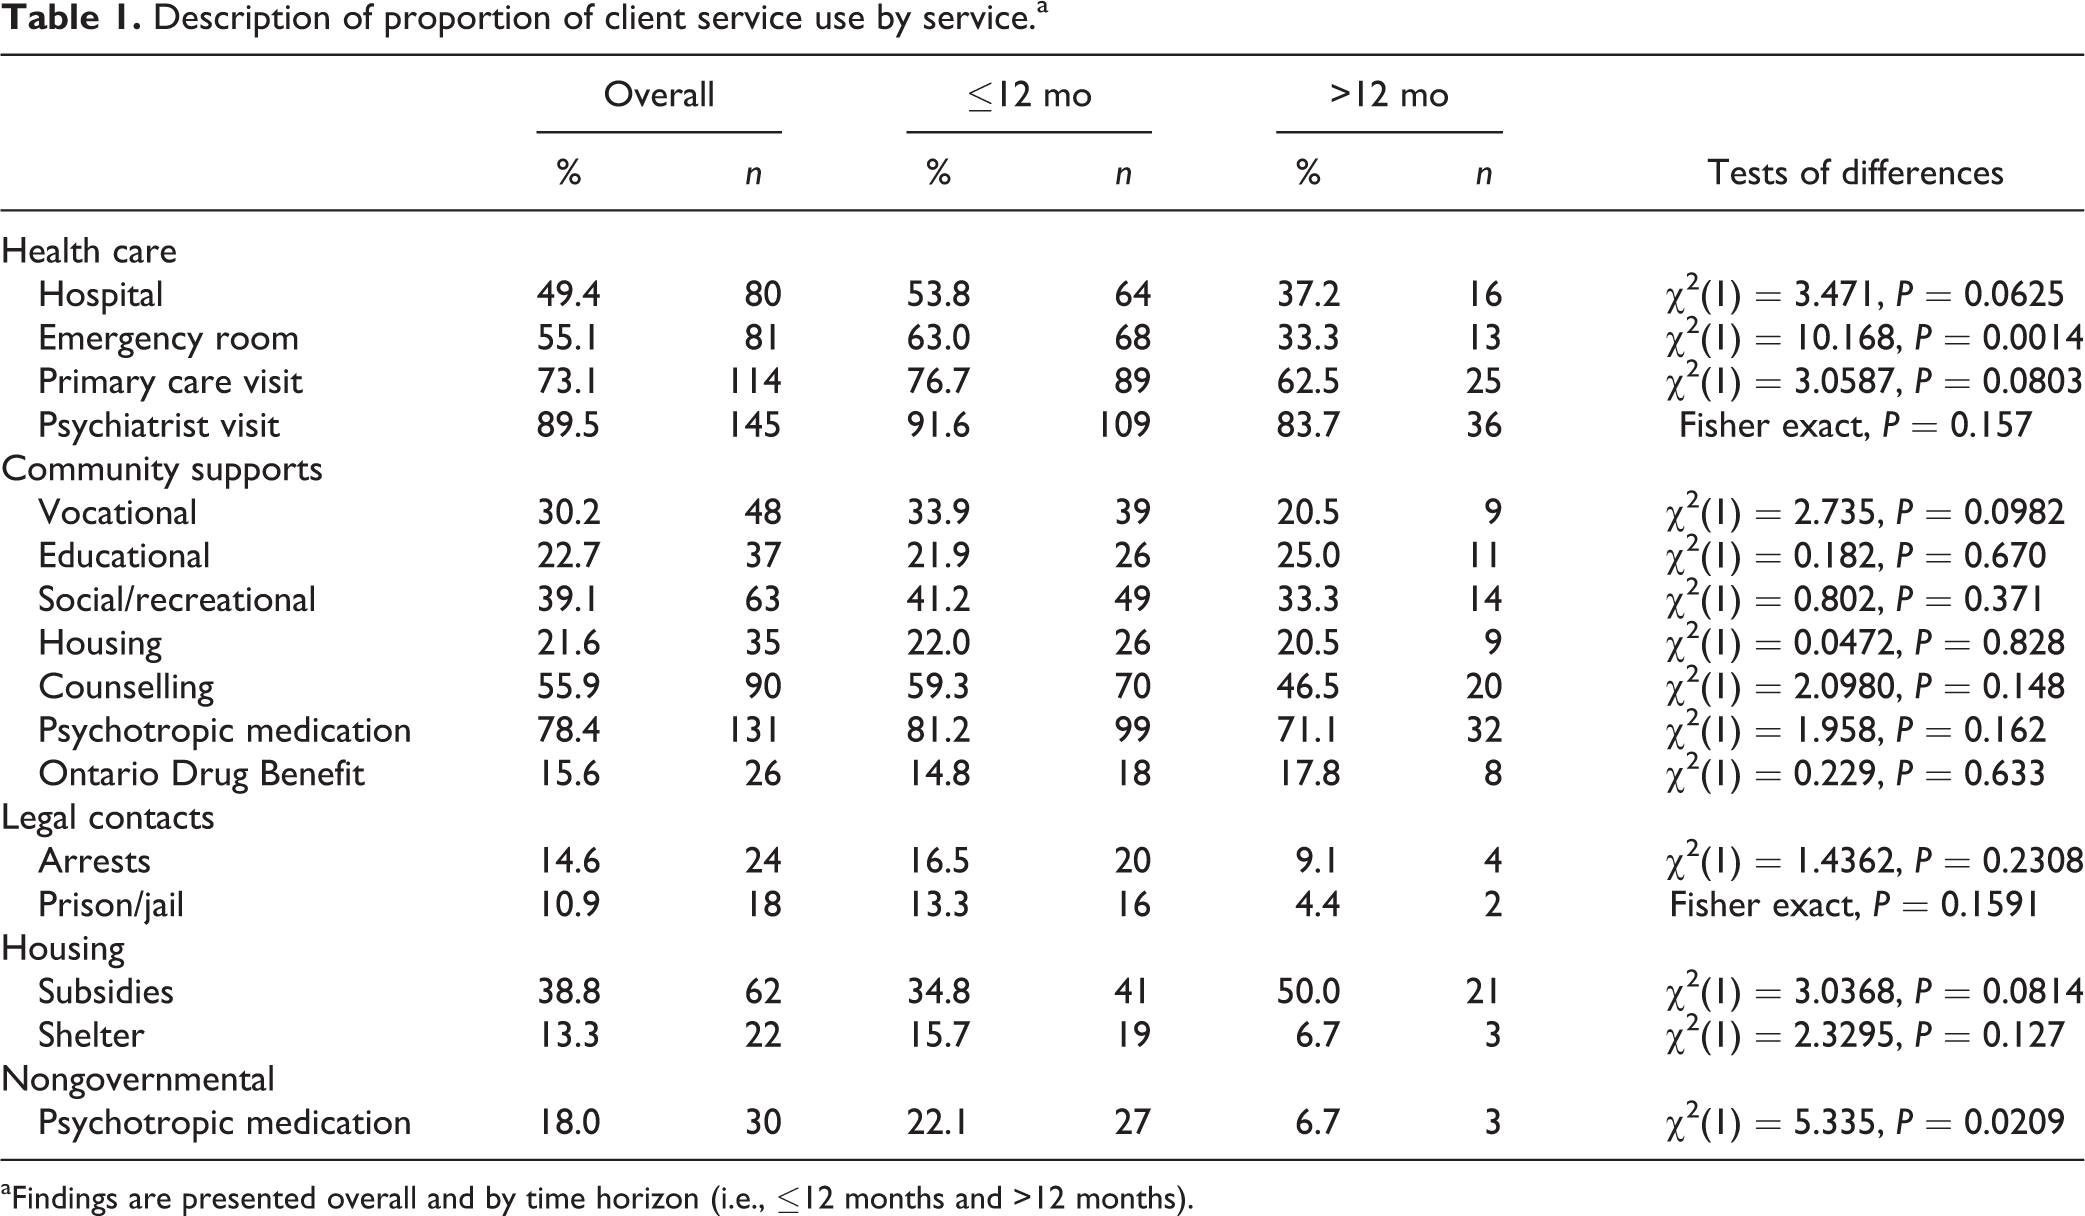
aFindings are presented overall and by time horizon (i.e., ≤12 months and >12 months).
Another significant between-group difference was related to prescription drug coverage. Those in the ≤12-month group who filled prescriptions were significantly more likely to have nongovernmental coverage (P = 0.021).
Description of Service Use Costs
There were differences in 4 types of service costs (Table 2). The ≤12-month group’s psychiatric visit costs were greater than the >12-month group’s (P = 0.003). The ≤12-month group also had higher counseling (P = 0.007) and nongovernmental psychotropic medication costs (P = 0.0009). Arrest costs appeared to be higher for the ≤12-month group, but the difference was not statistically significant.
Description of mean service use costs by service type.a
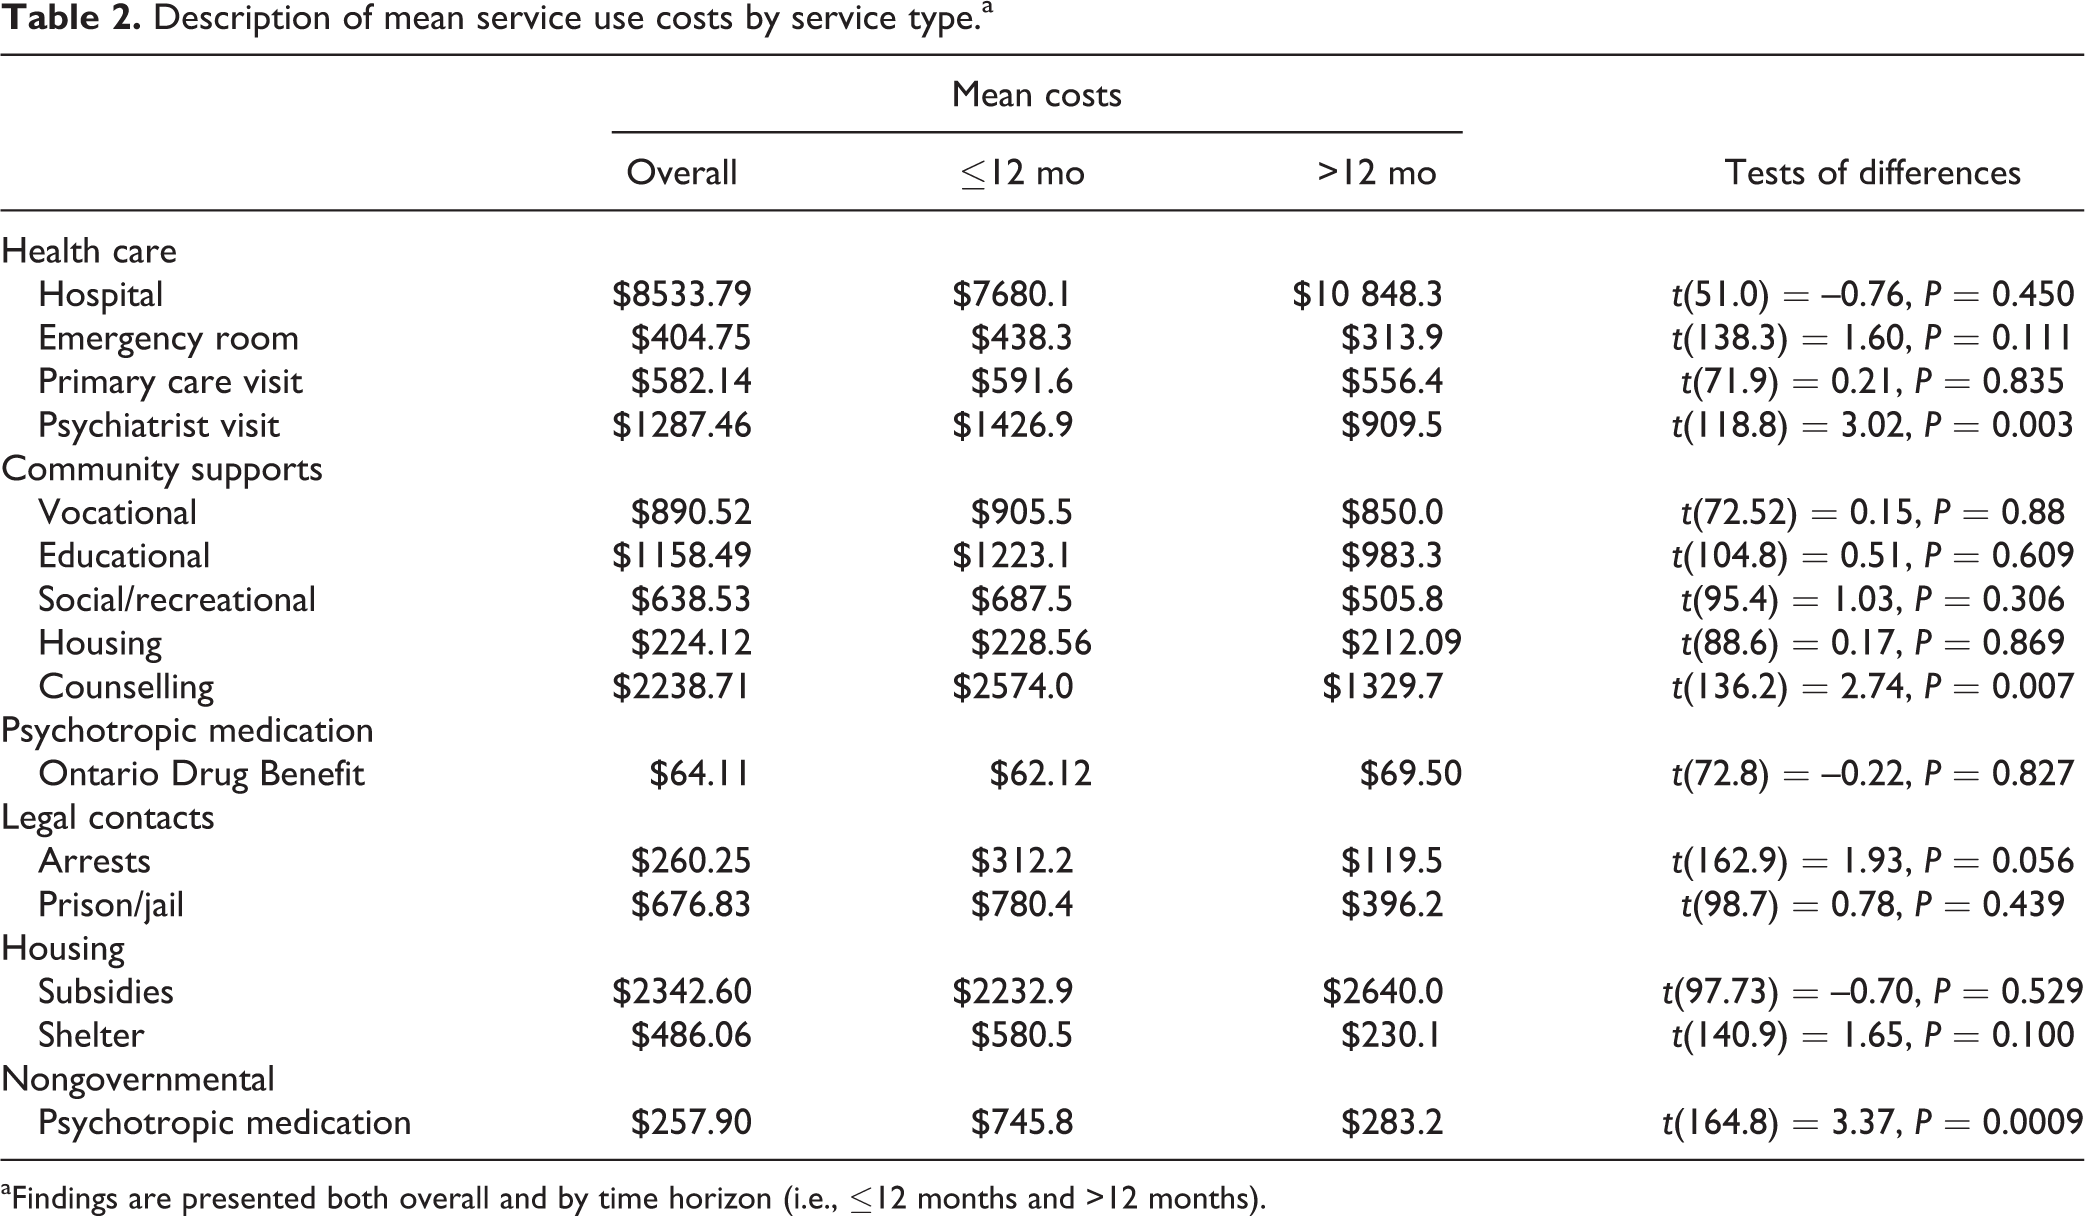
aFindings are presented both overall and by time horizon (i.e., ≤12 months and >12 months).
Distribution of Service Use Costs
For both groups, the majority of costs were related to hospitalizations; they accounted for 34% of the ≤12-month group costs and 51% of the >12-month group costs (Table 3). Governmental health care costs for hospital, ER, and physicians represented 45% of the ≤12-month group costs and 59% of >12-month group costs.
Distribution of service use costs.a
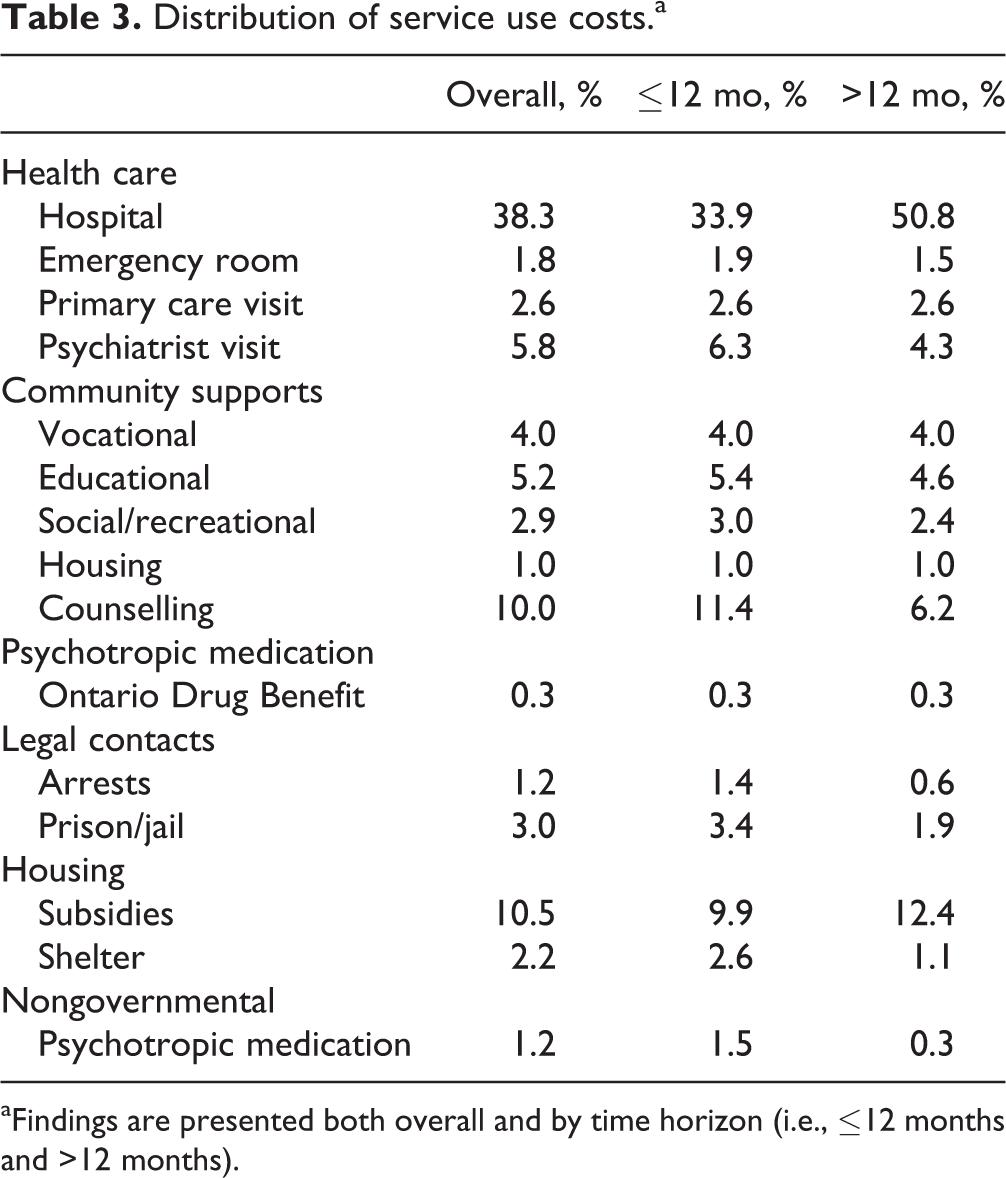
aFindings are presented both overall and by time horizon (i.e., ≤12 months and >12 months).
Differences in Service Use Costs by Perspective
The between-group difference for health care costs for hospital, ER, and physicians was $2499; the >12-month group had higher mean costs (Table 4). The addition of CMH services costs decreased the between-group difference to $761. Inclusion of other governmental services (i.e., housing and legal contacts) further decreased the mean cost difference to $241. Finally, when all costs were considered, the between-group difference was $1272 in favor of the >12-month group.
Mean differences in costs by perspective.a
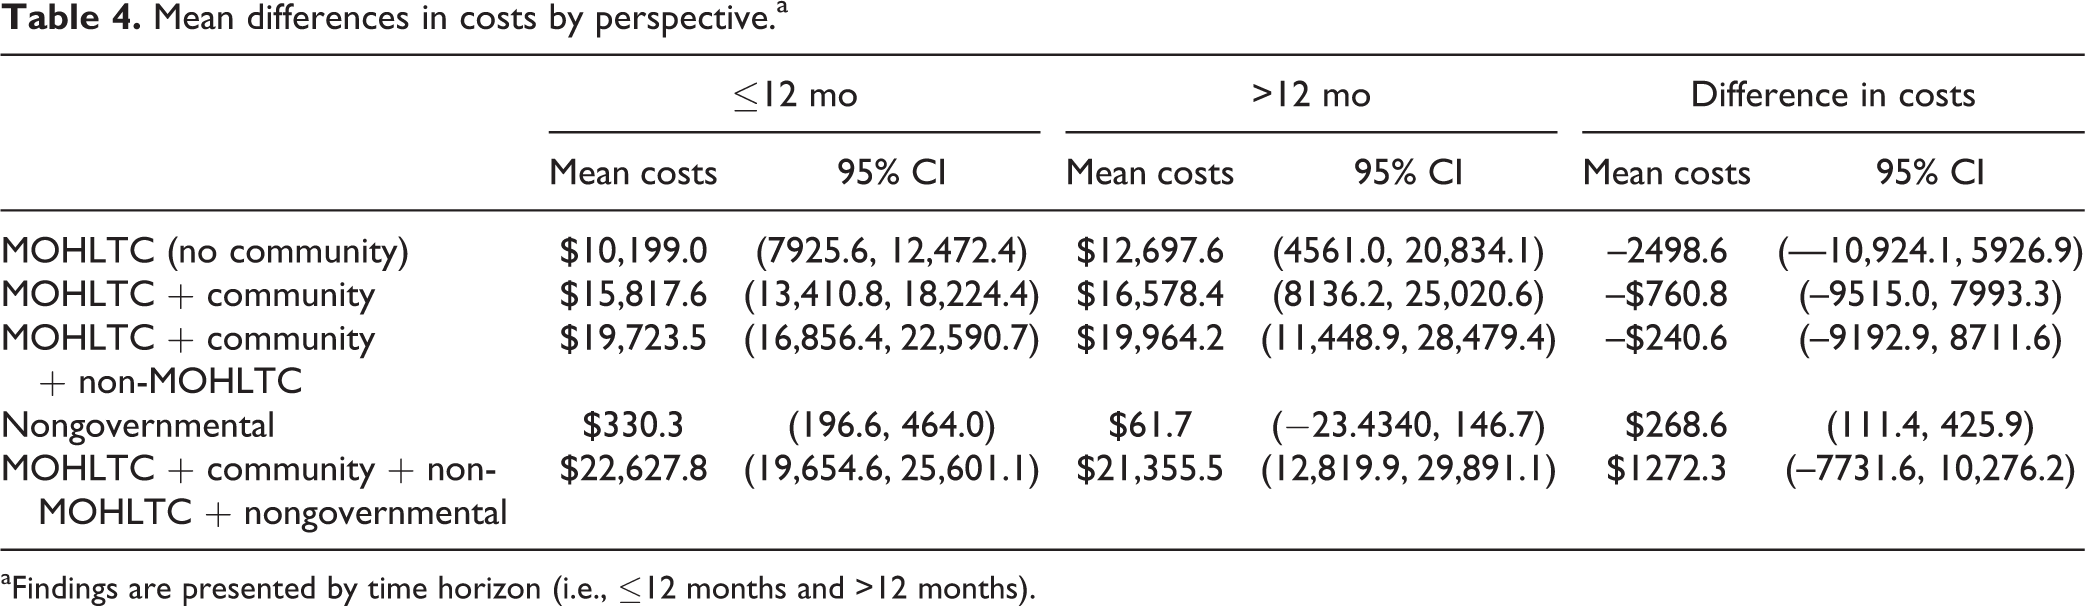
aFindings are presented by time horizon (i.e., ≤12 months and >12 months).
Cost category medians suggest a different trend (Table 5). At the median, the >12-month group had consistently lower costs. In addition, the nonparametric tests comparing the cost categories’ medians suggest the median differences were significant.
Median differences in costs by perspective.a
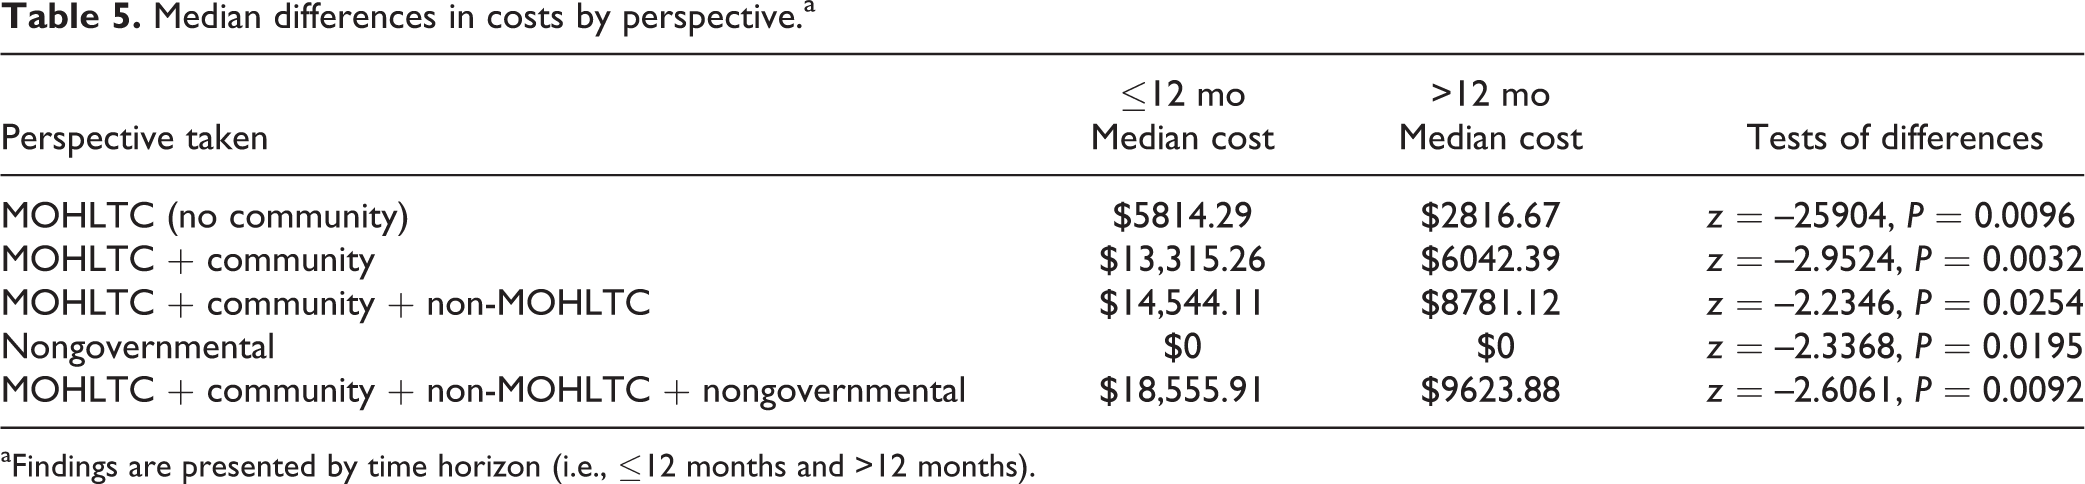
aFindings are presented by time horizon (i.e., ≤12 months and >12 months).
Discussion
Our example suggests the costing perspective can affect the magnitude and direction of costs differences. In our example, consideration of only hospital and ER costs resulted in a mean cost difference favoring the ≤12-month group. With all the types of costs included, the mean cost difference no longer favored the ≤12-month group. In fact, it seemed to favor the >12-month group. Thus, different conclusions could be drawn depending on the costing perspective.
Our example results indicate the largest cost difference was in MOHLTC costs. This is because hospital-based care is a significant cost driver accounting for the largest proportion of costs. Many studies focus on these health care costs because they are often easily available. For example, in Canada, UCs for these services are estimated by CIHI, and the UCs of publically funded medications are available through provincial formularies.
Cost differences decreased when CMH service costs were included. The difference in differences is related to the types of services needed at different illness stages. 30 Consequently, a focus on hospital-based care may miss the broader picture of service use. That is, after the first year of enrollment, clients begin to recover and require fewer hospitalizations. EPI programs have been shown to have lower relapse rates than generic treatment settings. 31
One reason the CMH service perspective is often not included in costing 2 is because most provinces do not have centralized data management systems for these services. Absence of centralized systems makes it difficult to estimate these services’ UCs.
Our results also indicate other governmental sectors could be affected. For example, the governmental entity providing housing subsidies can be affected as youth with psychosis strive to recover and seek housing supports to achieve independence.
Evidence also suggests people with mental illnesses have high rates of justice system contact, and people experiencing their FEP are at significantly higher risk of justice involvement. 32,33 As symptoms decrease, the risk of legal contact may decrease. Our example suggests that although there may be an increase in costs for housing, there also may be a decrease in justice costs. Our example results indicate that the inclusion of other governmental costs along with the MOHLTC can affect total cost difference estimates; inclusion of MCSS and justice costs further decreased cost differences.
Finally, our analyses indicate all health care costs are not publically funded. About 43% of prescription drug costs are paid by public insurance. 34 Approximately 24% of Canadians do not have prescription drug coverage. 35 In our example, inclusion of nongovernmental prescription drug costs changes the direction of the cost difference. Without it, the mean cost for the ≤12-months group is less than that for the >12–month group. Inclusion of nongovernmental costs results in the opposite; the mean cost for the ≤12-months group is greater. Our example suggests that although there is a public health care system, the private sector also bears part of the health care costs for this population, especially when people are first seeking care.
Limitations
Our results should be considered in the light of the data limitations. One limitation is that we could not conduct a full societal costing. Full societal costing would include costs borne by families (e.g., lost work hours, caregiving). Our estimates also do not include client-accrued costs. Nor do they include the time contributed by clinicians who are not directly reimbursed by the MOHLTC (e.g., nurses). Exclusion of these costs could underestimate cost differences. In addition, a small sample size may affect our ability to report statistically significant results.
Another limitation relates to the fact that unlike in the Netherlands 36 and England, 37 there is no standardized list of Canadian UCs. This can contribute to cost variation among fiscal jurisdictions and affect the generalizability of the cost estimates within and outside of Canada.
Finally, participants may not necessarily be representative of all EPI clients. Only clients able to provide informed consent were asked to participate. Those younger than 16 years and those with the most severe symptoms were more likely to have been excluded. Yet the latter’s symptom severity would have put them at higher risk of greater service use. This could have driven down our cost estimates.
Furthermore, cost estimates could have been influenced if established programs are relatively more efficient in producing nonhealth outcomes. In addition, the included programs had age cutoffs. Our estimates could be influenced if client age rather than the fact they were experiencing their first psychotic episode affected the types of services used.
Conclusions
When costing estimates exclude other perspectives, this assumes there are no between-group differences for these other perspectives. Yet our example highlights the potential importance of including other perspectives. Including a range of costing perspectives acknowledges the breadth of the effects of mental health on both a health and a social level.
Footnotes
Declaration of Conflicting Interests
The author(s) declared no potential conflicts of interest with respect to the research, authorship, and/or publication of this article.
Funding
The author(s) received the following financial support for the research, authorship, and/or publication of this article: This study was funded Dr. Dewa’s Canadian Institutes of Health Research/Public Health Agency of Canada Applied Public Health Chair (grant 86895). Dr. Cheng received a fellowship award in 2006–2009 from the Research in Addictions and Mental Health Policy and Services Canadian Institutes of Health Research Strategic Training Program. She is also the medical director and primary psychiatrist for one of the EPI programs.