
Abstract
The Indian Ocean’s surface circulation undergoes strong seasonal reversals driven by monsoonal winds, producing alternating periods of nutrient-rich upwelling (southwest monsoon) and low-productivity stratified waters (northeast monsoon). This study reconstructs Early Pliocene (4.5–3.6 Ma) oceanographic conditions in the Central Equatorial Indian Ocean (CEIO) using planktic foraminiferal assemblages from ODP Hole 716A to investigate changes linked to Indonesian Throughflow (ITF) variability, monsoon strength, and productivity. Foraminiferal habitat groups (mixed-layer dwellers, Thermocline dwellers, Eutrophic and Oligotrophic Indicator) and Principal Component Analysis reveal repeated transitions between oligotrophic (nutrient-poor) and eutrophic (nutrient-rich) conditions. Warm mixed-layer species dominate during several intervals (3.66–3.72 Ma, 3.81–4.0 Ma, 4.15–4.24 Ma), indicating enhanced stratification, reduced nutrients, and strengthened northeast monsoon conditions. In contrast, peaks in thermocline dwellers and productivity-related species (3.72–3.78 Ma) reflect episodes of upwelling driven by Wyrtki Jet activity. The delayed first appearance (~3.6 Ma) of Pulleniatina obliquiloculata in the Indian Ocean and the absence of Pulleniatina spectabilis throughout 4.5–3.6 Ma indicate restricted intermediate-water exchange between the Pacific and Indian Oceans, consistent with a partially closed ITF. Overall, Early Pliocene ITF restriction likely reduced Pacific water inflow, shoaled the thermocline, lowered productivity, strengthened the northeast monsoon, and contributed to the decline of the regional biogenic bloom. These findings demonstrate that Early Pliocene ITF restriction played a key role in modulating Indian Ocean hydrography and monsoon variability during a globally warm climate regime.
INTRODUCTION
The Indian Ocean is bordered by Asia to the north, Africa to the west, and the margins of Australia and the Indonesian Archipelago to the east, forming a largely enclosed basin whose circulation is shaped by the monsoon system (Eakins & Sharman, 2010). During boreal summer, intense heating over the Indian subcontinent creates a sharp temperature contrast between land and sea, drawing moist southwesterly winds and promoting upwelling along coastal and equatorial regions. When winter arrives, continental cooling reverses this gradient, resulting in dry northeasterly winds (Schott & McCreary, 2001). During the southwest (SW) monsoon, the Intertropical Convergence Zone (ITCZ) moves north of the equator, strengthening the northward Somali Current and Ekman transport. This intensification drives strong coastal upwelling along the Somali coast and across the equatorial region, resulting in a shallower thermocline and increased nutrient input to surface waters. In contrast, during the northeast (NE) monsoon, the ITCZ shifts southward, reversing the wind pattern and Coriolis effect. Ekman transport weakens, upwelling subsides, the surface mixed-layer deepens, and biological productivity decreases (Schott, 1983; Schott & McCreary, 2001). Superimposed on the Indian Ocean’s seasonal cycle, the Indonesian Throughflow (ITF) acts as a critical conduit, channelling warm, relatively fresh waters from the Pacific into the Indian Ocean. Recent estimates put the mean annual ITF volume near 15–16 Sv, with the majority originating from the North Pacific and transiting primarily via the upper 650 metres, including the Makassar Strait and deeper passages; the distribution varies with large-scale climate modes such as ENSO (e.g., Gordon, 2005; Sprintall et al., 2014; Xie et al., 2023). Periods of enhanced Pacific trade winds during La Niña tend to strengthen the throughflow, intensifying Indian Ocean upwelling, while El Niño events generally suppress both transport and upwelling. Because direct observations date only to the mid-1800s, palaeoclimate proxies remain essential for reconstructing earlier environmental variability (Brönnimann et al., 2019).
The present study investigates the relationships among ITF restriction, Indian monsoon variability, and productivity at ODP Site 716A using planktic foraminiferal census data. The ITF forms the only low-latitude connection between the Indian and Pacific Oceans (Schneider, 1998), representing the upper limb of the returning arm of the Global Ocean Conveyor Belt (Broecker, 1987); therefore, it plays a pivotal role in global thermohaline circulation. Its variability directly influences the heat budgets of both the Pacific and Indian Oceans (Bryden & Imawaki, 2001; Sprintall & Liu, 2005). Classical works by Srinivasan and Sinha (1998, 2000) identified a restriction of the Indonesian Seaway between ~5.6 and 4.2 Ma, based on the absence of thermocline-dwelling planktic foraminiferal species Pulleniatina spectabilis from the Indian Ocean, while its continuous presence in the Western Equatorial Pacific. Cane and Molnar (2001) proposed a later restriction between ~4 and 3 Ma based on modelling studies. Differences in the timing of ITF restrictions arise from contrasting approaches: biogeographic evidence relies on species presence or absence, which can vary across regions, while modelling studies simulate circulation changes but depend on boundary conditions. The high-resolution biogeographic data in this study help reconcile these differing chronologies.
Previous studies from ODP Hole 716A have primarily focused on late Quaternary and orbital-scale changes. Sarkar and Gupta (2009, 2013) and De et al. (2010) examined the site’s palaeoceanographic records for the last 450 kyr, whereas Diek et al. (2017) linked Early Pliocene productivity at the site to orbital parameters. However, no study has explicitly examined the potential relationship between ITF restriction and monsoon-driven changes in productivity at ODP Site 716A. The present study was conducted to investigate the potential link between the ITF, the only low-latitude connection between the Pacific and Indian Oceans, and its impact on global thermohaline circulation and regional heat budgets. Many studies have suggested that the flow of Pacific water into the IO via the ITF was restricted during the period from 5.2 to 3.0 Ma, based on various proxies and modelling studies. Although none have explicitly linked ITF to the Indian monsoon (either the SW or NE), it drives productivity in this mostly oligotrophic Central Equatorial Indian Ocean (CEIO) region. After analysing Early Pliocene deep-sea core samples from ODP Hole 716A, here, we present detailed planktic foraminiferal census data from ODP Hole 716A spanning the Early Pliocene (3.6–4.5 Ma). By integrating faunal shifts, we reconstruct mixed-layer and thermocline variability to elucidate Early Pliocene monsoon–ocean coupling and interoceanic exchange between the Pacific and Indian Oceans under a greenhouse climate regime.
Previous palaeoceanographic research in the Equatorial Indian Ocean (EIO) has primarily focused on benthic microfossils to reconstruct Quaternary glacial–interglacial variability. Studies at ODP Site 716A linked benthic foraminiferal changes to monsoon intensity (Sarkar & Gupta, 2009) and documented orbital- to suborbital-scale wind variations over the last 444 ka (De et al., 2010). High-resolution work also connected equatorial westerly strength and productivity over the past 300 ka, including inverse relationships with the Indian Ocean Dipole during MIS 8–9 (Sarkar & Gupta, 2013). For the Early Pliocene (3.6–4.2 Ma), productivity reconstructions based on chlorine content and planktonic foraminifera suggest dynamic upwelling and a shallow thermocline despite warm climates (Deik et al., 2017). However, the depths of the mixed layer and the thermocline remain poorly quantified. Additional evidence from the Sawai Bay Formation indicates reduced biogenic silica flux and productivity, but the roles of monsoon forcing and ITF variability remain poorly understood (Chakraborty & Ghosh, 2021).
REGIONAL OCEANOGRAPHIC SETTING OF THE STUDIED AREA
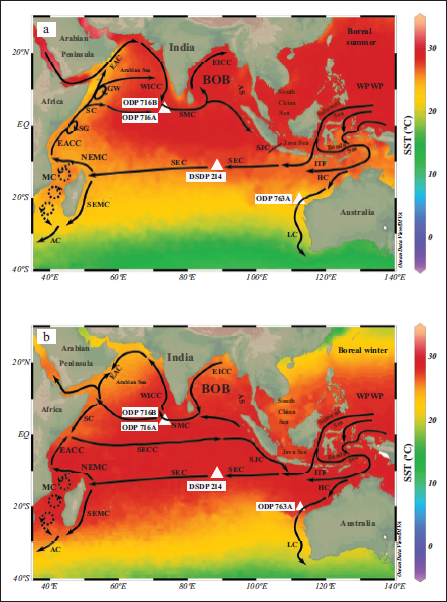
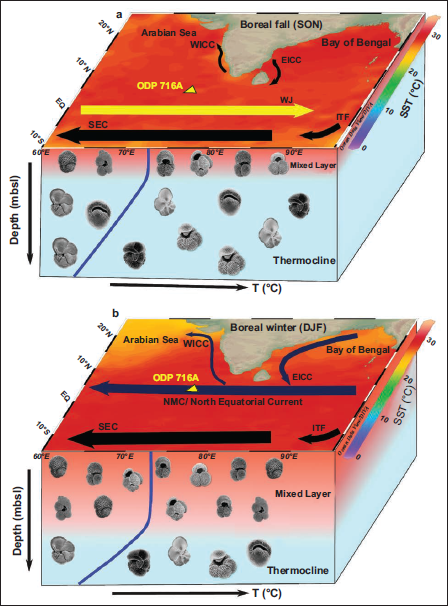
The EIO, extending from 40°E to 100°E between 10°S and 10°N, is a major tropical zone influenced by high solar radiation and seasonal shifts in the ITCZ, which govern wind patterns. Transitional periods between monsoons generate strong eastward Wyrtki Jets (WJ), driven by equatorial westerlies and confined to the upper 80–100 m, which redistribute heat and water masses across the basin (McPhaden et al., 2015; Senan et al., 2003; Wyrtki, 1973). ODP Site 716A, located centrally within the EIO (4°56.0ʹN, 73°17.0ʹE), lies directly within the influence of these dynamics. During the SW monsoon (Figure 1a), reduced productivity at Site 716A compared to the western Indian Ocean occurs due to thermocline uplift by the Southwest Monsoon Current (SMC) and the formation of a fresh surface layer that suppresses upwelling. Salty Arabian Sea waters reach the region via the West India Coastal Current (WICC) and SMC, whereas during the NE monsoon (Figure 1b), wind reversal enables the EICC and NMC to carry fresher Bay of Bengal waters to the site. Thus, it affects the salinity of the studied area, and the mean salinity at ODP Hole 716A (Figure 2a–2c) is ~34.80 PSU (Tchernia, 1980).
(a ) Indian Summer Monsoon Ocean Currents: ITF (Indonesian Through Flow), SJC (South Java Current), HC (Holloway Current), LC (Leeuwin Current), SEC (South Equatorial Current), NEMC (Northeast Madagascar Current), SEMC (Southeast Madagascar Current), MC (Mozambique Currents), AC (Agulhas Current), EACC (East African Coastal Current), SG (Southern Gyre), SC (Somali Current), GW (Great Whirl), EAC (East Arabian Current), WICC (West India Coastal Current), SMC (Southwest Monsoon Current), EICC (East Indian Coastal Current). BoB (Bay of Bengal), AS (Andaman Sea), WPWP (Western Pacific Warm Pool) White triangles indicate the ODP holes effected by these currents. SST Base map created using data from World Ocean Atlas (Reagan et al., 2024) and visualised using Ocean Data View (Schlitzer, 2023). (b ) Indian Winter Monsoon Ocean Currents: ITF (Indonesian Through Flow), SJC (South Java Current), HC (Holloway Current), LC (Leeuwin Current), SEC (South Equatorial Current), NEMC (Northeast Madagascar Current), SEMC (Southeast Madagascar Current), MC (Mozambique Currents), AC (Agulhas Current), EACC (East African Coastal Current), SC (Somali Current), EAC (East Arabian Current), WICC (West India Coastal Current), NMC (Northeast Monsoon Current), EICC (East Indian Coastal Current). BoB (Bay of Bengal), AS (Andaman Sea), WPWP (Western Pacific Warm Pool). White triangles indicate the ODP holes affected by these currents. SST Base map created using data from World Ocean Atlas (Reagan et al., 2024) and visualised using Ocean Data View (Schlitzer, 2023). The figure is adapted and modified after Schott and McCreary (2009) and Phillips et al. (2021).
(a ) SST, SSS, Chlorophyll- a, and wind direction during the summer monsoon month of July. SST and SSS Base map created using data from World Ocean Atlas (Reagan et al., 2024) and visualised using Ocean Data View (Schlitzer, 2023). Sea surface chlorophyll-a and wind velocity map created using E.U. Copernicus Marine Service Information; DOI: https://doi.org/10.48670/moi-00015 . (b) SST, SSS, Chlorophyll- a and wind direction during the winter monsoon month of December. SST and SSS Base map created using data from World Ocean Atlas (Reagan et al., 2024) and visualised using Ocean Data View (Schlitzer, 2023). Sea surface chlorophyll-a and wind velocity map created using E.U. Copernicus Marine Service Information; DOI: https://doi.org/10.48670/moi-00015 . (c) SST, SSS, Chlorophyll- a and wind direction during boreal fall month of October. Base map created using data from World Ocean Atlas (Reagan et al., 2024) and visualised using Ocean Data View (Schlitzer, 2023). Sea surface chlorophyll-a and wind velocity map created using E.U. Copernicus Marine Service Information; DOI: https://doi.org/10.48670/moi-00015
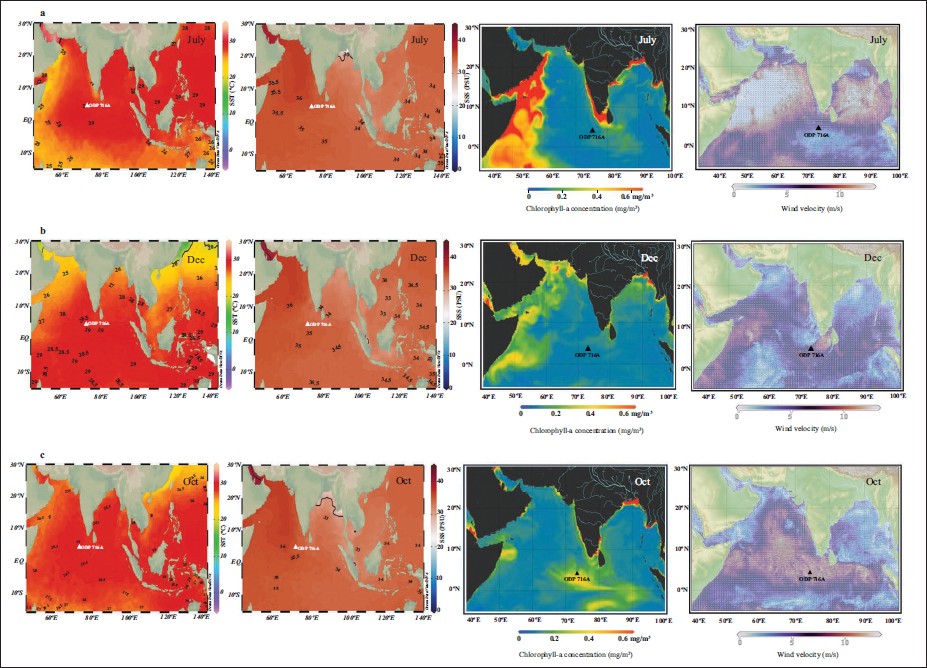
Inter-monsoon periods (April–May, October–November) experience stronger winds (Figure 3a and 3b) over the Maldives region, intensifying WJ formation, which significantly contributes to the redistribution of heat and mass across the Indian Ocean (McPhaden et al., 2015; Senan et al., 2003; Wyrtki, 1973). These jets deepen the thermocline in the eastern EIO between 2°N and 2°S (Diek et al., 2017), while causing shoaling toward the boundaries and the western basin (Wyrtki, 1973). Yadav et al. (2022) observed that the thermocline deepens seasonally in this area, and shoaling enhances productivity during inter-monsoon phases (Figure 2c), a modulation influenced by WJ strength (Punyu et al., 2014). However, upwelling contributes minimally to nutrient supply at Site 716A. The site receives negligible terrigenous input (Aubert & Droxler, 1992; Purdy & Bertram, 1993) and preserves a continuous Pliocene record composed mainly of foraminiferal and nannofossil oozes. Positioned above the OMZ and aragonite lysocline (Sarkar & Gupta, 2013), Site 716A is well-suited for planktonic foraminiferal studies, and the presence of aragonite ooze reflects long-term variations in sea level and productivity (Diek et al., 2017). Overall, the surrounding region maintains an oligotrophic character (Sarkar & Gupta, 2013) and is a suitable site for capturing ITF-monsoon interaction.
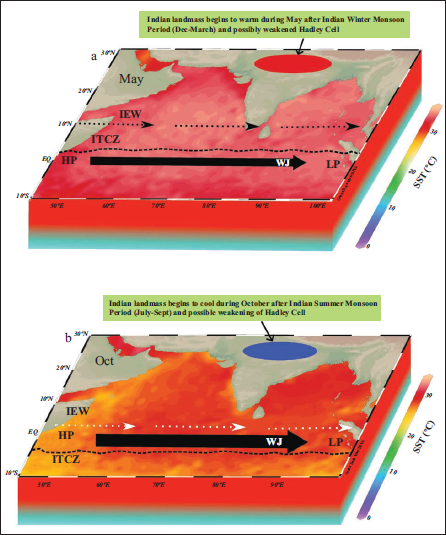
(a ) Formation of the Wyrtki Jet during May. IEW (Indian Equatorial Westerlies), WJ (Wyrtki Jet), ITCZ (Intertropical Convergence Zone), HP (High Pressure, LP (Low Pressure). The thinner arrow of WJ indicates weak WJ during May (Boreal Spring) (McPhaden et al., 2015). SST Base map created using data from World Ocean Atlas (Reagan et al., 2024) and visualised using Ocean Data View (Schlitzer, 2023). (b) Formation of the Wyrtki Jet during October. IEW (Indian Equatorial Westerlies), WJ (Wyrtki Jet), ITCZ (Intertropical Convergence Zone), HP (High Pressure), LP (Low Pressure). The thicker arrow of WJ indicates stronger WJ during October (Boreal Fall) (McPhaden et al., 2015). SST Base map created using data from World Ocean Atlas (Reagan et al., 2024) and visualised using Ocean Data View (Schlitzer, 2023)
MATERIALS AND METHODOLOGY
This study analyses 87 samples (each sample is 2 cm thick, with the sedimentation rate 5.6 cm per kiloyear) from the Early Pliocene interval (3.6–4.5 Ma) of ODP Hole 716A on the Maldives Ridge (4°56′N, 73°17′E; ~533 m water depth), recovered during ODP Leg 115. Ages were assigned using a linear sedimentation rate of ~56 m/Ma (Backman et al., 1988). The total core length analysed is 48.12 metres below sea floor, with samples taken at 30 cm intervals, with a temporal resolution of 6 kiloyears.
The deep-sea core sediment samples were processed to extract foraminifera, following standard micropalaeontological procedures: disaggregated in an alkaline sodium hydroxide–sodium hexametaphosphate solution, treated with hydrogen peroxide, wet-sieved (150 and 100 µm fractions), and air-dried. A micro-splitter was used to obtain aliquots containing ≥300 planktic foraminifera for analysis (Imbrie & Kipp, 1971; Imbrie et al., 1973). The >150 µm fraction was selected to maximise climatic information (Imbrie & Kipp, 1971) and ensure the presence of adult specimens (Peeters et al., 1999).
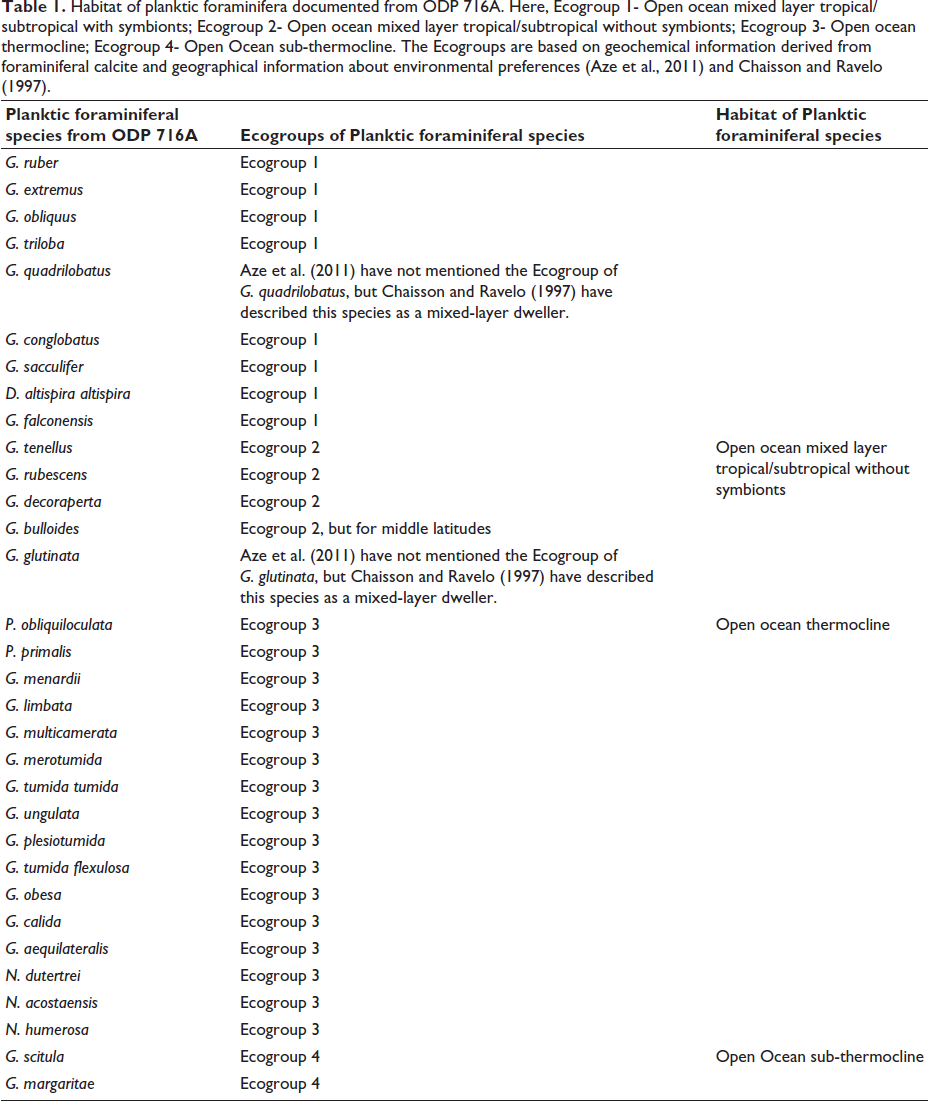
Species identification and counts were performed under a stereomicroscope, following taxonomic frameworks by Kennett and Srinivasan (1983), Bolli and Saunders (1985), and Schiebel and Hemleben (2017). Around 32 water-mass sensitive planktic foraminiferal species were identified (Table 1), and their percentages and relative abundance curves were used for palaeoceanographic interpretation.
Habitat of planktic foraminifera documented from ODP 716A. Here, Ecogroup 1- Open ocean mixed layer tropical/subtropical with symbionts; Ecogroup 2- Open ocean mixed layer tropical/subtropical without symbionts; Ecogroup 3- Open ocean thermocline; Ecogroup 4- Open Ocean sub-thermocline. The Ecogroups are based on geochemical information derived from foraminiferal calcite and geographical information about environmental preferences (Aze et al., 2011) and Chaisson and Ravelo (1997).
Statistical analysis of planktic foraminiferal population
Planktic foraminiferal census data were converted to relative abundances and transformed using the Hellinger method prior to Principal Component Analysis (PCA), following standard procedures for compositional ecological data (Legendre & Birks, 2012; Legendre & Gallagher, 2001). The Hellinger transformation equation
Here,
Yij = Relative abundance of species j in sample i.
T = Total abundance of all species in sample i.
This transformation stabilises variance by reducing the dominance of abundant taxa and enhancing the contribution of rarer species. This transformation avoids the ‘double-zero problem’, prevents PCA axes from being biased toward highly abundant taxa, and removes issues associated with constant-sum constraints that violate Euclidean assumptions (Legendre & Gallagher, 2001). The resulting dataset provides a more ecologically meaningful basis for interpreting community gradients. The PCA statistical analysis was performed by using PAST software version 4.03.
RESULTS
Planktic foraminiferal species prefer different ecological conditions. Aze et al. (2011) grouped them into different Ecogroups (Table 1) based on geochemical information derived from foraminiferal calcite and environmental preferences. In the present study, we have observed different Ecogroups.
Relative abundance of water mass sensitive Planktic foraminiferal species and their Ecogroups
In ODP Hole 716A, the presence of warm mixed-layer planktic foraminiferal species is dominated by episodes of higher relative abundance of thermocline-dwelling planktic foraminiferal species. In this study, we have documented that the relative abundance of Globigerina (G.) bulloides ranges from 0.6% to 12.22%, with a down-core average of 4.87% (Figure 4). This species shows three intervals of decreasing trends (4.46–4.32 Ma, 4.12–4.04 Ma, and 3.72–3.61 Ma) and two intervals of increasing trends (4.15–4.12 Ma and 3.88–3.72 Ma). Bé and Hutson (1977) suggested that the G. bulloides indicate nutrient-rich surface water in the low latitudes, associated with upwelling conditions (Bé & Toderlund, 1971). Therefore, the decreasing trends suggest the absence of upwelling, whereas the increasing trends indicate active upwelling in 716A, Maldives Ridge. Similarly, the abundance of Globigerinita (G.) glutinata ranges from 0.27% to 12.28%, with a down-core average of 3.95% (Figure 4). Like G. bulloides, this species prefers nutrient-rich surface waters and associates with upwelling conditions in the low latitudes (Bé & Hutson, 1977).
(a ) Relative abundance of G. bulloides. (b) Relative abundance of G. glutinata.(c) Relative abundance of G. menardella group. (d) Relative abundance of N. dutertrei. (e) Relative abundance of G. ruber. (f) Relative abundance of Pulleniatina group during 4.5–3.6 Ma at ODP site 716A. Dotted lines indicate the faunal count data points, while the solid lines indicate the centred three-point running average.
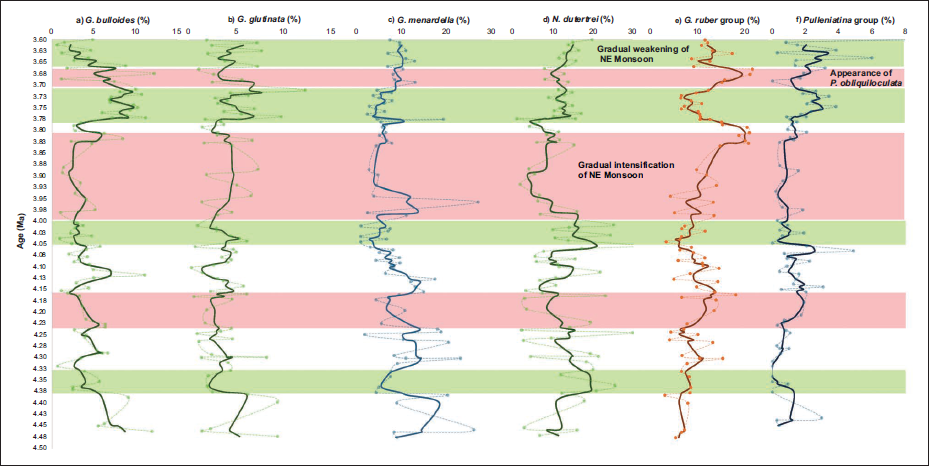
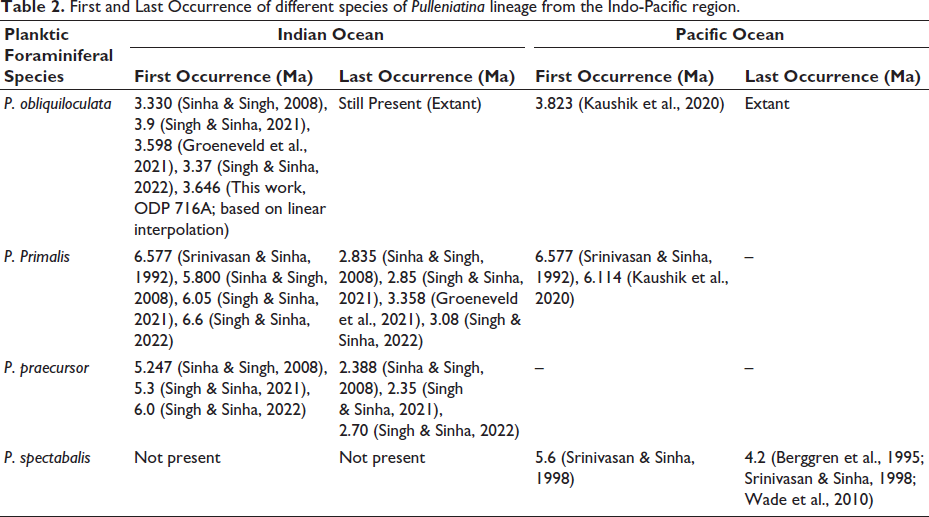
The Pulleniatina (P.) group belongs to Ecogroup 3 (Aze et al., 2011) and comprises P. obliquiloculata, P. praecursor, and P. primalis, which dwell in the thermocline (Watkins et al., 1996). Their abundance (P. praecursor and P. primalis) varies from 0% to 8.21%, with a down-core average of 1.54% (Figure 4) and shows no significant trend. P. obliquiloculata appeared relatively late in the Indian Ocean (~3.6 Ma) compared to the Pacific Ocean (Table 2). Other Thermocline Dweller Species (TDS), such as Globorotalia (G.) menardella group, which includes G. menardii, G. limbata, and G. multicamerata, share similar ecological preferences with the Pulleniatina group. Its abundance ranges from 0.88% to 26.96%, with a down-core average of 8.46% (Figure 4), and shows four intervals of increasing trends (3.61–3.66 Ma, 3.72–3.78 Ma, 4.03–4.09 Ma and 4.35–4.45 Ma) and three intervals of decreasing trends (3.66–3.72 Ma, 3.81–4.0 Ma, and 4.15–4.24 Ma).
First and Last Occurrence of different species of Pulleniatina lineage from the Indo-Pacific region.
Based on the same ecological preferences and their habitat (Table 1), various planktic foraminiferal species were grouped into four categories. The oligotrophic mixed-layer group (Figure 5) consists of Globigerinoides (G.) ruber, G. extremus, and G. obliquus, ranging between 3.10% and 21.55%, with a down-core average of 10.75%. It shows three intervals of increasing trends (3.66–3.72 Ma, 3.81–4.0 Ma, and 4.15–4.24 Ma) and four intervals of decreasing trends (3.61–3.66 Ma, 3.72–3.78 Ma, 4.03–4.09 Ma, and 4.35–4.45 Ma).
Relative abundance of (a) PIS – Productivity Indicator Species, (b) Oligotrophic species, (c) TDS – Thermocline Dweller Species and (d) UIS – Upwelling Indicator Species during 4.5–3.6 Ma at ODP site 716A.Dotted lines indicate the data points, while the solid lines indicate the centred three-point running average.
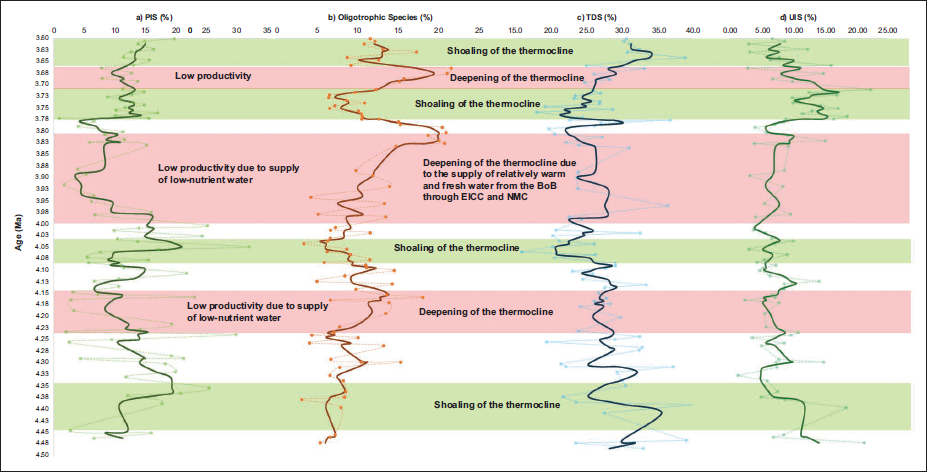
The TDS group consists of the G. menardella lineage, the G. tumida tumida lineage, the Globigerinella lineage, and the Pulleniatina lineage. The relative abundance of TDS ranges from 40.2% to 15.99%, with an average downcore variation of 26.95% (Figure 5). It shows three decreasing trends (3.66–3.72 Ma, 3.81–4.0 Ma and 4.15–4.24 Ma) and four increasing trends (3.61–3.66 Ma, 3.72–3.78 Ma, 4.03–4.09 Ma and 4.35–4.45 Ma). The productivity Indicator Species (PIS) belongs to Eco group 3 (Table 1) and consists of N. dutertrei, N acostaensis, and N. pachyderma (dextral). Its abundance varies from 34.01% to 1.98% with an average downcore variation of 15.12% (Figure 5). It shows three decreasing trends (3.66–3.72 Ma, 3.81–4.0 Ma and 4.15–4.24 Ma) and four increasing trends (3.61–3.66 Ma, 3.72–3.78 Ma, 4.03–4.09 Ma and 4.35–4.45 Ma).
PCA of Planktic foraminiferal Groups
We have carried out PCA on water-mass-sensitive planktic foraminiferal species recovered from the deep-sea open-ocean core ODP 716A, CEIO. We have identified several groupings of planktic foraminiferal species based on their ecological preferences and responses to water-mass conditions in the CEIO. These groups suggest thermal stratification in the CEIO during intense Northeast Monsoon Modes (NEMM) during the Early Pliocene.
Principal Component 1 (PC1): eutrophic conditions and nutrient availability
PC1 has a variance of 42.53%. The standard deviation (SD) for PC1 is ± 0.09. In PC1, the Neogloboquadrina (N.) group has the highest loading (+0.90), while the other groups have loadings below 0.45. Hence, PC1 is entirely explained by N. group abundance, with a positive loading indicating a higher abundance of the N. group.
Ecologically, N. group indicates open-ocean thermocline dwellers. They are mostly dominant in tropical latitudes and are also connected to surface productivity in ODP 716A. Here, PC1 (Figure 6a) represents surface productivity at ODP 716A in the CEIO. The data suggest that during the periods of 4.45 Ma to 4.35 Ma (92 kyr), 4.15 Ma to 4.04 Ma (97 kyr), and 3.69 Ma to 3.61 Ma (175 kyr), positive scores are observed, possibly indicating enhanced surface productivity. However, from 4.35 Ma to 4.23 Ma (120 kyrs) and from 4.05 Ma to 3.92 Ma (134 kyrs), negative scores are observed, suggesting a weakening of surface productivity.
(a ) On the left, PC1 scores are plotted against age. The green bar shows the standard deviation. On the right, loadings of MLD, TDS, PIS and UIS are shown with the highest loading of PIS. (b) On the left, PC2 scores are plotted against age. The green bar shows the standard deviation. On the right, loadings of MLD, TDS, PIS and UIS are shown, with the highest loading of UIS and MLD. (c) On the left, PC3 scores are plotted against age. The green bar shows the standard deviation. On the right, loadings of MLD, TDS, PIS and UIS are shown, with the highest loading of MLD and TDS. PCA of data done using PAST software (v4.03) (Hammer-Muntz et al., 2001). (d) Scores vs Age of PC1, PC2 and PC3 plots compared with each other. PCA of census data was performed using PAST software (v4.03) (Hammer-Muntz et al., 2001).
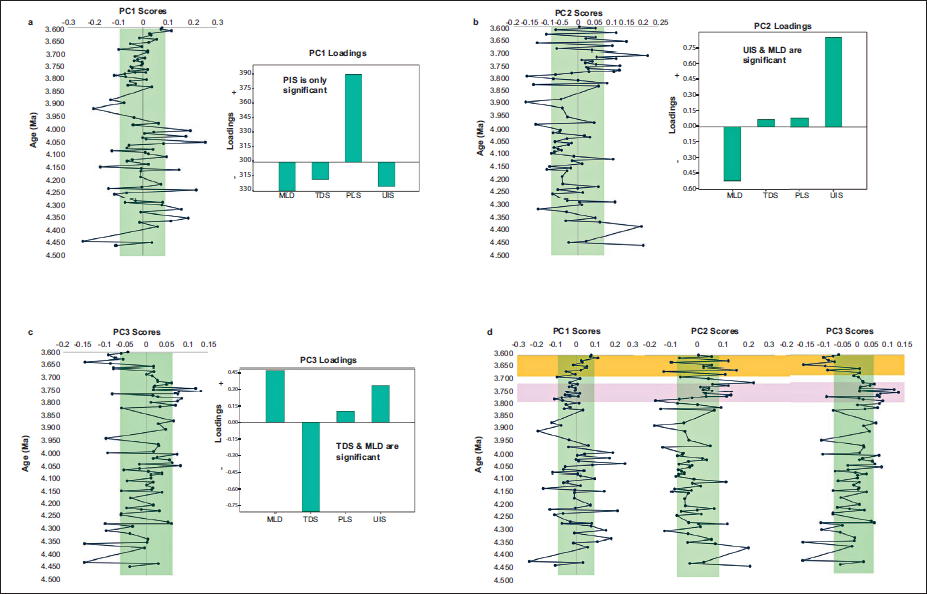
Principal Component 2 (PC2): upwelling condition
PC2 has a variance of 37.09% and an SD of ±0.08. In PC2, positive loading indicates the dominance of upwelling indicator species (UIS), whereas negative loading indicates the dominance of mixed-layer taxa. So, PC2 represents upwelling conditions in ODP 716A (Figure 6b). Therefore, a positive loading indicates upwelling conditions, and a negative loading indicates periods of stratified conditions. Between 3.79 and 3.71 Ma (80 kyr), strong positive scores are observed. This indicates enhanced upwelling during this time interval. Whereas, from 3.71 to 3.66 (46 kyr), PC2 shows a negative score, indicating stratification during this interval.
Principal Component 3 (PC3): Shoaling and Deepening of the thermocline
PC3 has a variance of 19.97% and an SD of ± 0.06. Here, positive loading indicates the dominance of mixed-layer dwellers, while negative loading indicates the dominance of TDS. The PC3 data suggest that positive loadings indicate thermocline deepening and vertical stratification (Figure 6c) in ODP 716A during the period from 3.76 to 3.64 Ma (115 kyr); negative loadings are also observed. This indicates weak vertical stratification.
Comparing all three PCs (Figure 6d), it can be observed that from 3.69 to 3.61 Ma (75 kyr), PC1, which indicates productivity, shows a trend moving towards positive scores. PC2, indicating upwelling conditions, shows no long-term trend during this time interval; instead, it exhibits pulses of upwelling and periods of non-upwelling. PC3 shows negative scores, indicating values that exceed its SD (±0.06), suggesting weak vertical stratification.
However, from 3.79 to 3.71 Ma (80 kyrs), PC2 shows a trend towards positive scores, PC3 towards negative scores, and PC1 towards positive scores. This may indicate that upwelling-induced thermocline shoaling led to weak vertical stratification, thereby increasing surface productivity during this time interval.
DISCUSSION
Based on ocean circulation modelling, Cane and Molnar (2001) argued that around 5 million years ago, the northward displacement of New Guinea altered the source of the ITF and redirected the ITF’s origin from warmer, saltier waters of the South Pacific to cooler northern Pacific sources, predicting a ~2°C decrease in sea surface temperature (SST) for the eastern tropical Indian Ocean. According to their model simulations, this temperature reduction was implicated in decreased regional rainfall and subsequent aridification across East Africa. It is important to note that their study relied exclusively on modelling results without support from direct palaeoceanographic proxy records from the Indian Ocean at the time.
Subsequently, Karas et al. (2009) empirically evaluated this scenario by conducting paired Mg/Ca and δ18O analyses on planktonic foraminifera from sediment cores dated between 5.5 and 2 million years ago in the tropical Indian Ocean. Their proxy data did not indicate surface cooling associated with the supposed ITF re-routing; instead, they observed cooling and freshening trends limited to subsurface waters. These patterns, together with εNd isotope evidence from DSDP Site 757, strengthen the case for a gradual restriction of the Indonesian Seaway and a corresponding shift from South to North Pacific ITF sources. This subsurface hydrographic shift was proposed by Karas et al. (2009) to have influenced the western Indian Ocean by promoting the upwelling of cooler waters, thereby contributing to declines in SST, evaporation, and rainfall over East Africa, ultimately modulating monsoonal dynamics.
In this work, both the hypotheses proposed by Cane and Molnar (2001) and Karas et al. (2009) were evaluated by applying the ‘Huttonian principle’—that the present offers insights into the past—using planktic foraminiferal assemblages as key proxies. Species inhabiting the mixed-layer thrive in warm, stratified surface waters; higher abundances indicate a thickened mixed layer, while lower values indicate a thinning trend. The mixed-layer dwellers (MLD) group consists of G. ruber, G. extremus, G. obliquus, G. sacculifer, G. triloba and G. conglobatus, along with D. altispira altispira. It ranges from 55.67% to 25.31%, with an average downcore variation of 38.63% (Figure 7). It shows three increasing trends (3.66–3.7 Ma, 3.78–3.84 Ma and 4.16–4.25 Ma) and four decreasing trends (3.6–3.66 Ma, 3.71–3.77 Ma, 4.0–4.06 Ma and 4.34–4.39 Ma). Conversely, higher or lower proportions of TDS imply a shallower or deeper thermocline, respectively. The abundance data reveal an overall rise in MLD taxa throughout the Early Pliocene, periodically interrupted by four distinct declines. A uniform drop in Indian Ocean sea surface temperatures, as proposed by Cane and Molnar (2001), is not supported by the proxy records used in our study. Instead, the data show periods of mixed-layer warming interrupted by occasional cooling phases. This pattern differs from the idea that the restriction of the Indonesian Seaway caused a steady basin-wide cooling during 3–4 Ma. Consistent with Karas et al. (2009), the proxies do not point to a long-term, uninterrupted decline in SSTs over this interval. They suggest a history marked by short-term shifts and an overall warming trend rather than a continuous cooling of the Indian Ocean during the past 3–4 million years.
Comparison of the relative abundance of (a) warm MLD – Mixed Layer Dwellers and, (b) TDS along with the PIS of ODP 716A (c) the global δ18O curve LR04 stack (Lisiecki & Raymo, 2005) and (d) δ18O G. sacculifer from DSDP 214 (e) δ18O G. sacculifer from ODP 763A (Karas et al., 2009, 2011) Dotted lines indicate the data points while the solid lines indicate centred three-point running average for warm MLD, TDS + PIS, δ18O Gs. sacculifer (DSDP 214 & ODP 763A) and centred five-point running average for global δ18O curve.
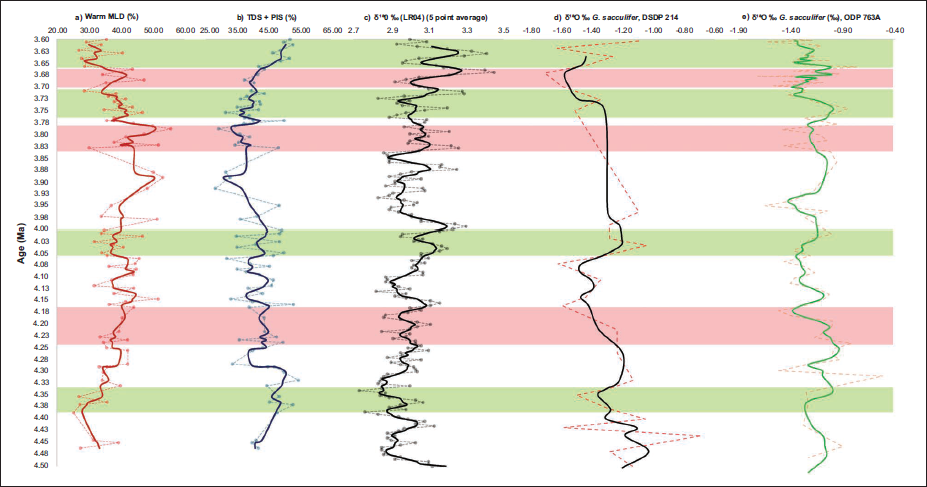
These oscillations are strongly associated with the intensity and variability of the NE monsoon. During intervals characterised by a strengthened NE monsoon, upwelling at Site 716A appears diminished. Concurrently, an influx of less saline water from the Bay of Bengal into the Arabian Sea through the NMC (Yadav et al., 2022) promoted thickening of the mixed layer. Such hydrographic states favoured the dominance of warm-water MLD foraminifera and were accompanied by elevated SST and reduced surface salinity across the CEIO.
In contrast, the TDS group maintained a comparatively stable trend through the Early Pliocene, albeit with minor fluctuations. Four intervals of elevated TDS abundance were identified, each separated by phases of decline (Figure 5). According to Deik et al. (2017), these peaks reflect episodes of thermocline shoaling induced by intensified equatorial jets, such as the WJ, which enhances local upwelling through westward current flow. However, the present study suggests that the shoaling might alternatively result from a reduced inflow of warm, low-salinity Bay of Bengal water under weakened NE monsoon precipitation, coupled with restricted exchange of intermediate thermocline waters from the Pacific via the ITF (Figure 7). Karas et al. (2011) further documented that between 3.5 and 3.0 Ma, SST along Western Australia (ODP Site 763A) cooled by approximately 2–3°C relative to the largely stable tropical Indian Ocean, attributing this to a weakened Leeuwin Current associated with tectonically diminished ITF flow. Similarly, Sinha et al. (2006) recognised comparable ‘PL events’ during the Quaternary at the same locality, characterised by elevated abundances of upwelling species G. bulloides and decreased warm-water G. ruber populations, linking these episodes to subdued Leeuwin Current activity and intensified trade wind-driven upwelling.
Within the present record, declines in TDS abundance may reflect phases of thermocline deepening that coincide with intensified NE monsoon activity, enhanced precipitation, and the inflow of relatively fresh surface waters via the NMC. The alternating patterns between mixed-layer expansion and thermocline deepening highlight a dynamic coupling between monsoon-driven hydrographic processes and foraminiferal community responses, underscoring the strong ecological sensitivity of these assemblages to Early Pliocene oceanographic variability in the EIO.
The TDS P. obliquiloculata, belonging to the open-ocean thermocline Ecogroup 3 (Aze et al., 2011), appeared relatively late in the Indian Ocean (Groeneveld et al., 2021; Singh & Sinha, 2022; Sinha & Singh, 2008) compared with its first occurrence in the Pacific Ocean (Kaushik et al., 2020; Srinivasan & Sinha, 1992). This delayed appearance likely reflects a restricted intermediate ITF between the Pacific and Indian Oceans during the Early Pliocene (Table 2). Another species of the Pulleniatina group, P. spectabilis, remains absent from the Early Pliocene record of the central Indian Ocean but is documented from the Pacific (Kaushik et al., 2020; Srinivasan & Sinha, 1998). In the present investigation, we record the youngest first occurrence of P. obliquiloculata at the studied site and confirm the absence of P. spectabilis in the CEIO. Previous studies (Srinivasan & Sinha, 1998, 2003) proposed that the Indonesian Seaway was closed between 5.6 and 4.2 Ma, based on the distribution of P. spectabilis. We infer that the late appearance of P. obliquiloculata in this region is linked to the re-establishment of ITF-mediated intermediate thermocline water exchange from the Pacific into the Indian Ocean.
At ODP Site 716A, the composite record of oligotrophic indicator foraminifera remains stable mainly throughout the Early Pliocene, punctuated by three distinct peaks in relative abundance separated by four intervals of decline. In contrast, UIS exhibits generally low abundance during this period, with one notable episode of elevated upwelling intensity between 3.78 and 3.72 Ma, probably related to increased WJ activity (Figure 8a). A corresponding increase is also documented among PIS during this short interval (Figure 5).
(a ) A schematic diagram showing the reduced thickness of the mixed layer and increased thickness of the thermocline layer of ODP 716A during boreal fall and associated ocean surface currents. Here, WJ- Wyrtki Jet, WICC- West India Coastal Current, EICC- East India Coastal Current, SEC- South Equatorial Current, ITF- Indonesian Throughflow, SON- September October November. Based on Schott and McCreary (2009) and Phillips et al. (2021). SST Base map created using data from World Ocean Atlas (Reagan et al., 2024) and visualised using Ocean Data View (Schlitzer, 2023). Planktic foraminifera images from Kennet and Srinivasan (1983). (b) A schematic diagram showing increased thickness of the mixed layer and reduced thickness of the thermocline layer of ODP 716A during the strengthened NE Monsoon and associated ocean surface currents. The thicker lines of NMC and EICC indicate a strengthened flow of these currents. Here, WICC- West India Coastal Current, EICC- East India Coastal Current, NMC- Northeast Monsoon Current, SEC- South Equatorial Current, ITF- Indonesian Throughflow, DJF- December January February. Based on Schott and McCreary (2009) and Phillips et al. (2021). SST Base map created using data from World Ocean Atlas (Reagan et al., 2024) and visualised using Ocean Data View (Schlitzer, 2023). Planktic foraminifera images from Kennet and Srinivasan (1983).
The contrasting abundance patterns of oligotrophic and upwelling taxa likely result from two major processes. First, during periods of intensified NE monsoon activity, deeper thermocline development suppressed upwelling in the equatorial region, reducing surface productivity and maintaining oligotrophic conditions. Second, a weakened ITF would have further dampened equatorial upwelling at Site 716A, thereby reducing nutrient supply and lowering productivity. The Pliocene ITF restriction also influenced the southeastern Indian Ocean, where a shallower thermocline developed off Western Australia (Figure 7) owing to a weakened Leeuwin Current (Karas et al., 2009, 2011). Comparable shoaling trends were also reported from Site U1463 on the northwestern Australian margin by Auer et al. (2019). A long-term increase in thermocline-dwelling taxa between 4.03 and 3.6 Ma observed at Site 716A similarly supports this regional oceanographic reorganisation (Figure 7).
Thermocline shoaling at Site 716A was strongly modulated by the eastward-flowing equatorial WJ (Figure 8a). This hydrodynamic mechanism corresponded to decreases in MLD taxa between 4.03 and 3.89 Ma, while TDS became more abundant. After ca. 3.89 Ma, MLD and thermocline species show an in-phase relationship likely reflecting enhanced NE monsoon influence (Figure 8b) and thickening of the mixed layer (Schulte et al., 1999). Between 4.36 and 4.15 Ma, a reduction in N. dutertrei accompanied by an increase in warm-water taxa (G. ruber, G. extremus, and G. obliquus) suggests a general decline in primary productivity (Figure 8b), even as TDS became more prominent—implying thermocline shoaling during this interval.
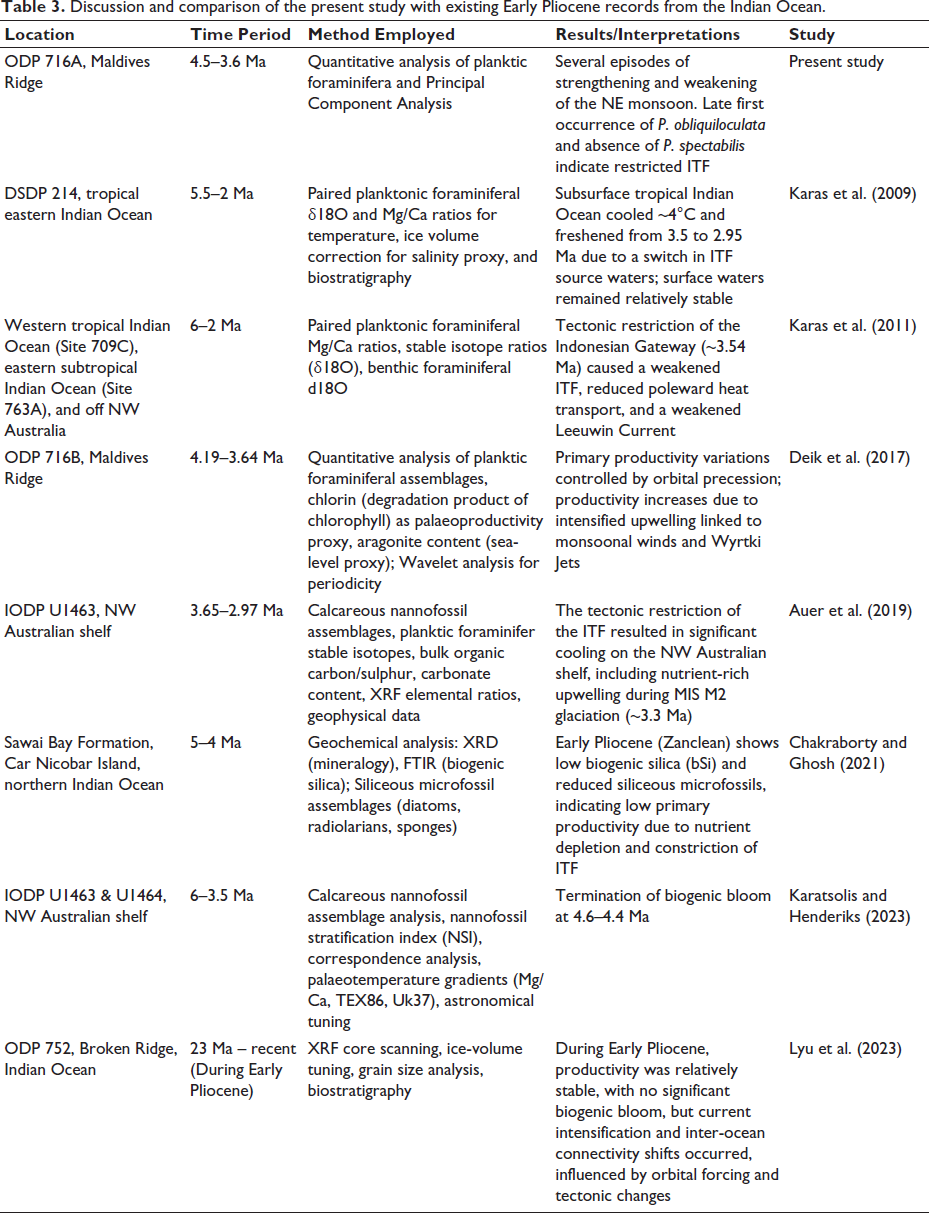
Parallel evidence of reduced productivity across the northern Indian Ocean corroborates this inference. Based on multiproxy analyses (biogenic silica, XRD, FTIR), Chakraborty and Ghosh (2021) documented a persistent Early Pliocene decline in productivity related to diminished nutrient influx from the constricted ITF. Lyu et al. (2023) identified a similar, astronomically paced decline in paleoproductivity on Broken Ridge (central Indian Ocean). Karatsolis and Henderiks (2023) observed a marked productivity drop, accompanied by shifts in nannofossil assemblages on the northwestern Australian shelf following the termination of the Late Miocene–Early Pliocene biogenic bloom, also linked to altered ITF circulation. The comparison between the earlier records and the present study is presented in Table 3.
Discussion and comparison of the present study with existing Early Pliocene records from the Indian Ocean.
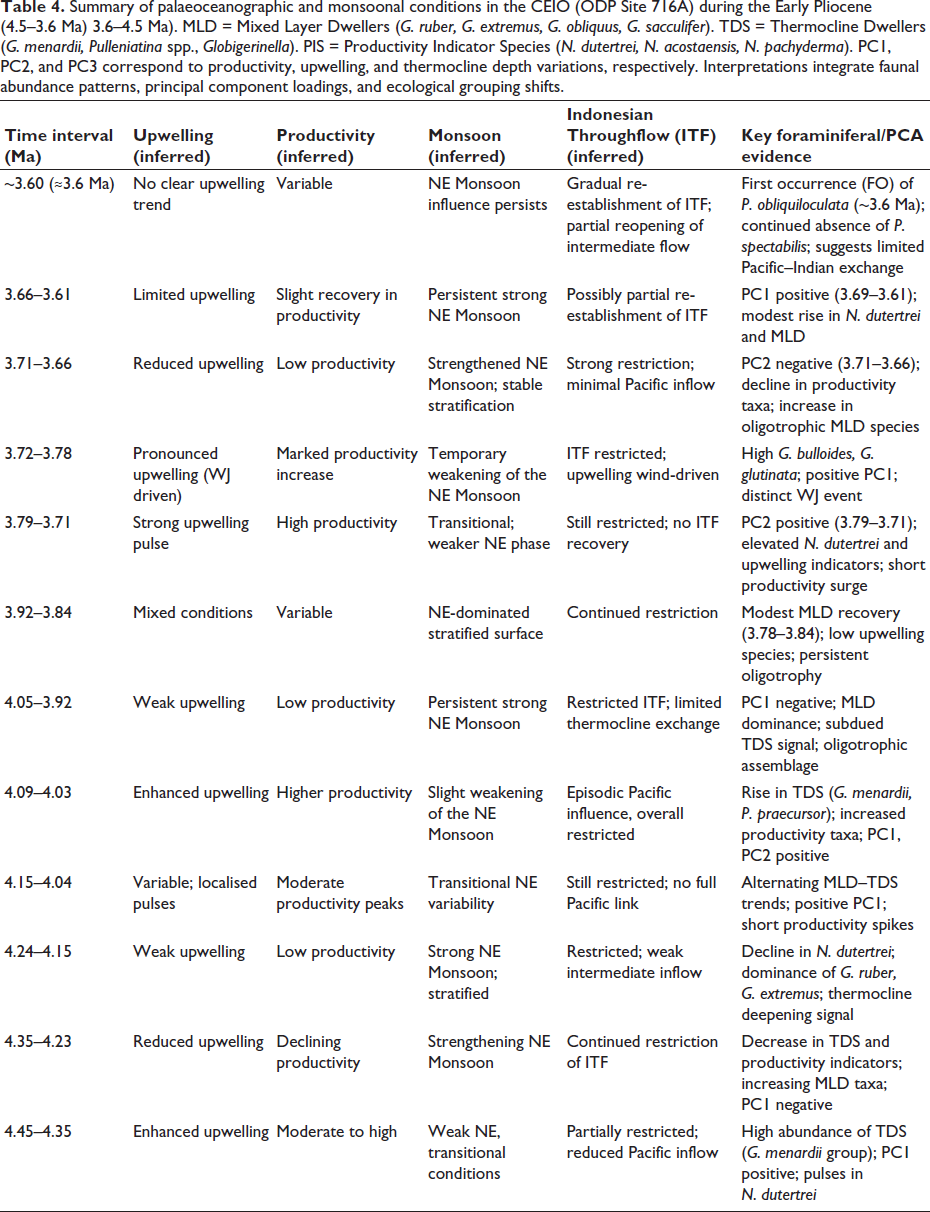
Diek et al. (2017) detected elevated primary productivity at ODP Site 716B through concurrent increases in thermocline-dwelling foraminifera and chlorine concentration between 4.19 and 3.64 Ma. However, our Site 716A record does not display a comparable long-term increase in N. dutertrei abundance, despite a general upward trend among TDS taxa. This discrepancy likely arises from the different proxies used to assess productivity. Raja and Rosell-Melé (2022) demonstrated that chlorine-based measures do not strongly correspond with chlorophyll concentrations in oligotrophic settings. Given that Site 716A represents an oligotrophic environment (GEOSECS, 1983; Sarkar & Gupta, 2013), these proxy limitations likely account for the observed mismatch in productivity signals between Sites 716A and 716B. A summary of the significant findings is presented in Table 4.
Summary of palaeoceanographic and monsoonal conditions in the CEIO (ODP Site 716A) during the Early Pliocene (4.5–3.6 Ma) 3.6–4.5 Ma). MLD = Mixed Layer Dwellers (G. ruber, G. extremus, G. obliquus, G. sacculifer). TDS = Thermocline Dwellers (G. menardii, Pulleniatina spp., Globigerinella). PIS = Productivity Indicator Species (N. dutertrei, N. acostaensis, N. pachyderma). PC1, PC2, and PC3 correspond to productivity, upwelling, and thermocline depth variations, respectively. Interpretations integrate faunal abundance patterns, principal component loadings, and ecological grouping shifts.
CONCLUSIONS
This study provides a detailed reconstruction of Early Pliocene oceanographic conditions in the CEIO using water-mass sensitive planktic foraminiferal assemblages from ODP Hole 716A. The results show that surface hydrography in this region did not follow a simple, unidirectional trend. Instead, the Early Pliocene was marked by recurring shifts between warm, stratified mixed-layer conditions and short-lived intervals of thermocline shoaling and enhanced productivity. These oscillations reflect the combined influence of monsoon variability, equatorial jet dynamics, and changes in the strength and structure of the ITF.
The mixed-layer and thermocline species groups document alternating phases of stronger and weaker NE monsoon conditions, which controlled stratification, upwelling, and nutrient delivery. A recurring signature of warm mixed-layer assemblages, together with the low abundance of productivity indicators, supports the view that the CEIO remained largely oligotrophic. Only one notable productivity pulse, tied to intensified WJ activity between ~3.78 and 3.72 Ma, interrupts this long-term pattern.
Biogeographic evidence from key thermocline-dwelling taxa, especially the delayed arrival of P. obliquiloculata and the continued absence of P. spectabilis, points to reduced intermediate-water exchange between the Pacific and Indian Oceans. This supports a scenario of a partially restricted ITF during the Early Pliocene, consistent with a broader regional reorganisation documented from the southeastern Indian Ocean and Australian margin. The combined faunal, hydrographic, and ecological evidence suggests that ITF restriction played a meaningful role in shaping monsoon behaviour, thermocline depth, and nutrient distribution in the EIO.
Overall, the Early Pliocene CEIO emerges as a dynamic yet consistently nutrient-poor system in which monsoon-driven stratification and intermittent upwelling interacted with evolving inter-ocean exchange to produce a complex hydrographic regime. These findings refine the timing and expression of ITF restriction and clarify how low-latitude circulation shifts influenced regional monsoon–ocean coupling during a warm climate phase.
Future work should better integrate additional geochemical proxies to constrain temperatures, thermocline structure, and water-mass sources. Higher-resolution sampling would help clarify the timing of monsoon–ITF interactions, while climate–ocean models with realistic seaway geometry could separate the roles of monsoon winds, WJ activity, and ITF restriction. Expanding similar multiproxy studies across the wider Indian Ocean would also improve our understanding of how seaway changes shaped regional and global climate during the Early Pliocene.
Footnotes
Acknowledgement
KB gratefully acknowledges support from the Council of Scientific and Industrial Research (CSIR), New Delhi, through the award of Junior Research Fellowship (JRF). KB, AKS, and DKS extend their gratitude to the Delhi School of Climate Change and Sustainability and the Department of Geology, University of Delhi, for providing essential logistical support that facilitated the research.
Declaration of Conflicting Interests
The authors declared no potential conflicts of interest with respect to the research, authorship and/or publication of this article.
Funding
The authors disclosed receipt of the following financial support for the research, authorship and/or publication of this article: The authors acknowledge financial support from the Palaeoclimate Programme of the Ministry of Earth Sciences, Government of India, under Sanction No. MoES/CCR/Paleo-4/2019, which supported the research, authorship, and/or publication of this work.