
Abstract
Proponents of intellectual property claim that it fosters innovation and benefits companies and workers by increasing long-run growth. A growing body of literature challenges these claims by arguing that the cumulative nature of intellectual monopoly amplifies asymmetries between winners and losers. Intellectual monopolies pose disadvantages for countries, firms, consumers, and workers who struggle to maintain a leading position. Using data at the aggregate level from 1948 to 2021 in the United States, this article estimates the long-run effects of proprietary knowledge accumulation on income shares and tests the hypothesis that intellectual monopoly amplifies income inequality. The empirical evidence shows that companies in the United States transferred to wages a significant share of their profits from intellectual property. But these transfers have widened income inequality by benefiting the top 10 and top 25 percent, to the detriment of lower income brackets. Intellectual property alone can explain 23 percent of the increase in the income share of the top 10 percent in the 1948–2021 period.
1. Introduction
Proponents of intellectual property argue that it spurs innovation and enhances long-term growth, benefiting both businesses and workers. Advocates of stronger intellectual property rights include the United States Patent and Trademark Office, the European Patent Office, the World Intellectual Property Organization (WIPO) of the United Nations, and the World Trade Organization (WTO). Intellectual property rights are also a major component of the Trade-Related Aspects of Intellectual Property Rights (TRIPS) developed by the WTO, the most comprehensive multilateral agreement on intellectual property.
A growing body of literature, however, challenges the assertion that intellectual property is beneficial, contending that the cumulative nature of intellectual property can create intellectual monopolies and exacerbate disparities among winners and losers, both domestically and globally. Intellectual property can become increasingly detrimental to consumers, employees, companies, and countries unable to maintain their top-tier positions. An intellectual monopoly encompasses, nonetheless, a broader concept than the exclusive legal rights granted through patents, copyrights, or trademarks. It refers to the control or dominance over intangible assets such as ideas, knowledge, or information, regardless of whether this control is based on legal rights or other mechanisms like trade secrets, proprietary processes, or exclusive access to critical information. An intellectual monopoly occurs when an entity, individual, or group has exclusive or dominant control over intangible assets, giving them significant competitive advantages. Intellectual monopolies, whether legally granted or informally maintained, can impact competition, innovation, and market dynamics, as they create barriers to entry for other parties or restrict the free flow of ideas and information.
Recent heterodox (Pagano 2014; Belloc and Pagano 2012; Rikap 2021; Rikap and Lundvall 2021; Durand and Milberg 2020; Rotta 2018, 2022) and mainstream scholarships (Autor et al. 2020; Kehrig and Vincent 2021; De Loecker, Eeckhout, and Unger 2020; Barkai 2020; Gutiérrez and Philippon 2017, 2019; Farhi and Gourio 2018; Boldrin and Levine 2010) further argue that the concentration of proprietary knowledge and the persistent and cumulative nature of intellectual monopoly tend to raise income inequality. Three main channels explain this causal mechanism. First, intellectual property can reduce real wages by increasing markups and the market power of companies relative to consumers. Second, knowledge monopolization raises inequality between firms by creating artificial barriers to competition and by concentrating the assets and gains from proprietary knowledge in a few companies. Third, knowledge monopolization increases inequality within firms by benefitting highly-skilled employees, particularly those who create and commodify knowledge for their employers. At the aggregate level, these three mechanisms tend to raise income inequality.
Empirical studies, however, have given relatively scant consideration to the implications of intellectual property for income distribution, focusing instead on the impacts on economic growth (Maskus 2000, 2012, 2022). Cross-country studies have assessed the impact of intellectual property on innovation, technology diffusion, and GDP growth at different levels of economic development. The empirical evidence across countries indicates that economies at higher stages of development have greater innovative capacity and benefit from stronger intellectual property rights. Developing countries, on the contrary, tend to imitate foreign technology and innovate less, hence benefiting from weaker intellectual property rights. The impact of intellectual property on income distribution and inequality within countries, however, remains largely understudied in the empirical literature.
This study adds to the existing body of knowledge by assessing the long-term consequences of intellectual property accumulation on income distribution in the United States. Drawing upon aggregate data for a 74-year period from 1948 to 2021, this research reveals that the accumulation of intellectual property has primarily favored the top 10 and top 25 percent income brackets while simultaneously diminishing the income shares of individuals with low and medium skill levels. To quantify the impact of proprietary knowledge accumulation, this study utilizes time series econometrics and estimates the long-run effects of the stock of proprietary intellectual assets on income shares. To measure the cumulative stock of proprietary intellectual assets, the regressor of interest is the share of intellectual property products in the aggregate stock of fixed assets. By focusing on the aggregate impact of intellectual property on income distribution, the estimates in this paper include intersectoral spillover effects, as is the case when intellectual monopoly in one sector negatively or positively impacts consumers and workers in other sectors. To mitigate the potential for endogeneity bias, the research employs control and instrumental variables and utilizes the iterative generalized method of moments (iGMM) estimator.
The article employs several measures of income distribution to estimate the effects of proprietary knowledge accumulation on different professional groups, skill sets, and combinations of labor and capital income. The analysis of different income shares is necessary because conventional measures of the wage share include the compensation of top managers and highly skilled employees and thus underestimate the fall in the labor share of low- and medium-skilled workers. Dependent variables in this study include the wage share of domestic income; the bottom 50, top 10, and top 1 percent shares of national income; the top 10 to the bottom 40 percent income ratio, known in the literature as the “Palma ratio”; the top 25 to bottom 75 percent income ratio; and the Gini coefficient for the entire adult population. Unlike wage shares, income shares are pre-tax and include self-employment income. The top 25 to bottom 75 percent income ratio proxies for the rate of surplus value, which is the rate of exploitation (ratio of unpaid to paid labor time) of nonsupervisory and self-employed workers in productive activities. Productive activities exclude finance, insurance, real estate, government administration, and knowledge commodification.
The econometric approach uses control variables to compute the net effect of intellectual property accumulation on income distribution and employs instrumental variables to reduce the endogeneity bias. Control variables include the capital stock per person employed (the capital/labor ratio as a proxy for technical change), unemployment duration, union density, female workforce participation, and current account openness. Instrumental variables include lags of the manufacturing share of employment, share of China in world exports, the United States terms of trade, real minimum wage per hour, number of strikes per year, and lags of control variables. Instruments reduce endogeneity bias not only in the regressor of interest (the intellectual property share of fixed assets) but also in the control variables, allowing for a comparison of regression coefficients.
Recent studies on the determinants of labor shares have focused mostly on panel data sets at the country, industry, and firm levels. Most panel data from developed countries, however, have data available only from the 1980s onwards. For developing countries, panel data are even more restricted and made available mostly starting in the 1990s. This limitation means that empirical research based on panel models lose crucial information on the decades before the neoliberal era. Data from the United States reveal how the economy experienced structural changes in the 1970s when indicators of worker power began a steep decline, and indicators of capital power started a rapid climb. Because it covers both the regulated regime (1948–1980) and the neoliberal regime (1980 onward), the econometric study in this article offers additional empirical evidence compared to the panel data studies that focus solely on the post-1980 neoliberal era.
Results show that American companies have transferred a significant share of knowledge rents from their profits to wages. Because of this transfer, the accumulation of proprietary knowledge has had a positive contribution to the aggregate wage share in the United States. This positive contribution, however, has been uneven and has mostly benefited the income shares at the top 10 and top 25 percent, to the detriment of low-skilled, medium-skilled, and nonsupervisory workers in the bottom shares of national income. Intellectual property in the private sector alone can explain 19 percent of the increase in the top 10 percent income share from 1948 to 2021, or 23 percent of the increase once intellectual property in the public sector is accounted for. The findings also show that the accumulation of proprietary knowledge reduced the bottom 50 percent income share while boosting the top 25 to bottom 75 percent ratio, the top 10 to bottom 40 percent ratio (the Palma ratio), and the Gini coefficient. For the top 1 percent, where profits and capital income are concentrated, the rise of inequality is explained not by intellectual property but by the demise of unions.
The article is structured as follows. Section 2 compares the study to previous empirical studies and explains the choice of variables in light of the extant scholarship. Section 3 explains the estimation methodology. Section 4 presents the empirical findings. Section 5 concludes the article. The appendix provides further details on data sources and estimations.
2. Comparison to Previous Studies
Advocates of intellectual property rights such as the WIPO and WTO argue that companies would not invest in new technologies and processes if competitors or consumers can easily free ride on. But because the marginal cost of knowledge and information tends to zero once the first unit (the mold or template) is created, the incomes that accrue to the owners of monopolized knowledge are in fact knowledge rents 1 (Rotta 2018, 2022; Rotta and Paraná 2022; Rotta and Teixeira 2019; Teixeira and Rotta 2012). This means that intellectual property creates monopoly powers that might benefit companies relative to consumers, or shareholders relative to employees, or highly skilled workers relative to low- and medium-skilled ones. The empirical evidence in this article shows that intellectual monopoly in the United States has indeed given rise to knowledge rents that were partially transferred to the incomes of the top 10 and top 25 percent and, in this way, worsened the distribution of income over the long run.
Cross-country studies on the effects of intellectual property have mostly focused on innovation, technology diffusion, and long-run growth at different levels of economic development. Results indicate that developed countries have greater capacity to innovate and thus benefit much more from strong intellectual property rights than developing countries. Developing countries usually lack innovative capacity and tend to imitate foreign technology, hence benefiting from weaker intellectual property rights (Falvey and Foster 2006; Fink and Maskus 2005; Maskus 2000, 2012; Coriat and Weinstein 2012).
Maskus (2022) notes, however, that few empirical studies estimate the impact of intellectual property on income distribution and inequality. In a panel of sixty-two developing countries between 1985 and 2001, Adams (2008) shows that the strengthening of intellectual property rights, measured by increases in the Ginarte-Park index, do increase Gini coefficients across developing countries. The effect is statistically significant but small in magnitude: a 20 percent strengthening of patent rights in the average developing country increases income inequality by just over 1 percent. As Falvey and Foster (2006) show, the Ginarte-Park index quantifies the scope and strength of intellectual property rights, but it does not measure if the law is enforced in practice. Maskus (2022) argues that intellectual property strengthens skill-biased technical change even further if it indeed boosts wage inequality between low- and high-skilled workers.
Contrary to Adams’s (2008) findings, Saini and Mehra (2018) run a similar study across 65 developed and developing countries from 1995 to 2009 and find that stronger patent protection (via increases in the Ginarte-Park index) reduced income inequality, as measured by the posttransfer Gini coefficient. The posttransfer Gini coefficient, however, reflects substantial nonmarket income redistributions and it might be the reason why Saini and Mehra (2018) find that the Ginarte-Park index reduces inequality across countries. Developed countries with stronger intellectual property rights are likely to have stronger welfare states and greater income transfers, thus creating a high (noncausal) correlation between intellectual property rights and income equality. To avoid this identification problem, the current study measures inequality through pre-tax incomes instead.
Using state-level patent and income data from 1975 to 2010 in the United States, Aghion et al. (2019) find positive and significant effects of patents on the income share of the top 1 percent. The authors employ control and instrumental variables to mitigate reverse causality and endogeneity bias. They estimate that a 1 percent increase in patents per capita implied an increase of 0.17 percent in the top 1 percent income share on average across all states, meaning that patenting could explain 17 percent of the increase in the top 1 percent income share in the United States. The aggregate-level estimate in the current article is close to the estimate at the state level from Aghion et al. (2019). A 1 percent increase in the share of intellectual property products in the capital stock of the private sector produces a 0.19 percent increase in the top 10 percent income share and a 0.15 percent increase in the top 1 percent income share.
Bhattacharya, Chakraborty, and Chatterjee (2022) create a quasi-natural experiment using a large panel of Indian manufacturing firms from 1990 to 2006 and landmark legislation from the Patents Amendment Act of 2002. The new legislation strengthened intellectual property protection in compliance with the TRIPs agreement of the WTO, which India is a member of. The authors estimate that the new patent law increased wage gaps between managers and nonmanagers both within and between companies after 2002. Manufacturing companies transferred a portion of their knowledge rents to the wage share of managers after the implementation of the new intellectual property rights regime, thus increasing inequality within firms. The transfer of income from knowledge rents to managerial wages was even greater in high-technology industries, further increasing inequality between firms.
The scholarship on intellectual monopoly has also grown in recent years. Pagano (2014), Belloc and Pagano (2012), and Durand and Milberg (2020) demonstrate that intellectual property rights create intellectual monopolies that reduce investment possibilities for companies and countries that are unable to secure licensing rights. These authors also emphasize the cumulative causal mechanism that proprietary knowledge creates. Because of the concentration of proprietary knowledge at a few leading firms and the persistent and cumulative nature of intellectual monopoly, companies and countries able to stay at the top of the pecking order can invest and outcompete their rivals. Companies and countries unable to stay ahead in the innovation race, on the contrary, find themselves trapped in the “anti-commons tragedy.”
Land enclosures and private property over land can prevent the tragedy of the commons and the overuse of fertile soil. Knowledge enclosures and private property over intellectual assets, in contrast, end up reducing economic growth by restricting investment opportunities. Unlike land, knowledge cannot suffer from overuse, and it is a rival resource only through artificial means. As a result of intellectual monopolization, the accumulation and enforcement of property rights by a handful of countries and firms means that other players in the innovation race face a growing field of monopolized knowledge and, consequently, face increasing innovation costs and fewer investment prospects (Pagano 2014; Belloc and Pagano 2012).
Rikap (2021) and Rikap and Lundvall (2021) further demonstrate that intellectual monopolization increases inequality between winners and losers in the innovation race. Because of asymmetric control over knowledge and information, intellectual monopoly boosts inequality across companies, workers, and countries. According to Rikap (2021), the networks of scientific publications, patents, and mergers and acquisitions in the tech and pharmaceutical industries reveal how leading firms establish self-reinforcing intellectual monopolies over a wide array of innovations, often relying on the privatization of publicly funded research. Intellectual monopoly deepens inequality by weakening the power of nonmonopoly firms, less skilled workers, and peripheral countries in the Global South. In this regard, the United States has captured far more knowledge rents through intellectual property than any other country (Schwartz 2019), a feature impossible to replicate in peripheral countries of the Global South. The concentration of intellectual monopolies at the world level is hence likely to benefit skilled workers not just in the Global North in general but particularly so in the United States.
A growing branch of the mainstream literature also acknowledges that monopoly power over innovation can increase income inequality (Autor et al. 2020; Kehrig and Vincent 2021; De Loecker, Eeckhout, and Unger 2020; Barkai 2020; Gutiérrez and Philippon 2017, 2019; Farhi and Gourio 2018; Boldrin and Levine 2010). Işık and Orhangazi (2022), however, caution against conflating intellectual property and innovation. Using data from 118 large publicly listed pharmaceutical firms between 1980 and 2018, Işık and Orhangazi (2022) demonstrate that the accumulation of intellectual property does not necessarily represent innovation. In the case of pharmaceutical companies, patents are more likely to represent not innovation but the protection of monopoly power in the production of drugs.
In a related line of research, Orhangazi (2019) uses firm-level data from companies in the United States and find that sectors with a greater share of intangible assets have lower investment/profit ratios, higher markups, and higher profitability. The increasing role of intangible assets by nonfinancial corporations (brand names, trademarks, patents, and copyrights) has reduced the investment/profit ratio, as intangible assets allow firms to increase market power and profitability without a corresponding increase in investment. Firm-level evidence shows that profits in intangible-intensive sectors increased faster than in other sectors, but without an equivalent increase in investment. The finding suggests that the rising share of intangible assets might explain slower growth rates, even though more research is needed to ascertain that the results are not biased by reserve causality (from lower investment in tangible assets to greater profits over intangible assets). Davis and Orhangazi (2021) use industry-level and firm-level data from the Unites States and find that industrial concentration is greater in the information services sector. Among firms in high-concentration industries, information services show above-average markups. Information-services firms have high levels of concentration, high profit rates, high markups, and low rates of investment. For these firms, high concentration is indicative of low competition and monopoly profits. In low- and mid-concentration industries, firms with small market shares may still have market power through intangible assets that allow them to increase markups and profitability.
The empirical literature on the determinants of income distribution is vast, but only recently has it incorporated the role of monopoly power from intellectual property. In the most recent studies, the focus has been on the effects of globalization and international trade (Gutiérrez and Piton 2019; Rodrik 1998), offshoring and international outsourcing (Coveri and Pianta 2022; Guschanski and Onaran 2017; Elsby, Hobijn, and Şahin 2013), automation and skill-biased technical change (Karabarbounis and Neiman 2014; Autor and Salomons 2018; Acemoglu and Restrepo 2018; Bassanini and Manfredi 2014; International Monetary Fund. Research Dept. 2017), weakening of workers’ bargaining power and antiworker policies (Stansbury and Summers 2020; Bivens, Mishel, and Schmitt 2018; Onaran 2011; Rodrik 1998; Abdih and Danninger 2017; Lewis, Peng, and Ryner 2018), decline in union density (Farber et al. 2021; Krueger 2018; Kristal 2010; Jaumotte and Osorio Buitron 2015), integration of China and India into global labor markets (Acemoglu 1998, 2003), financial globalization (Kohler, Guschanski, and Stockhammer 2019; Stockhammer 2017), monopsony power in labor markets (Benmelech, Bergman, and Kim 2020), declining real value of minimum wages (Piketty 2014), greater payments to top executives (Bakija, Cole, and Heim 2012), unemployment duration (Shaikh 2016; Meloni and Stirati 2020), workplace fissuring through subcontracting, franchising, and the gig economy (Weil 2014; Dube and Kaplan 2010), household debt (Gouzoulis 2020; Karwowski, Shabani, and Stockhammer 2019; Dunhaupt 2017), greater participation of women in the workforce (Seguino and Braunstein 2019; Onaran, Oyvat, and Fotopoulou 2022), and the declining share of manufacturing in total employment (Felipe, Mehta, and Rhee 2019).
The choice of dependent variables, controls, and instruments in this article reflects these recent developments in the empirical literature. But a few explanations are necessary. Following the recent literature on intellectual monopoly, the regressor of interest in this article is the accumulation of intellectual property. The article measures the accumulation of intellectual property using the share of intellectual property products in the capital stock (nonresidential fixed assets at replacement cost and net of depreciation) from the US Bureau of Economic Analysis (BEA). Table 1 shows the classification of intellectual property products in both private and public fixed assets in the United States according to the BEA methodology. The BEA data, however, does not capture intangible assets in general, or informal types of intellectual property like trade secrets or embodied knowledge not covered by patents and copyrights. Despite these omissions, the BEA data are still the best proxy for the accumulation of intellectual property at the aggregate level over 1948–2021.
BEA Classification of Intellectual Property Products in the Fixed Assets of the United States.
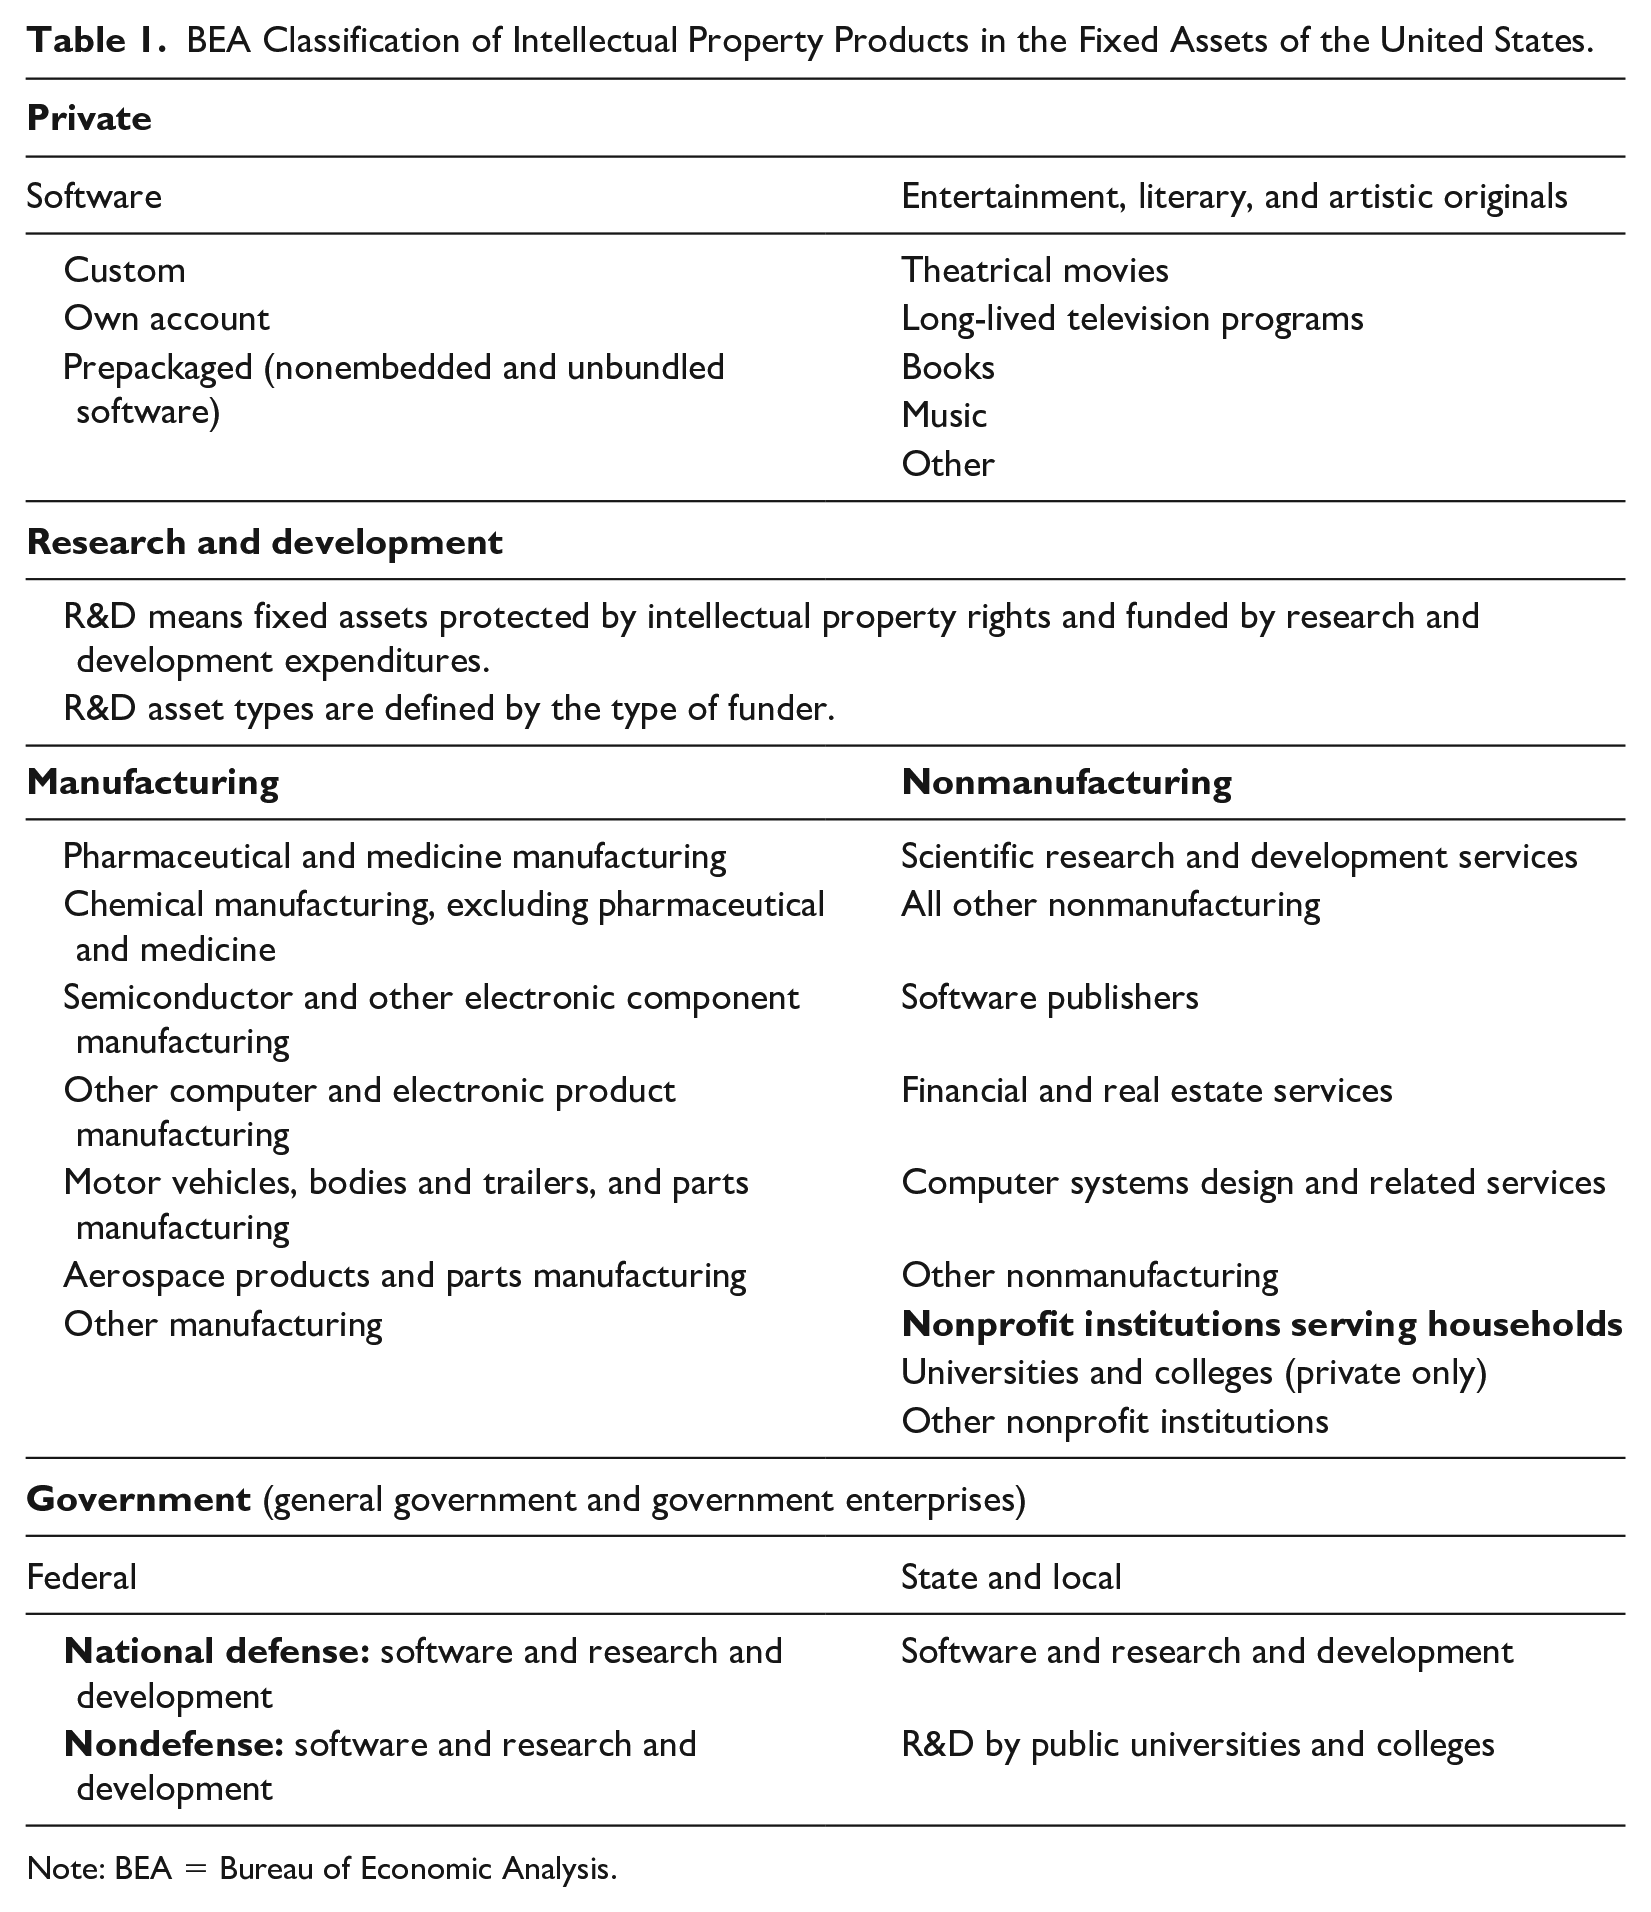
Note: BEA = Bureau of Economic Analysis.
As the regressor of interest, the share of intellectual property products in the stock of fixed assets has two main advantages. First, as emphasized in the intellectual monopoly literature, this variable measures the persistent and cumulative nature of intellectual monopoly at the aggregate level. Second, this measure avoids the main caveats of the Ginarte-Park index, which does not quantify if intellectual property rights are enforced in practice. Instead of quantifying the strength and scope of intellectual property law, as is the case in the Ginarte-Park index, the share of intellectual property products in the capital stock quantifies the accumulation of proprietary knowledge. The Ginarte-Park index is also limited by its unavailability before the 1970s and by its low variance over time. The main purpose of the Ginarte-Park approach is to create an index of intellectual property rights for comparisons between countries. The cross-sectional nature of the Ginarte-Park index and its low variance over time within countries render it unsuitable for a time series analysis over longer periods.
Furthermore, the choice of dependent variables reflects the fact that technological progress and intellectual property might not affect income groups in the same way. For this reason, dependent variables measure income distribution across different professional groups and different sources of labor and capital income. Dependent variables include the wage shares of gross domestic income (GDI) with and without wage supplements (pension contributions from employers); the bottom 50 percent share of pre-tax national income; the top 10 and top 1 percent shares of pre-tax national income; the top 25 to bottom 75 percent income ratio; the Palma ratio, or the top 10 to the bottom 40 percent income ratio; and the Gini coefficient for the entire adult population. The Palma ratio focuses on the income redistribution between the rich (top 10 percent) and poor (bottom 40 percent), given that the income share of the middle 50 percent (the 40–90 percent bracket) has been constant at around 50 percent of national income in most countries. According to Palma (2011, 2014), the bottom 40 and top 10 percent are the income shares “up for grabs.”
Following recent findings in the empirical literature listed above, the article adds controls and instruments for worker power, technology, labor market competition, and international trade. Control variables represent direct effects, while instrumental variables represent indirect effects from predetermined factors. Control variables include the capital/labor ratio (real nonresidential net capital stock per person employed) as a proxy for technical change; unemployment duration, as a proxy for job insecurity; union density, as a proxy for bargaining power in the labor market; female workforce participation rate, to control for the incorporation of women into the workforce; and current account openness relative to GDP, to control for exposure to foreign markets. Current account openness comprises the exposure to global trade in goods and services as well as factor payments (profits, salaries, wages, and taxes) across borders. Instrumental variables include predetermined (lagged) values of all regressors, plus five additional predetermined (lagged) variables: the share of manufacturing in total employment; share of Chinese exports in total world exports; US terms of trade; the real value of the federal minimum wage; and the number of strikes per year involving 1,000 persons or more.
The empirical literature often controls for technological change using both the capital/labor ratio and the share of ICT capital. ICT capital comprises information technology and communications equipment such as computers and related hardware, plus software (prepackaged, customized, and developed in-house) used in production. ICT capital is problematic because, according to this measure, Ireland would be more technologically advanced than the United States. Ireland’s role as tax haven for big tech companies artificially inflates its index of ICT capital. Furthermore, the regression models in this paper already control for the capital/labor ratio, and also include the share of intellectual property products as the regressor of interest, which make the inclusion of ICT capital redundant and a source of multicollinearity, increasing standard errors unnecessarily. The introduction of ICT capital would make no sense econometrically, since it would be impossible to change the level of ICT capital while holding constant the capital/labor ratio and the intellectual property share of the capital stock.
Regarding international trade, the empirical literature shows that current account openness has had both positive and negative effects on American workers. International exposure has increased labor productivity and the competitiveness of American companies, but at the price of exposing American workers to cross-border capital mobility and international competition in labor markets. Nonetheless, current account openness has increased real wages by lowering domestic inflation. This was achieved through substantial imports of cheaper final goods and intermediate inputs from developing countries, especially from Asia. It is therefore an empirical matter whether the reduction in worker power due to current account openness has been greater or smaller than the reduction in inflation. In this regard, the estimates in this article reveal a negative net effect of greater current account openness on the aggregate wage share and the bottom 50 percent income share. Greater current account openness also increased the top 10 percent income share and worsened income inequality by raising the top 25 to bottom 75 percent ratio, the Palma ratio, and the Gini coefficient. Long-run estimates therefore indicate that the loss of income due to weaker bargaining power was greater than the reduction in inflation through cheaper imports into the United States.
On the role of finance, some of the recent empirical studies on labor shares include additional controls for financial variables such as capital account openness, household debt, and the share of finance in GDP. The empirical models in this article include the effects of financial factors both through the control variables and, indirectly, through the instrumental variables. Capital account openness is controlled for via the current account openness, which includes cross-border factor payments. Capital account and current account openness are highly correlated. Furthermore, as shown in Rotta and Kumar (2024) and in Auvray and Rabinovich (2019), financialization is the mirror image of deindustrialization. Deindustrialization occurred via a massive relocation of productive capital from the United States and Europe to Japan, South Korea, and China. As a consequence of this global relocation of productive activities toward Asia, unproductive activities like finance, trade, and real estate began to dominate the economies of the United States and Europe. The econometric models in this article include this financialization (or deindustrialization) mechanism by adding, as instrumental variables, the decline in the manufacturing share of employment and the rise in the share of China in world exports. Deindustrialization, moreover, is also reflected in the decline in union density, which is a control variable in all models.
Greater female participation in the workforce, in turn, has followed the disruption of conventional family structures and the need to complement household income following the gradual demise of manufacturing industries in the United States. The empirical literature indicates that the continuous decline in the share of manufacturing employment is one of the main causes of the continuous decline in union density in the United States. The article accounts for this chain of causation by instrumenting female labor force participation and union density with the fall in the share of manufacturing employment. The additional pressure on workers from international competition is then controlled for by the degree of current account openness and by the rise of China in world exports as one of the instrumental variables. In this regard, unlike panel models at the firm and industry levels, the aggregate estimates in this article include macroeconomic spillover effects, as is the case between union and nonunion workers who both benefit from higher union density.
In addition to greater openness of the economy to international trade, the model specification in this article includes the terms of trade as one of the overidentifying instruments. The terms of trade in the United States fell 33 percent from 1971 to 1980, and this substantial drop reflects three main structural changes in the economy: (1) Nixon’s decision to break up the Bretton Woods system of fixed exchange rates and the gold peg of the American dollar; (2) the rapid devaluation of the dollar once Nixon removed the peg at 35 dollars per ounce of gold; and (3) the oil shocks in 1973 and 1979. Only in 2009 did the US terms of trade begin to recover, albeit at a much lower level relative to the 1960s.
According to Varoufakis (2011), the large trade deficits of the United States and the drop in the terms of trade in the 1970s onward created two effects: an increase in the share of financial activities in GDP and an increase in the wages and bonuses of the top 10 percent employed in finance. Varoufakis (2011) claims that the increasing trade deficits of the US economy since the 1970s generated aggregate demand for other countries, but which required the United States to finance its large net imports through a growing net export of dollars. With large trade deficits financed by a large creation of dollars at American banks, the central role of bankers and traders in the post-1970s regime paved the way to big bonuses for skilled workers in finance. In this way, current account openness and the sharp fall in the US terms of trade contributed to raise the top 10 percent income share even further. Using firm-level data from the US Economic Census, Autor et al. (2020) report that finance stands out as the only sector where there is a clear upward trend in its wage share, because of the higher salaries and bonuses in the sector. Hence, a larger size of finance relative to GDP implies, ceteris paribus, a positive effect on the income share of the top 10 percent. Nonetheless, the underlying cause of these large trade deficits and exports of dollars from American banks to the world economy is the deindustrialization of the US economy and the global relocation of manufacturing to Asia. But instead of accounting for this indirect causal relation via the inclusion of the share of finance in GDP as an additional regressor, the econometric models in this article include the share of manufacturing employment, the terms of trade, and the rise of China in world exports as overidentifying instrumental variables.
3. Estimation Methodology
Table 2 describes the annual time series used in the econometric analysis. The previous section explains the choice of variables. There are eight dependent variables, six regressors, six identifying instruments, and five overidentifying instruments. The instruments should ideally be exogenous variables, but at the macroeconomic level it is difficult to find strictly exogenous instruments. For this reason, the article uses a second-best strategy and employs predetermined lagged values as instruments in order to reduce (even though not eliminate) the endogeneity bias in the estimators. Identifying instruments are lagged values of the regressors, and overidentifying instruments are lagged values of the extra variables listed at the bottom of the table. Table A.1 in the appendix details the data sources of each variable.
Description of Variables for the United States (1948–2021).
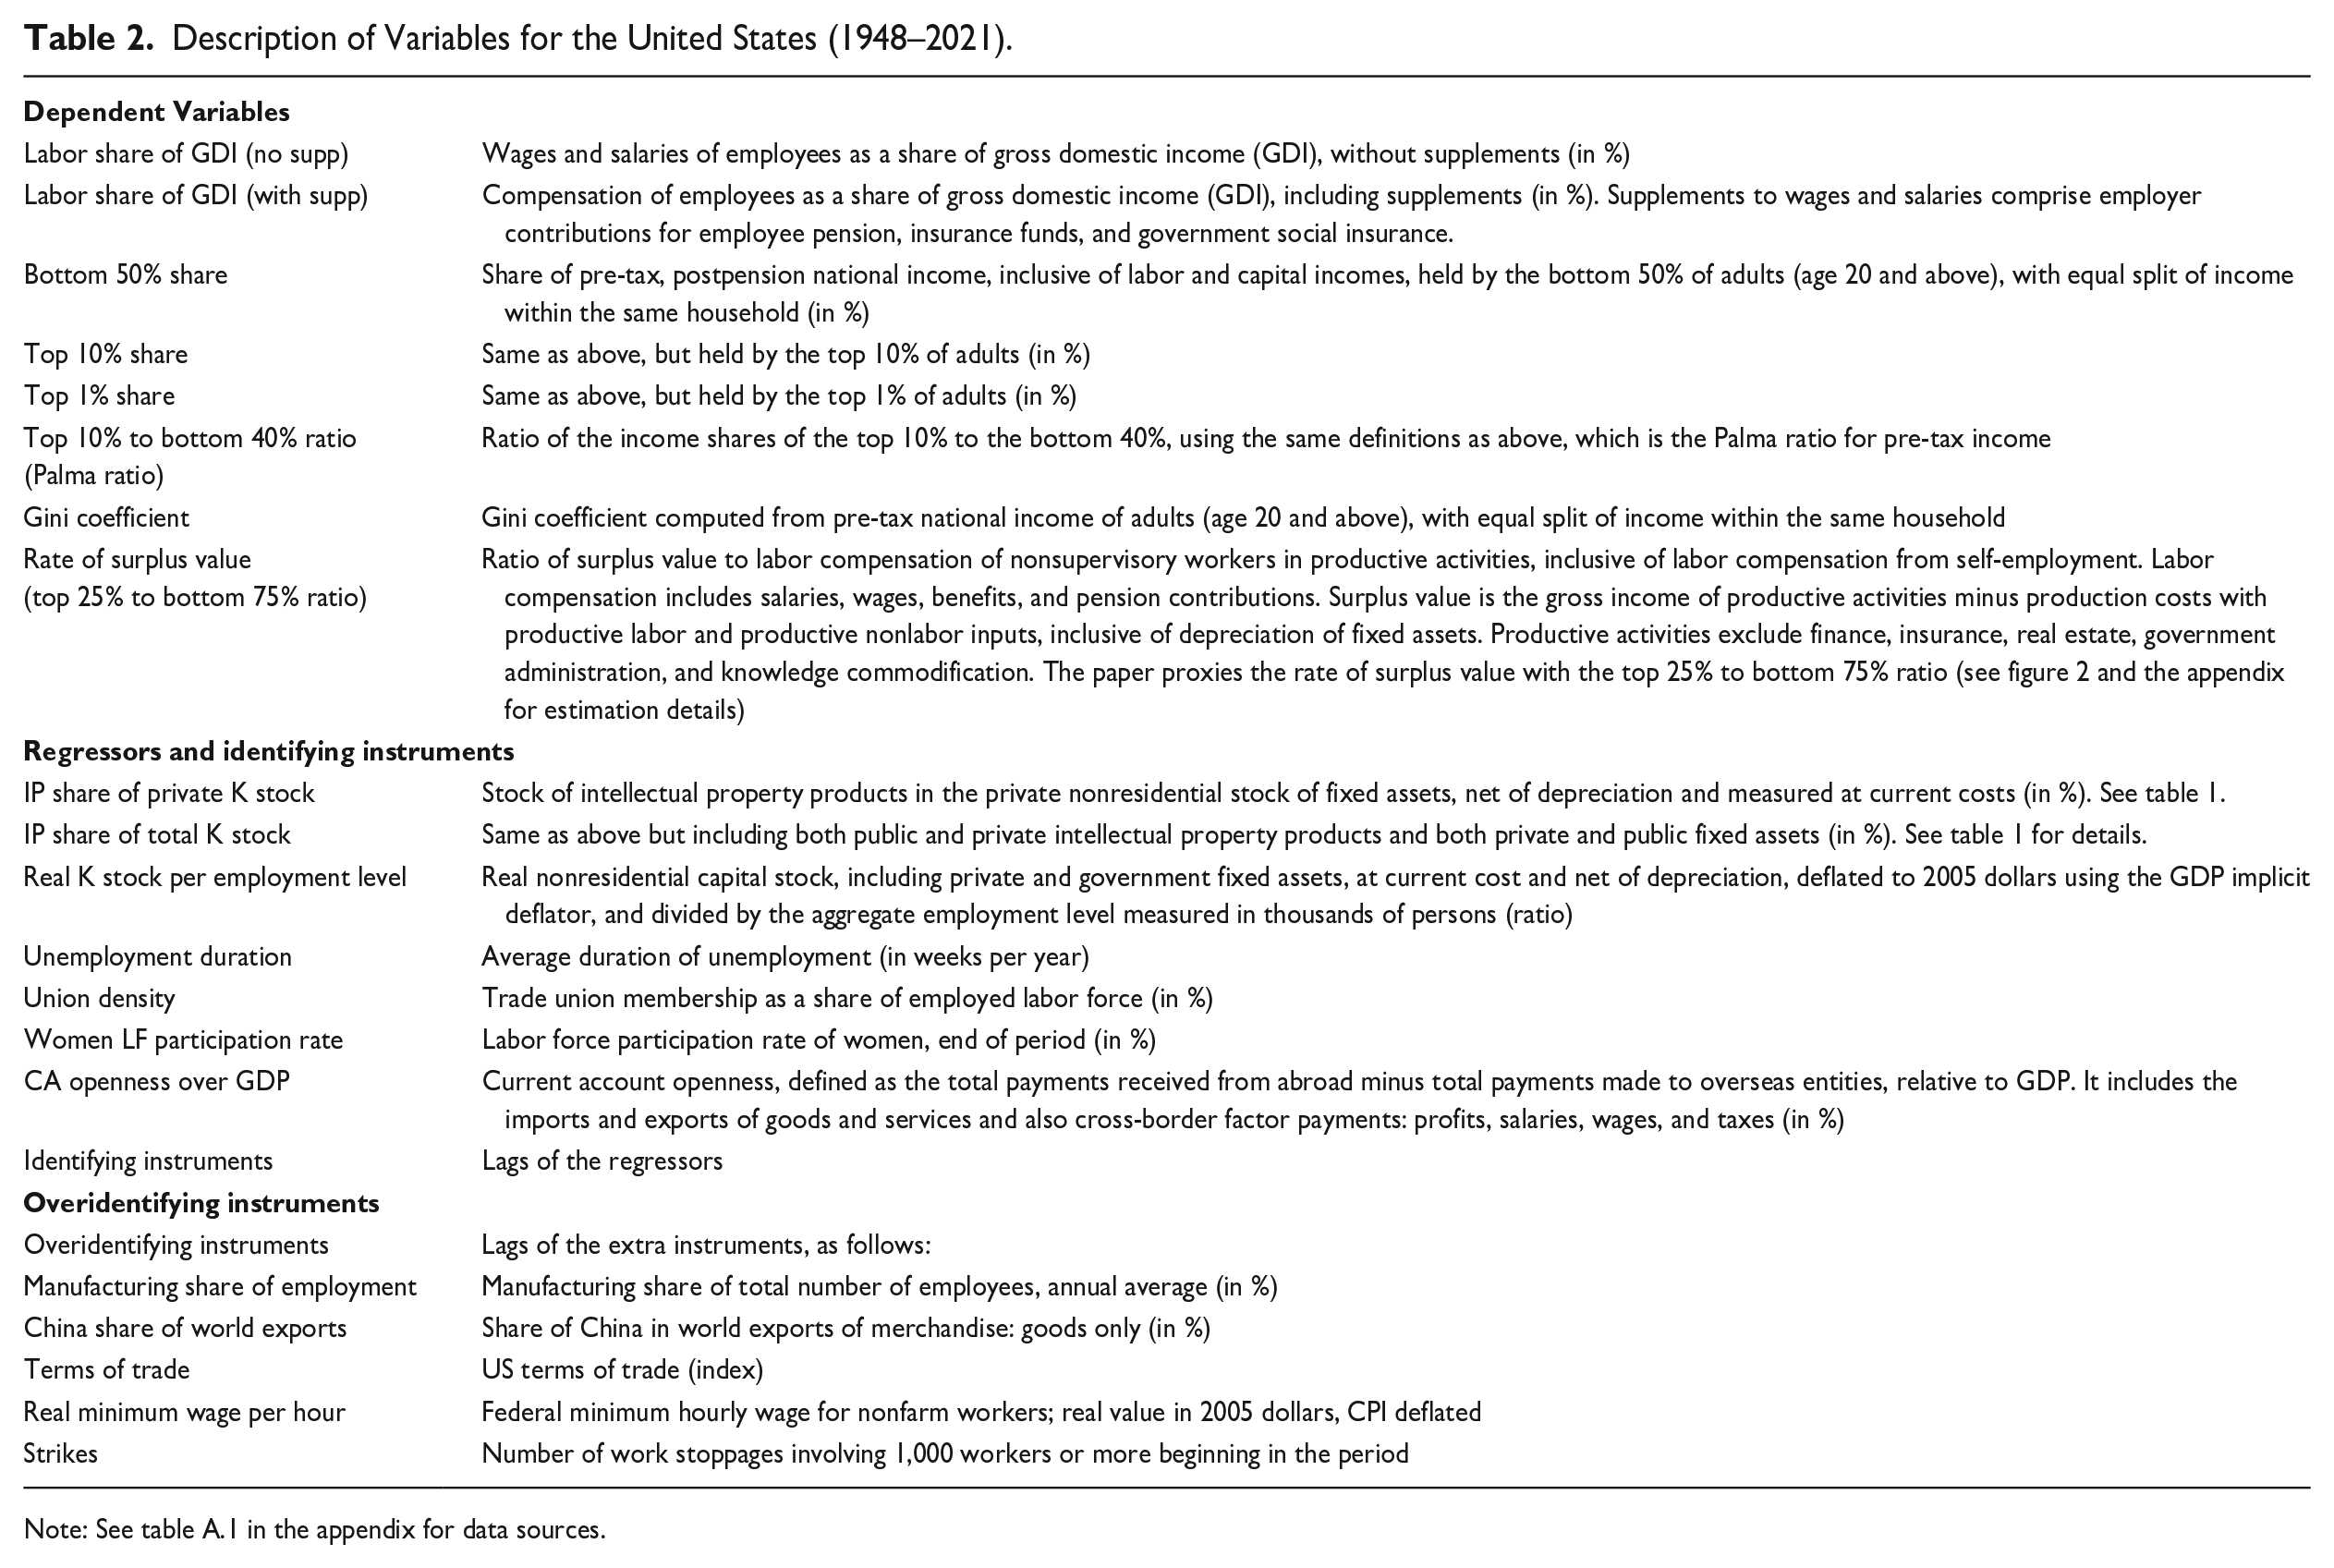
Note: See table A.1 in the appendix for data sources.
Identifying and overidentifying instruments allow for the implementation of the iterative generalized method of moments (iGMM) estimator. Overidentifying instruments also allow for the computation of the J-test, whose null hypothesis is that the moment conditions in the model specification hold true in the sample.
Figure 1 plots different measures of wage and income shares in the United States from 1947 to 2021, as index numbers with base year 1970 = 100. The measures include wage shares of gross domestic income (GDI) including and excluding wage supplements (pension contributions from employers); the bottom 40, 50, 75, 90, and 99 percent shares of national income (NI), all inclusive of labor and capital incomes; the inverse Gini coefficient for the adult population using incomes equally split within households; and the paid share of the average working day of nonsupervisory and self-employed workers in productive activities. National income is GDP minus fixed capital depreciation (which is not an income to anyone) plus net foreign income (which is the fraction of domestic output transferred to foreign capital owners). Depreciation of fixed capital and foreign outflows thus reduce the GDP distributed as income to residents.
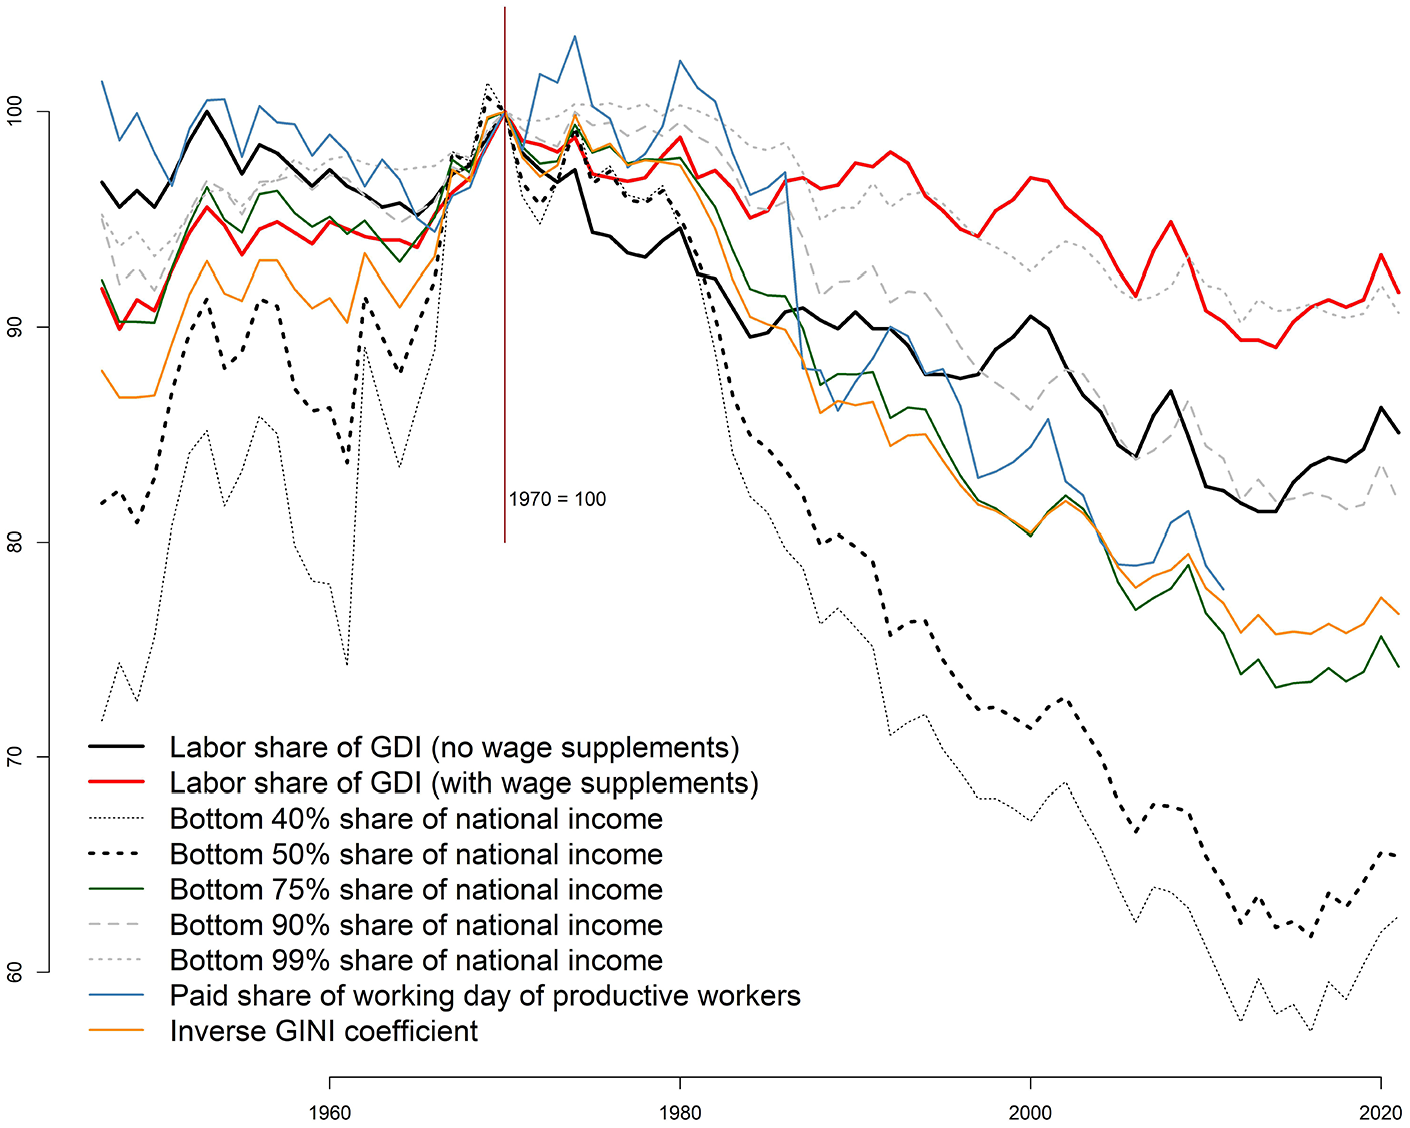
Labor shares and income shares in the United States (1947–2021; indices 1970 = 100).
Shares of national income are drawn from the new World Inequality Database (WID) based on the most recent version of the Distributional National Accounts, which supersedes the former World Top Incomes Database (WTID). The unit of observation in the deprecated WTID was the tax filer. In the newer WID series, in contrast, the unit of observation is the equal split adult, according to which national income is distributed to resident adults (age 20 and older) and distributed equally within couples or households (WID 2024: 19–24). The newer WID series also use the GDP deflator instead of the CPI as the preferred price index. The estimates from the World Input-Output Database employed in this article therefore overcome Rose’s (2018) criticisms against the use of tax filers as the unit of observation and against the use of the CPI as the price index, which was indeed the case in the former WTID. Rose (2018) argues, however, that post-tax national income is a preferred measure of living standards, especially for low-income individuals. The WID uses pre-tax national income, which is the sum of capital and labor income before considering the tax/transfer system, but after taking into account the pension system. Pre-tax estimates are the preferred estimate of inequality in this article because the focus is not on living standards but on the market allocation of income before the intervention of nonmarket forces.
The series in figure 1 all trend downward in the post-1970 period but two measures stand out in particular: the bottom 40 and bottom 50 percent of national income, which have the greatest variances and the steepest declines among all series. Because conventional wage shares include the compensation of highly skilled workers in activities such as finance and software engineering, they substantially underestimate the decline in the income shares of nonsupervisory workers as well as medium- and low-skilled workers in the bottom income brackets.
Figure 2 plots the ratio of the top 25 to the bottom 75 percent shares of national income, together with the rate of surplus value (on the left panel). Figure 2 additionally plots the paid share of the average working day of productive workers (nonsupervisory and self-employed workers in productive activities), together with the bottom 75 percent share of national income (on the right panel). The rate of surplus value is the rate of exploitation (ratio of unpaid to paid labor time) of nonsupervisory workers in productive activities, inclusive of self-employment, net of government wages and net of fixed asset depreciation. Productive activities exclude finance, insurance, real estate, government administration, and knowledge commodification. If
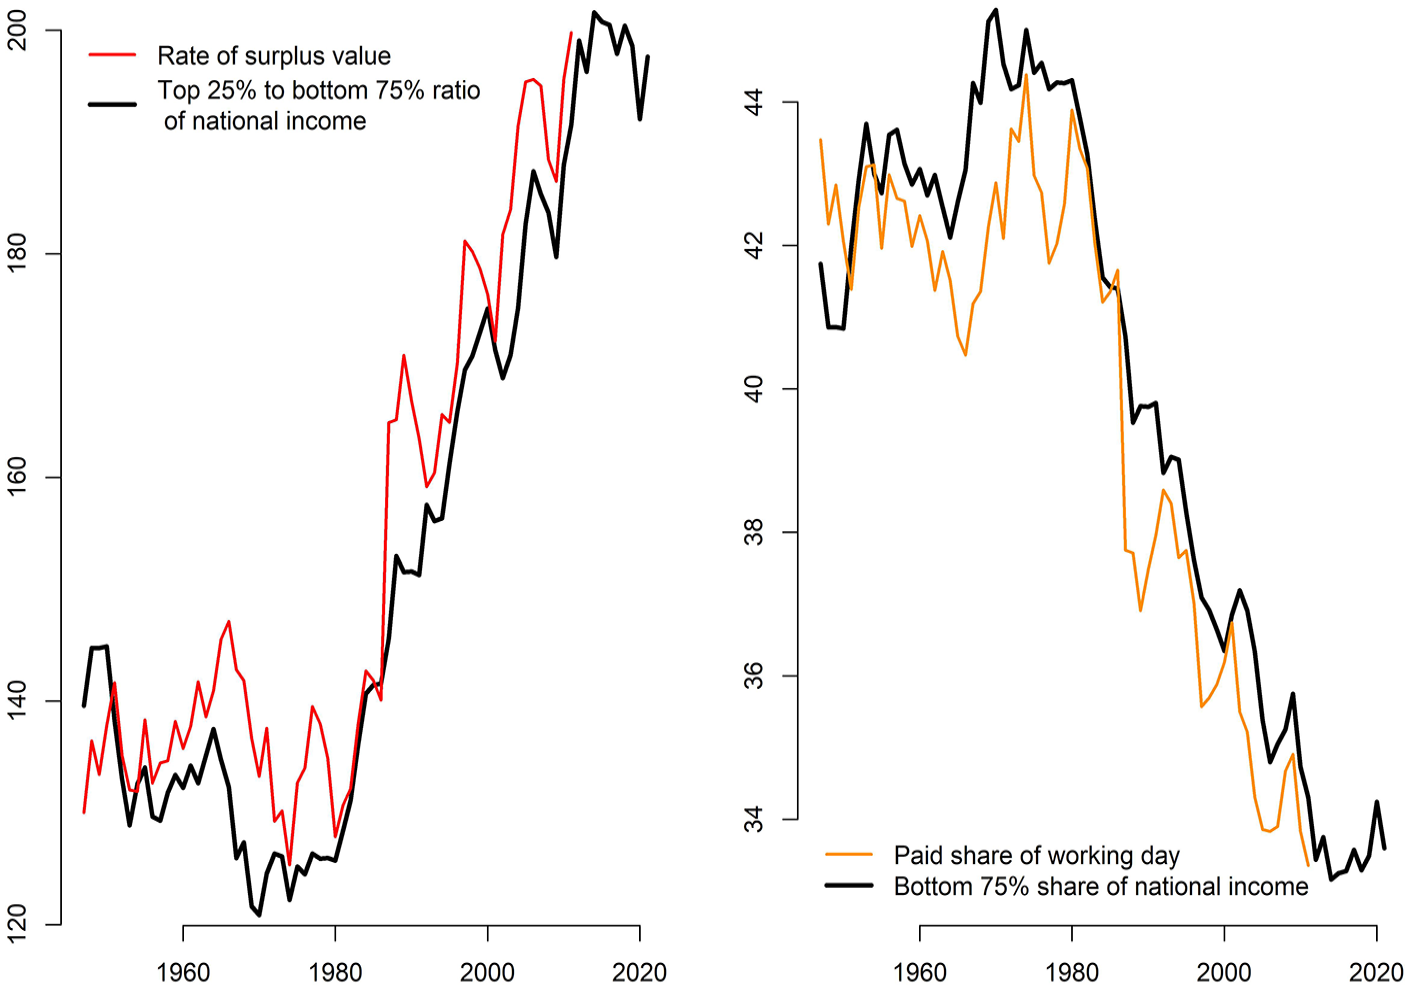
Left panel: Rate of surplus value (1947–2011) and the top 25% to bottom 75% income share ratio (1947–2021) in the United States. Right panel: Paid share of working day (1947–2011) and the bottom 75% income share (1947–2021).
The article estimates the rate of surplus value from modified benchmark input-output matrices with data at the activity level on more than 400 industries. The modified input-output matrices classify each industry into its primary and secondary sources of revenue, and the secondary sources of revenue are then regrouped with their matching primary activity. This modification allows for value creation to be estimated more precisely at the activity level. The appendix explains the data sources and estimation approach for the rate of surplus value in the United States in more detail.
Even though the rate of surplus value is difficult to estimate, the left panel of figure 2 demonstrates that it can be well approximated by the ratio of the top 25 to the bottom 75 percent shares of national income, which is much easier to obtain. The right panel of figure 2 demonstrates that the paid share of the average working day of nonsupervisory and self-employed workers in productive activities can be well approximated by the bottom 75 percent income share, which is also much easier to obtain. There are no secondary axes in either panel of figure 2, and the series are plotted on the exact same scale with no additional transformations.
Figure 3 plots the levels and the long-run trends of the regressors and instrumental variables described in table 2. Variables that represent the bargaining power of workers have a downward trend, and the variables that represent competition both in the job market and in world trade have an upward trend. Even more, the trends become steeper after 1980, in line with the literature that refers to 1980 as the watershed between the regulated and the neoliberal regimes of American capitalism (Shaikh 2016; Piketty 2014; Kotz 2017).
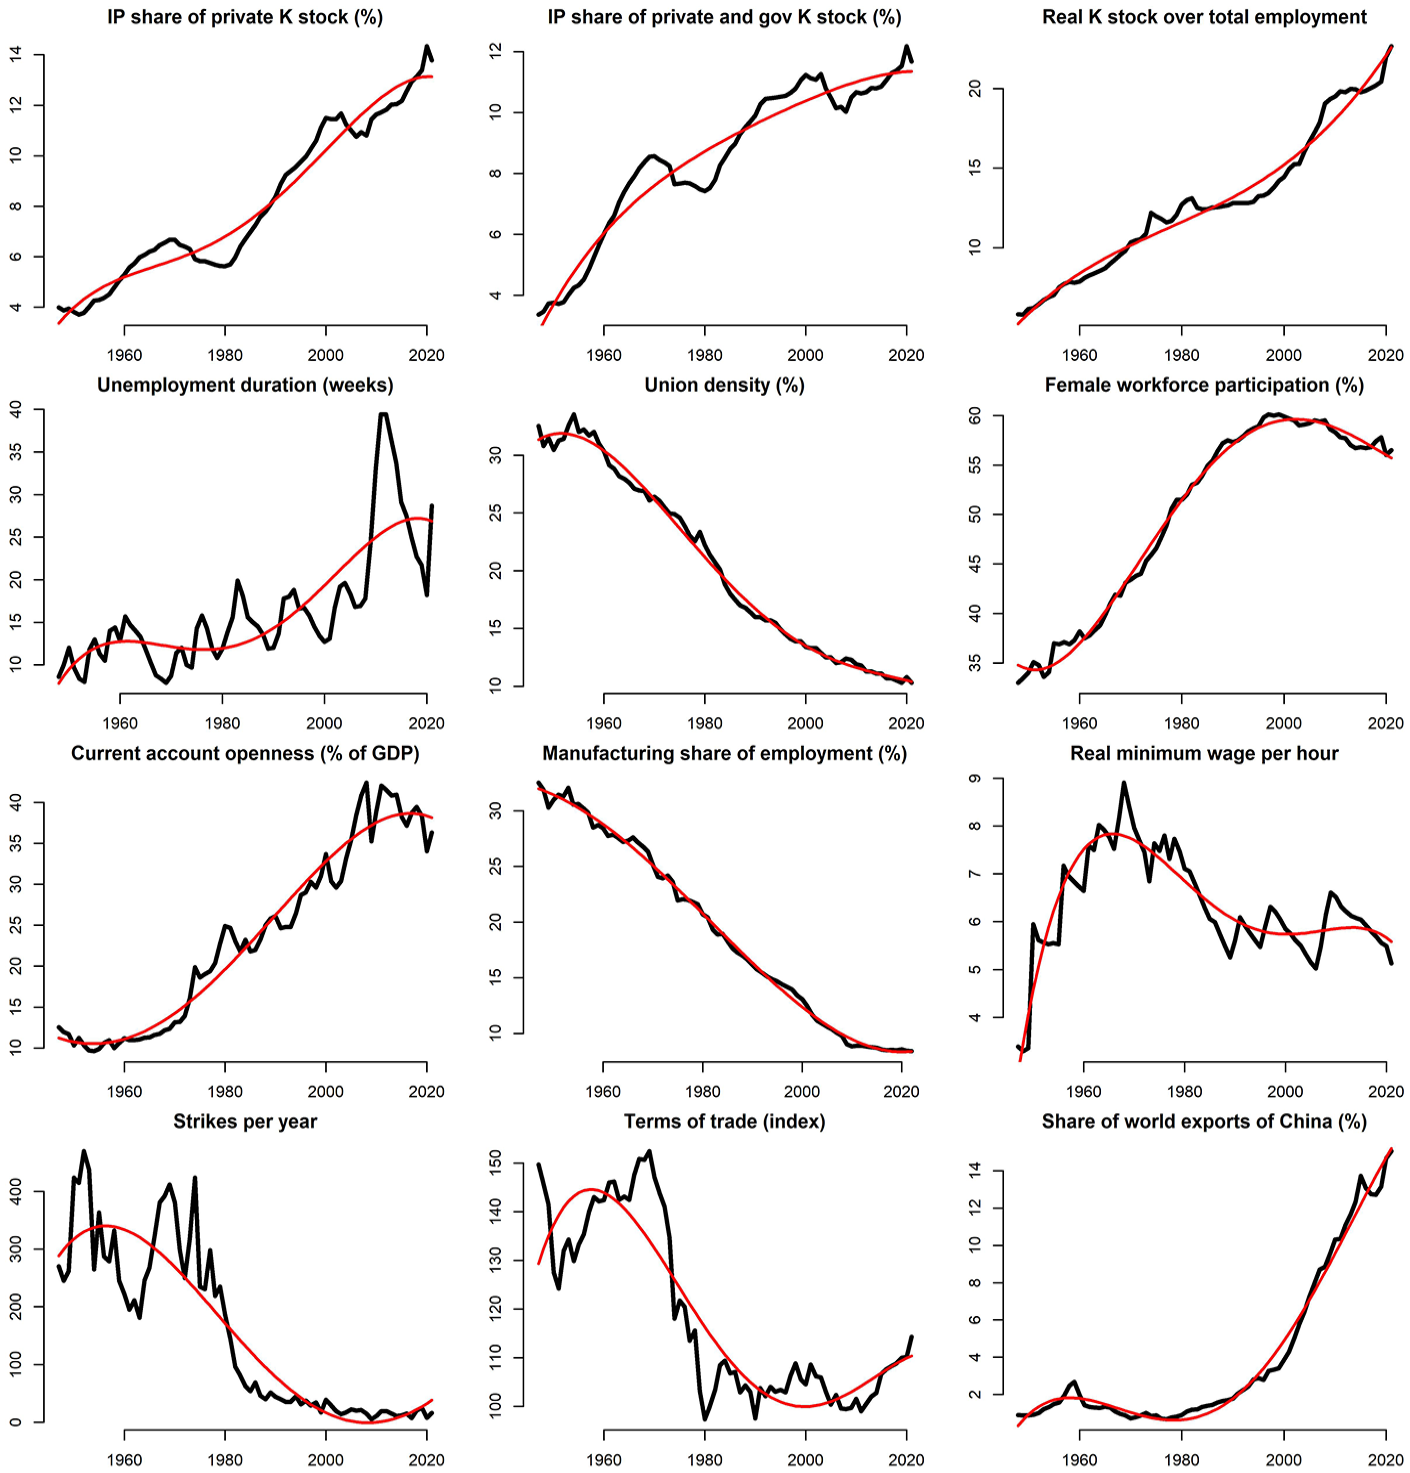
Regressors and instrumental variables for the United States (1947–2021).
The econometric analysis comprises the following steps. The article estimates 16 regressions in total. In the first eight models, the regressor of interest is the share of intellectual property products in the private capital stock. In the last eight models, the regressor of interest is adjusted to include both the private and government capital stocks, and both the private and government stocks of intellectual property products. Table 1 in the previous section shows the BEA classification of private and public intellectual property in the stock of fixed assets in the United States.
The empirical models employ the eight dependent variables, six regressors, and eleven instrumental variables as described in table 2. The motivation for the model specifications is explained in the previous section. A nonlinear fourth-degree polynomial time trend is included both in the main regression equation and in the set of instruments to remove the time trends from all variables. This procedure makes the dependent and independent variables stationary, as well as the instruments, while also removing unit roots from the time series. Section A.4 in the appendix provides further details on the detrending technique. Model specifications are in log-log form and thus the coefficient estimates are the long-run elasticities of each regressor (the percentage change in the dependent variable given a 1 percent rise in the regressor).
Robust standard errors employ heteroskedasticity and autocorrelation-consistent (HAC) variance-covariance matrices for all models. The iterative GMM (iGMM) estimator uses a maximum of 200 iterations. The kernel estimator for the HAC variance-covariance estimator is the Quadratic Spectral (QS), and the automatic bandwidth estimator is from Andrews (1991). The two main advantages of GMM are that (1) GMM does not assume normally distributed errors and (2) the efficient GMM estimator employs an optimal weighting matrix equal to the inverse of the asymptotic variance-covariance matrix (Hayashi 2000). The main caveat, however, is that the GMM estimator might not be consistent in small samples.
Table A.2 in the appendix reports five-unit root tests on the levels and first differences of the variables listed in table 2, with no prior detrending. Table A.3 in the appendix runs the same unit root tests on the detrended components and on the first differences of the detrended components of the variables. The five-unit root tests are the Augmented Dickey-Fuller (ADF), Philips-Perron (PP), Kwiatkowski-Phillips-Schmidt-Shin (KPSS), the Elliott-Rothenberg-Stock (ERS) feasible point optimal test, and the Dickey-Fuller generalized least squares (DF-GLS) test. These tests indicate that unit roots are present in the levels of most variables but that detrended variables are stationary.
For each estimation, the next section reports the J test statistic and its p value, whose null hypothesis is that the sample moment conditions hold true, meaning that the sample moment conditions are indeed equal to zero as assumed in the population moment conditions. The implementation of the J test requires overidentifying instruments. P values of the J test lower than 10 percent indicate that the sample moment conditions do not hold and, hence, that the regression model is not correctly specified. P values of the J test closer to unity indicate that the null hypothesis (that the sample moment conditions hold true) cannot be rejected. The J test is a better overidentification test than the conventional Sargan test for two reasons. First, the J test is robust to heteroskedasticity while the Sargan test is not. Second, the J test uses efficient GMM while the conventional Sargan test does not (Hall 2005; Chaussé 2010).
4. Econometric Estimations and Main Results
Tables 3 and 4 summarize the econometric results. Specifications are in log-log form and the coefficient estimates are the long-run elasticities. In table 3, the regressor of interest is the share of intellectual property products in the private stock of fixed assets. Proprietary knowledge accumulation has a positive effect on the aggregate wage share without supplements (the long-run elasticity is 0.1, significant at the 1 percent level), which means that American companies transferred to wages a significant portion of their knowledge rents stemming from proprietary knowledge assets. This transfer was mostly from profit to wages but not to pensions. The effect is statistically insignificant on the wage share once pension contributions are factored in.
Regression Models for the United States (1948–2021).
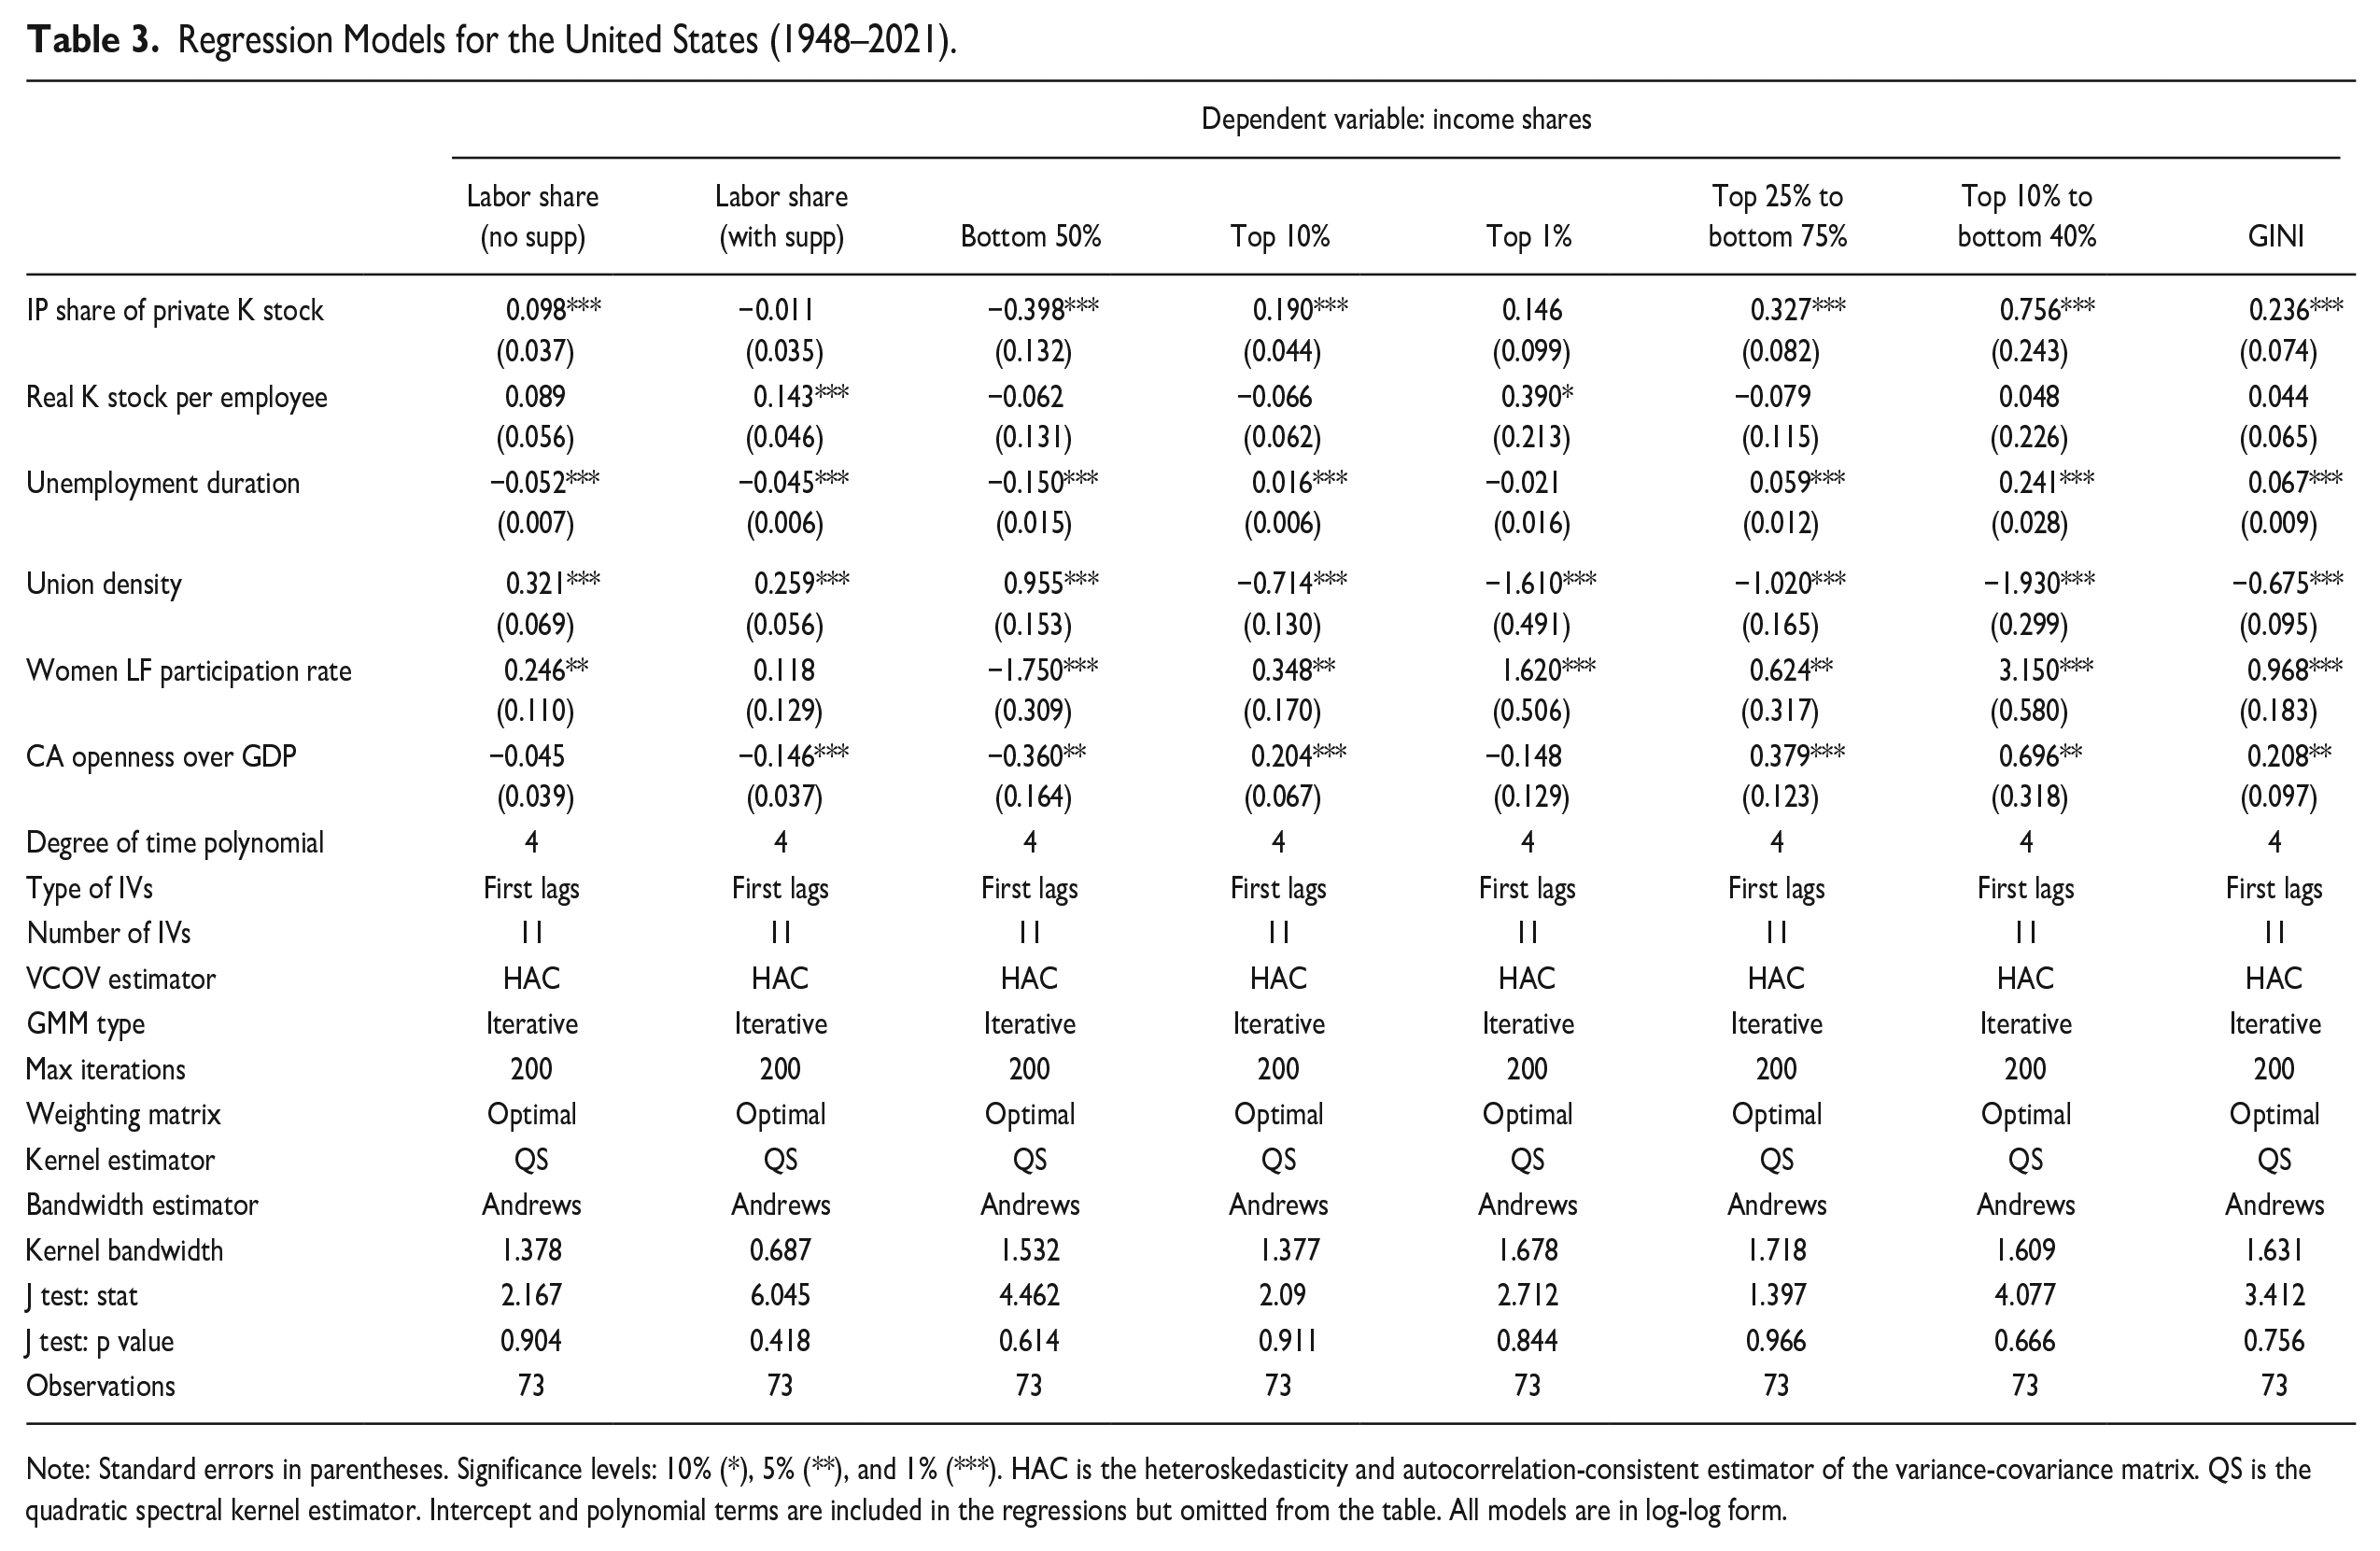
Note: Standard errors in parentheses. Significance levels: 10% (*), 5% (**), and 1% (***). HAC is the heteroskedasticity and autocorrelation-consistent estimator of the variance-covariance matrix. QS is the quadratic spectral kernel estimator. Intercept and polynomial terms are included in the regressions but omitted from the table. All models are in log-log form.
Regression Models for the United States (1948–2021).
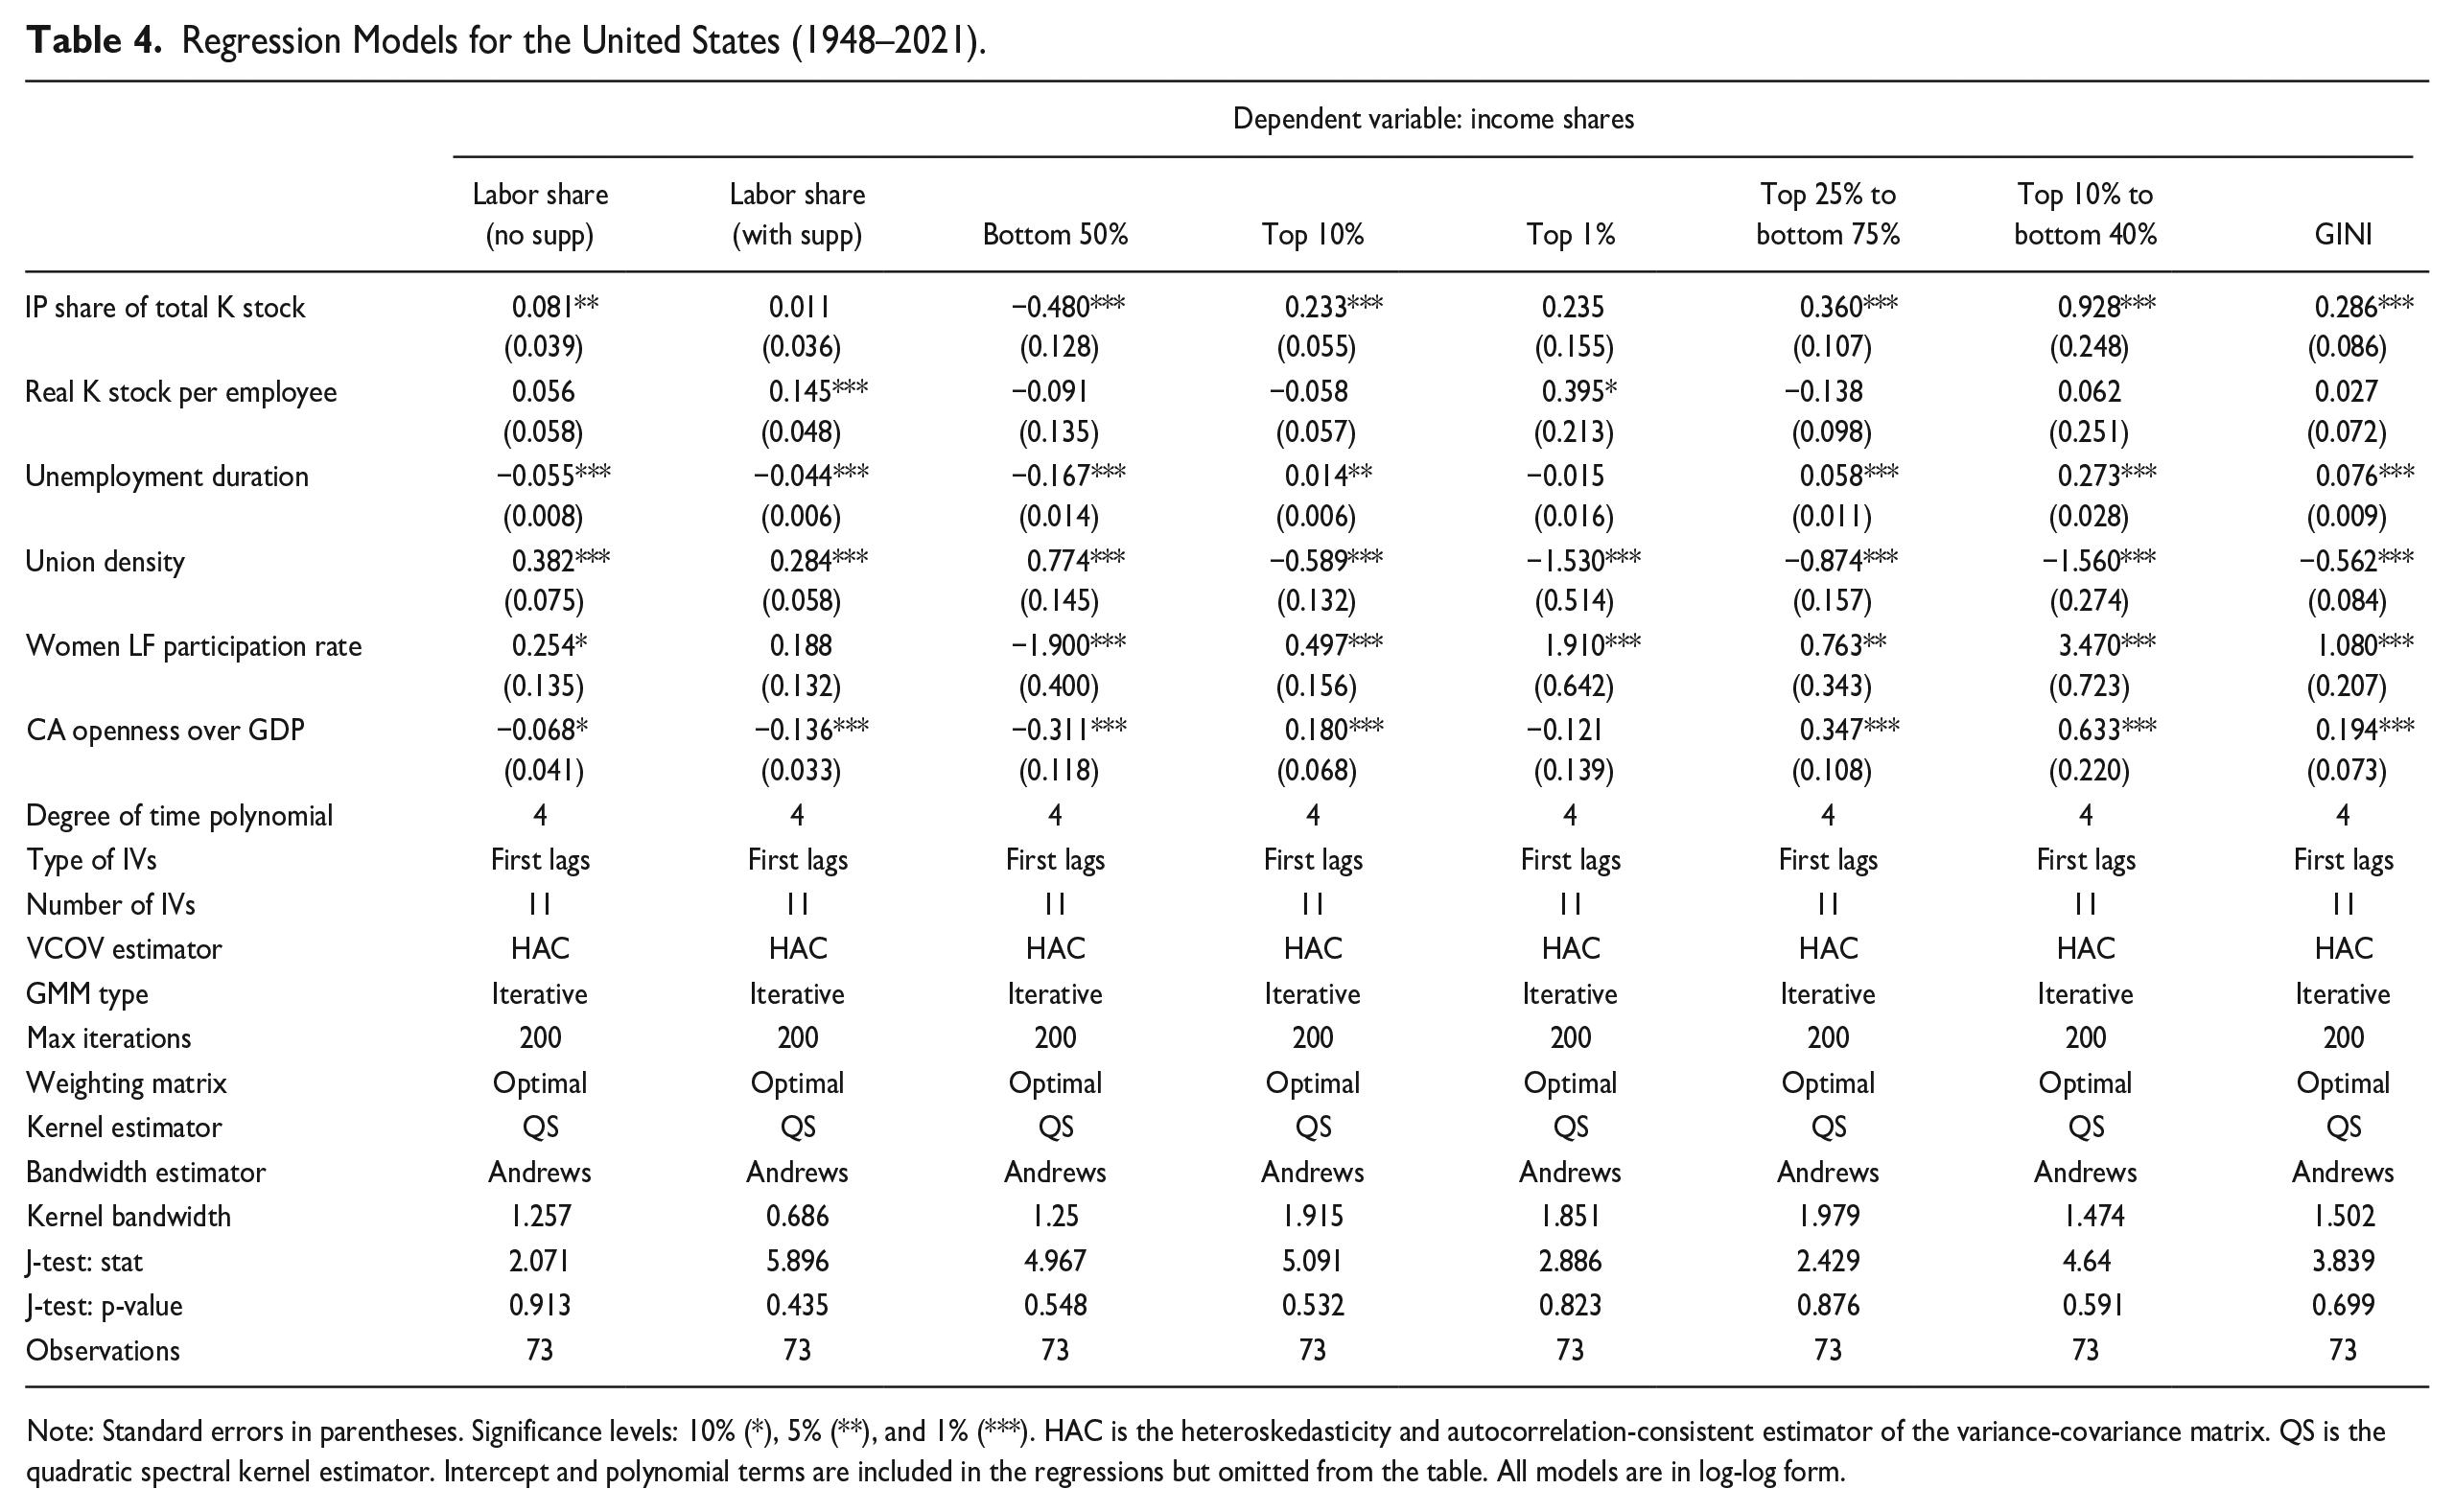
Note: Standard errors in parentheses. Significance levels: 10% (*), 5% (**), and 1% (***). HAC is the heteroskedasticity and autocorrelation-consistent estimator of the variance-covariance matrix. QS is the quadratic spectral kernel estimator. Intercept and polynomial terms are included in the regressions but omitted from the table. All models are in log-log form.
The effect of knowledge monopolization on the bottom 50 percent income share is negative (the long-run elasticity is −0.4, significant at the 1 percent level) and the effect on the top 10 percent income share is positive (the elasticity is 0.2, significant at the 1 percent level). These estimates imply that every 10 percent increase in the share of proprietary knowledge assets in the private sector contributed to a 1 percent increase in the aggregate wage share. But the increase in the aggregate wage share was very skewed since it implied a 2 percent increase in the income share of the top 10 percent, and a 4 percent reduction in the income share of the bottom 50 percent. The effect on the income share of the top 1 percent is positive (the elasticity is 0.15) but statistically insignificant due to the higher standard error, caused by the small sample size with only 73 observations. The accumulation of proprietary knowledge also worsened income inequality by boosting the top 25 to bottom 75 percent ratio (the elasticity is 0.33, significant at the 1 percent level), the top 10 to bottom 40 percent ratio (the elasticity is 0.76, significant at the 1 percent level), and the Gini coefficient (the elasticity is 0.24, significant at the 1 percent level).
Despite the overall positive contribution to the aggregate wage share, the growing monopolization of knowledge caused a reduction in the income shares of the bottom 40 and bottom 50 percent, while concomitantly boosting the income shares of the top income earners. Knowledge monopolization in the private sector alone can explain 19 percent of the total increase in the income share of the top 10 percent from 1948 to 2021.
Most importantly, these are the net effects of intellectual monopolization. The estimates net out the effects from technical change, unemployment duration, fall in union density, rise in women labor force participation, and current account openness. The estimates additionally include the indirect effects from instrumental variables such as, for example, the decline in American manufacturing employment and the rise of China in world trade. Table 3 shows that J test p values are close to unity and thus that sample moment conditions hold across specifications.
In table 4 the regressor of interest is the share of intellectual property products in the total stock of fixed assets, comprising the monopolized knowledge accumulated in both the private and public sectors. Once knowledge monopolization in the public sector is considered, the total impact of intellectual property on inequality is even stronger. Every 10 percent increase in the share of intellectual property products in the total capital stock causes a 4.8 percent reduction in the bottom 50 percent income share and a 2.3 percent rise in the top 10 percent income share, both significant at the 1 percent level. The top 1 percent income share also rises by 2.3 percent, but the effect is not statistically significant because of the higher standard error and small sample size. The long-run elasticities are also greater for the top 25 to bottom 75 percent ratio, top 10 to bottom 40 percent ratio, and the Gini coefficient. These estimates imply that proprietary knowledge accumulation in the public sector worsened income inequality even further, thus adding to the effects from the private sector. Knowledge monopolization in the private and public sectors combined can explain 23.3 percent of the total increase in the income share of the top 10 percent from 1948 to 2021, after netting out the effects from the control variables. P values from the J test are close to unity, and thus the sample moment conditions hold across specifications.
Instrumental variables also reduce endogeneity bias in the other regressors, so it is worth mentioning their long-run effects in light of the discussion in section 2. In table 3, technical change (real capital stock per person employed) has a positive effect on the wage share with pension contributions (significant at the 1 percent level) and a positive effect on the top 1 percent income share (significant at the 1 percent level). Unemployment duration reduces wage shares both with and without supplements (significant at the 1 percent level), reduces the bottom 50 percent income share (significant at the 1 percent level), and raises the top 10 percent income share (significant at the 1 percent level). Unemployment duration also increases the top 25 to bottom 75 percent ratio, the top 10 to bottom 40 percent ratio, and the Gini coefficient (all significant at the 1 percent level). Union density increases wage shares both with and without supplements, increases the bottom 50 percent income share, reduces the top 10 and top 1 percent income shares, and reduces the top 25 to bottom 75 percent ratio, top 10 to bottom 40 percent ratio, as well as the Gini coefficient. The long-run effects of union density are significant at the 1 percent level across specifications.
Greater female participation in the workforce increased the wage share without supplements (significant at the 5 percent level), reduced the bottom 50 percent income share (significant at the 1 percent level), and increased the top 10 and top 1 percent incomes shares (significant at the 5 percent and 1 percent levels, respectively). Greater female participation in the workforce also boosted inequality by raising the top 25 to bottom 75 percent ratio, the top 10 to bottom 40 percent ratio, and the Gini coefficient (significant at the 5 percent, 1 percent, and 1 percent levels respectively). Current account openness reduced the wage share with supplements (significant at the 1 percent level), reduced the bottom 50 percent (significant at the 5 percent level), increased the top 10 percent income share (significant at the 1 percent level in logs), and increased inequality by raising the top 25 to bottom 75 percent ratio, top 10 to bottom 40 percent ratio, and the Gini coefficient (significant at the 1 percent, 5 percent, and 5 percent levels, respectively). Estimates of the control variables are similar in table 4, and their interpretation follows the arguments developed in section 2.
5. Final Remarks
Estimates for the United States show that intellectual monopoly has worsened income inequality over the long run by benefiting top income earners to the detriment of low-skilled, medium-skilled, and nonsupervisory workers. From 1948 to 2021, American companies transferred a significant share of knowledge rents from their profits to wages. Because of this transfer, the accumulation of proprietary knowledge had a positive contribution to the aggregate wage share in the United States. This positive contribution, however, was uneven and mostly benefited the top 10 percent. The detrimental effects of proprietary knowledge accumulation on inequality are even worse once the monopolization of knowledge in the public sector is considered. Knowledge monopolization in the private sector alone can explain 19 percent of the increase in the top 10 percent income share, or 23 percent of the increase once proprietary knowledge in the public sector is also accounted for. It is likely that these effects would be even stronger had the data included all types of intangible assets.
The knowledge rents derived from the accumulation of intellectual property boosted the top 10 percent income share, but the effect is statistically insignificant for the top 1 percent. This means that intellectual property boosted the incomes of managers and high-skilled labor more than profits and capital incomes, for the significant effect is in the 90–99 percent range of the income distribution. In this regard, the econometric analysis shows that the rise in the income share of the top 1 percent is explained not by knowledge rents but by the demise of unions. The decline in union density and the rise in unemployment duration (both instrumented by the decline in manufacturing employment) increased inequality across all model specifications, demonstrating the crucial role of deindustrialization and the demise of worker power in widening income disparities.
Unions have overall faced challenges in a globalized economy. The relocation of manufacturing jobs to developing countries, the rise of global value chains, antiunion policies, and the divergent interests of workers from different countries and income strata have substantially weakened the power of unions. Besides redistributing the profits from intellectual property, unions also need to modernize their structure to better reflect the role of value chains in a globalized economy. Furthermore, the increased participation of women in the workforce resulted in more inequality overall, with negative effects for the bottom 50 percent (since women are overrepresented in low-pay jobs), and strong positive effects for the top 1 percent. These estimates suggest that the increased competition between genders for low-skilled employment raised the exploitation rate for the bottom 50 percent, and the extra surplus was channeled to the capital income at the top 1 percent.
To avoid worsening inequality even further, policymakers and lawmakers should design a new institutional regime within which the benefits from intellectual property can be more equally shared. Legislation could include shorter copyright and patent terms to allow for quicker entry into the public domain; use-based copyright that demands creators to demonstrate active use; open access mandates for publicly funded research; patent reforms that discourage patent trolling and lawsuits; compulsory licensing for patented technologies or copyrighted works in the public interest and to promote competition; anti-monopoly laws to prevent concentration of intellectual property and reduce monopolistic practices that hinder competition and innovation; maintenance of public domain repositories; exceptions for educational and noncommercial uses of copyrighted materials; and international agreements that balance intellectual property rights protection and equitable access.
The long-run estimates at the aggregate level in this article span a period of seventy-three years and complement the empirical literature that has mostly used panel data sets for the post-1980 period. Three caveats, however, limit the precision and scope of the estimates in this study. First, instrumental variables reduce but do not eliminate endogeneity bias at the aggregate level. Second, a small sample of seventy-three years is not ideal for the asymptotic properties of the GMM estimator. Third, the econometric estimates at the aggregate level include intersectoral spillover effects but overlook heterogeneity across sectors. The estimation of heterogeneous effects requires panel data at the sectorial level and will be pursued in future work.
Supplemental Material
sj-docx-1-rrp-10.1177_04866134241279944 – Supplemental material for Intellectual Monopoly and Income Inequality in the United States, 1948–2021: A Long-Run Analysis
Supplemental material, sj-docx-1-rrp-10.1177_04866134241279944 for Intellectual Monopoly and Income Inequality in the United States, 1948–2021: A Long-Run Analysis by Tom00E1s N. Rotta in Review of Radical Political Economics
Footnotes
Acknowledgements
The author thanks the reviewers Özgür Orhangazi, T. Sabri Öncü, and Cecilia Rikap for their helpful comments on this article.
Declaration of Conflicting Interests
The author declared no potential conflicts of interest with respect to the research, authorship, and/or publication of this article.
Funding
The author received no financial support for the research, authorship, and/or publication of this article.
Supplemental Material
Notes
Author Biography
![]()
References
Supplementary Material
Please find the following supplemental material available below.
For Open Access articles published under a Creative Commons License, all supplemental material carries the same license as the article it is associated with.
For non-Open Access articles published, all supplemental material carries a non-exclusive license, and permission requests for re-use of supplemental material or any part of supplemental material shall be sent directly to the copyright owner as specified in the copyright notice associated with the article.