
Abstract
Explore the causal relationship of risk between type 1 diabetes and primary biliary cholangitis (PBC) and primary sclerosing cholangitis (PSC). A causal association between type 1 diabetes and autoimmune liver disease remains ambiguous. This study explored potential causality between different autoimmune conditions, indicating that caution should be taken of the occurrence of autoimmune liver diseases in daily management of T1D patients. Genetic variants were extracted as instrumental variables from the genome-wide association study (GWAS) of PBC, PSC, type 1 diabetes (T1D), and type 2 diabetes (T2D). Associations between four primary liver enzymes, alkaline phosphatase (ALP), aspartate aminotransferase (AST), alanine transferase (ALT), and glutamyl transaminase (GGT), and blood glucose-related indicators such as 2h-glucose post-challenge (2hGlu), fasting glucose (FG), fasting insulin (FI), and glycated hemoglobin (HbA1c) were also evaluated (GWAS p-value < 5 × 10⁻⁸). A bi-directional two-sample Mendelian randomization (MR) design was used to assess causality between type 1 diabetes and autoimmune cholestasis. Genetic susceptibility to T1D increased the risk of PSC and PBC. Genetic susceptibility to T2D reduced the risk of PSC and showed no correlation with PBC. Genetically susceptibility to PBC increased the risk of T1D and showed no correlation with T2D. Genetically susceptibility to PSC did not impact the risk of T1D and T2D. T1D patients have an increased risk of PBC/PSC, but such causation is not mediated or explained by the altered blood glucose levels. A bi-directional causal association was identified between type 1 diabetes and autoimmune cholestasis. The findings provide new insight into the management of patients with these conditions.
Keywords
Introduction
Human activity and health is dependent on blood glucose homeostasis. The liver synthesizes, stores, and releases glycogen, the core regulator of human blood glucose homeostasis, while the pancreas regulates blood glucose by secreting insulin. A close causal relationship has been identified between liver disease and diabetes. Liver injury reduces the hepatic glucose reserve capacity and burdens the pancreas, while pancreatic dysfunction leads to high blood glucose levels that can lead to liver cell damage. Non-alcoholic fatty liver disease (NAFLD) can increase a patient’s risk of developing type 2 diabetes (T2D), 1 and vice versa. 2 Thus, current health guidelines recommend the simultaneous detection of blood glucose and liver function indicators in patients with chronic liver disease and diabetes. However, it remains unknown whether there is a causal relationship between pancreatic impairment and autoimmune injury-induced cholestasis.
Primary biliary cholangitis (PBC) and primary sclerosing cholangitis (PSC), the most common types of autoimmune liver diseases, are mainly characterized by cholestasis. PBC is induced by genetic and environmental factors, such as bile duct cell lesions, and primarily occurs in middle-aged women. 3 PSC is common in young men and often coexists with inflammatory bowel disease, also induced by genetic and environmental factors. 4 This disease is mainly caused by inflammation and fibrosis of the bile duct, which can lead to progressive liver disease. End-stage PBC and PSC can cause cirrhosis and liver transplantation remains the only effective treatment to date. PBC and PSC are both autoimmune diseases characterized by cholestasis, and cohort studies have shown that they can increase the risk of T1D, but the cause is unknown. 5 We use Mendelian randomization (MR) analysis to explore the roles of liver enzyme levels and blood glucose levels in further elucidating this association.
T1D mainly occurs in adolescents, and risk factors include genetics, 6 poor diet, 7 intestinal microbiota, enterovirus infections,8,9 and the hygiene hypothesis. 10 T1D pathogenesis is primarily caused by autoimmune-induced β-cell impairment of the pancreas islets that leads to dysregulated insulin secretion and increases blood glucose. 11 Imbalanced bile acid metabolism is also a symptom of TID, 12 suggesting that there is a potential correlation between T1D and PBC/PSC. However, relatively few studies on cholestatic diseases and T1D have been conducted to date. A recent meta-analysis based on UKB data found that cholestasis can increase the risk of T1D, PBC can increase the risk of T2D, but PSC can relatively reduce the risk of T2D. 5
The current study sought to explore the causal relationship between PBC, PSC, and T1D using bidirectional MR methods. The findings revealed a bidirectional causal relationship between PBC/PSC and diabetes, providing new insight into the clinical management of these conditions.
Methods
Data source
All data was obtained from publicly available genome-wide association studies (GWAS), each of which was approved by the relevant ethics committee. PBC and PSC were used to represent autoimmune cholestasis diseases. The PBC data included 2,764 cases and 10,475 controls, adjusting for principal components (PCs) that differed between cases and controls. The PSC data included 2,871 cases and 12,019 controls, adjusting for the first 20 PCs included in the linear mixed model. Data on four primary liver enzymes, alkaline phosphatase (ALP), including 437,438 participants, all control data come from healthy people. aspartate aminotransferase (AST), including 406,934 participants, alanine transferase (ALT), including 437,267 participants, and glutamyl transaminase (GGT) including 437,194 participants, were also included to assess PBC and PSC-associated liver function. Of these, ALP is the most important indicator of these conditions. ALP, ALT, and GGT levels were adjusted for age, sex, and 40 genetic principal components of European ancestry. AST was adjusted for age at recruitment, sex, BMI, and the first 12 principal components of genetic ancestry.
Both T1D and T2D were used to represent diabetes. The T1D data included 8,967 cases and 308,373 controls while the T2D data included 38,657 cases and 310,131 controls. The FinnGen GWAS was adjusted for sex, age, ten genetic PCs, and genotyping batch. All data were from patients with European ancestry, all control data come from healthy people. Blood glucose-related indicators, including 2h-glucose post-challenge (2hGlu) levels, which included 63,396 participants, fasting glucose (FG), which included 200,622 participants, fasting insulin (FI), which included 151,013 participants, and glycated hemoglobin (HbA1c), which included 146,806 participants, were assessed. MAGIC (the Meta-Analyses of Glucose and Insulin-related traits Consortium) represents a collaborative effort to combine data from multiple GWAS to identify additional loci that impact on glycemic and metabolic traits. All of these indicators were obtained from MAGIC, along with age, sex, and the first five principal components. A summary description of all GWAS data is shown in (Table 1, Supplemental Tables 1–12). The genomic control for PSC GWAS was performed by the IPSCGS team and the UKB and FinnGen GWAS was adjusted by the inflation factor.
GWAS data summary.

Instrumental variable (IV) selection
IV selection is the most important component of MR analysis. All valid IVs should satisfy three principal IV assumptions 13 : (1) relevance: the genetic variant is closely associated with the exposure; (2) independence: the genetic variant is not associated with any confounder that might affect the exposure-outcome association; (3) exclusion restriction: the genetic variant does not affect the outcome except by way of exposure. 14 Linearity between the exposure and outcome should also be satisfied. 15 For each exposure, genome-wide significant single nucleotide polymorphisms (SNP) (GWAS P-value < 5 × 10⁻⁸) were selected and those with low minor allele frequency (MAF < 0.01) were removed. The SNPs were clumped based on a threshold of linkage disequilibrium (LD < 0.001) in a particular 10,000 kilobase genomic region. The F statistic was calculated for each SNP using the formula:

where beta represents the magnitude of genetic association with the exposure and se is its corresponding standard error. Each SNP with an F < 10 was removed before the main MR analysis. The MR Steiger directionality test was performed to assess and remove any genetic variant with more variance of exposure than the outcome. 16 Specific information regarding SNPs from different GWAS can be found in the Supplemental Tables 1–12.
MR design
This study had a bidirectional MR design in which the diabetes and diabetes-related indicators were treated as exposures in the forward MR analysis (Figure 1). In the reverse MR analysis, diabetes and its related indicators were the outcomes. No overlap was observed between the IVs used in the forward and reverse MR analyses. Before estimating the causal effect, the effect allele of each genetic variant was harmonized in the exposure and outcome datasets to ensure that the genetic associations were determined based on the same effect allele.

Study design.
Statistical analysis
The inverse-variance weighting (IVW) was used as the main statistical method since it can achieve the maximum power if all IVs are valid. The weighted median and MR-Egger methods were used as supplementary methods. The weighted median method can provide a valid causal estimate even when up to 50% of IVs are invalid. The MR-Egger method assumes and quantifies a directed horizontal pleiotropy using the intercept from regression analysis to give an informative estimate of when this phenomenon exists. 17
Sensitivity analysis and data visualization
The two major issues to consider in MR analysis are heterogeneity and horizontal pleiotropy. Cochran’s Q was calculated to identify potential heterogeneity and an IVW random-effects model was used if heterogeneity was detected. Weighted medians are also appropriate to use when heterogeneity is found. To minimize the bias caused by horizontal pleiotropy, sensitivity analysis was conducted using the MR-Egger intercept, MR-PRESSO, 18 and MR-CAUSE 19 methods to evaluate uncorrelated and correlated pleiotropy. When the P-value < 0.05, this association was considered significant. All statistical analyses were conducted using the “TwoSampleMR” and “MRPRESSO” R software 4.2.1 (https://www.r-project.org/) packages and “cause” data visualization was performed using the “TwoSampleMR” and “ggforestplot” R packages.
Results
Using the inclusion criteria described above, a bidirectional MR analysis was conducted, and SNPs that explained more variance of outcome than the exposure were removed using the Steiger directionality test. A causal relationship between T1D and cholestatic diseases was explored using genetic variants closely associated with T1D as IVs. To assess the impact of related factors on this relationship, genetic associations between T2D and its related indicators, including 2hGlu, FG, FI, and HbA1c were added as secondary exposures. Reverse MR was then conducted to explore the causal relationship between PBC/PSC and diabetes, using genetic variants closely associated with PBC, PSC, ALP, ALT, AST, and GGT as IVs (Figure 1).
Casual effects of T1D/T2D on PSC/PBC
Genetic susceptibility to T1D was shown to increase the risk of PSC (IVW OR = 1.28 [1.04–1.58], P-value = 0.021), and this association was supported using the weighted median method (OR = 1.19 [1.02–1.40], P-value = 0.028). Although the MR-PRESSO method detected possible outliers, the association between TID and PSC remained significant after correction (OR = 1.26 [1.07–1.48], P-value = 0.014). The MR-CAUSE method showed that a Genetic predicted association between T1D and PSC should be robust (P-value = 1.08E-256). The Cochran’s Q and MR-Egger intercept indicated the presence of either heterogeneity or horizontal pleiotropy (P-value < 0.05). Genetic susceptibility to T1D can also increase the risk of PBC (IVW OR = 1.19 [1.02–1.40], P-value = 0.030). Cochran’s Q P-value = 6.39E-5 suggested this result may be influenced by heterogeneity, however, the weighted median results indicated that the association was robust (OR = 1.28 [1.11–1.47],P-value = 0.001). Similarly, MR-PRESSO (OR = 1.32 [1.16–1.49], P-value = 0.002) and MR-CAUSE (P-value = 3.93E-264) indicated that the results were reliable.
Interestingly, the study findings indicated that genetic susceptibility to T2D could reduce the risk of PSC (IVW OR = 0.81 [0.71–0.93], P-value = 0.003), and this association was supported by the weighted median (OR = 0.8 [0.66–0.98], P-value = 0.030), MR-PRESSO (OR = 0.85 [0.74–0.97], P-value = 0.017), and MR-CAUSE (P-value = 3.41E-214) methods. However, genetic susceptibility to T2D showed no correlation with PBC (IVW OR = 0.9 [0.73–1.11], P-value = 0.317). While genetic susceptibility to T2D was associated with lower ALT (IVW OR = 0.996 [0.993–0.999], P-value = 0.003) and GGT (IVW OR = 0.990, [0.986–0.994], P-value = 3.65E-07) levels, the beta value of this result was small. Next, a potential association between blood glucose-related indicators and genetic susceptibility to PBC/PSC was assessed. While Genetic elevated 2hGlu (IVW OR = 0.72 [0.22–2.36], P-value = 0.592), FI (IVW OR = 1.53 [0.26–9.11], P-value = 0.639), FG (IVW OR = 0.58 [0.25–1.38], P-value = 0.219), and HBA1C (IVW OR = 2.33 [0.78–6.94], P-value = 0.128) were not associated with PBC, Genetic-elevated diabetes-associated indicators were all linked to a reduced risk of PSC, including Genetic elevated 2hGlu (IVW OR = 0.63 [0.41–0.97], P-value = 0.036), FG (IVW OR = 0.52 [0.31–0.87], P-value = 0.011), and HbA1c (IVW OR = 0.24 [0.1–0.55], P-value = 0.001). These results passed the pleiotropy and heterogeneity tests, which help to explain the potential protective effect of T2D on PSC in Table 2 and Figure 2. This is an interesting new discovery that PSC increase the risk of T1D but decrease the risk of T2D, so we further investigate the function of blood glucose index.
MR results of the IVW, weighted-median, MR-presso, and cause methods in forward MR analysis.

95% LCI (lower limit of 95% confidence interval), 95% UCI (upper limit of 95% confidence interval), Pheterogeneity (p-value of heterogeneity test from the Cochrane’s Q value), and Ppleiotropy (p-value of the pleiotropy test from the MR-Egger intercept).
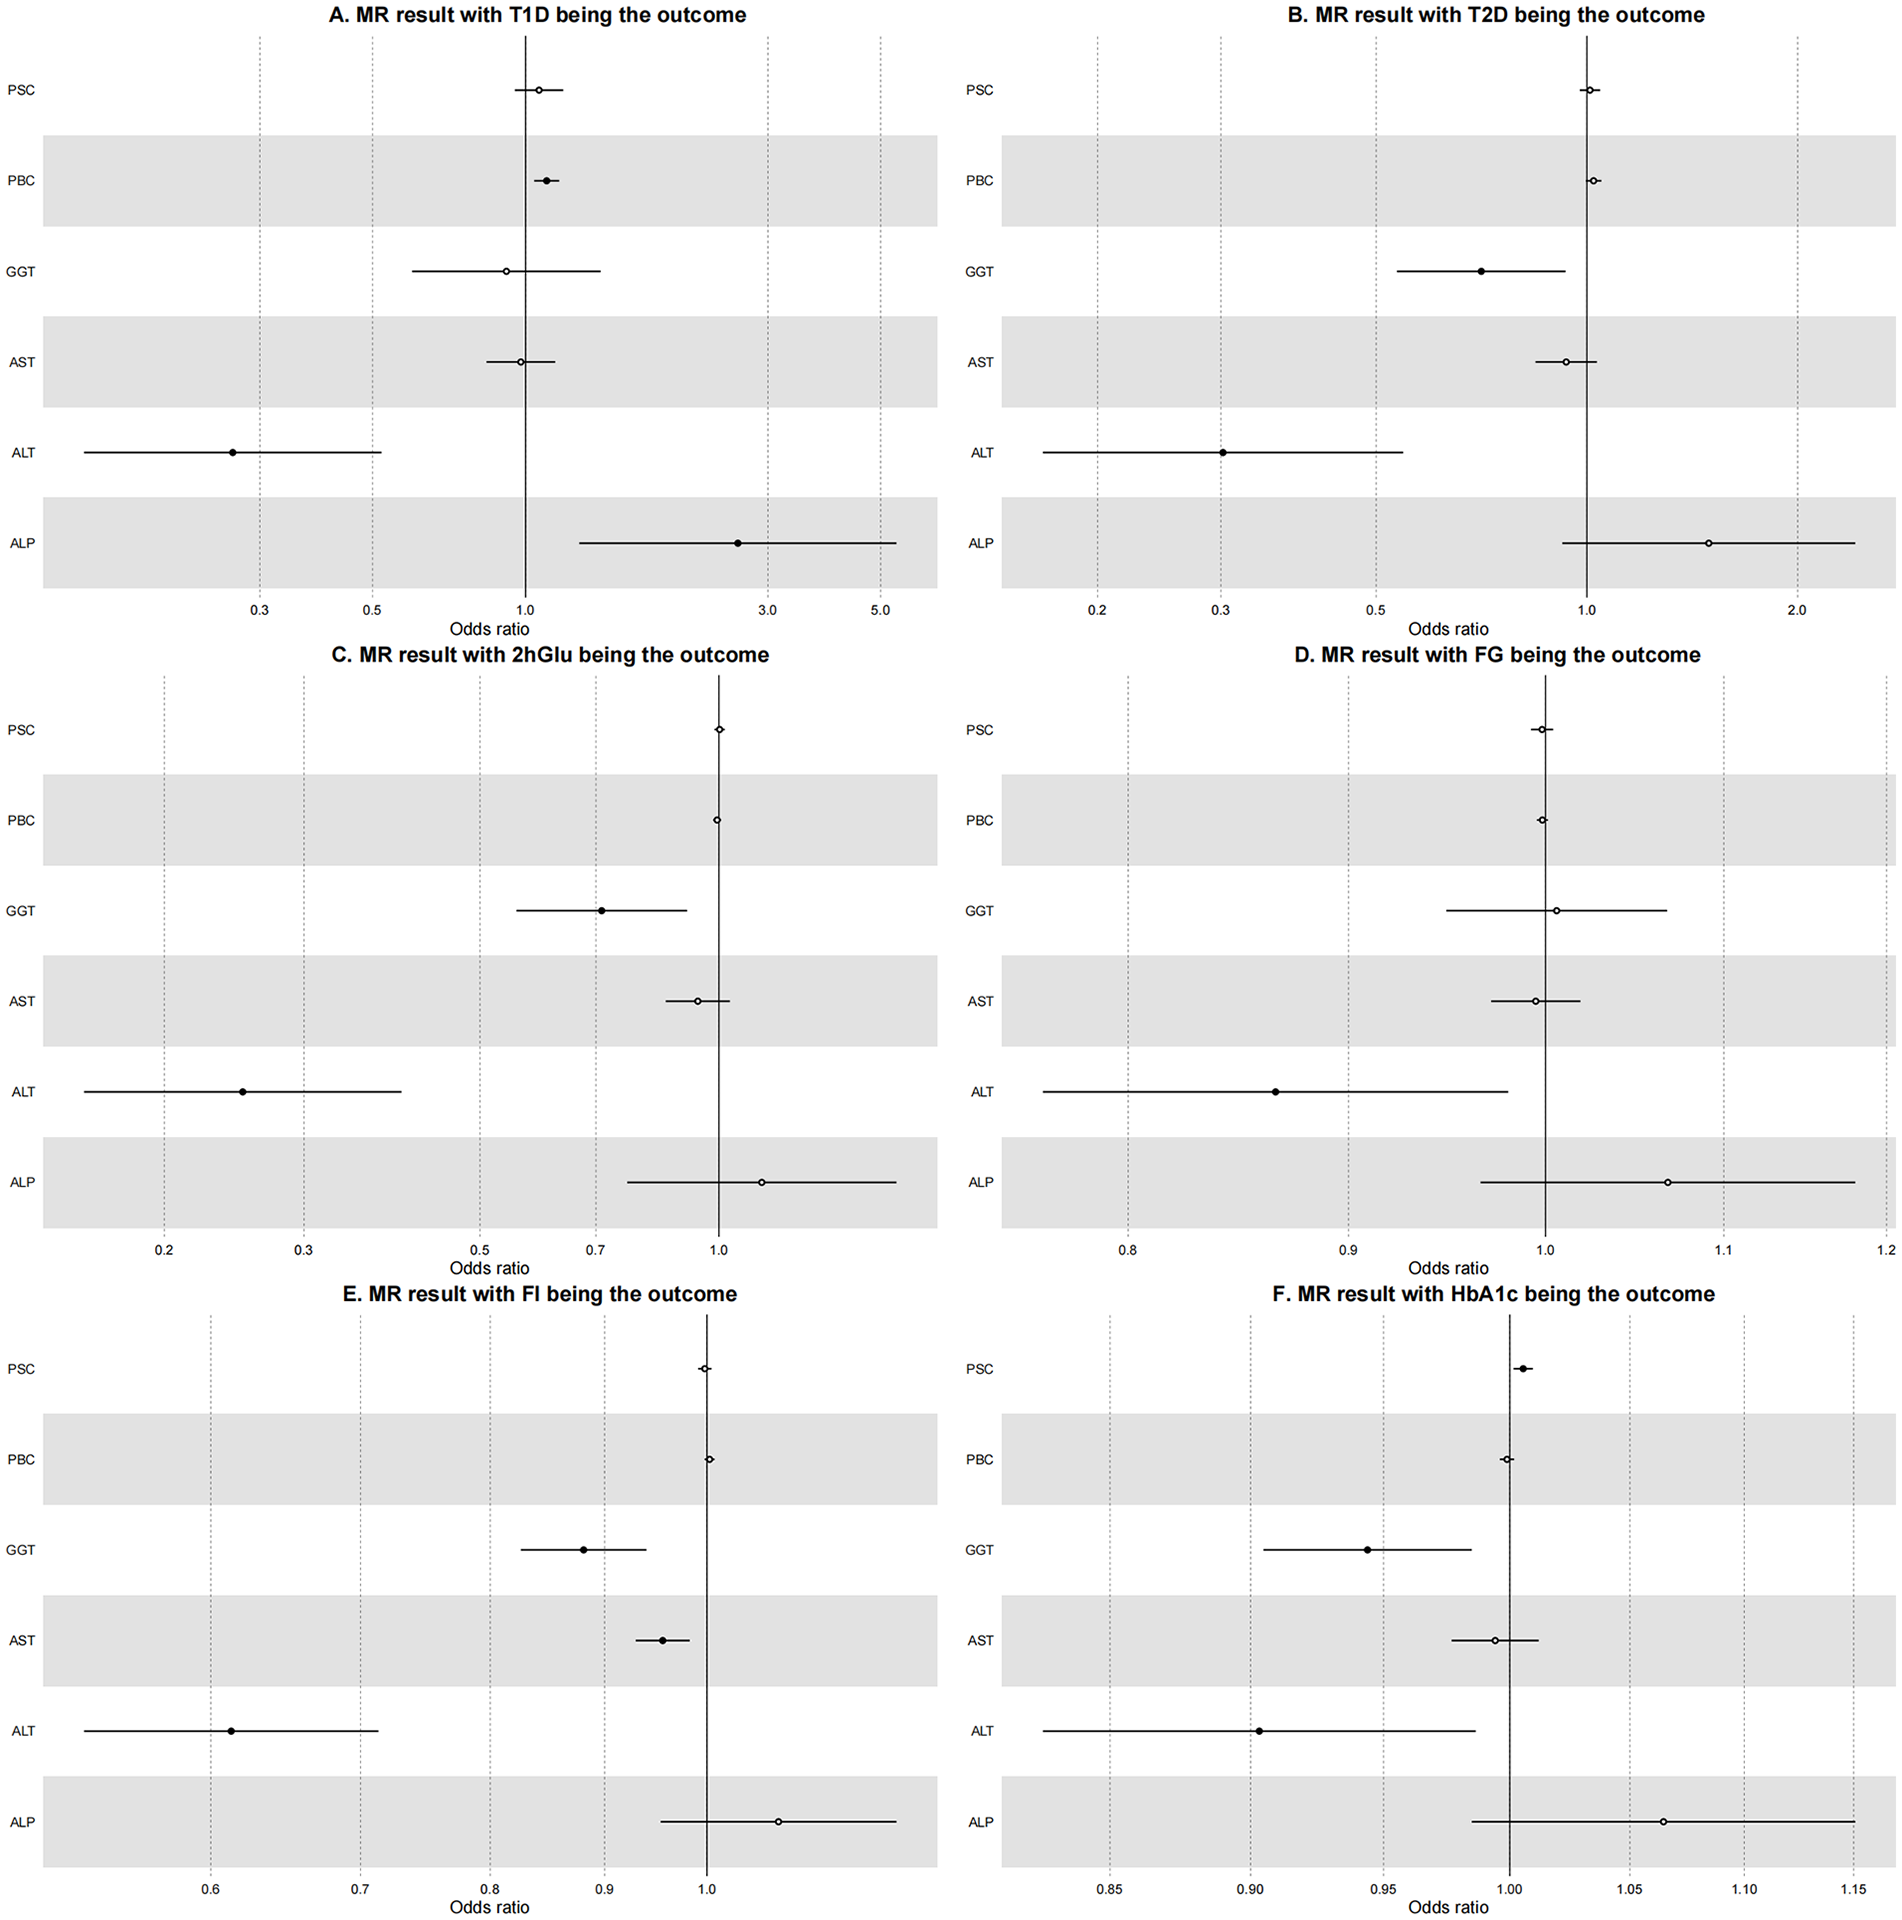
Forest plot of Mendelian randomization results using the IVW method. PBC, PSC, ALT, ALP, AST, and GGT are the exposures, and T1D, T2D, 2hGlu, FG, FI, and HbA1c are the outcomes. OR (odds ratio). Note that the confidence interval will not display if it is too narrow. The solid circle represents an association with a p-value < 0.05 and the hollow circle represents a p-value ⩾ 0.05.
To determine whether the blood glucose index can affect the risk of PSC by regulating liver function indicators, the levels of ALP and ALT, the most important pathological indicators of PBC/PSC, were assessed. Genetic elevated 2hGlu was shown to predict lower levels of ALP (IVW OR = 0.992 [0.985–1.000], P-value = 0.039) and GGT (IVW OR = 0.978 [0.971–0.985], P-value = 3.32E-09), but a higher level of AST (IVW OR = 1.06 [1.01–1.13], P-value= 0.032). Genetic elevated HbA1c reduced the levels of GGT (IVW OR = 0.981 [0.962–0.999], P-value = 0.044), Genetic elevated FI reduced the levels of ALT (IVW OR = 0.940 [0.911–0.969], P-value = 6.98E-5), AST (IVW OR = 0.67 [0.55–0.8], P-value = 1.49E-5), and GGT (IVW OR = 0.91 [0.87–0.96], P-value = 1.61E-4), and Genetic elevated FG reduced the level of GGT (IVW OR = 0.980 [0.964–0.996], P-value = 0.012) but increased the level of AST (IVW OR = 1.15 [1.08–1.24], P-value = 4.06 E-5). These results indicated that blood glucose-related indicators had a minimal impact on ALP and ALT, indicating that the increased risk of PSC/PBC in T1D patients is not induced by blood glucose, but may instead be related to crosstalk between autoimmune antibodies in Table 2 and Figure 2.
In this part we found that T1D increase the risk of PSC and PBC, but T2D can decrease the risk of PSC.
Casual effects of PSC/PBC on T1D/T2D
Genetic susceptibility to PBC increased the risk of T1D (IVW OR = 1.1 [1.04–1.16], P-value = 9.80E-4). This result was supported by the weighted median (OR = 1.05 [1–1.11], P-value = 0.040), MR-PRESSO (OR = 1.07 [1.02–1.13], P-value = 0.011), and MR-CAUSE (P-value = 1.25E-63) results. However, no correlation was observed between PBC and T2D (OR = 1.02 [1–1.05], P-value = 0.095). Genetic susceptibility to PSC did not impact the risk of T1D (IVW OR = 1.06 [0.95–1.19], P-value = 0.276) or T2D (IVW OR = 1.01 [0.98–1.04], P-value = 0.561), indicating that PBC/PSC does not play an important role in the initiation step of diabetes. The influence of liver function indicators on the development of diabetes was also assessed. Genetic liability to PSC was associated with higher levels of HbA1c (IVW OR = 0.01 [1–1.01], P-value = 0.007), while genetic elevated ALP was linked to a significantly higher risk of T1D (IVW OR = 2.62 [1.28–5.37], P-value = 0.009). Meanwhile, genetic elevated GGT (IVW OR = 0.71 [0.54–0.93], P-value = 0.014) and ALT (IVW OR = 0.3 [0.17–0.55], P-value = 7.50E-5) levels reduced the risk of T2D. These liver enzyme results passed the pleiotropy test but may have still been impacted by heterogeneity in Table 3 and Figure 3.
MR results of the IVW, weighted-median, MR-presso, and cause methods in reverse MR analysis.

95% LCI (lower limit of 95% confidence interval), 95% UCI (upper limit of 95% confidence interval), Pheterogeneity (p-value of heterogeneity test from the Cochrane’s Q value), and Ppleiotropy (p-value of pleiotropy test from the MR-Egger intercept).

Forest plot of Mendelian randomization results using the IVW method. T1D, T2D, 2hGlu, FG, FI, and HbA1c are the exposures, and PBC, PSC, ALT, ALP, AST, and GGT are the outcomes. OR (odds ratio). Note that the confidence interval will not display if it is too narrow. The solid circle represents the association with a p-value < 0.05 and the hollow circle represents a p-value ⩾0.05.
Genetic elevated GGT comprehensively reduced the levels of 2hGlu (IVW OR = 0.71 [0.56–0.91], P-value = 0.007), FI (IVW OR = 0.88 [0.83–0.94], P-value = 1.21E-4), and HbA1c (IVW OR = 0.94 [0.9–0.98], P-value = 0.007). Genetic elevated AST reduced the levels of FI (IVW OR = 0.96 [0.93–0.98], P-value = 0.001), genetic elevated ALT reduced the levels of 2hGlu (IVW OR = 0.25 [0.16–0.4], P-value = 4.13E-09), FI (IVW OR = 0.61 [0.53–0.71], P-value = 2.39E-10), FG (IVW OR = 0.87, [0.76–0.98], P-value = 0.023), and HbA1c (IVW OR = 0.9 [0.83–0.99], P-value = 0.023), and genetic elevated ALP had no impact on blood glucose indicators. Both PBC and PSC were associated with elevated ALP levels, which may be a trigger for PBC-induced T1D in Table 3 and Figure 3.
In this part we found that PBC increase the risk of T1D, but PSC doesn’t influence T1D orT2D, that may related to PBC make more significant impact on the function of liver parenchyma.
Discussion
This study found that genetic susceptibility to T1D can increase the risk of both PBC and PSC. Genetic susceptibility to PBC can also increase the risk of T1D, while genetic susceptibility to T2D can reduce the risk of PSC. While associations between liver disease and diabetes are well known, including cirrhosis-induced hepatogenic diabetes and diabetes-induced NAFLD, the link between autoimmune cholestasis disease and T1D has remained unclear. A potential causal relationship between PBC/PSC and T1D, however, is beginning to receive attention. A meta-analysis using UKB data found that cholestasis disease can increase the risk of T1D, PBC can increase the risk of T2D, and PSC can reduce the risk of T2D. 5 Our MR analysis found similar results, but we achieved more convincing results through a larger sample size. A clinical study involving 678 PSC patients from 1970 to 2004 showed that PSC significantly increased the risk of T1D in patients and their first-degree relatives, and slightly increased the risk of T2D. 20 This finding indicated that T1D and PSC share some common risk loci. A serum metabolomics study showed that PBC patients exhibit reprogramming in particular pathways involving taurine metabolism, pyruvate and citrate metabolism, glycine, serine and threonine metabolism, glyceride metabolism, glycolysis, gluconeogenesis, and pentose phosphate signaling. This suggests that impaired glucose metabolism is a potential clinical manifestation of PBC and may be a trigger for T1D in this patient population. 21 High blood ALP levels in T1D patients do not correlate with disease status but do represent inflammation 22 and poor renal function. 23 A large-scale retrospective study found that higher levels of liver enzymes in T1D patients are associated with an increased risk of complications. 24
PBC is mainly characterized by elevated antimitochondrial antibodies (AMA) and ALP and has genetic, environmental, microorganism, and bile acid-related risk factors. 25 PSC is primarily characterized by elevated ALP and GGT levels in clinical practice and is associated with a similar set of risk factors. 26 The role of bile acid metabolism and its impact on the microbiota in autoimmune cholestasis diseases is becoming increasingly recognized. Imbalanced bile acid metabolism is often shown to occur before both pancreatic autoimmune response and T1D, a process that includes microbial imbalance. 27 This finding also suggests that PBC- and PSC-induced T1D may be caused by cholestasis.
Since T1D and T2D are both risk factors for NAFLD and cirrhosis, the increased risk of PBC and PSC-induced liver injury caused by T1D and T2D may explain this causal relationship. Imbalanced bile acid metabolism induced by T1D is also a trigger for PBC and PSC and specific bile acid supplementation has been used successfully in T1D treatment. 28 Tauroursodeoxycholic acid (TUDCA) can improve pancreatic β cell activity and reduce the pancreatic autoimmune response in mice. 29 Meanwhile, ursodeoxycholic acid (UDCA) is the only FDA-approved drug used to treat patients with PBC/PSC. The current study indirectly confirms that bile acid-related drugs may also reduce the risk of T1D in these patients. Most recent research indicate that elafibranor, an oral, dual peroxisome proliferator-activated receptor (PPAR) α and δ agonist is a new efficacy and safety drug for PBC. 30 A phase Ⅲ clinical research proved PPARδ agonist Seladelpar is also efficacy in PBC patients. 31
To our knowledge, this is the first study to explore a potential causal association between diabetes and PBC/PSC. The MR design helped to reduce potential bias resulting from confounders and reverse causation and was able to identify a strong causal relationship in the absence of a randomized clinical trial (RCT). 32 This study also comprehensively assessed the association between diabetes and PBC/PSC by including liver enzymes and blood glucose-related indicators, adding confidence and reliability to the results. However, several limitations should also be discussed. First, horizontal pleiotropy is a flaw of the MR design, though different methods (MR-Egger intercept, MR-PRESSO, and MR-CAUSE) were used to evaluate it. Second, caution should be used when extrapolating the study results to populations with different genetic backgrounds. It is possible that the study conclusions only apply to Europeans. In order to avoid the occurence of type Ⅰ error as much as possible, Bonferroni correction was used (P-value < 0.05/6), we found that some results are still significant. T2D could reduce the risk of PSC, HbA1c could reduce the risk of PSC, 2hGlu could reduce the level of GGT, FI reduced the levels of ALT, AST and GGT, FG increase the level of AST. Indicating that T2D may reduce the risk of PSC through blood glucose index. PBC increased the risk of T1D, PSC was associated with higher levels of HbA1c, ALT levels reduced the risk of T2D, GGT comprehensively reduced the levels of 2hGlu, FI, and HbA1c, AST reduced the levels of FI, ALT reduced the levels of 2hGlu and FI. This result once again confirms that autoimmune cholestasis increases the risk of T1D dosen’t through blood glucose related pathways. However, this testing method is too strict and may exclude some meaningful results. Our study has set extremely strict inclusion criteria for IV. Therefore, we believe that the results we described are still reliable.
Conclusion
In summary, the present study identified a causal association between T1D and PBC/PSC, with T1D increasing the risk of PBC/PSC. This association was not related to blood glucose indicators but may instead be related to ALP levels. PBC was also found to increase the risk of T1D. Low level of ALT and GGT indicated low risk of T2D. These findings indicate that there is a close and complex association between these autoimmune diseases, highlighting a need for stronger monitoring to prevent complications associated with multiple autoimmune diseases.
Study highlights
Associations between liver disease and diabetes are well known, including cirrhosis-induced hepatogenic diabetes and diabetes-induced NAFLD, the link between autoimmune cholestasis disease and T1D has remained unclear.
Our study identified a causal association between T1D and PBC/PSC, with T1D increasing the risk of PBC/PSC not related to blood glucose indicators but may instead be related to ALP levels. PBC was also found to increase the risk of T1D.
These findings indicate that there is a close and complex association between these autoimmune diseases, highlighting a need for stronger monitoring to prevent complications associated with multiple autoimmune diseases.
This study suggests that we should actively observe liver function or prophylactic use UDCA in T1D patients. At the same time, beware of PBC patients complicated with type I diabetes.
Supplemental Material
sj-xls-1-iji-10.1177_03946320251327621 – Supplemental material for Causal association between type 1 diabetes and autoimmune cholestasis: A bi-directional Mendelian randomized study
Supplemental material, sj-xls-1-iji-10.1177_03946320251327621 for Causal association between type 1 diabetes and autoimmune cholestasis: A bi-directional Mendelian randomized study by Yuanda Liu, Lanlan Chen, Wei Hao, Kun Zhao and Changfeng Li in International Journal of Immunopathology and Pharmacology
Footnotes
Acknowledgements
We thank all investigators contributing to the GWAS of modifiable risk factors.
Author Contributions
Kun Zhao and Lanlan Chen proposed the idea and elaborated the research. Yuanda Liu performed the main data analysis and wrote the draft of the manuscript. Wei Hao contributed to the data analysis and manuscript revision. Changfeng Li, Kun Zhao and Lanlan Chen reviewed and revised the manuscript. Changfeng Li supervised the whole research and is responsible for the integrity of data analysis. All authors have given consent to the publication of this study.
Declaration of conflicting interests
The author(s) declared no potential conflicts of interest with respect to the research, authorship, and/or publication of this article.
Funding
The author(s) disclosed receipt of the following financial support for the research, authorship, and/or publication of this article: This study was supported by grants from the Natural Science Foundation of China (no. 82073299) for preparation and publish the manuscript.
Ethics approval
All data was obtained from publicly available genome-wide association studies (GWAS), each of which was approved by the relevant ethics committee.
Informed consent
All data was obtained from publicly available genome-wide association studies (GWAS), each of which was approved by the relevant ethics committee with informed consent.
Data Sharing
The data that support the findings of this study are openly available in FinnGen at https://www.finngen.fi/en, and GWAS catalog (https://www.ebi.ac.uk/gwas/). Codes can viewed in ![]()
Supplemental material
Supplemental material for this article is available online.
References
Supplementary Material
Please find the following supplemental material available below.
For Open Access articles published under a Creative Commons License, all supplemental material carries the same license as the article it is associated with.
For non-Open Access articles published, all supplemental material carries a non-exclusive license, and permission requests for re-use of supplemental material or any part of supplemental material shall be sent directly to the copyright owner as specified in the copyright notice associated with the article.