
Abstract
Cell-free DNA (cfDNA) has emerged as a potential biomarker for assessing disease activity and prognosis in rheumatoid arthritis (RA). However, the association between cfDNA levels and the established RA markers of inflammation and disease severity remains unclear. The current study aimed to detect plasma levels of cfDNA in patients with RA and to investigate their association with RA activity indicators (erythrocyte sedimentation rate (ESR), C-reactive protein (CRP), disease activity score-28 (DAS28)), prognostic markers (rheumatoid factor (RF), anticitrullinated protein antibodies (ACPA)), and the musculoskeletal ultrasonographic (US7) scores. This controlled cross-sectional study included 108 RA patients and 108 healthy controls. Plasma levels of cfDNA were quantified by real-time PCR using ALU repeats. Levels of ESR, CRP, RF, and ACPA were measured using routine laboratory assays. Synovial inflammation and joint damage evaluation was performed using the US7 scoring system. Plasma levels of cfDNA were higher in RA patients than controls (P < 0.001) and significantly increased with higher DAS28 scores among all RA activity groups. Also, cfDNA levels were significantly positively correlated with ESR, CRP, RF, and ACPA levels (P-values <0.001). Regarding US7, cfDNA was significantly positively correlated with synovitis and erosion scores (P-values <0.05) but did not correlate significantly with tenosynovitis scores (P-values >0.05). In addition, plasma cfDNA was significantly higher in seropositive RA patients than in seronegative patients (P = 0.007). The odds ratio for cfDNA as a risk factor for erosions was 2.254. This study revealed that cfDNA levels are elevated in RA patients and positively associated with disease activity indicators and prognosis markers. Further research is warranted to validate these findings in larger cohorts and explore the clinical implications of cfDNA measurement in RA management.
Introduction
The progressive destruction and erosion of joints is the hallmark of rheumatoid arthritis (RA), a chronic complex autoimmune inflammatory disease. 1 The timing of the diagnosis, early therapy initiation, disease activity, hereditary variables, and autoantibodies influence how quickly the disease progresses. 2 An essential part of diagnosing RA is done through serological testing, specifically the identification of rheumatoid factor (RF) and anti-citrullinated protein antibodies (ACPA). 3 Musculoskeletal ultrasonography (US), in addition to clinical and serological evaluations, is becoming a crucial diagnostic and disease-progression tracking tool. 2 However, although the established RA diagnostic methods contribute to the early identification of RA, additional molecular markers are needed, especially in seronegative patients, to assess prognosis and responsiveness to treatment and help in the stratification of patients.
Circulating cell-free deoxyribonucleic acid (cfDNA) is now emerging as a useful tool for non-invasive diagnostic methods related to a wide range of clinical conditions, including autoimmune diseases. It is defined as the extracellular fragmented DNA that can be derived from healthy and diseased cells. 4 Its release is mainly associated with cell death mechanisms, besides its active secretion. Moreover, the balance between cfDNA release and clearance mechanisms determines its levels in blood; when clearance is insufficient in high cell turnover, pathological conditions, and chronic inflammation, cfDNA accumulates. 5 Previous studies reported that plasma cfDNA levels increase in RA and correlate with symptom severity and that the cfDNA concentration in synovial fluid is several times higher than in circulation, indicating the importance of local inflammation in the cfDNA release.6,7 However, the dynamics of cfDNA in RA are still to be fully elucidated.
The current study aimed to detect plasma levels of cfDNA in seropositive and seronegative patients with RA and to investigate cfDNA level association with the established RA activity and prognostic markers, and the musculoskeletal US scoring system.
Methodology
Sample size calculation
Using the STATA 10 program for sample size calculation and based on the results of Duvvuri et al., 8 with a sensitivity of cfDNA in the detection of RA of 84% and postulated sensitivity of 90%, with an alpha error of 5% and power of study of 80%, the required sample size was 108 RA patients.
Ethical considerations
The study was carried out in accordance with the Declaration of Helsinki’s standards for research. Ain Shams University, Faculty of Medicine, Research Ethics Committee gave the study its ethical approval (#FMASU R 139/2024). Before being included in the study, each subject gave written, informed consent. All information was maintained confidential and was solely utilized for research.
Study subjects
The current controlled cross-sectional study was conducted on 108 adults (age ≥ 18 years) RA patients and 108 age- and sex-matched healthy controls in the period from. The RA patients were recruited from the Rheumatology Clinic, Ain Shams University, Cairo, Egypt; all fulfilled the ACR/EULAR 2010 classification criteria for RA. 9 They were classified according to the disease activity score-28 (DAS28) 10 into four groups: inactive (score <2.6), low activity (score 2.6–3.1), moderate activity (score 3.2–5), and high activity (score >5.1), with 27 patients in each group. All the selected RA patients were on conventional disease-modifying antirheumatic drug (DMARD) treatment (including Hydroxychloroquine, Leuflonamide, Methotrexate, and Sulfasalazine) either as monotherapy or combined. We excluded RA patients who were on biologic or target synthetic DMARDs. Patients with concomitant autoimmune diseases, acute or chronic infections and inflammation, co-existing malignancies, and pregnancy were also excluded from the study.
Musculoskeletal ultrasound examination (MSUS)
Ultrasound examination was performed by an expert sonographer who was blinded to the clinical and laboratory findings in each patient by utilizing equipment (Logic P5-R4.0, General Electric, Milwaukee, Wisconsin, USA with multifrequency linear probe ranging from 7 to 13 MHz using EULAR guidelines for grayscale (GS) and power doppler (PD), an assessment conducted in longitudinal and transverse views of the wrist, metacarpophalangeal joint (MCP) II and III, phalangeal interproximal (PIP) II and III, and metatarsophalangeal joint (MTP) II and V joints of the clinically most affected hand and forefoot. The German 7-joint musculoskeletal ultrasonographic (US7) score is a semiquantitative US scoring system that combines soft tissue changes (synovitis and tenosynovitis) and erosive bone lesions in seven preselected joints. 11
Laboratory investigations
Four milliliters (mL) of venous blood were withdrawn from each participant under aseptic conditions and subdivided into three tubes: the first was a vacutainer tube containing 3.2% sodium citrate for ESR analysis by Westergren method, 12 the second was a gel vacutainer tube, in which the blood was allowed to clot and then centrifuged for 10 min at 4000 rpm and the resultant serum was used to measure RF and c-reactive protein (CRP) using the Cobas 6000, c501 autoanalyzer (Roche Diagnostics, Switzerland) and ACPA using the Cobas e411 autoanalyzer (Roche Diagnostics, Switzerland). The normal cut-off for CRP was <5 mg/L, for RF was <14 IU/mL, and for APCA was <17.0 U/mL.
For cfDNA analysis, eight millilitres (8 mL) of blood were withdrawn from each participant into two k2-2EDTA vacutainer tubes (4 mL each). Each k2-EDTA tube was subjected to two centrifugation steps within 2 h of collection. The first centrifugation was at 1600 × g for 10 min and the resultant plasma supernatant was subjected to a second high-speed centrifugation at 16,000 × g for 10 min.
PCR workflow
Extraction of cfDNA
We used 4 mL of the collected plasma to extract cfDNA by the QIAamp® Circulating Nucleic Acid Kit (QIAGEN, Germany). The extraction steps were done as directed by the kit manual. The concentration of the extracted cfDNA was determined using Qubit™ 4 Fluorometer (Thermo Fisher Scientific Inc., USA). The purity of cfDNA was assessed using a Nanodrop One Spectrophotometer (Thermo Fisher Scientific Inc., USA) by calculating the ratio between the absorbance value measured at 260 nm and the absorbance value measured at 280 nm. Any ratio from 1.8 to 2 was considered appropriate.
Amplification of cfDNA by real-time PCR using ALU repeats
As DNA repeats make up more than 50% of the human genome and constitute a major part of cfDNA fragments, it was expected to be a good marker for cfDNA measurement. 13 The Alu repeat 115 fragments were amplified using Maxima SYBR Green qPCR Master Mix (2X) (Thermo Scientific, USA) and the Alu 115 primer set (Invitrogen, USA) (forward primer: 5’ CCTGAGGTCAGGAGTTCGAG’3; reverse primer: 5’CCCGAGTAGCTGGGATTACA’3). TaqMan™ Control Genomic Human DNA (10 ng/µL) (Applied Biosystems, Thermofisher, USA) was utilized to create a calibration curve to assess quantities of Alu 115. The final reaction volume (20 μL) was configured as follows: 10 µL of master mix, 0.6 µL of each Alu 115 forward and reverse primers, 5 µL of the cDNA extract, and 3.8 µL of nuclease-free water.
The amplification of the PCR was performed in real-time using a 5 Plex Rotor-Gene Real-Time PCR Analyzer (Qiagen, Germany) according to the following protocol: initial activation (10 min at 95°C) then 35 cycles of denaturation (30 s at 95°C), annealing (30 s at 64°C), and extension (30 s at 72°C). After PCR amplifications, we performed a melting curve analysis on every PCR amplicon to confirm the specificity of the reaction products.
The concentration of Alu 115 fragments was determined using the created standard curve by ten-fold serial dilution of Taqman human genomic DNA (10 ng/uL). The standard concentrations were expressed in pg/uL. by multiplying by 1000 to (10,000, 1000, 100, 10, and 1) pg/uL.
Statistical methodology
Data analysis was performed using IBM SPSS Statistics (V. 26.0, IBM Corp., 2019). Categorical variables were expressed as numbers and percentages. The non-parametric variables were presented as medians and interquartile ranges (IQR). For Data comparison, the Chi-square test, the Mann–Whitney U test, and the Kruskal-Wallis test were applied. The receiver operating characteristic (ROC) curve analysis was used to assess the diagnostic performance of cfDNA. Logistic regression analysis was done to identify independent risk factors for erosions. A P-value of <0.05 is statistically significant.
Results
Levels of cfDNA in RA patients and healthy controls
A significant increase in the cfDNA concentration was found in RA patients compared to the age- and sex-matched healthy control (P < 0.001). The median (IQR) cfDNA level in RA patients was 37.80 (21.63–87.29) pg/µL, while in controls was 16.96 (9.98–25.94) pg/µL. Figure 1.

Box plots comparing levels of cfDNA among RA patients and controls.
Among the RA patients, cfDNA concentrations did not differ significantly according to participants’ sex (P = 0.071). The median (IQR) cfDNA level in males was 77.73 (21.63–246.28) pg/µL, while in females was 36.96 (24.11–66.50) pg/µL.
Association of cfDNA with disease activity by DAS28
Plasma levels of cfDNA significantly increased with higher disease activity scores (P < 0.001) and differed significantly between all activity groups (inactive, low, moderate, and high). Therefore, cfDNA was superior on ESR, which did not differ significantly between low and moderate activity groups (P = 0.096), RF, which did not differ significantly between inactive and low activity groups (P = 0.807), and ACPA, which did not differ significantly between inactive and low activity groups (P = 0.271) and between low and moderate activity groups (P = 0.163). Tables 1 and 2.
Comparison of the different characteristics of RA patients according to disease activity by DAS28 score.
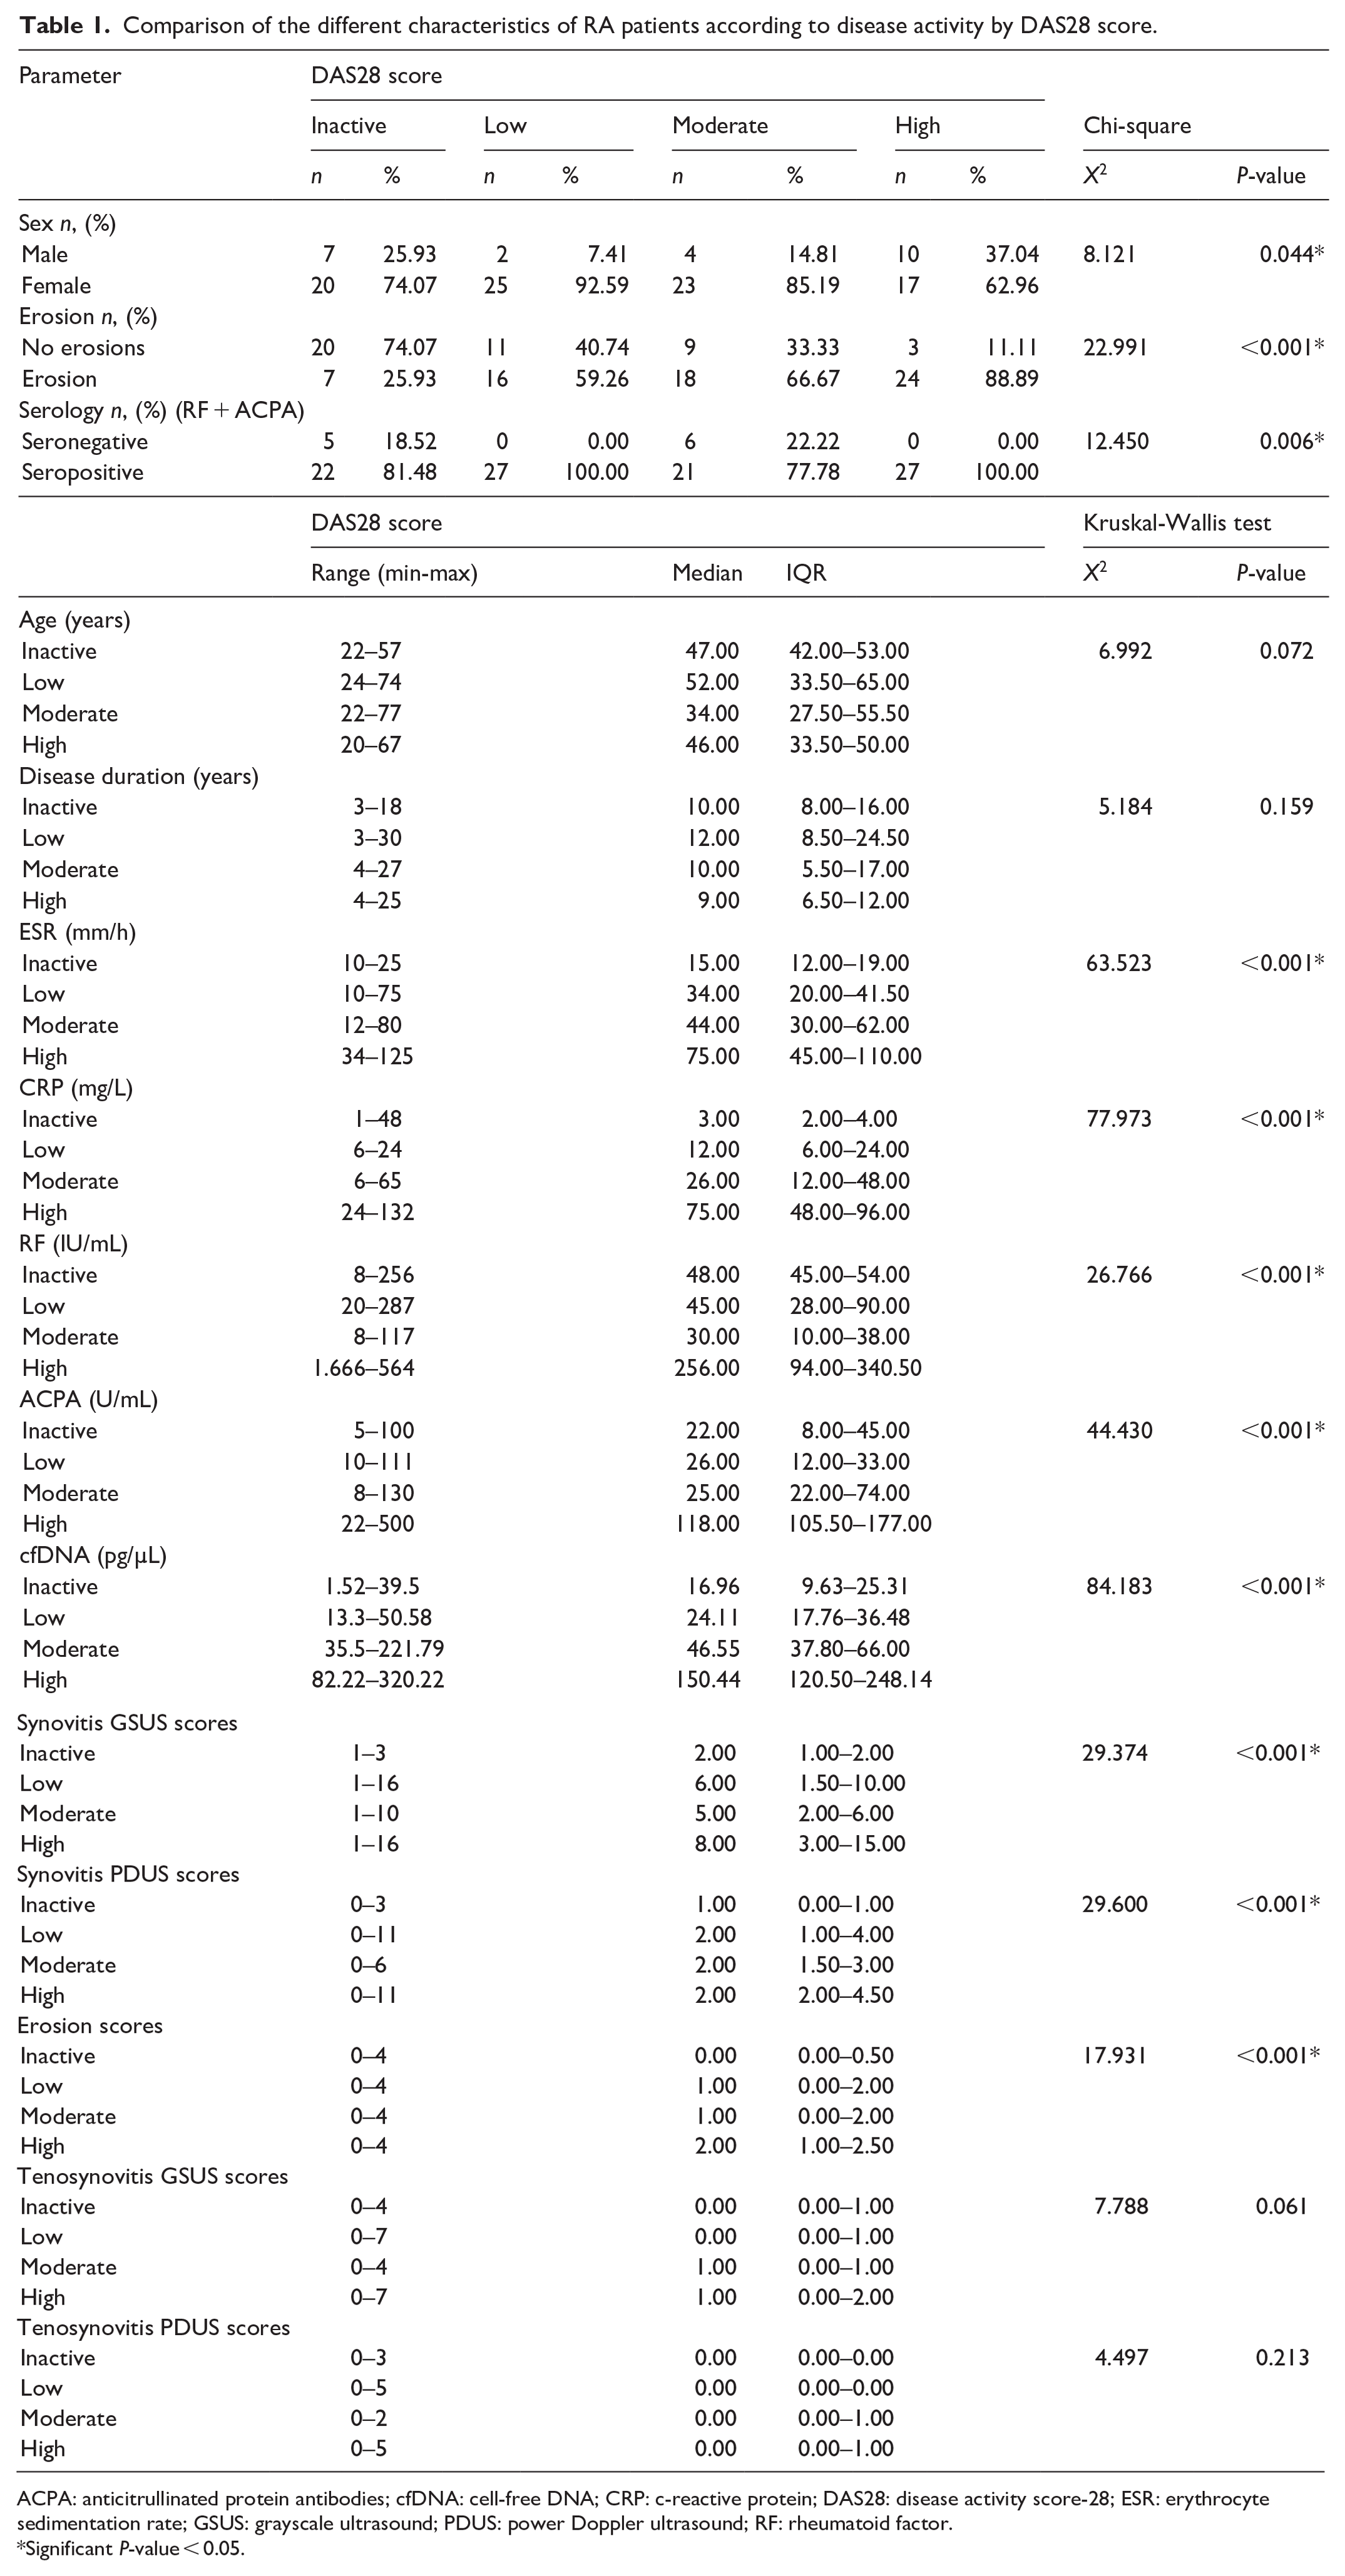
ACPA: anticitrullinated protein antibodies; cfDNA: cell-free DNA; CRP: c-reactive protein; DAS28: disease activity score-28; ESR: erythrocyte sedimentation rate; GSUS: grayscale ultrasound; PDUS: power Doppler ultrasound; RF: rheumatoid factor.
Significant P-value < 0.05.
Significance of differences in characteristics observed between RA activity groups based on DAS28 score.

ACPA: anticitrullinated protein antibodies, cfDNA: cell-free DNA, CRP: c-reactive protein, DAS28: disease activity score-28, ESR: erythrocyte sedimentation rate, GSUS: Grayscale ultrasound, PDUS: power Doppler ultrasound, RF: rheumatoid factor.
Significant P-value < 0.05.
Regarding the US7 score, tenosynovitis GSUS and PDUS scores did not differ significantly between the different activity groups (P = 0.061 & 0.213, respectively). Synovitis GSUS and synovitis PDUS scores did not differ significantly between the low and moderate activity groups (P = 0.512 & 0.895, respectively) and between the low and high activity groups (P = 0.120 & 0.302, respectively). In addition, synovitis PDUS scores did not differ significantly between high and moderate activity groups (P = 0.267). Erosion scores did not differ significantly between the low and moderate activity groups (P = 0.588) and between the high and moderate activity groups (P = 0.088). Tables 1 and 2.
Association of cfDNA with erosions
Higher cfDNA levels were significantly associated with erosions (P < 0.001), as were increased RF (P = 0.043), ACPA (P < 0.001), CRP (P < 0.001), and ESR (P < 0.001) levels. Furthermore, erosions were significantly linked to higher US7 (P-values <0.05) and DAS28 (P < 0.001) scores. On the other hand, erosions were not associated with patients’ age (P = 0.604), sex (P = 0.578), disease duration (P = 0.104), and serology status (RF + ACPA) (P = 0.089). Table 3.
Comparison of the different characteristics of RA patients according to the presence of erosions.

ACPA: anticitrullinated protein antibodies; cfDNA: cell-free DNA; CRP: c-reactive protein; DAS28: disease activity score-28; ESR: erythrocyte sedimentation rate; GSUS: Grayscale ultrasound; PDUS: power Doppler ultrasound; RF: rheumatoid factor.
Significant P-value < 0.05.
Association of cfDNA with seropositivity
There was a significant difference in cfDNA levels according to the serology status (RF + ACPA) of RA patients (P = 0.007), being significantly higher in seropositive patients (median (IQR): 40.23 (24.11–90.50) pg/µL) than seronegative patients (median (IQR): 36.79 (8.39–37.30) pg/µL). Table 4.
Comparison of cfDNA levels according to the serology (RF+ACPA) status of RA patients.

ACPA: anticitrullinated protein antibodies; cfDNA: cell-free DNA; RF: rheumatoid factor.
Significant P-value < 0.05.
Correlations of cfDNA with routine laboratory markers and radiological findings
Significant positive correlations were observed between plasma levels of cfDNA and ESR level (r = 0.508, P < 0.001), CRP level (r = 0.672, P < 0.001), RF titre (r = 0.515, P < 0.001), ACPA level (r = 0.753, P < 0.001), DAS28 scores (r = 0.750, P < 0.001), synovitis GSUS scores (r = 0.515, P < 0.001), synovitis PDUS scores (r = 0.296, P = 0.002), and erosion scores (r = 0.382, P < 0.001). No significant correlations were observed between plasma levels of cfDNA and tenosynovitis GSUS scores (r = 0.115, P = 0.238), tenosynovitis PDUS scores (r = 0.143, P = 0.141), patients’ age (r = −0.082, P = 0.401), and disease duration (r = −0.091, P = 0.348).
Diagnostic abilities of cfDNA
ROC curve analysis was performed to determine the diagnostic ability of cfDNA to discriminate between RA patients and controls; the best cut-off point was 36.79 pg/µL, and the area under the curve (AUC) was 0.801. Figure 2.

ROC curve for discriminating ability of cfDNA between RA patients and healthy controls (cut-off: 36.79 pg/µL, area under curve: 0.801, diagnostic sensitivity: 52.78%, diagnostic specificity: 100.00%, positive predictive value: 100.00%, and negative predictive value: 34.6%).
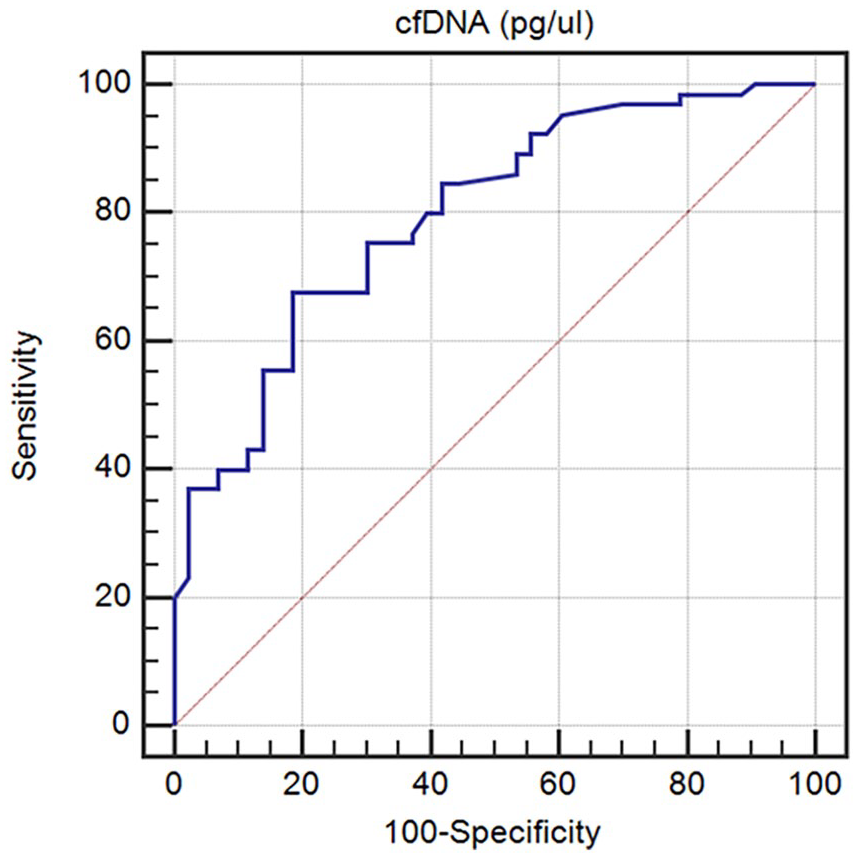
The diagnostic ability of cfDNA to discriminate RA patients according to disease activity by DAS28 and the presence of erosions was also assessed. The best cut-off point of plasma cfDNA in discriminating between inactive and active (low, moderate, and high activity) RA patients was 34.73 pg/µL with an AUC of 0.898 (Figure 3). The best cut-off point of cfDNA in discriminating between RA patients with erosions and those without was 37.8 pg/µL with an AUC of 0.795. Figure 4.

ROC curve for discriminating ability of cfDNA between RA patients with inactive disease and those with active disease (low, moderate, and high activity) (cut-off: 34.73 pg/µL, area under curve: 0.898, diagnostic sensitivity: 77.78%, diagnostic specificity: 88.89%, positive predictive value: 95.5%, and negative predictive value: 57.1%).
ROC curve for discriminating ability of cfDNA between RA patients with erosions and those without (cut-off: 37.8 pg/µL, area under curve: 0.795, diagnostic sensitivity: 67.69%, diagnostic specificity: 81.40 %, positive predictive value: 84.6%, and negative predictive value: 62.5%).
Finally, the best cut-off point of cfDNA in discriminating between seronegative and seropositive RA patients was 37.8 pg/µL with an AUC of 0.747. Figure 5.

ROC curve for discriminating ability of cfDNA between seronegative and seropositive RA patients (cut-off: 37.8 pg/µL, area under curve: 0.747, diagnostic sensitivity: 53.61%, diagnostic specificity: 100%, positive predictive value: 100%, and negative predictive value: 19.6%).
Risk factors for erosions
The logistic multivariate regression analysis was applied and revealed that RF and cfDNA were significant independent risk factors for erosions among RA patients. The odds ratio (OR) and 95% confidence interval for RF were 2.012 (1.003–3.021) (P = 0.012), while for cfDNA were 2.254 (1.258–4.042) (P = 0.006). Table 5.
Multivariate logistic regression analysis for independent risk factors for erosions among RA patients.
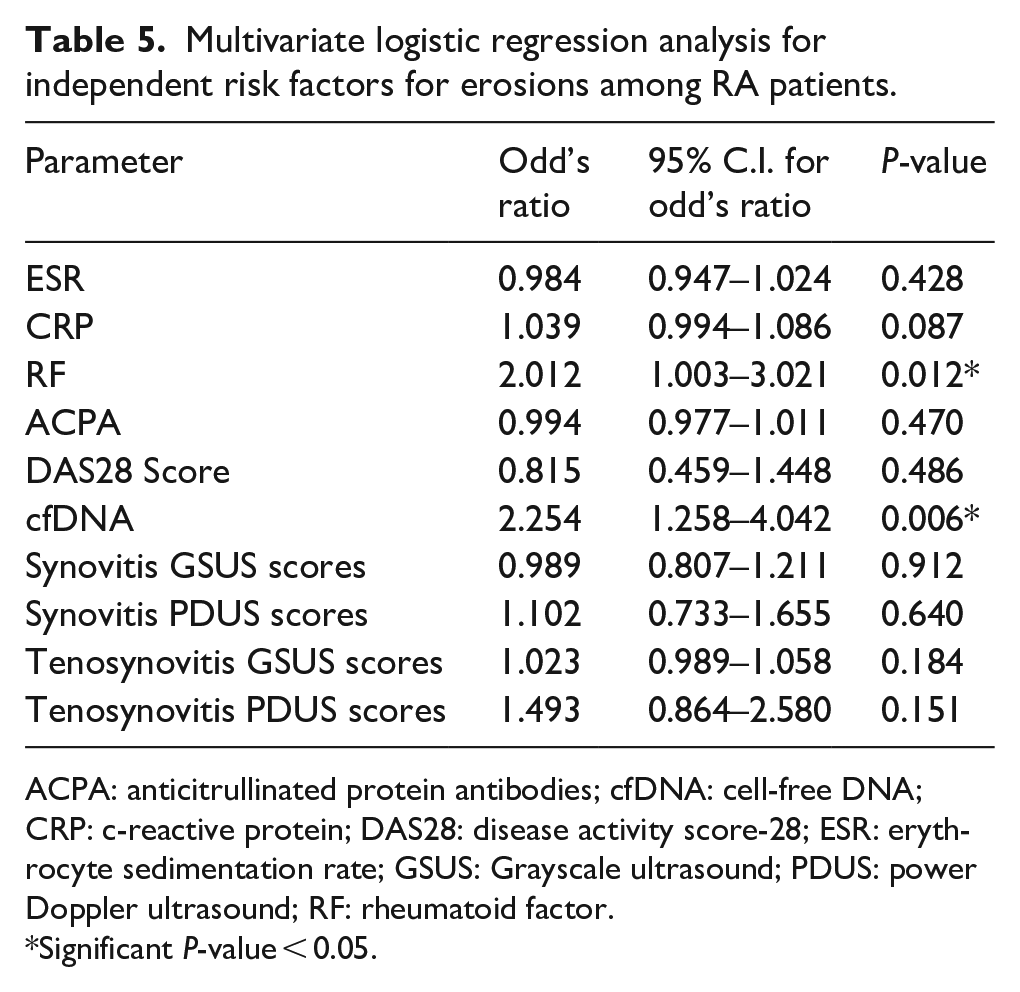
ACPA: anticitrullinated protein antibodies; cfDNA: cell-free DNA; CRP: c-reactive protein; DAS28: disease activity score-28; ESR: erythrocyte sedimentation rate; GSUS: Grayscale ultrasound; PDUS: power Doppler ultrasound; RF: rheumatoid factor.
Significant P-value < 0.05.
Discussion
Due to its association with inflammation and tissue damage, cfDNA has gained attention as a potential biomarker of RA activity and prognosis. The current study revealed that plasma levels of cfDNA were significantly higher in RA patients than controls. Levels of cfDNA significantly increased with higher DAS28 scores and differed significantly between all RA activity groups (inactive, low, moderate, and high). In addition, cfDNA levels were significantly positively correlated with RA prognosis markers (RF, ACPA), and activity indicators (CRP, ESR, DAS28). Furthermore, cfDNA in the current study was revealed to be an independent risk factor for erosions.
To our knowledge, this study takes the lead in investigating the correlation of plasma cfDNA levels with the US7 scoring system items and the serology status (RF + ACPA) in RA patients. It revealed that cfDNA was positively correlated with synovitis GSUS and PDUS scores and erosion scores but did not correlate significantly with tenosynovitis GSUS and PDUS scores, indicating a relationship between cfDNA release and synovial inflammation and joint damage. Also, plasma cfDNA levels were significantly higher in seropositive RA patients than in seronegative ones.
Our findings go along with several studies that have investigated cfDNA levels in RA activity.6,14–16 A study by Abdelal et al., 16 reported a significant correlation between plasma cfDNA levels and DAS28 scores in RA patients, with higher cfDNA levels observed in patients with active disease compared to those in remission. 16 Similarly, Lauková et al., 17 reported a positive association between cfDNA and ESR, CRP, and RA activity by DAS28. They also reported higher levels of cfDNA in the active group than in the remission group. 17 Also, in a study by Eldosoky et al., 18 they had three groups of participants (active RA patients, RA patients in remission, and healthy controls) and found that cfDNA levels reached the highest in active RA patients and the lowest in controls with significant differences between the three groups included. 18 They reported positive correlations of plasma cfDNA levels with DAS28 and ESR. 18 Another study by Dong et al., 19 found that cfDNA levels were associated with increased synovial inflammation and joint damage, suggesting a potential pathological role for cfDNA in RA. 19
Previously, cfDNA was reported to be released by active secretion from RA synovial cells in vitro. 20 This finding supports the association between GSUS and cfDNA found in the current study. Hashimoto et al., 20 suggested that cfDNA in RA synovium may originate from synovial cells or inflammatory cells such as neutrophils. 20
Furthermore, the release of cfDNA in RA is a multifactorial process that is related to the pathophysiology of the disease and involves various mechanisms, including apoptosis and necrosis; synovial inflammation and tissue damage in RA lead to the release of cellular debris, including fragmented DNA, into circulation.8,21 Moreover, neutrophil extracellular traps (NETs), which are web-like structures composed of chromatin and antimicrobial proteins released by activated neutrophils, contribute to the release of cfDNA and propagate inflammation in the synovium.22,23 In addition, dysregulated clearance mechanisms may further exacerbate cfDNA accumulation in RA patients, perpetuating immune-mediated tissue damage and joint inflammation.5,8 Also, oxidative stress, which is the imbalance between reactive oxygen species (ROS) production and antioxidant defense mechanisms, is a hallmark of RA. ROS-induced DNA damage may lead to the release of cfDNA into circulation. 24 Furthermore, dysregulated immune responses in RA, including aberrant cytokine production and immune cell activation, contribute to tissue damage and cfDNA release. Pro-inflammatory cytokines such as tumor necrosis factor-alpha (TNF-α) and interleukin-6 (IL-6) are implicated in the pathogenesis of RA and may promote cfDNA release. 25 Moreover, Alvarado-Vásquez et al., 26 reported that cfDNA may cause endothelial dysfunction and other adverse consequences on the vascular system by activating toll-like receptor (TLR)-9 which induces NF-κB signaling pathway. A finding that supports the involvement of cfDNA in the pathogenesis of RA. 26
In contrast to our results, Hajizadeh et al., 27 reported no significant association between cfDNA and CRP, erosivity, or extra-articular manifestations in RA patients. 27 Also, Dunaeva et al., 1 measured cfDNA in serum samples and observed a decrease in cfDNA levels in patients with established RA in comparison with healthy controls. 1
In the current study, at a cut-off of 36.79 pg/µL, cfDNA discriminated RA patients from healthy controls with an AUC of 0.801. While at a cut-off of 34.73 pg/µL, cfDNA discriminated active RA patients from those with inactive disease with an AUC of 0.898. Dunaeva et al., 1 reported, in the ROC curve analysis, that the AUC for cfDNA to discriminate RA patients from healthy controls was 0.914. 1 Eldosoky et al., 18 also reported that cfDNA at a cut-off of 14.41 ng/µL (=14,400 pg/µL) had an AUC of 0.931, 86% diagnostic sensitivity, and 84% diagnostic specificity for the discrimination of active RA patients from those in remission. 18 The variation in cfDNA cut-off values across studies contributes to discrepancies, indicating that the elevation of cfDNA in different populations is not standardized. Although cfDNA levels increase, there is no well-established cut-off that can be universally applied for the diagnosis and prognosis of RA. Differences in DNase activity among different sample types and different disease statuses can contribute to the discrepancy in cfDNA levels.1,28
Differences observed between studies could also be attributed to the variability in disease activity and severity among RA patients, treatment regimens (e.g. disease-modifying antirheumatic drugs, biologics), patient demographics (e.g. age, sex, ethnicity) and characteristics (e.g. comorbidities, disease duration, genetic factors), preanalytical variables including sample collection and processing methods that can introduce bias and affect cfDNA measurements, the sensitivity and specificity of analytical assays used to quantify cfDNA levels (e.g. quantitative PCR, next-generation sequencing), the type of cfDNA studied (nuclear or mitochondrial), and the matrix in which cfDNA was detected (serum, plasma, synovial fluid).1,29
The major limitations of our study were its single-center design with a relatively small sample size and that it did not consider the different treatment regimens and duration of treatment of the included participants. Moreover, since nuclear origin has been suggested as the primary source of circulating cfDNA, 6 we analyzed cfDNA exclusively using ALU-PCR. It is recommended to assess total cfDNA concentrations, including cfDNA from minor sources like mitochondrial cfDNA to give a more comprehensive view of total cfDNA in RA patients as well as to evaluate DNase activity. Despite these limitations, our findings contribute to the growing body of evidence supporting the utility of cfDNA as a promising biomarker for assessing RA activity and prognosis, as evidenced by its association with DAS28, US7 scores, CRP, ESR, RF, and ACPA.
Conclusion
The study demonstrates that elevated plasma cfDNA levels correlate with RA activity, prognosis markers, and the presence of erosions, reflecting ongoing synovial inflammation, tissue damage, and immune dysregulation. These findings highlight plasma cfDNA as a potential reliable biomarker for disease monitoring, stratifying disease severity and guiding treatment approaches. Its role as an independent risk factor for erosions suggests a prognostic value, making cfDNA a critical tool for early intervention. Further research could solidify its application in clinical protocols and explore therapeutic implications.
Footnotes
Acknowledgements
None
Authors contribution
• SIT was responsible for the study’s conceptualization, methodology, investigation, data curation, formal analysis, project administration, writing of the original draft, and review and editing of the manuscript.
• SFS was responsible for the study’s methodology, investigation, data curation, formal analysis, project administration, writing of the original draft, and review and editing of the manuscript.
• SSH was responsible for the study’s investigation, data curation, formal analysis, project administration, and review and editing of the manuscript.
• EME was responsible for the study’s investigation, data curation, formal analysis, project administration, and review and editing of the manuscript.
• SS was responsible for the study’s investigation, data curation, formal analysis, project administration, and review and editing of the manuscript.
• DHHE was responsible for the study’s investigation, data curation, formal analysis, project administration, and review and editing of the manuscript.
• BO was responsible for the study’s investigation, data curation, formal analysis, project administration, and review and editing of the manuscript.
• MAA was responsible for the study’s investigation, data curation, formal analysis, project administration, and review and editing of the manuscript.
• RAG was responsible for the study’s conceptualization, methodology, investigation, data curation, formal analysis, project administration, writing of the original draft, and review and editing of the manuscript.
Availability of data and materials
The datasets used and/or analyzed during the current study available from the corresponding author on reasonable request.
Declaration of conflicting interests
The author(s) declared no potential conflicts of interest with respect to the research, authorship, and/or publication of this article.
Funding
The author(s) received no financial support for the research, authorship, and/or publication of this article.
Ethical approval
The study was carried out in accordance with the Declaration of Helsinki’s standards for research. Ain Shams University, Faculty of Medicine, Research Ethics Committee gave the study its ethical approval (#FMASU R 139/2024). Before being included in the study, each subject gave written, informed consent. All information was maintained confidential and was solely utilized for research.
Consent for publication
Not applicable
Informed consent
Written informed consent was obtained from all subjects before the study.
Trial registration
Not applicable.