
Abstract
Knowledge about total RNA molecules in Parkinson’s disease is limited. This gene expression profiling study was conducted with a preclinical experimental design using a mouse model to examine the molecular-biological characteristics and the pathological implication of total RNA gene interaction in Parkinson’s disease in silico. In silico analysis of total RNA molecules, the Gene Expression Omnibus database, published results, and preliminary findings of available patient samples apply. The potential signaling network and the effect of the interaction of molecules with total RNA was predicted and confirmed. The research consists of four parts. At first, we analyzed the control and MPTP groups. In the second part, we analyzed FVB-N control and MPTP. In the third part, we analyzed controls. In the fourth part, we analyzed MTPT separately. The constructed network contains total RNA, where the Kyoto Encyclopedia of Genes and Genomes database analysis showed that genes from the signaling pathway are involved in the development and complications of Parkinson’s disease in male and female rats. Identified total RNA and genes are involved in altered signaling. There is direct interconnection and interdependence of interactions in the signaling network. Results identified the significant total-RNA molecules of the signaling pathway that connect other molecules. In silico analysis shows upregulated and downregulated genes in Parkinson’s disease rats. Preliminary data shows that total RNA molecules interact with other genes, and they are applicable in Parkinson’s disease course monitoring, shedding light on how factors impact the expression of genes and offering strategies for management.
Introduction
Neurodegenerative disease development depends on environmental and genetic factors. Scientists investigated the influence of the most significant factors in the disease onset, development, and treatment. 1 Researchers are putting effort into finding a solution to neurodegenerative disease problems through a multidisciplinary approach and understanding the interaction between disciplines like neurobiology, molecular biology, genetics, business, investment, and application in clinical practice. 2 Scientific literature is a significant guiding stone for having state-of-the-art research results worldwide. Theoretical and empirical work in genetics and molecular biology enables the continuity of scientific research and connection to other fields like biochemistry, physiology, and medicine.
The most common neurodegenerative disease worldwide affecting the population above 65 years is Parkinson’s disease (PD). 3 The disease is related to the progressive loss of dopaminergic and non-dopaminergic neurons, the development of α-synuclein (α-syn) aggregates, proteasomal stress, oxidative stress, mitochondrial and lysosomal dysfunction with aberrant autophagy. 3 Uniform biomarkers of PD do not exist, although mutations are identified, like in ATP12A2, LAMP2A, and hsp70 in the substantia nigra (SN) or A53T, PINK1-PARKIN. 3 So far, 6 million individuals are affected globally by PD. PRKN, PINK1, and LRRK2 genes show disturbance in mitochondrial-related pathways where mitochondrial dysfunction plays a central and multifaceted role in PD. 4 These mitochondria markers can be found as a blood biomarker and by Neuroimaging in vivo. 4 Potential therapeutic approaches include recovering physiological ATP production by targeting the ETC and antioxidative treatment strategies by Coenzyme Q10, vitamin K2, nicotinamide (vitamin B3), N acetylcysteine, N-Methyl, N-propynyl-2-phenylethylamine (MPPE), S (−) enantiomer of pramipexole, ursodeoxycholic acid (UDCA) 4]. Physical activity promotes mitochondrial biogenesis and function. Moderate 1–4 weeks exercises prevent the decrease of peroxisome proliferation activated receptor gamma coactivator 1-alpha and NRF-1 expression and a reduction in transcription factor A, mitochondrial (TFAM), protein levels, and augmented activity. 4 Therapy includes enhancing the clearance by mitochondria stress response pathways, improving biogenesis, and restoring dynamics and trafficking.2,4 Gene therapy includes targeting PRKN, PINK1, proteins, Nrf2/ARE, addressing mitochondrial calcium and metal ion, neuroinflammation, innate immunity, miRNAs, endoplasmatic reticulum-mitochondrial links, stem cell therapies and soluble epoxide hydrolase inhibition.2,4 Based on this notion, PD etiology and pathophysiology are complex, where mitochondrial dysfunction plays a central role. 4 Future therapies will rely on drug combinations that directly or indirectly affect pathways using personalized medicine. 4 Regulation of mitochondrial pathways is significant for neurodegenerative disease treatment. 5 PD-related genes like Pink1, Parkin, and others influence mitophagy, mitochondrial trafficking, and mitochondrial calcium homeostasis. 5 Deregulated genes like UPRmt, HtrA2, and G399S influence genes included in the respiratory chain complex and multiple mitochondrial pathways in German and Turkish cohorts. 5
Based on the above information and genetic and molecular studies, the function of mitochondria and lysosomal compartments linked by Ca2+, mTOR signaling, and activation of transcriptional factors like MiT, TFE3, and TFEB can apply as a pharmacology target of PD. 6 Long and small ncRNA, microRNA, lncRNA, circular RNA, PIWI-interacting RNA, and tRNA that modulate metabolic pathways and gene expression are diagnostic and therapeutic targets of PD. Bioinformatics data applies to disease identification and pathophysiology. 7 siRNA controls overexpression of the SNCA gene (ExCont-RNAi) to normal, where patients with SNCA triplication have no significant effect in PD fibroblast therapy. 8 Based on this information, coded ExCont-RNAi silences by siRNA. 8 Protein targeting of α-synuclein at the messenger RNA level inhibits its translation and slows the progression of PD. 9
Literature indicates the significance of RNA metabolism and mRNA translation in the PD process and mutation in LRRK2 and PINK1/Parkin in signaling networks connected to PD pathogenesis. 10 LRRK2 leads to translational inhibition of Ago, a component of the Risc/miRNA repressor complex. 10 Translation initiation is achieved through LRRK2 phosphorylation of 4E-BP and releasing eIF4E/eIF4G by 4E-BP, similar to 4E-BP by mTORC1. 10 These interactions are present in Drosophila and C.elegans, but the precise mechanism remains to be determined. 10 Genomic regulation of the PINK1 locus with RNA metabolism is complex. 10 Concordant regulation is present between novel splice PINK1 variant (svPINK1) mRNA that encodes the C terminus regulatory protein kinase domain with a noncoding antisense RNA expressed at PINK1 locus (naPINK1) in vivo. 10 naPINK1 increases svPINK1 mRNA through dsRNA mediated mechanism during normal physiological conditions. 10 RNA metabolism influences PD pathogenesis through stress proteome reprogramming, energy conservation, modulating the misfolded or aggregated proteins, and distribution of mRNA among different intracellular ribonucleoprotein granules. 10 Future studies should elucidate the effect of translation regulation on gene expression and metabolism pathways for disease diagnosis and treatment. 10 Noncoding RNA, like circRNA, accumulates in the brain and regulates neuronal and glial development and function. 11 Noncoding RNA in the PD controls the pathogenic processes of aging, α-syn dysregulation, neuroinflammation, and oxidative stress. 11 Gut microbiota links to PD symptomatology and pathophysiology. 12 16S microbiome datasets confirm that the genera Lactobacillus, Akkermansia, and Bifidobacterium and depletion of bacteria belonging to the Lachnospiraceae family and the Faecalibacterium genus as significant short-chain fatty acids producers are the most consistent PD gut microbiome alterations. 12 A systematic literature review has assessed research for PD interventions. The effectiveness of self-management is not enough for proper conclusions. 13 In silico studies confirm the effect of Karanjin, a natural molecule for PD therapy. 14 Targeting G-protein-coupled receptors (GPCRs) of dopamine, adenosine, muscarinic acetylcholine, metabotropic glutamate, and 5-hydroxytryptamine on the pathophysiology of PD and the importance of structure- and ligand-based in silico approaches for the development of small molecules to target these receptors is a relevant target for drug discovery of Central Nervous System (CNS) diseases. 15 Caffeine, CNP0202316, and CNP0365210 as natural products cause the blockade of monoamine oxidase (MAO) and adenosine A2A receptors (AA2AR) for PD. 16
When we are looking at one cell population at a time, total RNA molecules represent a complete pool of RNA molecules consisting of ribosomal RNA (rRNA), messenger RNA (mRNA), transfer RNA (tRNA), and non-coding RNA (nc-RNA) like microRNAs (miRNAs), small nuclear RNAs (snRNAs), and long non-coding RNAs (lncRNAs) with a specific cell role. 17 Each particular molecule in the total RNA has its reason for increasing the possibility of disease detection. 17 For example, mRNA reflects the active transcriptional state of genes, indicating dysregulation in gene expression associated with the pathological processes in PD. 18 miRNAs are post-transcriptional regulators that can influence gene expression by targeting mRNAs for degradation or translational repression where aberrant miRNA expression to PD. 18 lncRNAs are involved in regulatory processes like chromatin remodeling, gene expression regulation, and RNA processing. 19 Based on this notion, the pool of total RNA molecules represents a potential biomarker in neurodegenerative diseases.
The pool of total RNA molecules provides a comprehensive view of the transcriptomic changes in PD, and by analyzing total RNA molecules in silico, we aimed to identify novel biomarkers in early disease diagnosis, monitoring, progression, and therapeutic intervention. We chose to analyze total RNA rather than focusing on a specific RNA type for several reasons, including a comprehensive overview, interconnected roles of RNA types, increased sensitivity for biomarker discovery, and flexibility in data mining. Total RNA molecules enable complete transcriptome information of mRNA, rRNA, tRNA, and nc-RNA, capturing coding and non-coding RNA changes in PD. The complex interaction between biomolecules in the pool of diverse RNA molecules affects stability and translation and can provide a more holistic picture of the changes in PD. We increase the chance of revealing novel biomarkers as unexpected or less well-characterized RNA, where data are not needed to re-extract or re-sequence samples, enabling comprehensive understanding.
The relationship between RNA and proteins in the context of the analysis conducted exists in this paper since RNA has a significant role in the regulation of biological processes, including gene expression, RNA splicing, and post-transcriptional modifications, and proteins are functional products of gene expression with diverse biological function ranging from enzyme catalysis, signaling, and structural support. Because of this, the RNA we analyzed often leads to the production of regulatory proteins associated directly with disease pathogenesis. Any dis-regulation of RNA molecules leads to the production of nonfunctional protein products, contributing to disease, and because of that, understanding RNA regulation can affect protein expression and activity, which is vital for identifying potential therapeutic targets and biomarkers in PD. The role of proteins is acknowledged and considered with suggested future directions. The choice focused on total RNA as a potential biomarker of PD is motivated by the goal of capturing a broad spectrum of transcriptomic changes and identifying potential biomarkers. However, we recognize the significance of protein role in disease pathology and analysis. The scope of the study centered on total RNA molecules for several reasons, including RNA as a bio-marker and comprehensive RNA analysis.
The objective was to explore multiple RNA types, enabling a broader view of gene expression and regulation, offering insights into disease processes, and serving as an early diagnostic and prognostic tool in disease monitoring and therapy. The study aims to develop and test an integrated conceptual model of total RNA molecule interaction with other genes as potential biomarkers in PD in silico to examine the molecular-biological characteristics of RNA and the pathological implications of mutual interplay. Moreover, the study aims to identify different expression genes between the treatment and control groups, understand the pathway and functional enrichment associated with differential expression genes, investigate subgroup diversity and interaction effects, and assess the robustness of the findings with sensitivity analysis. Future studies should reveal how changes in specific RNA molecules affect protein function and contribute to disease pathology, although they are out of this study’s scope, improving the discovery of disease biomarkers.
Methodology
Design of the study
Data collection was through publicly available Gene Expression Omnibus (GEO) databases. The analysis is done remotely from Belgrade, Serbia, where the study period spanned from September 2022 to February 2023. In silico analysis focuses on the bioinformatical analysis without experimental confirmation.
Collection of data
Dataset GSE31458, GPL8321 [Mouse430 A_2] Affymetrix Mouse Genome 430A 2.0 Array platform and publication from the GEO database apply for conducting research of total RNA molecules in PD. 20 Criteria for inclusion include expression data from naive and MPTP-exposed cholinergic transgenic mice Mus musculus. Only available microarrays with treatment, transgenic variants, tissue, and genetic background are present in the study. The study removes poor data quality from the analysis. This analysis dataset contains 29 samples (18 participants in PFC (S control = 4, S-MPTP = 2; R control = 4; R MPTP = 2; FVB/N Control = 4; FVB/N MPTP = 2) and 11 in CPU (S control = 2, S-MPTP = 2; R control = 2; R MPTP = 1; FVB/N Control = 2; FVB/N MPTP = 2). The small sample size is due to practical limitations like the availability of the subjects, high cost, and ethical constraints involving human participants. The sample study characteristics are present in Table 1, while Tables 2–4 represent a list of significant genes detected in the samples. The GPL8321 [Mouse430A_2] Affymetrix Mouse Genome 430A 2.0 Array platform applies for bioinformatic analysis for several reasons, including comprehensive coverage, high-quality data, wide adoption, detailed annotation, support for multiple applications, and integration with bioinformatic tools. Array like this offers 22,600 characterized mouse genes involved in various processes, producing reproducible data, ensuring consistency and comparability among data, and meta-studies analysis. Interpretation of the results is included on the platform with detailed annotation, enabling flexibility of bioinformatic tools by supporting various applications like gene expression profiling, differentiation expression, and pathway analysis and databases. All these points confirm the applicability and success of the platform involving the mouse model. TAR (CEL) files are applied along with correction and normalization, measuring data quality to determine gene expression patterns in bioinformatic analysis.
Variables
The GSE31458 dataset includes differential gene expression levels in the prefrontal Cortex (PFC) and Caudate Putamen (CPU) of mice related to the effect of neurotoxin used to model PD (MPTP). The primary outcome is a change in gene expression, quantified as a log2 fold change between different groups. The secondary outcome includes the identification of dysregulated genes associated with MPTP treatment and the enrichment of molecular pathways related to neurodegeneration, oxidative stress, and other significant processes. Exposure includes MPTP treatment that selectively affects dopaminergic neurons and induces PD, representing a binary variable (MPTP treated vs Control). Different mouse strains (S strain-sensitive; R strain-resistant; FVB/N strain-control) can respond differently to MPTP. Predictors in the analysis represent the gene expression level of individual genes in the PFC and CPU and mouse strain to understand the effect of MPTP across different strains, brain regions, and treatment status if the mouse received MPTP or not. Potential confounders in the study are parameters of age, sex, environmental factors, and batch effect. Gene expression level and responses to MPTP are affected depending on age, sex, environmental condition, and batch effect correlated to variations of different sampling times, RNA extraction, and hybridizations, which could affect the results. Strain differences can influence the effect of MPTP on gene expression along with brain region representing effect modifiers of the study. These results could be a potential diagnostic criterion for a neurodegenerative model of PD and gene expression threshold, making it indirect predictor criteria linked to PD pathways with setting a significant threshold as a log2FC cutoff (e.g., |log2FC| > 1) and an adjusted p-value (e.g., p < .05) to identify dysregulated genes.
Bias
Potential bias sources decrease with several strategies, including randomization, blinding, controlling for confounders, batch effect correction, quality control, balanced sample sizes, ethical consideration, and transparency, along with sensitivity analysis. Confounding variables are evenly distributed across groups, enabling sample assignments. The study employed experimental blinding to prevent observed bias in data interpretation, reducing biases that can potentially arise. Additionally, the manuscript was blinded for review to ensure an unbiased evaluation by reviewers. Stratification and multivariable models prevent isolating the effect of MPTP treatment to other variables and incorporate potential confounders as covariates in statistical models to adjust their impact, reducing the risk of a relationship between MPTP treatment and gene expression changes. Technical variability decreases by ComBat and surrogate variable analysis during data normalization and preprocessing. RNA quality is present in primary publication analysis. Group sizes are comparable to prevent biases from unequal sample sizes that can affect statistical power and result interpretation. Ethical considerations are present in the primary study, along with data transparency, maintaining complete and accurate records of all experimental procedures, sample handling, and data processing steps, which enable identifying and mitigating potential biases with replication and validation. Robustness check with the variable assumption assesses the finding of robustness affecting results. The study sample size is determined in previous studies, probably based on a combination of practical considerations and specific scientific goals regarding scientific objectives, the availability of resources, statistical power, biological variability, and feasibility of sample collection. Gene expression exploration related to MPTP treatment in diverse mouse strains and the development of the PD model belong to the primary study objective connecting it to neurodevelopmental processes. The primary sources include the animal model and cost consideration for the study. Sample size and statistical power make significant gene expression differences. This study introduces biological variability, making it time and labor-intensive to complete an experimental design.
Data preprocessing
In this study, data processing includes steps of quality control, background correction, normalization, probe summarization, log transformation, filtering, batch effect correction, annotation, outlier detection, and final quality assessment.
Quality plots like Boxplot and A visualize the distribution across samples and detect Outliers and poor-quality samples. MAS5.0, RMA (Robust Multi-array Average), and GCRMA (GC Robust Multi-array Average) adjust non-specific binding and background noise. To convert probe-level data into gene-level expression measures methods like Median Polish, the MAS5.0 Algorithm enables stigmatization in RMA and intensity for expression level. Log2 transformation transforms the data to stabilize variance and make the data normally distributed. Detection p-value filtering and variance filtering exclude non-informative probes with low variance across samples that are not reliably detected to reduce noise. The batch effect is corrected with ComBat and identified and removed with SVA (Surrogate Variable Analysis). The accurate gene mapping is available with the updated annotation packages in Bioconductor. PCA (Principal component analysis), clustering, and visualization (heatmap) help detect outliers and potentially exclude them from datasets. Updated quality plots confirm preprocessing steps, making them ready for downstream analysis during the final data quality assessment, such as differential expression analysis (DEG), pathway analysis, and machine learning, and reliable and biologically meaningful results. In the preprocessing phase, the study applies R/Bioconductor packages (affy, oligo, limma, affyPLM, simplify) and Affymetrix power tools (APT) for command line preprocessing and quality control. The dataset contains 29 samples (18 participants in PFC (S control = 4, S-MPTP = 2; R control = 4; R MPTP = 2; FVB/N Control = 4; FVB/N MPTP = 2) and 11 in CPU (S control = 2, S-MPTP = 2; R control = 2; R MPTP = 1; FVB/N Control = 2; FVB/N MPTP = 2). The sample study characteristics are present in Table 1, while Tables 2-4 represent a list of significant genes detected in the samples. The GPL8321 [Mouse430A_2] Affymetrix Mouse Genome 430A 2.0 Array platform applies for bioinformatic analysis for several reasons, including comprehensive coverage, high-quality data, wide adoption, detailed annotation, support for multiple applications, and integration with bioinformatic tools. Array like this offers 22,600 characterized mouse genes involved in various processes, producing reproducible data, ensuring consistency and comparability among data, and meta-studies analysis. Interpretation of the results is included on the platform with detailed annotation, enabling flexibility of bioinformatic tools by supporting various applications like gene expression profiling, differentiation expression, and pathway analysis and databases. All these points confirm the applicability and success of the platform involving the mouse model. TTAR (CEL) files are applied along with correction and normalization, measuring data quality to determine gene expression patterns in bioinformatic analysis. Controlling for confounding factors includes a design matrix in limma to include variables in different experimental groups and block design where confounders are in the model as blocking factors. Strain differences and brain regions have different gene expressions and effects on MPTP treatment.
Identification of dysregulated total RNA with differential expression analysis: After preprocessing, the data format is a matrix with rows representing genes and column samples. We clearly defined the conditions and groups and wanted to compare groups. The study included additional covariates like age, sex, and batch accounted in the analysis. The study uses the linear model implemented in the limma package in R and defines the contrast matrix to compare groups by using the makeContrasts () function in limma to assess differential expression. False positives are under testing by multiple test corrections of thousands of genes with Banjamini-Hochberg (BH) and Bonferroni corrections. Identification of dysregulated RNAs by threshold fold change (FC), log2 fold change, |log2FC| > 1 identify significantly dysregulated genes and adjusted p-value, p < .05 to identify statistically significant genes where the table of differentially expressed RNA with log2 fold changes, p-values, and adjusted p-values show. Differentially expressed RNA with gene symbols, functional description, and pathways using annotation packages and databases like Ensemble, Gene Ontology (GO), and Kyoto Encyclopedia of Genes and Genomes (KEGG) apply to map gene annotation of differentially expressed genes. Visualization of the most significant dysregulated RNA molecule, expression patterns, and relationship between log intensity and fold change with a Volcano plot with -log10 (p-value) against log2 (fold change), heat map, and MA plot applies. As an optional analysis, functional enrichment analysis applies to identify specific pathways or gene sets enriched in the dysregulated RNAs, biological processes, molecular functions, and cellular components associated with the differentially expressed RNAs with GSEA (Gene Set Enrichment Analysis), GO, and Pathway analysis. R packages include limma, edgeR, DESeq2, qplots, and ggplot2, as well as other software platforms like Partek, GeneSpring, and Ingenuity Pathway Analysis (IPA). The expression profile was on September 20, 2022, with Dataset ID: GSE31458; Platform: GPL8321 [Mouse430A_2] Affymetrix Mouse Genome 430A 2.0 Array platform.
Further studies should include validation of the key findings with qPCR and RNA-Seq. In this way, we will get a complete insight into the molecular mechanism of the disease in a specific model organism in silico. Cross-validation and independent data validation are applied to assess the robustness of the differential expression results.
Planning a scientific study analysis includes several methodological and analytical steps:
Defining research question and objectives
This step answers questions like the main research question, formulates a testable hypothesis, and outlines primary and secondary aims.
Study design
This is a gene expression profiling study conducted within a preclinical experimental design using a mouse model based on the dataset ID and platform. Mice undergo specific treatment, genetic modification, and environmental exposure. The objective was to identify differentially expressed genes under different conditions (e.g., disease vs control, treated vs untreated) in the mouse model by comprehensive coverage of the mouse genome. While this study is experimental, it has an observational and analytical component between different groups aiming at potential biomarkers and genetic signatures associated with a specific phenotype. The study subtype is a disease model study that mimics a human disease as well as a preclinical pharmacology study due to evaluating the treatment effect, making it a descriptive analysis summarizing the gene expression data and conducting differential expression analysis to interfere with which dysregulated genes exist between the experimental conditions. The target population is laboratory mice, strain C57BL/6, that can be genetically modified and exposed to a specific treatment inducing a particular condition such as PD. Power analysis determines the appropriate sample size, ensuring statistical power, considering the effect size, the alpha level, and the power with R software, making the sample size larger enough to achieve statistical significance with inclusion and exclusion criteria. Detecting independent, dependent, and confounding variables enables robust, reproducible, and interpretable results.
Data collection
Primary data collection is from the GSE31458 dataset originating from an experimental study of experimental mice, where the secondary dataset arises from comparing the results with an existing dataset or combining data from multiple sources and secondary datasets. Data collection methods exist in the previously published paper. Ethical approvals are not required since this is the secondary analysis of the GSE31458 dataset, where the original study already obtained the appropriate consent for reuse.
Data management
This step includes data storage, cleaning, and formatting. Data storage incorporates securing solutions and data backup, including physical and cloud storage, data encryption, access control and regular backups, and version control with Amazon web service, Google Cloud, and Microsoft Azure. Data cleaning includes missing data with imputation, exclusion, and reporting depending on the nature and extent of the missing data, managing outliers with identification, treatment, and documentation, along with checking for errors with automated validations, manual review, and correction protocols. Data formatting includes standardization with file formats, variable naming, data coding, and preparation for analysis with normalization, metadata, and documentation.
The generated expression profiles for pre-miRNAs are from available publications in the GEO2R platform. The research consists of four parts. At first, we analyzed the control and MPTP groups. In the second part, we analyzed FVB-N control and MPTP. In the third part, we analyzed controls. In the fourth part, we analyzed MTPT separately. There are 29 microarrays like hybridizations of control FVB/N PFC, control FVB/N CPu, control S transgenics PFC, control S transgenics CPu, control R transgenics PFC, control R transgenic CPu, MPTP FVB/N PFC, MPTP FVB/N CPu, MPTP S transgenics PFC, MPTP S transgenics CPu, MPTP R transgenics PFC and MPTP R transgenic CPu mRNA. Neurotoxin MPTP causes PD pathology, and the first drug used for the treatment of PD was anti-cholinergic. For experimental analysis, MPTP is a neurotoxin for mice with or without the protective acetylcholinesterase (AChE-R) variant. Transgenic AChE-S (the synaptic variant), AChE-R (the shorter, protective variant), and FVB/N control mice are present in this study. Two brain regions are under investigation: the pre-frontal cortex (PFC) and the striatal caudate-putamen (CPu). For each condition, naive and MPTP-exposed mice are subject to research. In total, 29 samples are in the study. From that number, 18 participants are in PFC (S control = 4, S-MPTP = 2; R control = 4; R MPTP = 2; FVB/N Control = 4; FVB/N MPTP = 2) and 11 in CPU (S control = 2, S-MPTP = 2; R control = 2; R MPTP = 1; FVB/N Control = 2; FVB/N MPTP = 2).

Basic characteristics of samples.

In this equation, β0 is an intercept where all variables (treatment, strain, brain region) are at the baseline gene expression level without MPTP treatment; β1 represent the MPTP treatment, where positive values represent increase of gene expression level and negative decrease; β2 represent difference between strain gene expression differences; β3 represent gene expression differences in brain; β4 represent the interaction between treatment and strain on gene expression; β5 represents the interaction between treatment and brain region on gene expression; ϵ is an error term with random variation in gene expression not explained by the model, accounting for other factors affecting gene expression. This model enables direct and indirect understanding of the interaction between variables. Post-hoc analysis explores the nature of interactions, comparing the treatment effect with each level of the interacting variable, adjusted for multiple testing, and identifying specific subgroups with significant differences in gene expression. Visualization of subgroups and interaction effect with heatmaps enable gene expression visualization across diverse groups, while interaction plots graphically represent the interaction between treatment and other variables. The stratified analysis applies when significant interaction effects are detected. All these methodologies enable a comprehensive approach to investigate how different factors influence gene expression and how it influences across subgroups.
Missing data needs to be addressed with an initial assessment of the dataset and metadata to increase the robustness and validity of the analysis. Usually, missing data are under imputation and exclusion analysis. Data can replace the missing value with the mean of the observed data for a specific gene, reducing the variability of the results. The advanced computational method includes k-nearest neighbors, where data apply from the nearest neighbor, replacing missing values with a wide range of possible values. It is possible to exclude data from the analysis by decreasing the sample size, pairwise deletion where a specific data point is excluded in the complete analysis, or by investigating the sensitivity of missing data, ensuring a robust conclusion of the results. If the missing data is related to known factors, the data changes accordingly. By transparency and impact on the results, we address how missing data is handled if it exists, with a detailed description of missingness. The sampling strategy includes adjusting the oversampling of certain groups, analyzing data by sample design and using clustered data analysis, accounting for structure in the data, along with post-stratification adjusting estimates after data collection, and resample data to a sampling strategy testing the robustness of the results. The results are valid and generalizable, reflecting the investigated samples incorporated in the analysis.
Sensitivity analysis of the GSE31458 dataset assesses robustness to see if results remain consistent when key assumptions vary and to identify vulnerabilities to decisions regarding missing data or statistical methodology. Missing data can be handled in diverse ways (comparing the results obtained from multiple imputations in comparing to those with complete case analysis and using the varying imputation methodologies). Different statistical models are fitted with linear and mixed effect models to see if the choice of model changes the results. Including and excluding interactions to see if interactions have a significant influence. If the gene expression data have log transformation, comparison is done with other transformations or without to see if there are differences. Comparing diverse normalization methods could indicate similar results, including or excluding confounders and outliers with robust statistical analysis. Sample size consideration with subgroups and bootstrapping can lead to different results, thinking, and testing hypotheses. Sensitivity analysis enables the conclusion to be more robust and reliable.
Statistical analysis plan
The statistical plan includes some of the methodologies like descriptive statistics (Mean, Median, Mode), dispersion (Standard Deviation-SD, Interquartile Range (IQR) and Range), visualization (table, charts, graphics, heatmaps), Inferential statistics (t test, ANOVA, Chi-Square, Regression analysis, multivariate analysis including Manova, PCA and cluster analysis), Modeling with model selection (Linear regression, logistic regression, survival analysis), model assumption (linear, logistic and survival analysis), Testing assumption (residual analysis, multicolinearity, goodness of the fit). The statistical analysis of the downloaded data included GEO2R analysis. During the GEO2R analysis, Benjamini & Hochberg (False discovery rate) adjusts the p-value. The log transformation applies with autodetection (log2 and -log10) and limma precision without forced data normalization. A p-value is defined as significant or insignificant when p < .05. The same results are present by R software with R script. Software usage includes R, SPSS, SAS, Python, and bioinformatic tools. The steps in the analysis are present in the text.
Steps in the analysis of the datasets using R and bio-conductor tool include: 1. Downloading the raw file dataset GSE31458 and Supplemental files from the Gene Expression Omnibus database. 2. Set up analysis environment in R from CRAN website (https://cran.r-project.org/), and Bioconductor packages within the R. 3. Load Required Packages
4. Load and Preprocess the Data
5. Perform Differential Expression Analysis
6. Conduct Functional Enrichment Analysis

7. Visualization
Statistical power analysis
`RNASeqPower` or ‘pwr` tools in R calculate statistical power for detecting differentially expressed genes. In Functional Enrichment and Pathway Analysis, the concept of power doesn’t apply. If the differential expression analysis that generated the gene list had higher power, the gene list would likely be more accurate, leading to better pathway analysis results. The ability to detect overrepresented pathways depends on the size and accuracy of the input gene list, which is indirectly related to the power of your differential expression tests. In KEGG Pathway Analysis, there is no direct concept of power for pathway analysis. However, more accurate gene lists resulting from high-power statistical tests will improve the reliability of pathway analysis results. The statistical power primarily applies to the differential expression analysis that generates the results in these visualization and analysis techniques. If the power is high, the results of the volcano plot, functional enrichment, and pathway analyses will be more reliable.
Differential expression gene analysis
To calculate statistical power of differential gene expression analysis using statistical R software requires to calculate the statistical power of each test in this study focused on differential gene expression analysis using a small sample size, statistical power depends on factors like: 1. Sample size (n): The number of samples in each comparison group (e.g., MPTP-treated vs Control). 2. Effect size: The magnitude of the difference in gene expression levels between groups (commonly expressed as log2 fold change in RNA-Seq). 3. Significance level (α): The p-value threshold below which results are considered statistically significant (commonly set at 0.05). 4. Variability in the data: Variance or standard deviation in gene expression levels across samples. 5. Type of test: Whether a t test, ANOVA, or other statistical methods were used to test for differences.
The Steps for Power Calculation include: 1. Defining the parameters for the test: - - - - - 2. Use a power calculation formula or tool: - Software tools such as RNASeqPower or G*Power can be used. - Alternatively, the formula for the power of a two-sample t test (which is often used in gene expression studies) is as follows: - - n is the sample size per group. - - -

For example, if we want to calculate the power of detecting a log2 fold change of 1.5 in gene expression between MPTP-treated and control mice, with a standard deviation of 0.5 and sample size of 4 per group as in some of the groups in the dataset), a statistical power calculator or software will determine the statistical power.
To improve power, increasing the number of samples will directly increase statistical power. Adjusting the significance threshold, p < .1 instead of p < .05, increases power and the risk of false positives. Using variance-stabilizing transformations with RMA or GCRMA method can reduce variability and improve power. Adjustment for multiple testing, like applying corrections is essential to avoid Type I errors.
Calculate statistical power of differential gene expression analysis using statistical R software requires:
Install required packages and load the package
# Instal#
install.packages (“pwr”)
# Load:
library (pwr)
Check for function availability

Power analysis
a. Calculate Power by the use of `pwr.t.test` function for a t test and one sample group
b. Power analysis of two sample groups:

The CPU group has smaller sample sizes, particularly in the R MPTP group, where there is only 1 sample. Small sample sizes significantly reduce statistical power, which may make it difficult to detect significant differences unless the effect size is very large. This group includes a smaller sample size, suggesting the need to choose another test that is not a t test. Options for Small Sample Sizes include non-parametric tests, re-sampling methods, and simulating power. Non-parametric tests like the Wilcoxon rank-sum test (Mann-Whitney U test) can be more appropriate, but statistical power calculations for these tests can be complex and often require simulation-based approaches. Considering bootstrap methods to estimate confidence intervals for effect sizes and to approximate power. In cases where there is 1 sample in one of the groups, simulating datasets to estimate the power of your differential expression analysis can be helpful.
In the case of the CPU group, there is an error in t.test.default (bootstrap_control, bootstrap_mptp): data are essentially constant because the bootstrap procedure is resampling from a single value in the MPTP group (which only has one sample). As a result, the MPTP group doesn’t vary at all, making the t test unable to compute a meaningful result. To resolve this, utilize a different statistical method that doesn’t require variation in both groups or adjust the resampling approach to generate more variation in the MPTP group. Helpful in this analysis was adding small random noise (jitter) to the single value in the MPTP group, which creates variation in the data. This mimics the presence of additional data points without changing the overall structure. Here is how this study modifies the bootstrap procedure in R program:

The `jitter_sd` parameter introduces small random noise to the single value in the MPTP group, helping avoid the “constant data” problem. There is a bootstrap control, meaning that the control group is resampled as before to simulate variation. After multiple simulations, the power estimate is the proportion of p-values below the significance level (alpha). If jittering felt artificial, the study consider using a non-parametric test like the Wilcoxon Signed-Rank Test. Although this test also needs at least two values in each group, jittering might help simulate the scenario. The jittering approach introduces artificial variation in the single-value group, allowing to perform power estimation.This method is not perfect, but it provides a way to handle the extremely small sample size. For better results, larger sample sizes should be used in future experiments. c. power analysis for all other groups:

In this codes the function calculate_power computes the power for a two-sample t test given the sample sizes and other parameters. The loop iterates through each brain region and calculates the power for each relevant comparison.
Following these steps the statistical power can be calculated with high accuracy, adjusting the parameters based on the specific comparisons and data.
Interpreting results
The study interprets top differentially expressed genes with fold change, p-value, and biological relevance, as well as GO and pathway enrichment analysis of biological processes and pathways with comprehensive analysis. Interpretation of the results presents the need for a balance of statistical analysis, effect size, and contextualization of findings with scientific literature. Statistical significance is present in a p-value less than 0.05 and a 95% confidence interval. The effect of sizes is present in log fold change, enrichment scores, Cohen’s d, and contextualization. The study made comparisons with previous studies and was consistent with theoretical expectations. The study limitations discussion relies on the potential biases, confounding factors, technical limitations, and generalizability. Interpretation of the results includes descriptive statistics, differential expression analysis (top differentially expressed genes with volcano plot and results table with gene ID symbol, logFC, p.value, adj.p value where logFC = 2.5 and adj.P.Val = 0.01 indicates high upregulation in the treatment group), functional enrichment analysis with gene ontology (GO) enrichment with a list of GO terms with associated p values, pathway analysis with a list of pathways with p-values and several genes involved, visualization with volcano plot and heatmap.
Validation and sensitivity analysis
The paper validates the key findings using a separate dataset. If they show similar patterns, alternative methods like cross-validation apply. Independent data validation includes external datasets, cross-validation, biological validation with experiments, and functional analysis. Sensitivity analysis contains parameter variation and assumption testing, such as the threshold for differential expression, re-evaluating results under different assumptions by varying cutoff, subsample analysis, alternative normalization methods, and model assumption checks.
Ethical and regulatory compliance
Data privacy, conflict of interest, and transparency are addressed within the manuscript to ensure relevant data protection of laws and regulations such as the General Data Protection Regulation (GDPR) in the European Union or the Health Insurance Portability and Accountability Act (HIPAA) in the United States. Anonymization and De-identification ensure the removal of all identification that could be identified and connected. This paper clearly outlines who has data access and sharing. Conflict of interest includes potential conflict disclosure, which includes financial, personal, or professional relationships and managing this part of the manuscript. Data and the code used are transparent, contributing to the open science movement, making data deposits in public repositories, and sharing code.Ethical and regulatory compliance is fundamental to the integrity and credibility of scientific research by standards that apply and contribute value to the scientific community worldwide. Research acknowledges the ethical use of publicly available data with informed consent of participants. This study applies secondary data from a manuscript where the author ensured that the GEO data repository adheres to ethical guidelines requiring informed consent from participants when they are initially collected. Secondary analysis is available from shared public data. The original data source is cited in the paper, enabling the proper transparency with data accession number, dataset, platform, and relevant publication, enabling transparency, reproducibility, and accountability while considering institutional policies and ethical reflection of public datasets. All the procedures that contributed to the analysis and interpretation of the data did not need to be accepted by the ethics committee, given that we are working with public data. It does not work with the biological material of the subjects, so there is no need to be approved by the National Medical Ethics Committee. Data collection was from the following sources: gene expression omnibus database published results and preliminary findings. The study generates RNA molecules, molecular networks, and interactions in silico. The Animal Research: Reporting of In Vivo Experiments (ARRIVE) Guidelines Checklist applies in the manuscript.
Results
The study involved 29 samples with different mouse strains and treatments from the GSE31458 dataset from the GEO database, where all 29 samples passed initial screening for eligibility. A total of 29 samples were separated into two main groups. The first PFC group includes S-control (4 samples), S-MPTP (2 samples), R control (4 samples), R MPTP (2 samples), FVB/N Control (4 samples), FVV/N MPTP (2 samples). The second CPU group includes S-control (2 samples), S-MPTP (2 samples), R control (2 samples), R MPTP (1 sample), FVB/N Control (2 samples), FVV/N MPTP (2 samples). Since the GSE31458 dataset is from a completed experimental study, no follow-up is required, so we analyzed 29 samples of gene expression data, assessing the differential expression and conducting further pathway and enrichment analysis. There were no instances of non-participation at any stage. This data provides transparency and clarity on how many samples were available at each study stage.
Demographic characteristic information includes details about the strain, treatment, and analyzed brain region, which in the study include susceptible S strain to the neurotoxic effect of MPTP, resistant R strain to MPTP, and FVB/N strain used in various genetic and biomedical research and neutral to MPTP exposure. In the control group, we have mice without MPTP treatment (n = 14) and an MPTP-treated group that induced PD by destroying the dopaminergic neurons (n = 15). Analyzed brain regions have different physiological roles. PFC regions influence complex cognitive behavior, personality expression, decision-making, and moderate social behavior. The CPU region is a part of the basal ganglia involved in the motor processes and affects the dopamine system in PD research studies. MPTP is a neurotoxin that causes PD by degradation of the dopamine neurons. As mentioned above, potential confounders are strain and brain region differences and environmental factors affecting the baseline gene expression, although environmental factors in the datasets are missing. Missing data for each strain, treatment group, brain region, and gene expression level is 0. There are no missing data for each group.
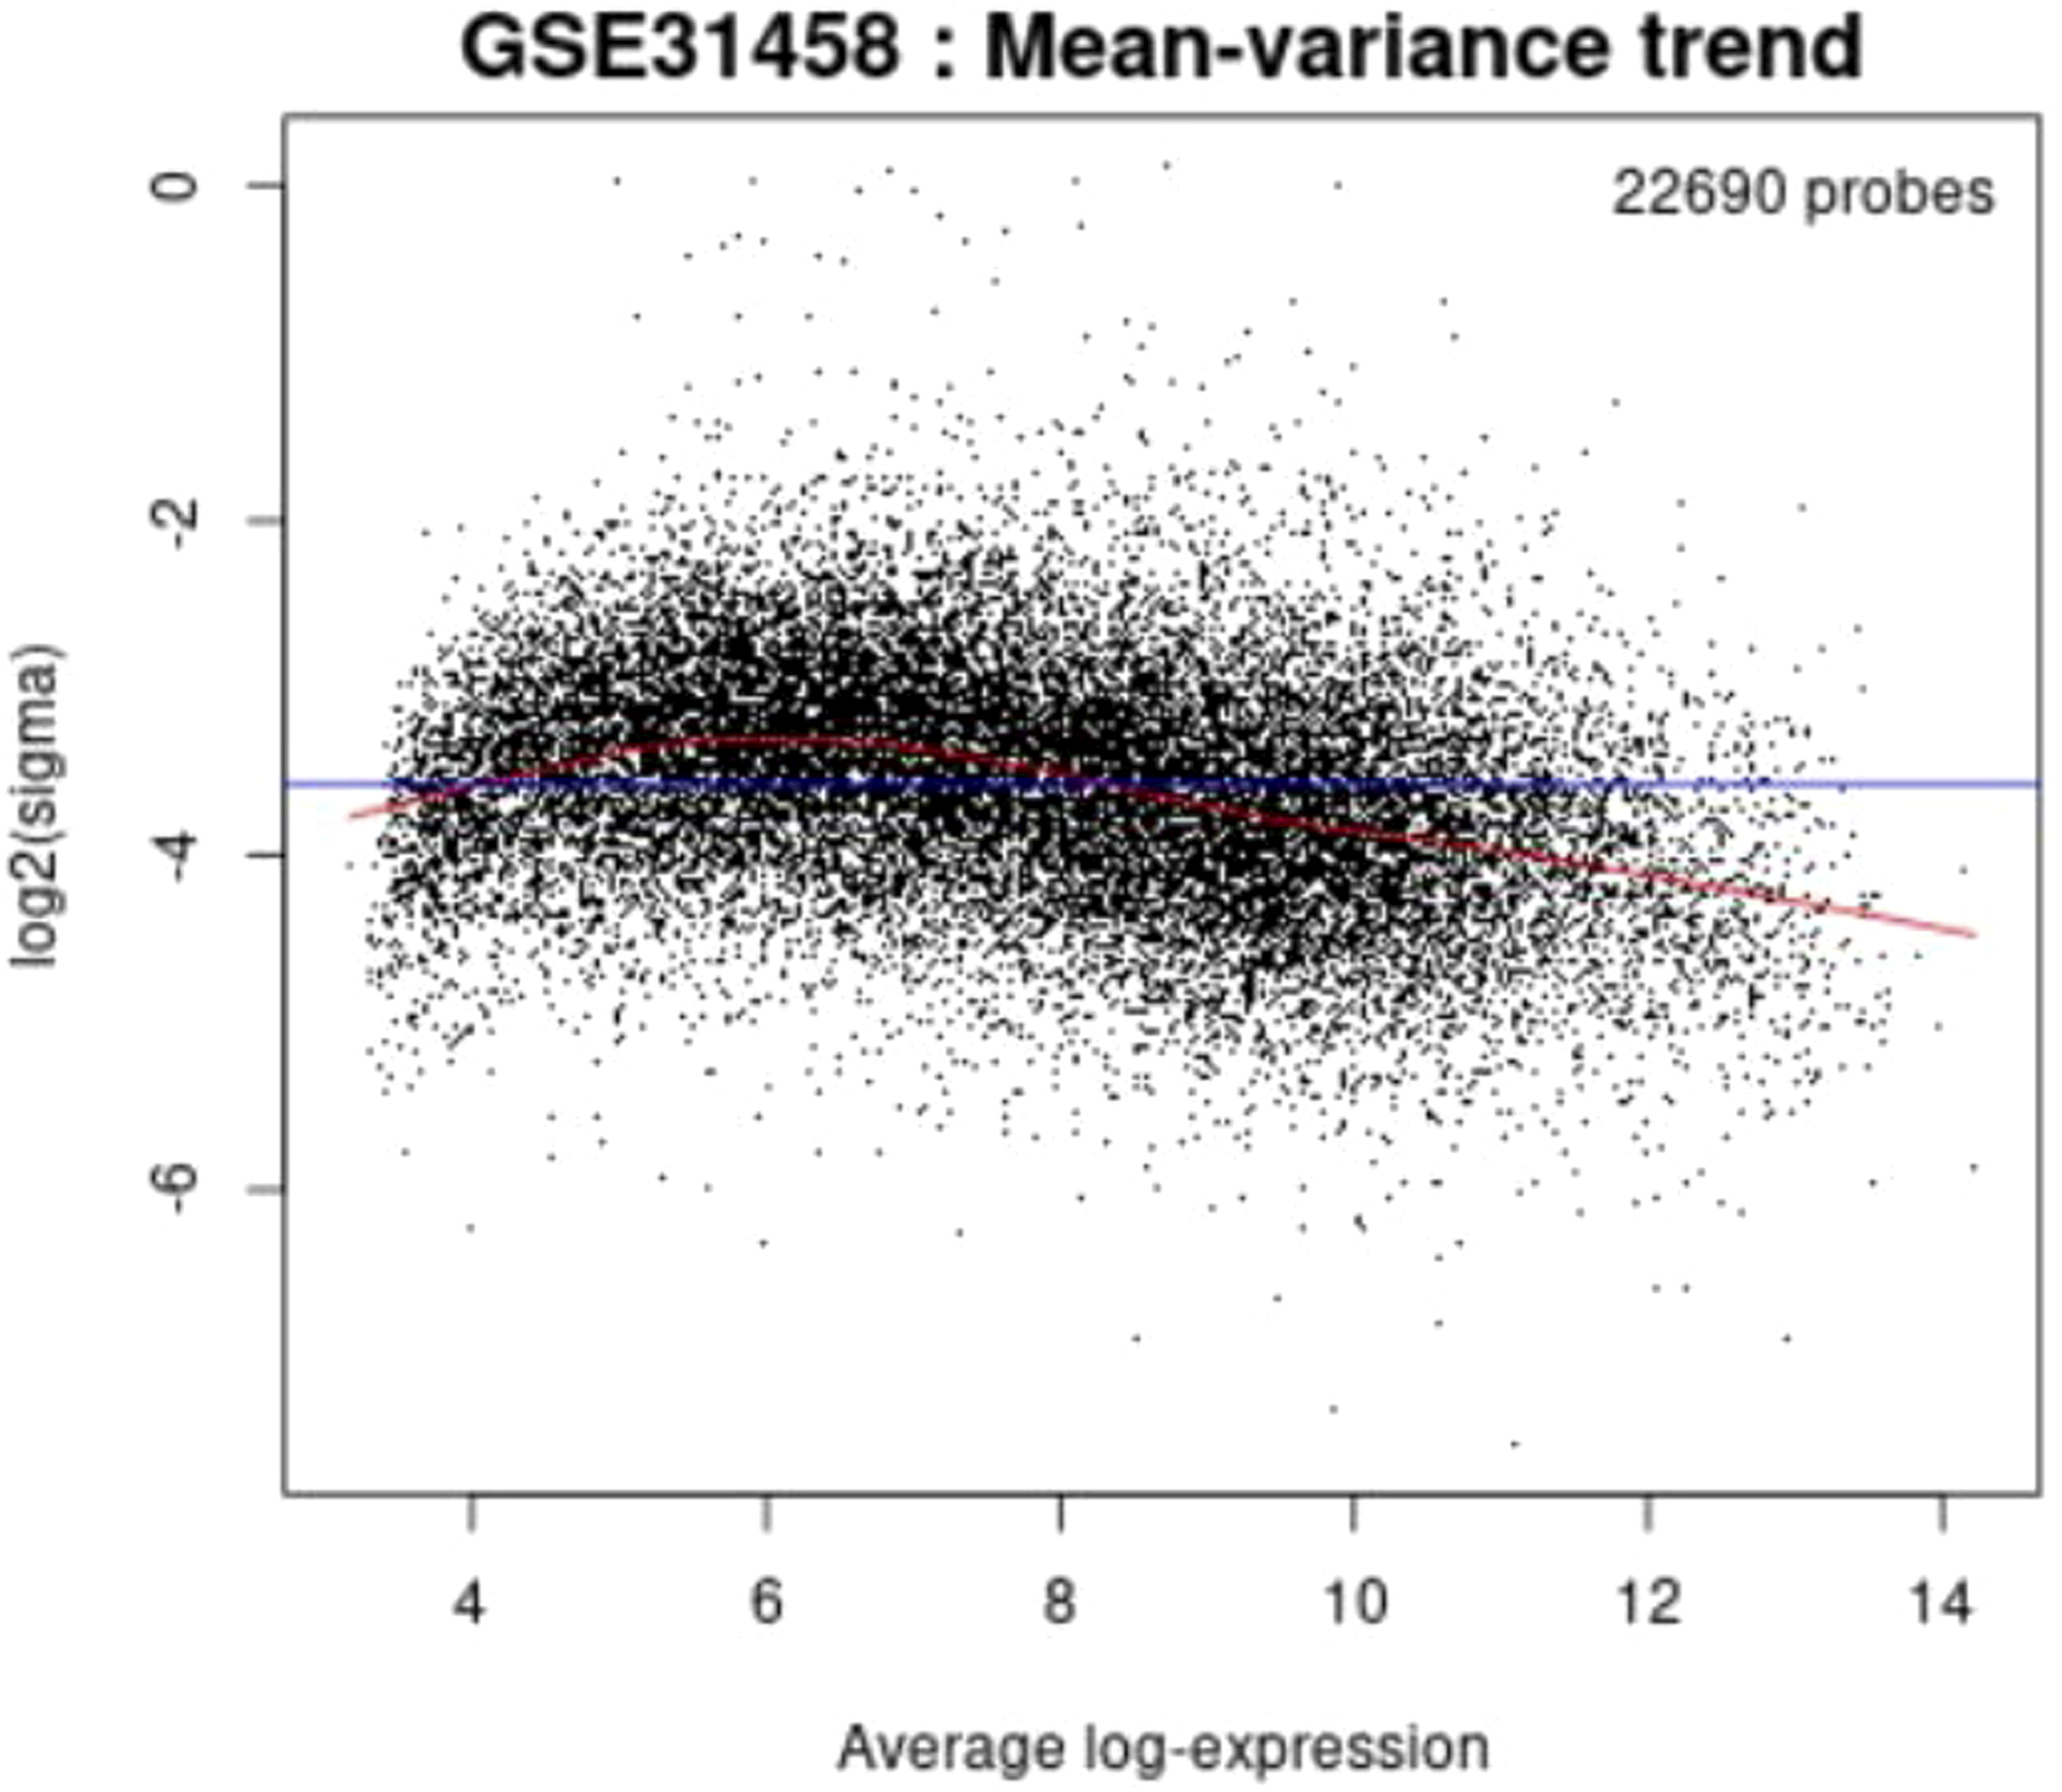
GEO2R analysis showed results of RNA molecule through the UMAP plot, Boxplot, Expression density plot, and Mean-Variance trend plot with graphical values and the difference between the disease and the control group. We identified differentially expressed genes between the experimental conditions. The analysis has ground in the R programming language, which contains the limma R package (Linear Models for Microarray Analysis). Results evaluate differentially expressed genes in a fast and efficient manner. Four summary data for each sample are available in Boxplot data, presented in Figures. GEO2R analysis showed significant total RNA molecules through the volcano plot (log2-fold change; -log10) and mean significance plot, whose values are expressed graphically in Tables. The form of a boxplot, expression density plot, mean-variance trend plot, statistic quantile-quantile plot, and UMAP plot shows the difference between groups.
We compare the data of the four groups by the GEO2R analysis to identify genes differentially expressed between the experimental conditions. We presented results as a table of genes based on statistical significance and a graph that allows visualization of expressed genes in Supplemental files 1-4. The analysis base is the R programming language, which contains the limma R package (Linear Models for Microarray Analysis) to evaluate differentially expressed genes. We obtained the results in a fast and efficient manner. We present the results as a table with all RNA signatures in the murine sample groups. The smallest p-value indicates the highest statistical significance. The lowest and highest p-values are present. A list of RNA molecules is in the Supplemental files 1-4 files. To further analyze the data set of incriminated and researched molecules and evaluate the data quality. The results are present in the form of a graph with the help of the limma package (volcano plot) and statistical significance (-log10 p value) concerning the strength of the change (log2 fold change) for the visualization of differently expressed RNAs.
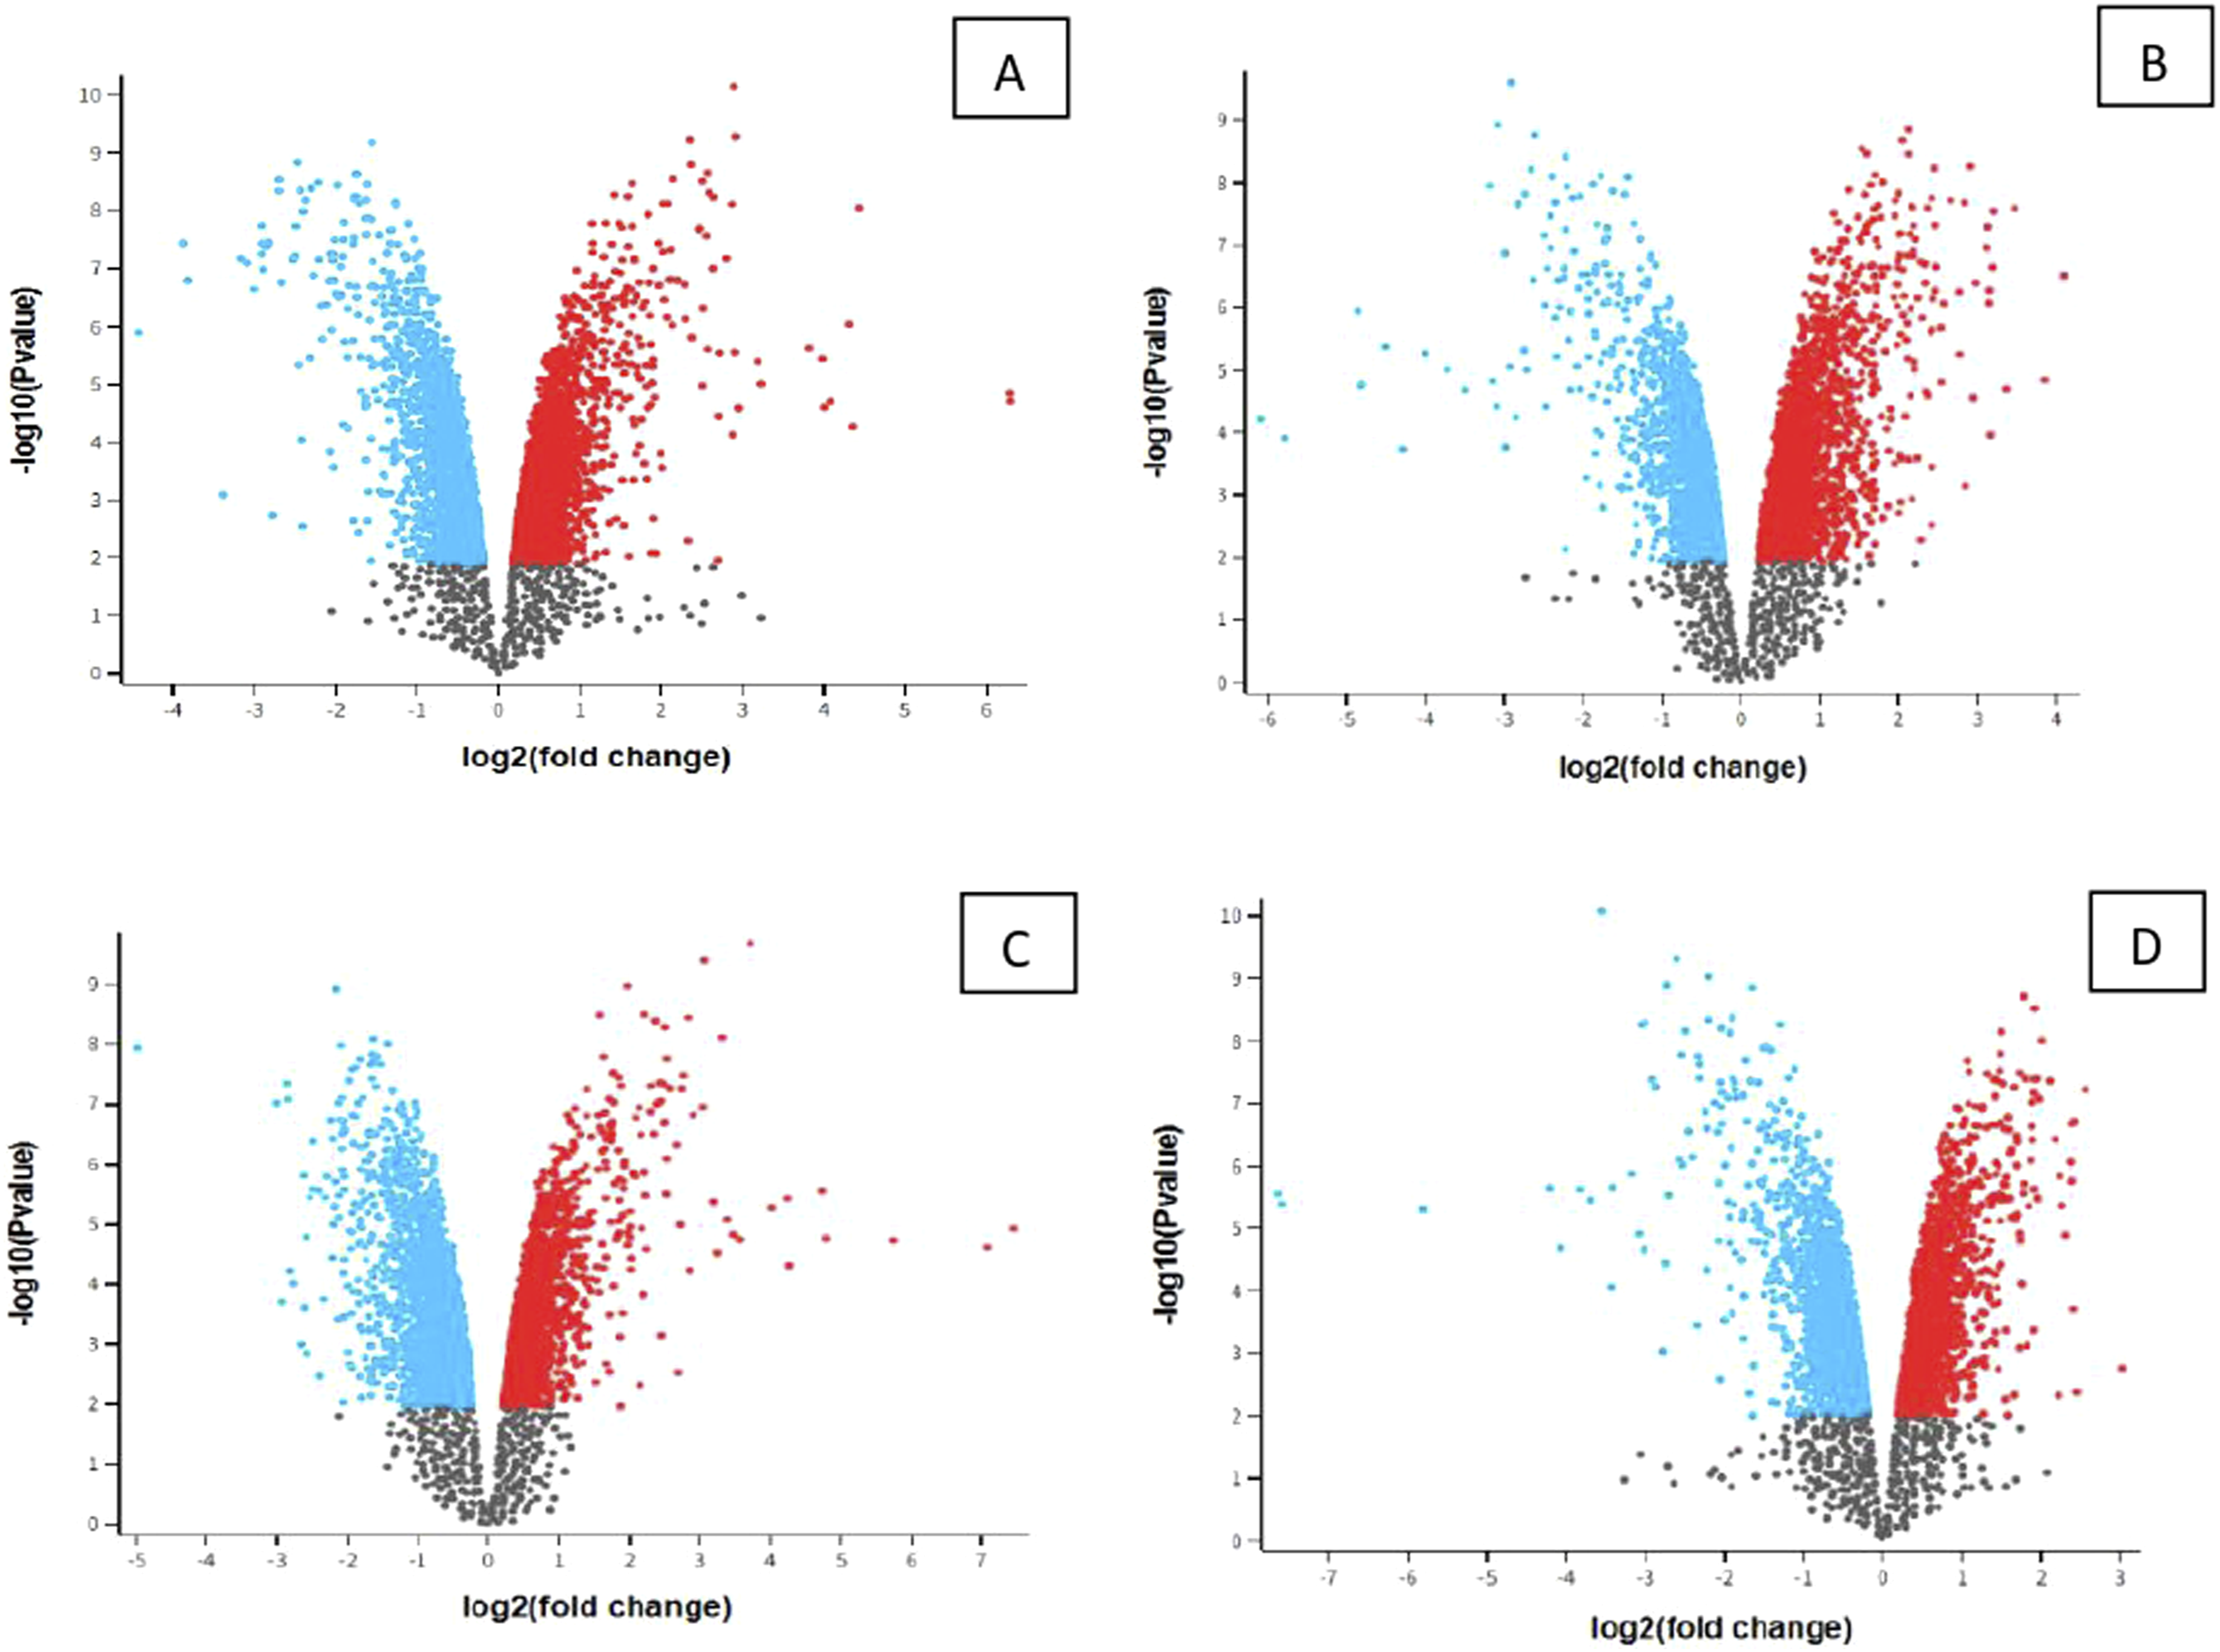
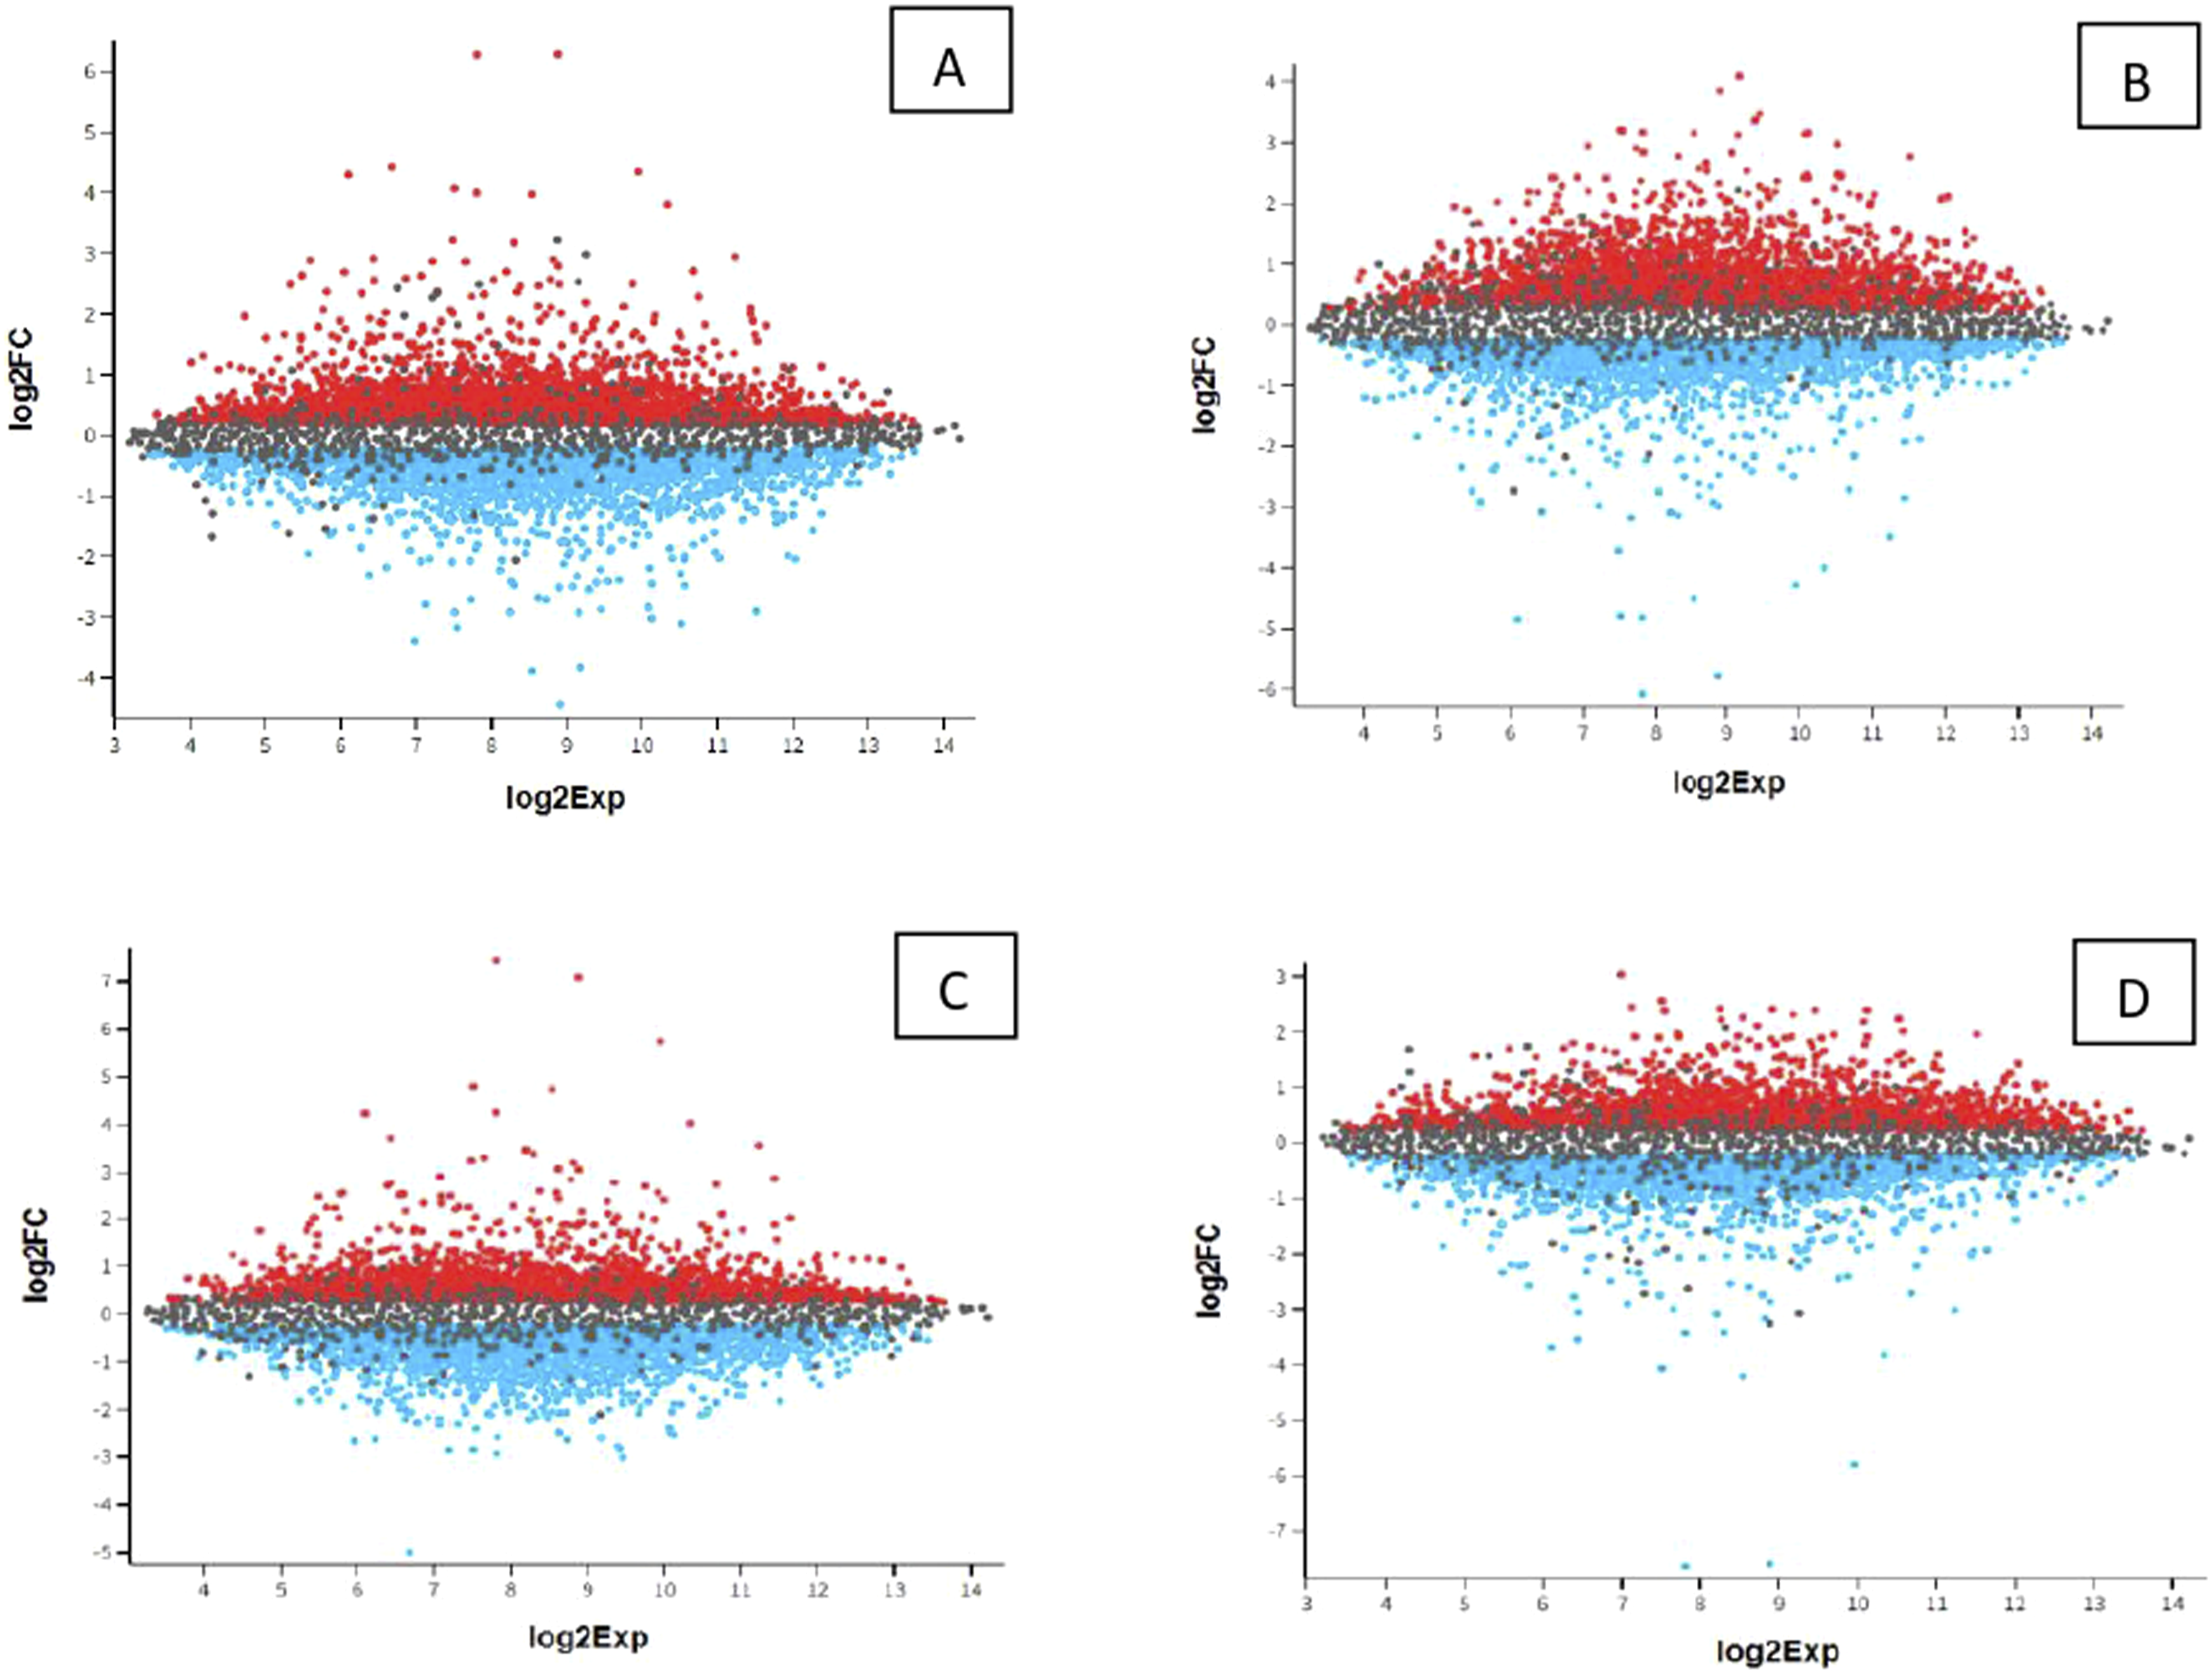
Significant expressed genes have an adjusted p-value set of 0.05 (red = upregulated, blue = downregulated). Sample groups are compared and presented in Figures 1–4. The difference between upstream and downstream-regulated RNAs is present in this case. Groups of the significant genes are present with notable genes in Table 1–4, with values and their location marked in Figures 1–4. Results are separated based on the analysis type to Volcano plot, Mean difference plot, UMAP plot, Venn diagram, Boxplot, Expression density plot, p-value histogram, T-statistic quantile-quantile plot, Mean-variance trend plot between four sample groups. Volcano plot of expression data. (A) PFC S MPTP versus PFC R control; (B) PFC S control versus PFC S MPTP; (C) PFC R MPT versus CPU S control; (D) CPU R MPTP versus PFC S control; (E) PFC R control versus PFC R MPT; (F) CPU S MPTP versus CPU R control; (G) CPU S control versus CPU S MPTP; (H) CPU R control versus CPU R MPTP; significant genes are present in all groups, except for H. List of significant genes are present in Table 1(A-H). Volcano plot of expression data. (A) CPU FVB-MPTP versus PFC FVB-N control; (B) PFC FVB-MPTP versus CPU FVB-MPTP; (C) CPU FVB-N control versus PFC FVB-N MPTP; (D) PFC FVB-N control versus CPU FVB-N control. A list of significant genes is present in Table 2(A-D). Volcano plot of expression data. (A) CPU FVB-N control versus PFC S control; (B) PFC S control versus PFC R control; (C) CPU R control versus PFC FVB-N control; (D) PFC FVB-N control versus CPU FVB-N control; (E) CPU S control versus CPU R control. Significant genes exist in all groups. A list of notable genes is present in Table 3(A-E). Volcano plot of expression data. (A) PFC S MPTP versus CPU FVB MPTP; (B) CPU FVB MPTP versus CPU FVB MPTP; (C) PFC R MPTP versus CPU S MPTP; (D) CPU R MPTP versus PFC FVB MPTP; (E) CPU S MPTP versus CPU R MPTP. Significant genes exist in all groups. A list of notable genes is present in Table 3(A–E).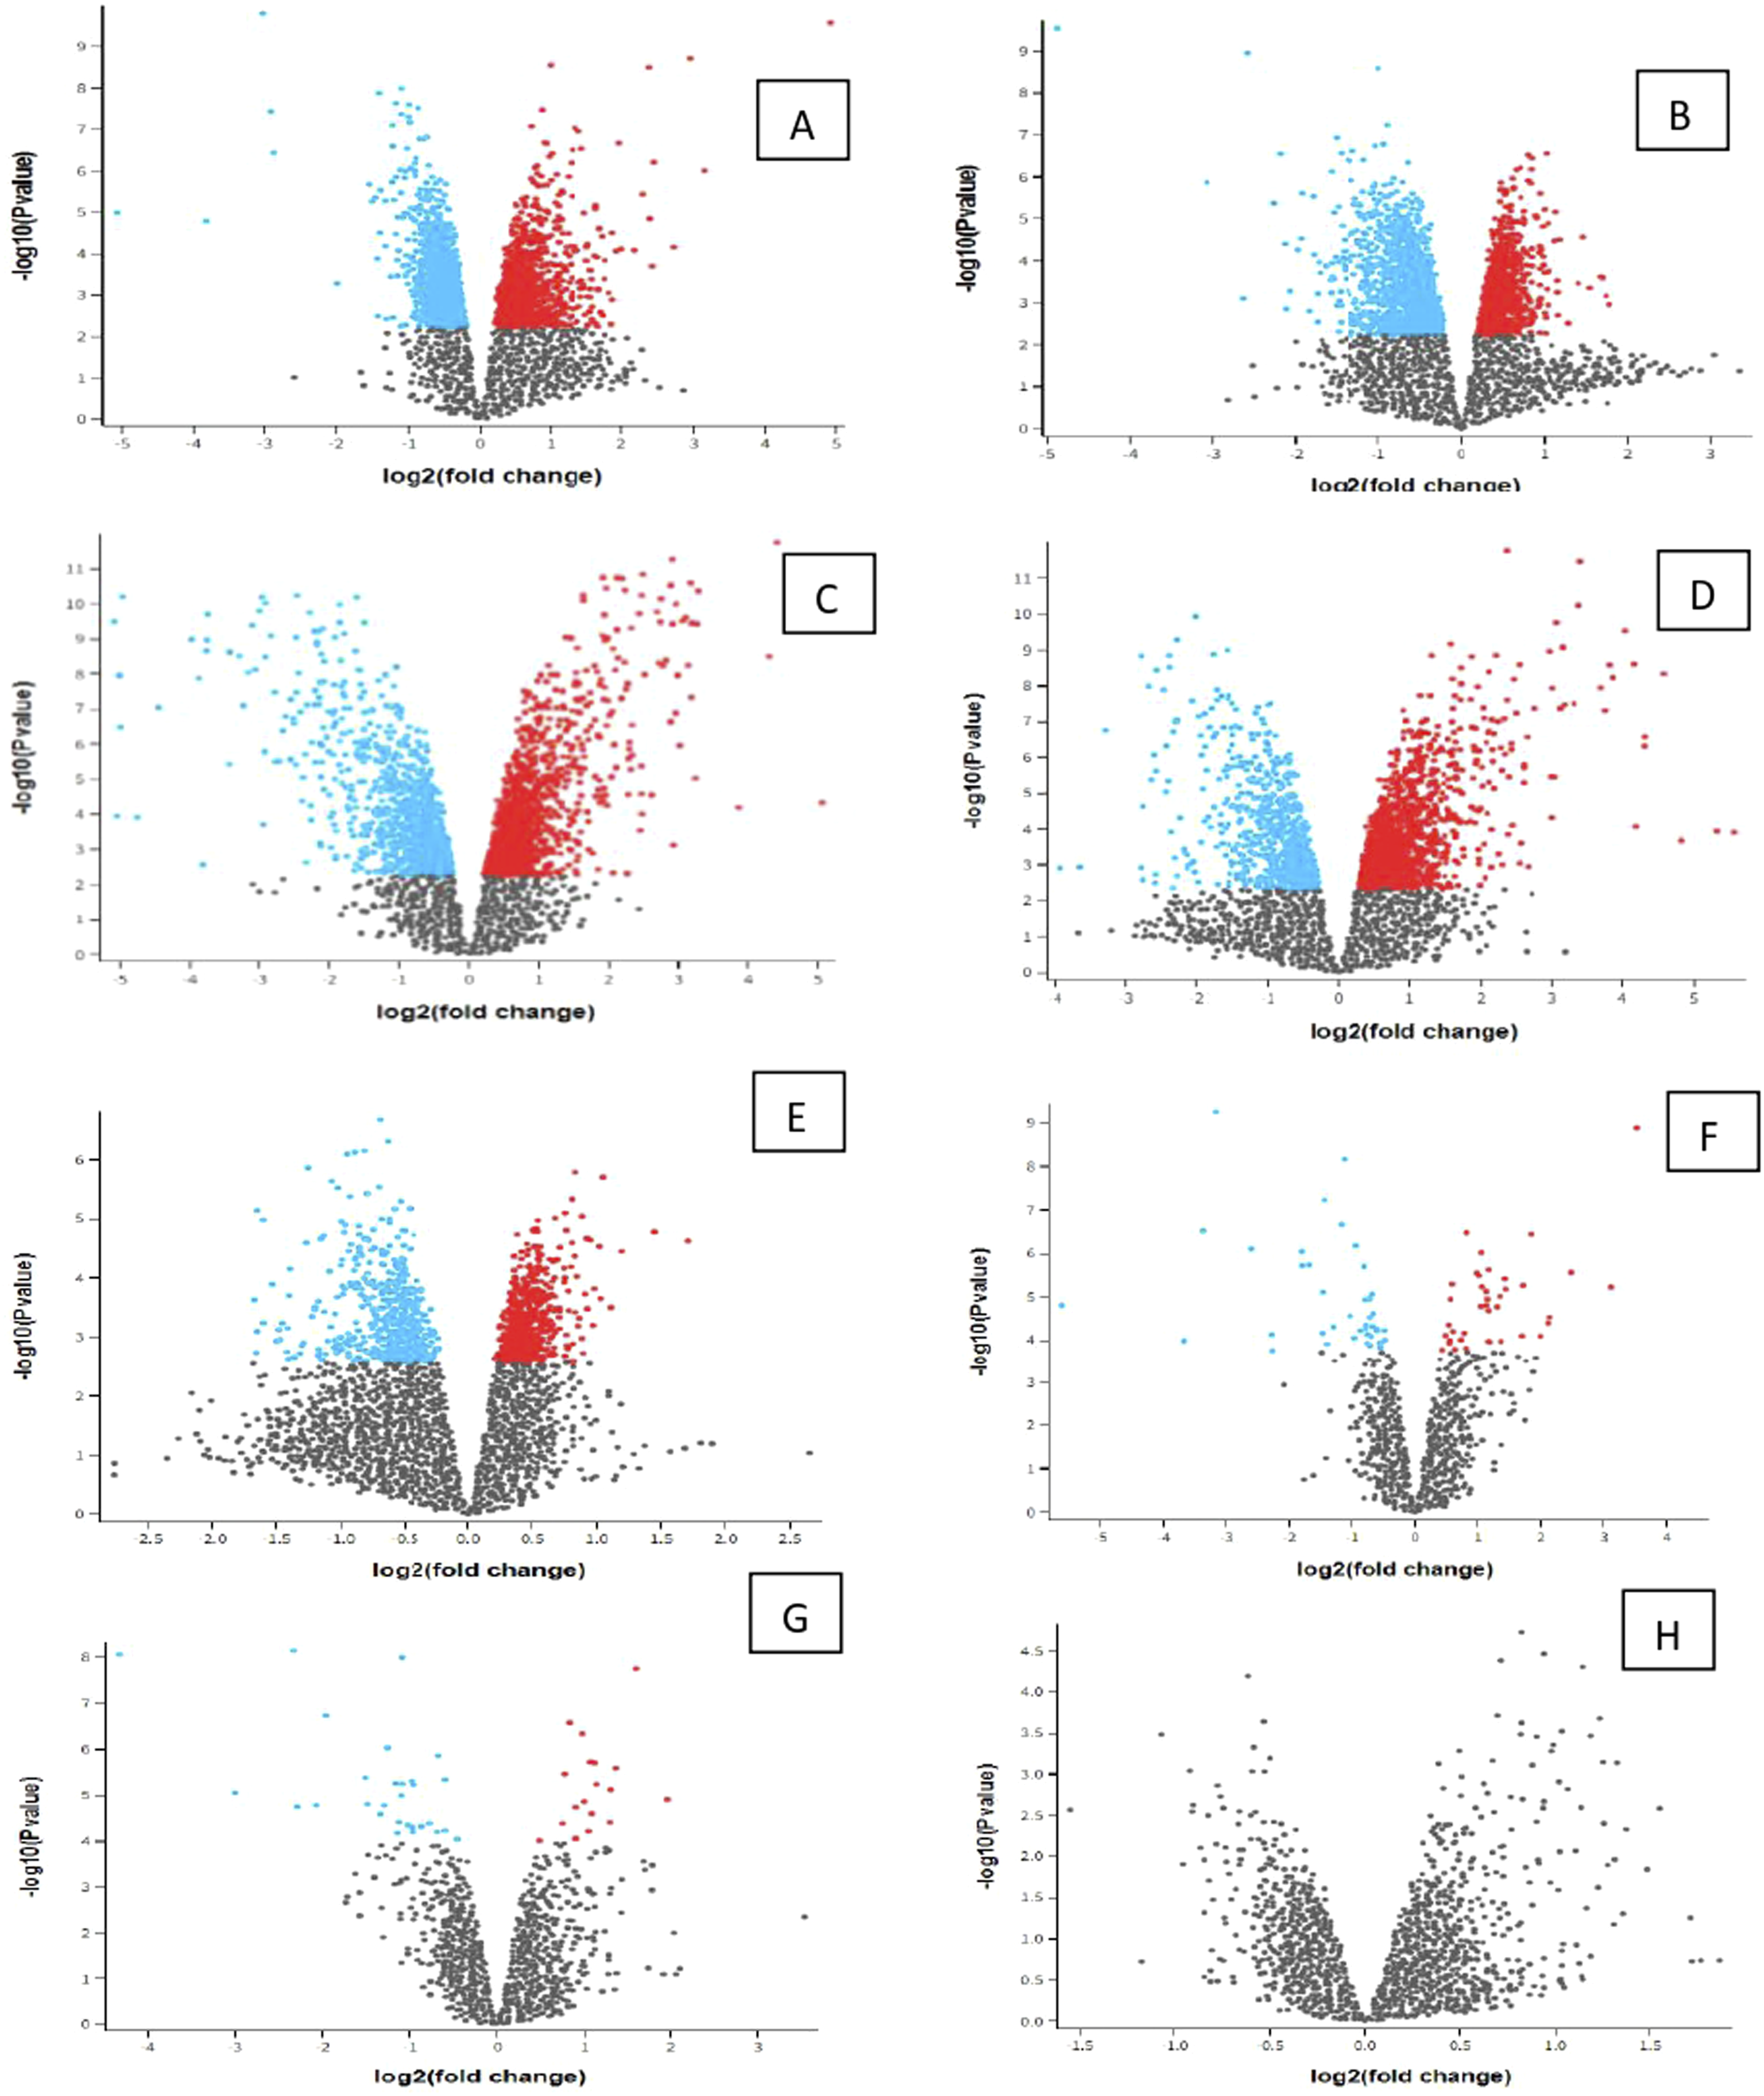


Volcano plot
First group samples (control, MPTP)
We compared GSE31458 from GEO2R samples PFC S Control = 4; PFC S MPTP = 2; PFC R Control = 4; PFC R MPTP = 2 and control CPU S Control = 2; CPU S MPTP = 2; CPU R Control = 2; CPU R MPTP = 1. The total number of participants in this compared group is 19. There is no match between the number of participants in every complementary group. Volcano plot of expression data from naïve and MPTP-exposed cholinergic transgenic mice samples for the first group are present in Figure 1 Group of significant genes are in all groups except for H. List of notable genes is in Table 1(A-H).
Second group samples (FVB-ncontrola and MPTP)
In the second group, we place samples (PFC FVB-N Control; PFC FVB-MPTP; PFC FVB-N MPTP; PFC FVB-N Control) and control (CPU FVB-MPTP; CPU FVB-MPTP; CPU FVB-N Control; CPU FVB-N Control). Volcano plots of expression data from naïve and MPTP-exposed cholinergic samples for the second group are present in Figure 2, where significant genes are present in all groups. A list of detected genes is in Table 2(A-D).
Third group samples (control)
Samples in this third group contain control participants: PFC S Control; PFC R Control; PFC FVB N Control; CPU S Control; CPU R Control; CPU FVB N Control. Volcano plots of expression data from naïve and MPTP-exposed cholinergic transgenic mice samples for the third group are present in Figure 3, where significant genes exist in all groups. A list of notable genes is in Table 3(A-E).
Fourth group samples (separated MTPT)
The fourth data analysis included the MPTP group and samples: PFC S MPTP, PFC R MPTP, PFC FVB N MPTP, CPU S MPTP, CPU R MPTP, and CPU FVB N MPTP. Volcano plots of expression data from naïve and MPTP-exposed cholinergic transgenic mice samples for the fourth group are present in Figure 4. Significant genes exist in all groups. A list of notable genes is in Table 3(A-E).
Mean difference plot
We created a Mean Difference plot (MD) using the limma package. MD shows the log2 fold change versus the average lod2 expression value and is used to manifest differentially expressed total RNA molecules. The value used for data selection is p < .05. Figures 5–8 shows the contrast between healthy and disease, while Tables 1–4 shows the most significant total RNAs and their values that completely match the values and analysis shown using the volcano plot. The difference between upstream and downstream-regulated total-RNA molecules is present in this case. We notice significant genes when comparing groups. Values are identical to the above image and analysis. Values further confirm the finding of notable RNA molecules in a murine mouse model. The mean difference plot validates the same thing as the Volcano plot in all four groups. Mean difference plot of expression data. (A) PFC S MPTP versus PFC R control; (B) PFC S control versus PFC S MPTP; (C) PFC R MPT versus CPU S control; (D) CPU R MPTP versus PFC S control; (E) PFC R control versus PFC R MPT; (F) CPU S MPTP versus CPU R control; (G) CPU S control versus CPU S MPTP; (H) CPU R control versus CPU R MPTP; significant genes are present in all groups, except for H. A list of significant genes is present in Table 1(A–H). Mean difference plot of expression data. (A) CPU FVB-MPTP versus PFC FVB-N control; (B) PFC FVB-MPTP versus CPU FVB-MPTP; (C) CPU FVB-N control versus PFC FVB-N MPTP; (D) PFC FVB-N control versus CPU FVB-N Control. Significant genes exist in all groups. A list of notable genes is present in Table 2(A–D). Mean difference plot of expression data. (A) CPU FVB-N control versus PFC S Control; (B) PFC S control versus PFC R control; (C) CPU R control versus PFC FVB-N control; (D) PFC FVB-N control versus CPU FVB-N control; (E) CPU S control versus CPU R control; significant genes exist in all groups. A list of significant genes is present in Table 3(A-E). Mean difference plot of expression data. (A) PFC FSB MPTP versus CPU FVB MPTP; (B) CPU FVB MPTP versus PFC S MPTP; (C) PFC R MPTP versus CPU S MPTP; (D) CPU R MPTP versus PFC FVB MPTP; (E) CPU S MPTP versus CPU R MPTP; (F) PFC S MPTP versus PFC R MPTP; significant genes exist in all groups. A list of significant genes is present in Table 4(A-F).


First group samples (control, MPTP)
Significant genes are present in all groups except for H. A List of notable genes is in Table 1(A-H). Figure 5 shows the mean difference plot of expression data for PFC S MPTP versus PFC R Control; PFC S Control versus PFC S MPTP; PFC R MPT versus CPU S Control; CPU R MPTP versus PFC S Control; PFC R Control versus PFC R MPT; CPU S MPTP versus CPU R Control; CPU S Control versus CPU S MPTP; CPU R Control versus CPU R MPTP.
Second group samples (FVB-ncontrola and MPTP)
Figure 6 shows the mean difference plot of expression data for CPU FVB-MPTP versus PFC FVB-N Control; PFC FVB-MPTP versus CPU FVB-MPTP; CPU FVB-N Control versus PFC FVB-N MPTP; PFC FVB-N Control versus CPU FVB-N Control. Significant genes exist in all groups. A list of notable genes is present in Table 2(A-D).
Third group samples (control)
Figure 7 shows the mean difference plot of expression data for CPU FVB-N Control versus PFC S Control; B) PFC S Control versus PFC R Control; C) CPU R Control versus PFC FVB-N Control.; D) PFC FVB-N Control versus CPU FVB-N Control; E) CPU S Control versus CPU R Control; Significant genes exist in all groups. A list of significant genes is present in Table 3(A-E).
Fourth group samples (separated MTPT)
Figure 8 shows the mean difference plot of expression data for PFC FSB MPTP versus CPU FVB MPTP; CPU FVB MPTP versus PFC S MPTP; PFC R MPTP versus CPU S MPTP; CPU R MPTP versus PFC FVB MPTP; CPU S MPTP versus CPU R MPTP; PFC S MPTP versus PFC R MPTP; Significant genes exist in all groups. A list of significant genes is present in Table 4(A-F).
Venn diagram
Venn diagram confirmed the Volcano and Mean significance plot regarding the most significant gene based on sample groups shown in Figures 9–12. The list of the notable genes is present when comparing the group of samples with the limma package and volcano plot with the matches for the values from the Table from the Volcano plot analysis. Since these genes are significant in both cases and the Venn diagram, the expression value in the samples was determined and shown in the Figure below in all four groups. Venn diagram. Significant genes between groups are present. Venn diagram showed no significant genes between CPU R control vs CPU R MPTP. However, a significant 2738 genes exist between PFC S MPTP vs PFCR control. No matching genes are present between the two groups. p < 0.05 Venn Diagram shows significant genes. Venn diagram. 103262 genes between PFC R Control VS CPU S Control and 8 genes between CPU S Control VS CPU R Control exist. There are 66 matching genes between these comparing groups. Venn diagram. 8510 genes between PFC FVB MPTP vs CPU FVB MPTP and 311 genes between PFC S MPTP vs PFCR R MPTP. There are 297 notable matching genes between these comparing groups.


First group samples (control, MPTP)
Figure 9 shows the Venn diagram. Significant genes between groups are present. No significant genes exist on the Venn diagram when comparing CPU R Control versus CPU R MPTP. However, 2738 significant genes exist between PFC S MPTP versus PFCR Control. No matching genes are present between the two groups. p < .05.
However, the above comparison is not enough, although it is good. Because of that, we started with an individual, separate, and complementary comparison between groups and showed it on a Venn diagram in Figure 13. The comparison shows matching genes for PFC S Control versus PFC S MPTPT (353 genes), PFC R control versus PFC S Control (27 genes), PFC S MPTP versus PFC R MPTP (235 genes), CPU S Control versus CPU S MPTPT (69 genes) and CPU R control versus CPU S Control (156 genes) and absence of matching genes for PFC R Control versus PFC R MPTPT, CPU R Control versus CPU R MPTPT and CPU S MPTP versus CPU R MPTP. Separate comparisons between groups, Venn diagram. (A) PFC S Control versus PFC S MPTPT (353 genes); (B) PFC R Control versus PFC R MPTPT (0 genes); (C) PFC R control versus PFC S Control (27 genes); (D) PFC S MPTP versus PFC R MPTP (235 genes); (E) CPU S control versus CPU S MPTPT (69 genes); (F) CPU R Control versus CPU R MPTPT (0 genes); (G) CPU R control versus CPU S control (156 genes); (H) CPU S MPTP versus CPU R MPTP (0 genes).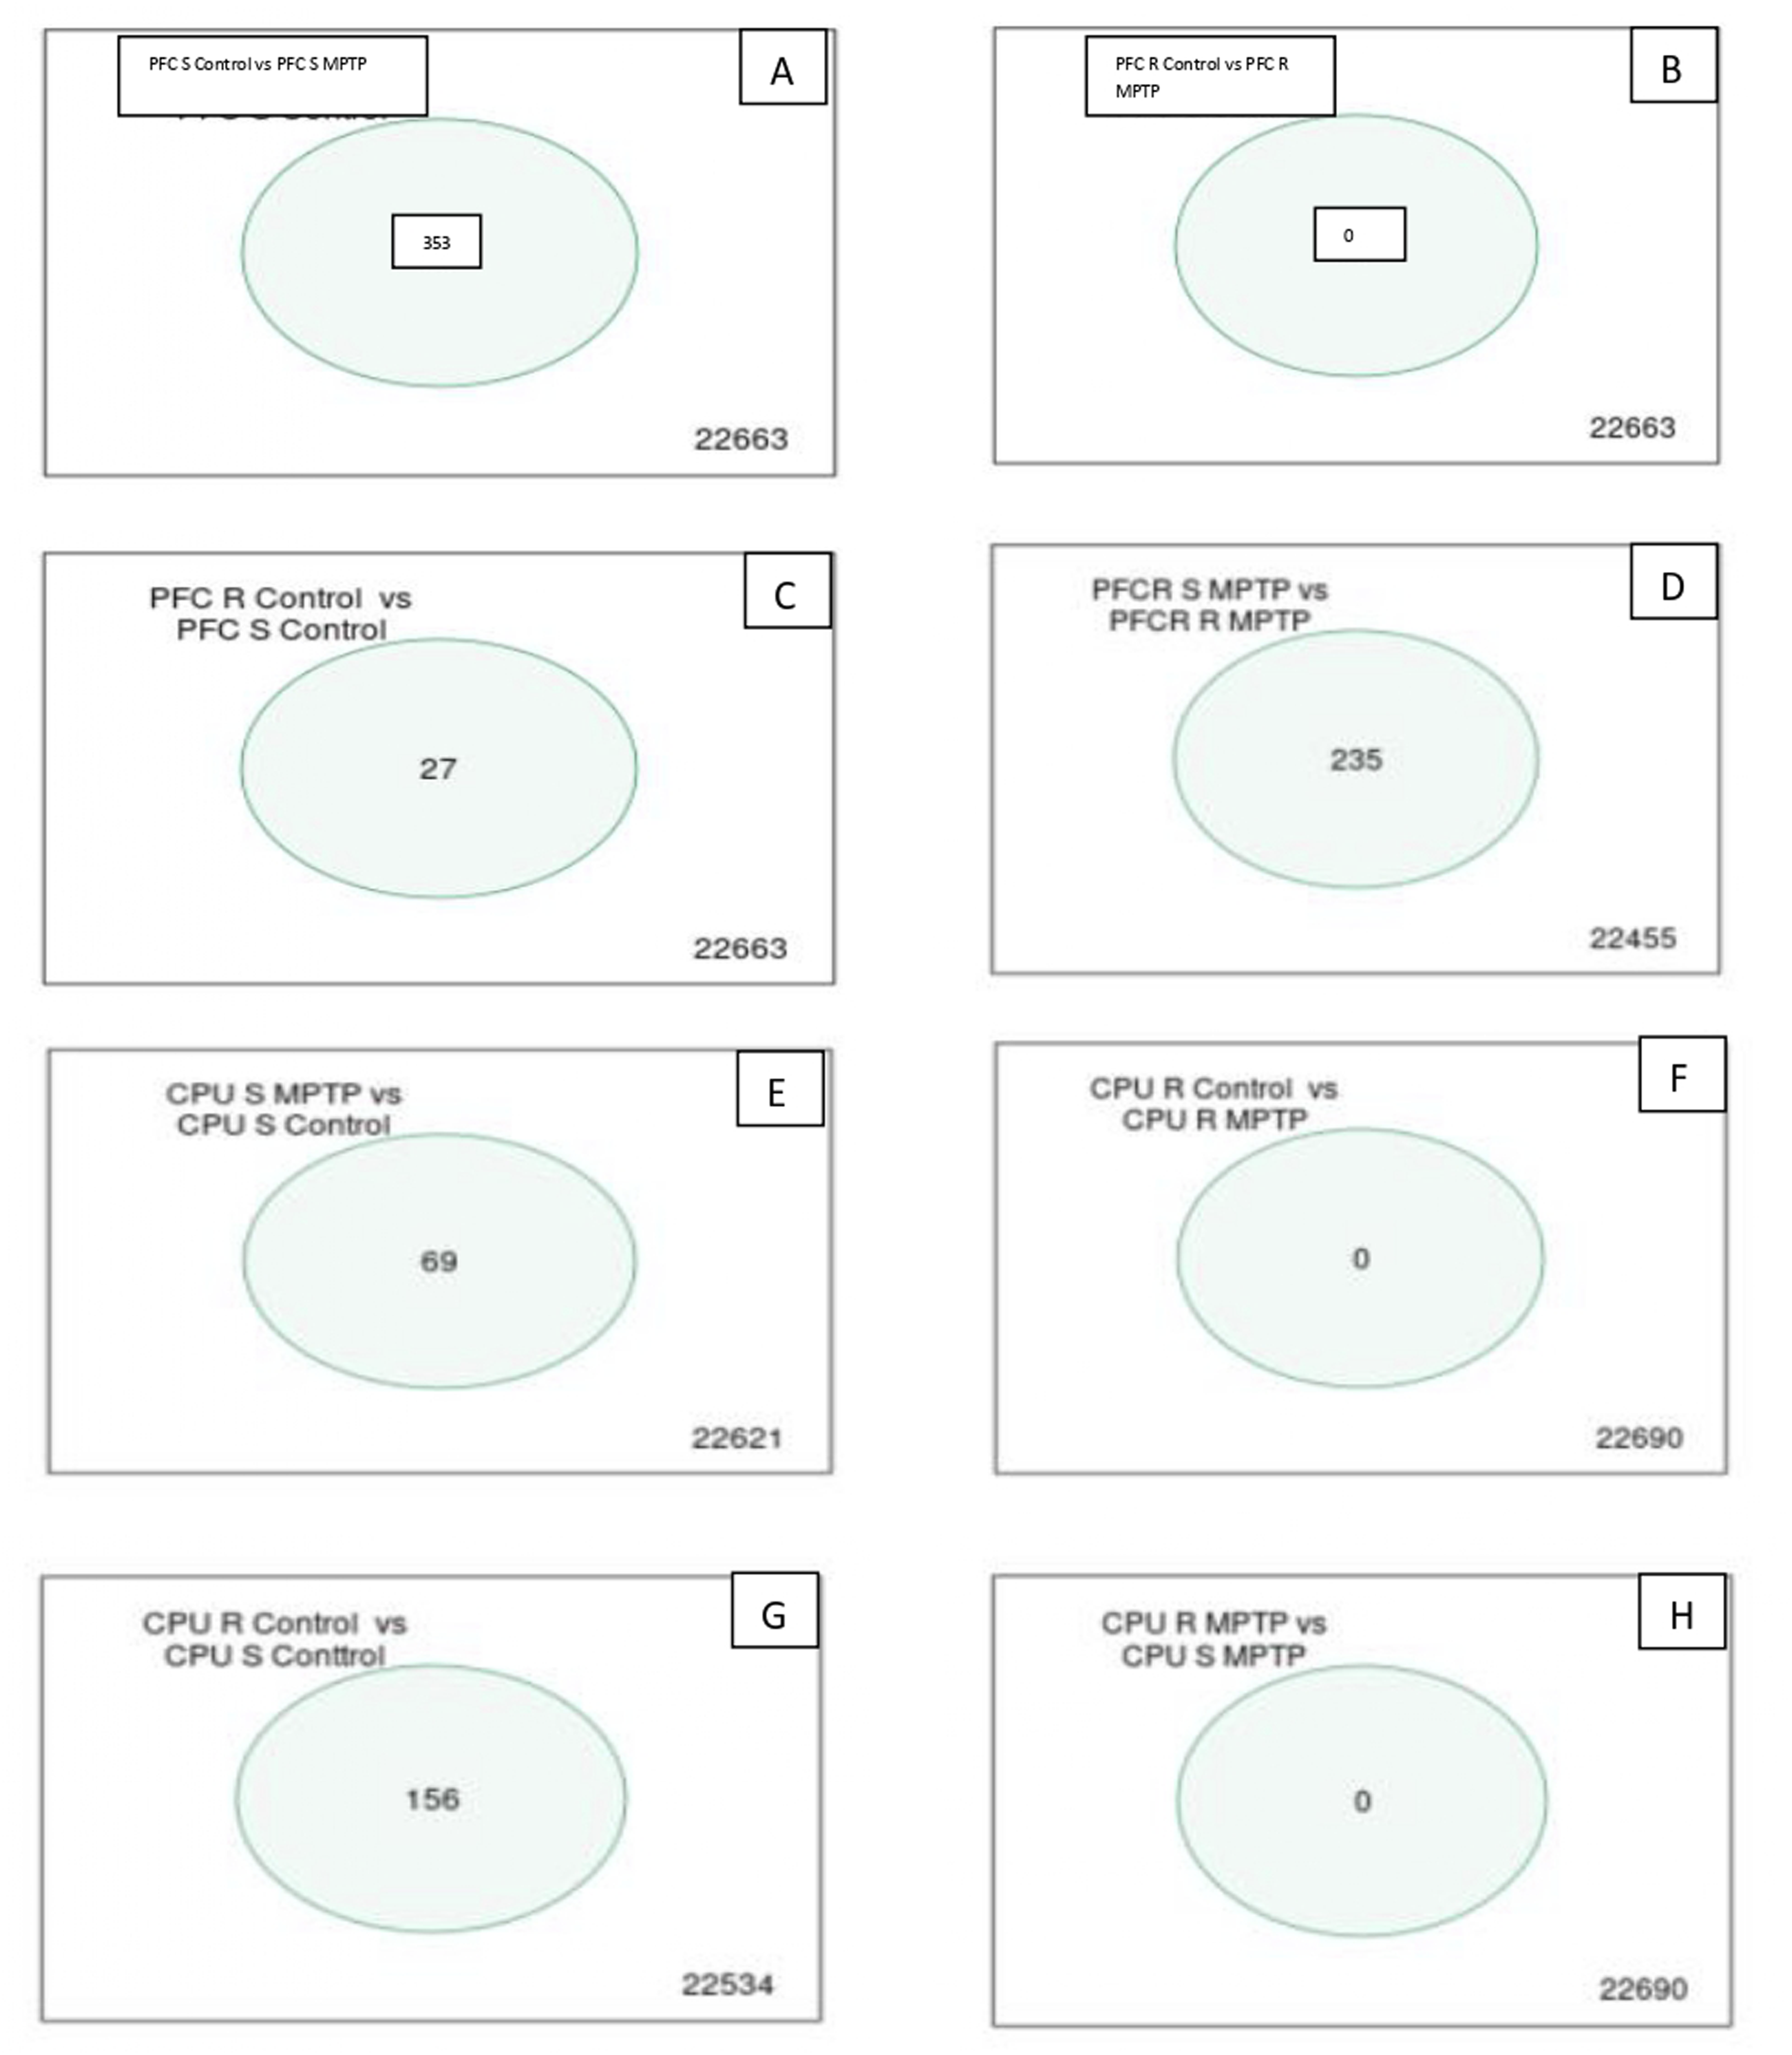
Second group samples (FVB-ncontrola and MPTP)
Figure 10 shows a Venn Diagram with significant genes. Figure 14 shows a Venn diagram with an individual comparison of PFC FVB/N control versus PFC FVB/MPTP with a match for 220 genes, while the comparison of CPU FVB/N control versus CPU MPTP showed a test match for 22 genes. Separate comparisons. (A) PFC FVB/N control vs PFC FVB/ MPTP; (B) CPU FVB/N control vs CPU MPTP.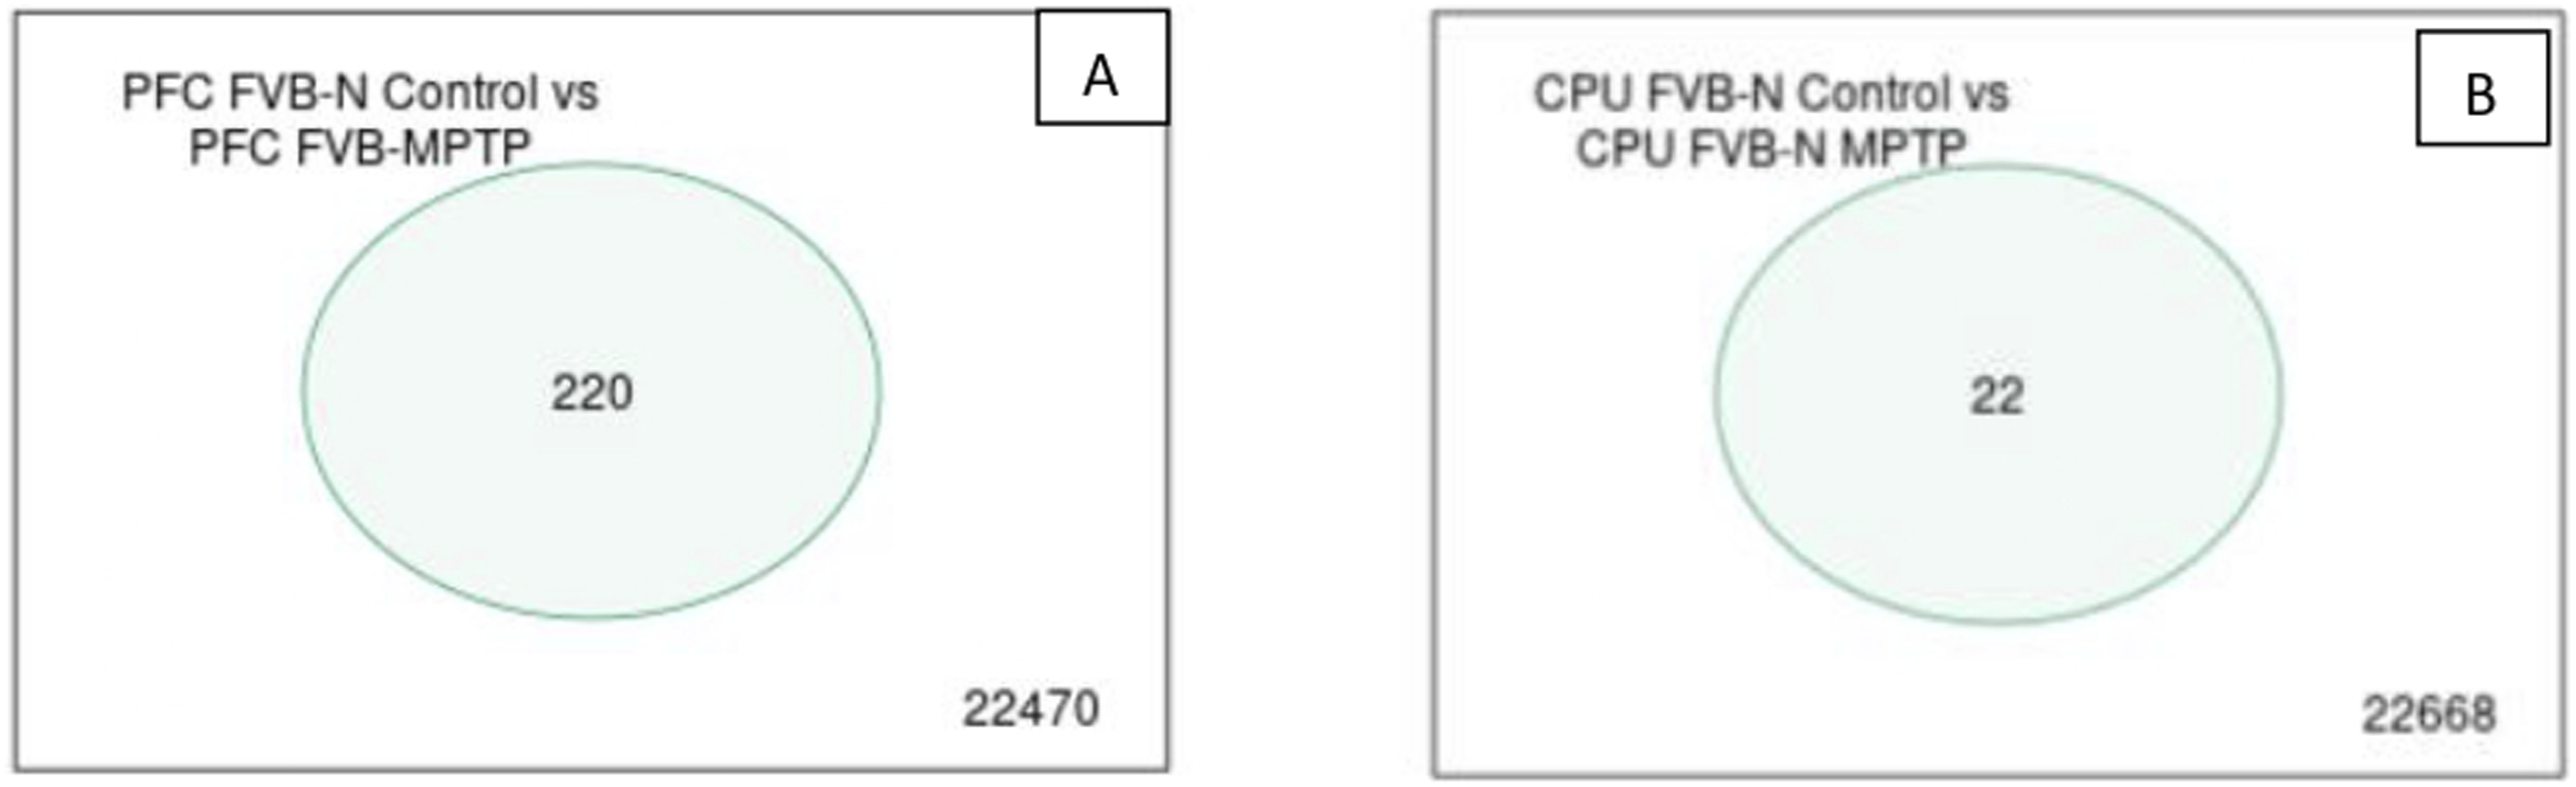
Third group samples (control)
Venn diagram in Figure 11 showed no significant genes when comparing CPU S Control versus CPU R Control. However, 10362 genes exist between PFC R Control versus CPU S Control and 66 matching genes between these 2 subgroups p < .05 Data is visible in the results. Individual, separate, and complementary comparisons between groups in Figure 15 show significant matching genes for PFC S Control versus PFC R Control (2019 genes), PFC S Control versus PFC FVB N Control (2991), PFC S Control versus CPU S Control (7310), CPU S Control versus CPU R Control (156 genes), CPU S Control versus CPU FVB N Control (246 genes). Separate comparisons between groups. (A) PFC S control vs PFC R control; (B) PFC S control vs PFC FVB N control; (C) PFC S control vs CPU S control; (D) CPU S control vs CPU R control; (E); CPU S control vs CPU FVB N control.
Fourth group samples (separated MTPT)
Figure 12 with the Venn diagram showed a significant 8510 genes between PFC FVB MPTP versus CPU FVB MPTP and 311 genes between PFC S MPTP versus PFCR R MPTP. There are 297 notable matching genes between these comparing groups. A separate comparison between groups in Figure 16 confirmed gene match for PFC S MPTP versus PFC R MPTP (235 genes), PFC S MPTP versus PFC FVB N MPTP (96 genes), PFC S MPTP versus CPU S MPTP (5880 genes), CPU S MPTP versus CPU FVB N MPTP (581 genes) and no gene match for CPU S MPTP versus CPU R MPTP. Separate comparisons between groups. Separate comparison between groups confirmed gene match for PFC S MPTP vs PFC R MPTP (235 genes), PFC S MPTP vs PFC FVB N MPTP (96 genes), PFC S MPTP vs CPU S MPTP (5880 genes), CPU S MPTP vs CPU FVB N MPTP (581 genes) and no gene match for CPU S MPTP vs CPU R MPTP.
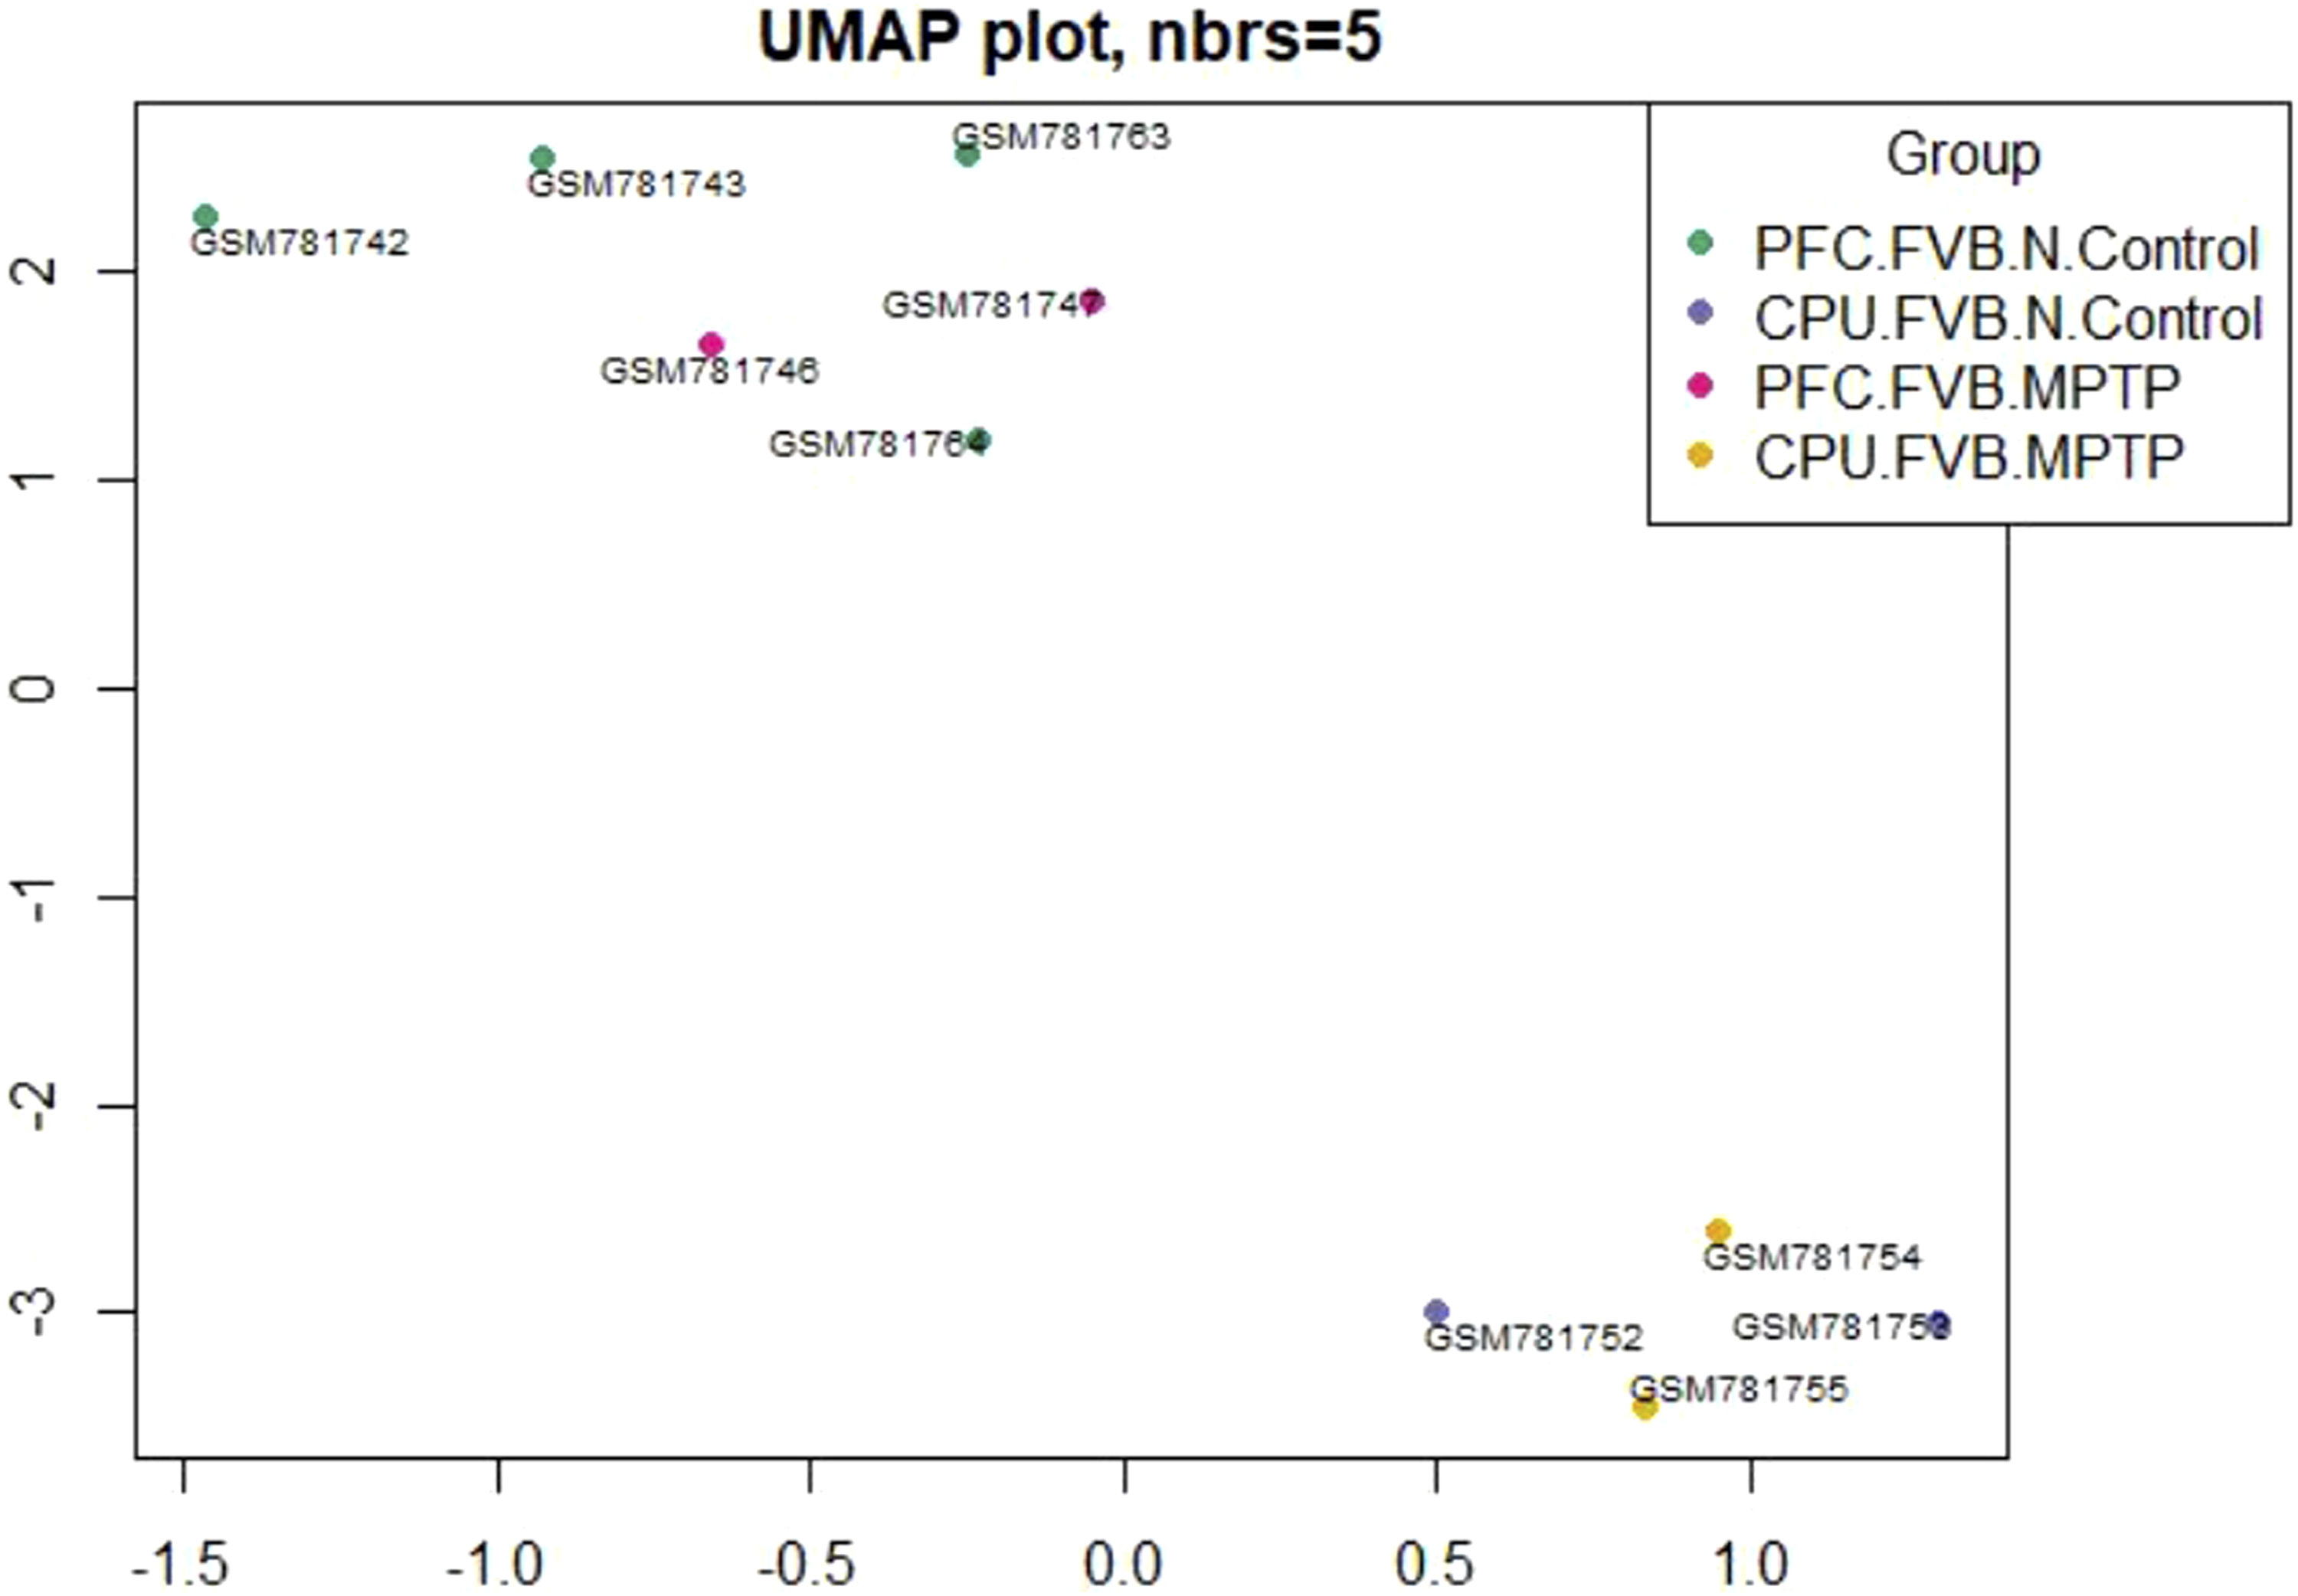
Uniform Manifold Approximation and Projection
UMAP (Uniform Manifold Approximation and Projection) is a dimensional reduction visualizing interconnected sample technique. Figures 17–20 show the results indicating the presence of four groups and their relationships on the UMAP graphic without and with sample notion. Dependency of sample groups with detailed information regarding sample numbers via UMAP plot. Dependency of sample groups with detailed information regarding sample numbers via UMAP plot. Dependency of sample groups with detailed information regarding sample numbers via UMAP plot. Dependency of sample groups with detailed information regarding sample numbers via UMAP plot.


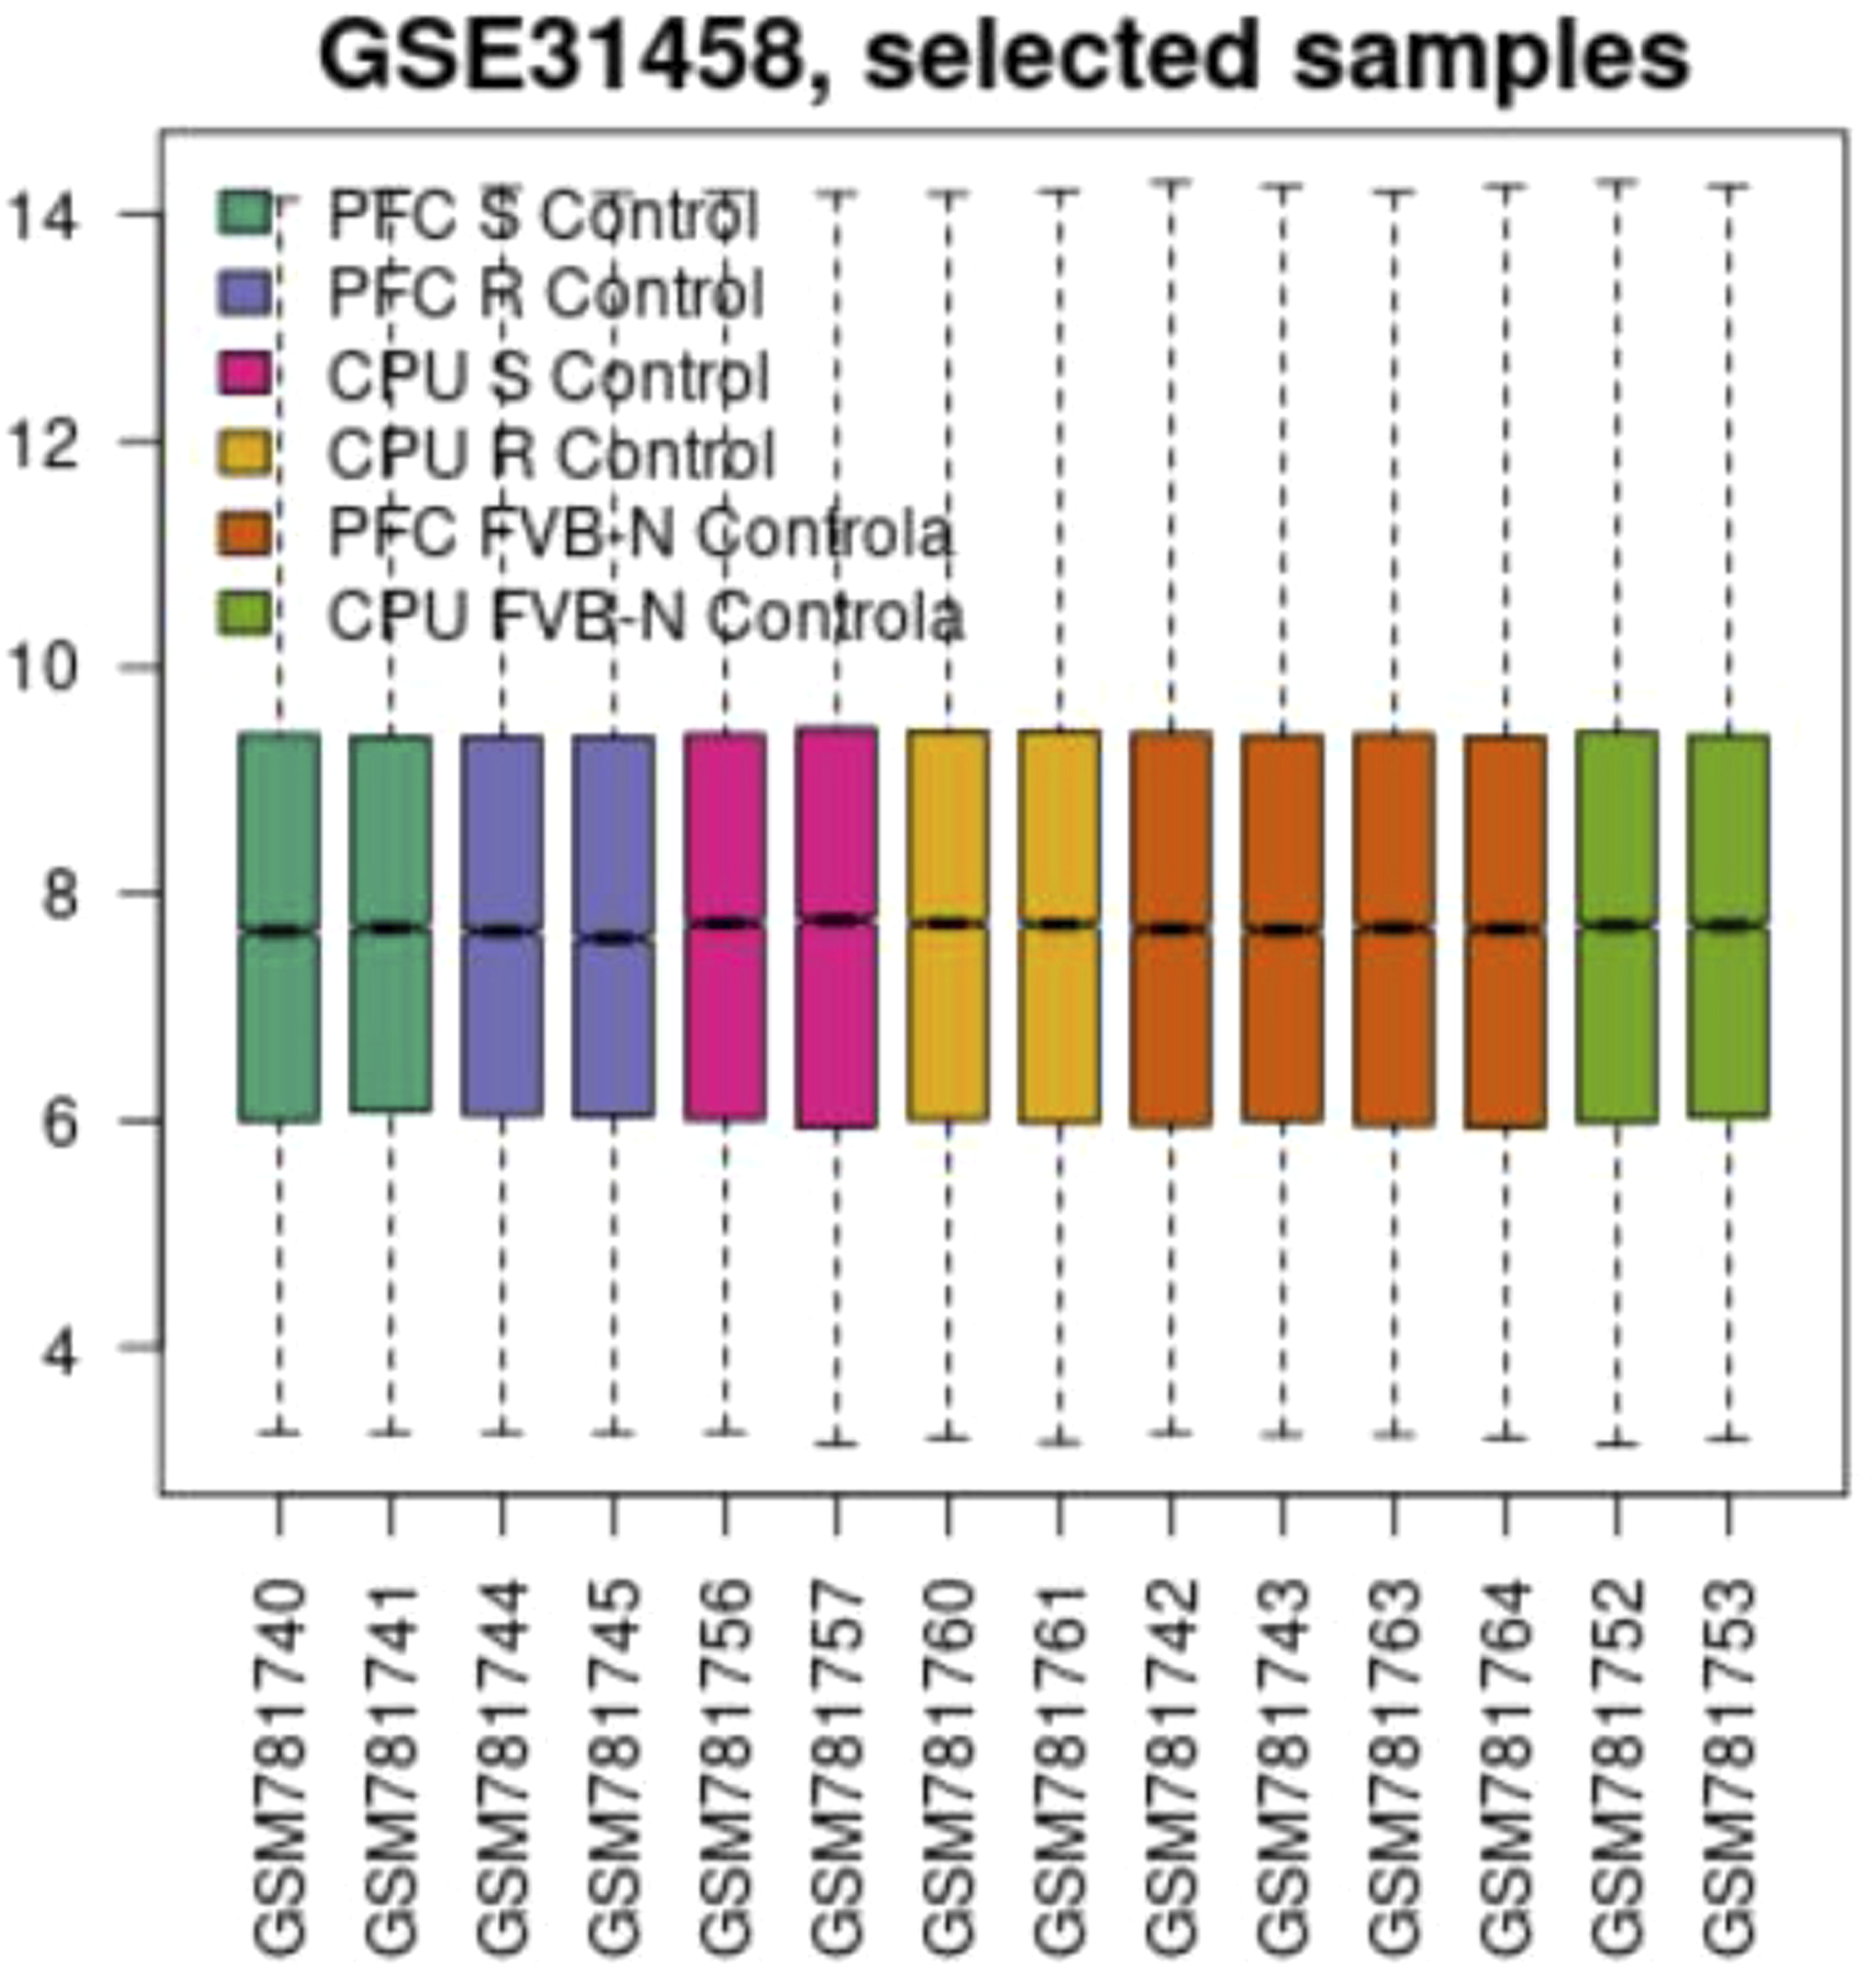
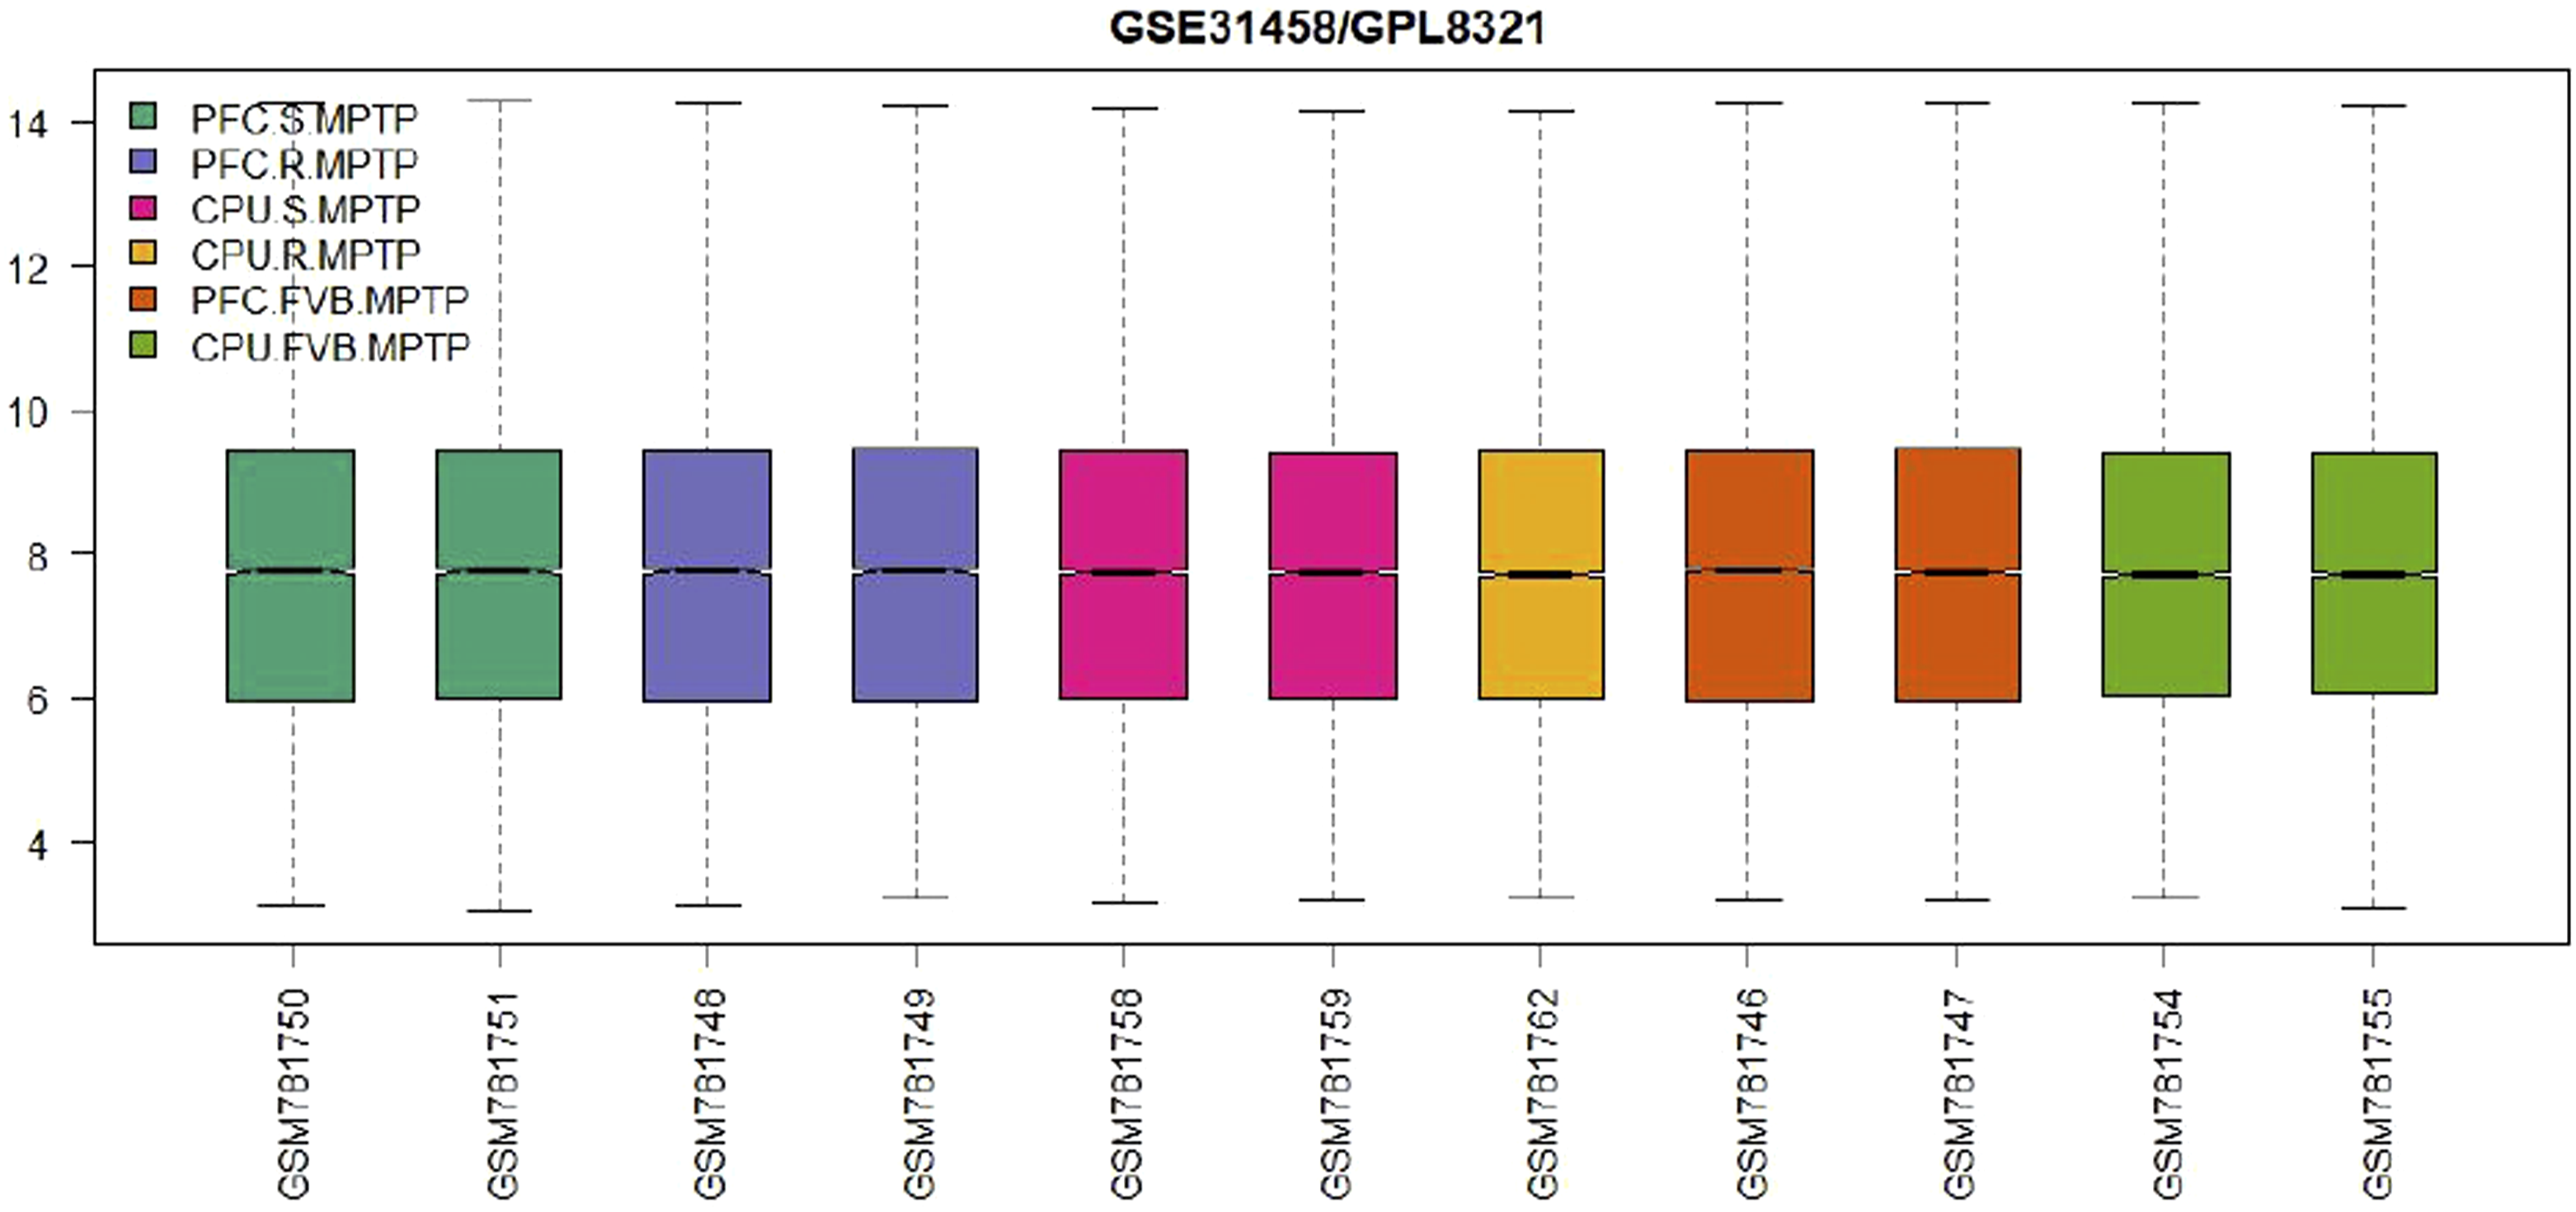
Boxplot
A box plot generated in R shows the distribution of sample values for assessing the data for differential expression analysis. The results are available in Figures 21–24, indicating the presence of four group samples. Boxplot graph comparing basic statistics for all RNA molecules depending on the murine group samples. Boxplot graph comparing basic statistics for all RNA molecules depending on the murine group samples. Boxplot graph comparing basic statistics for all RNA molecules depending on the murine group samples. Boxplot graph comparing basic statistics for all RNA molecules depending on the murine group samples.

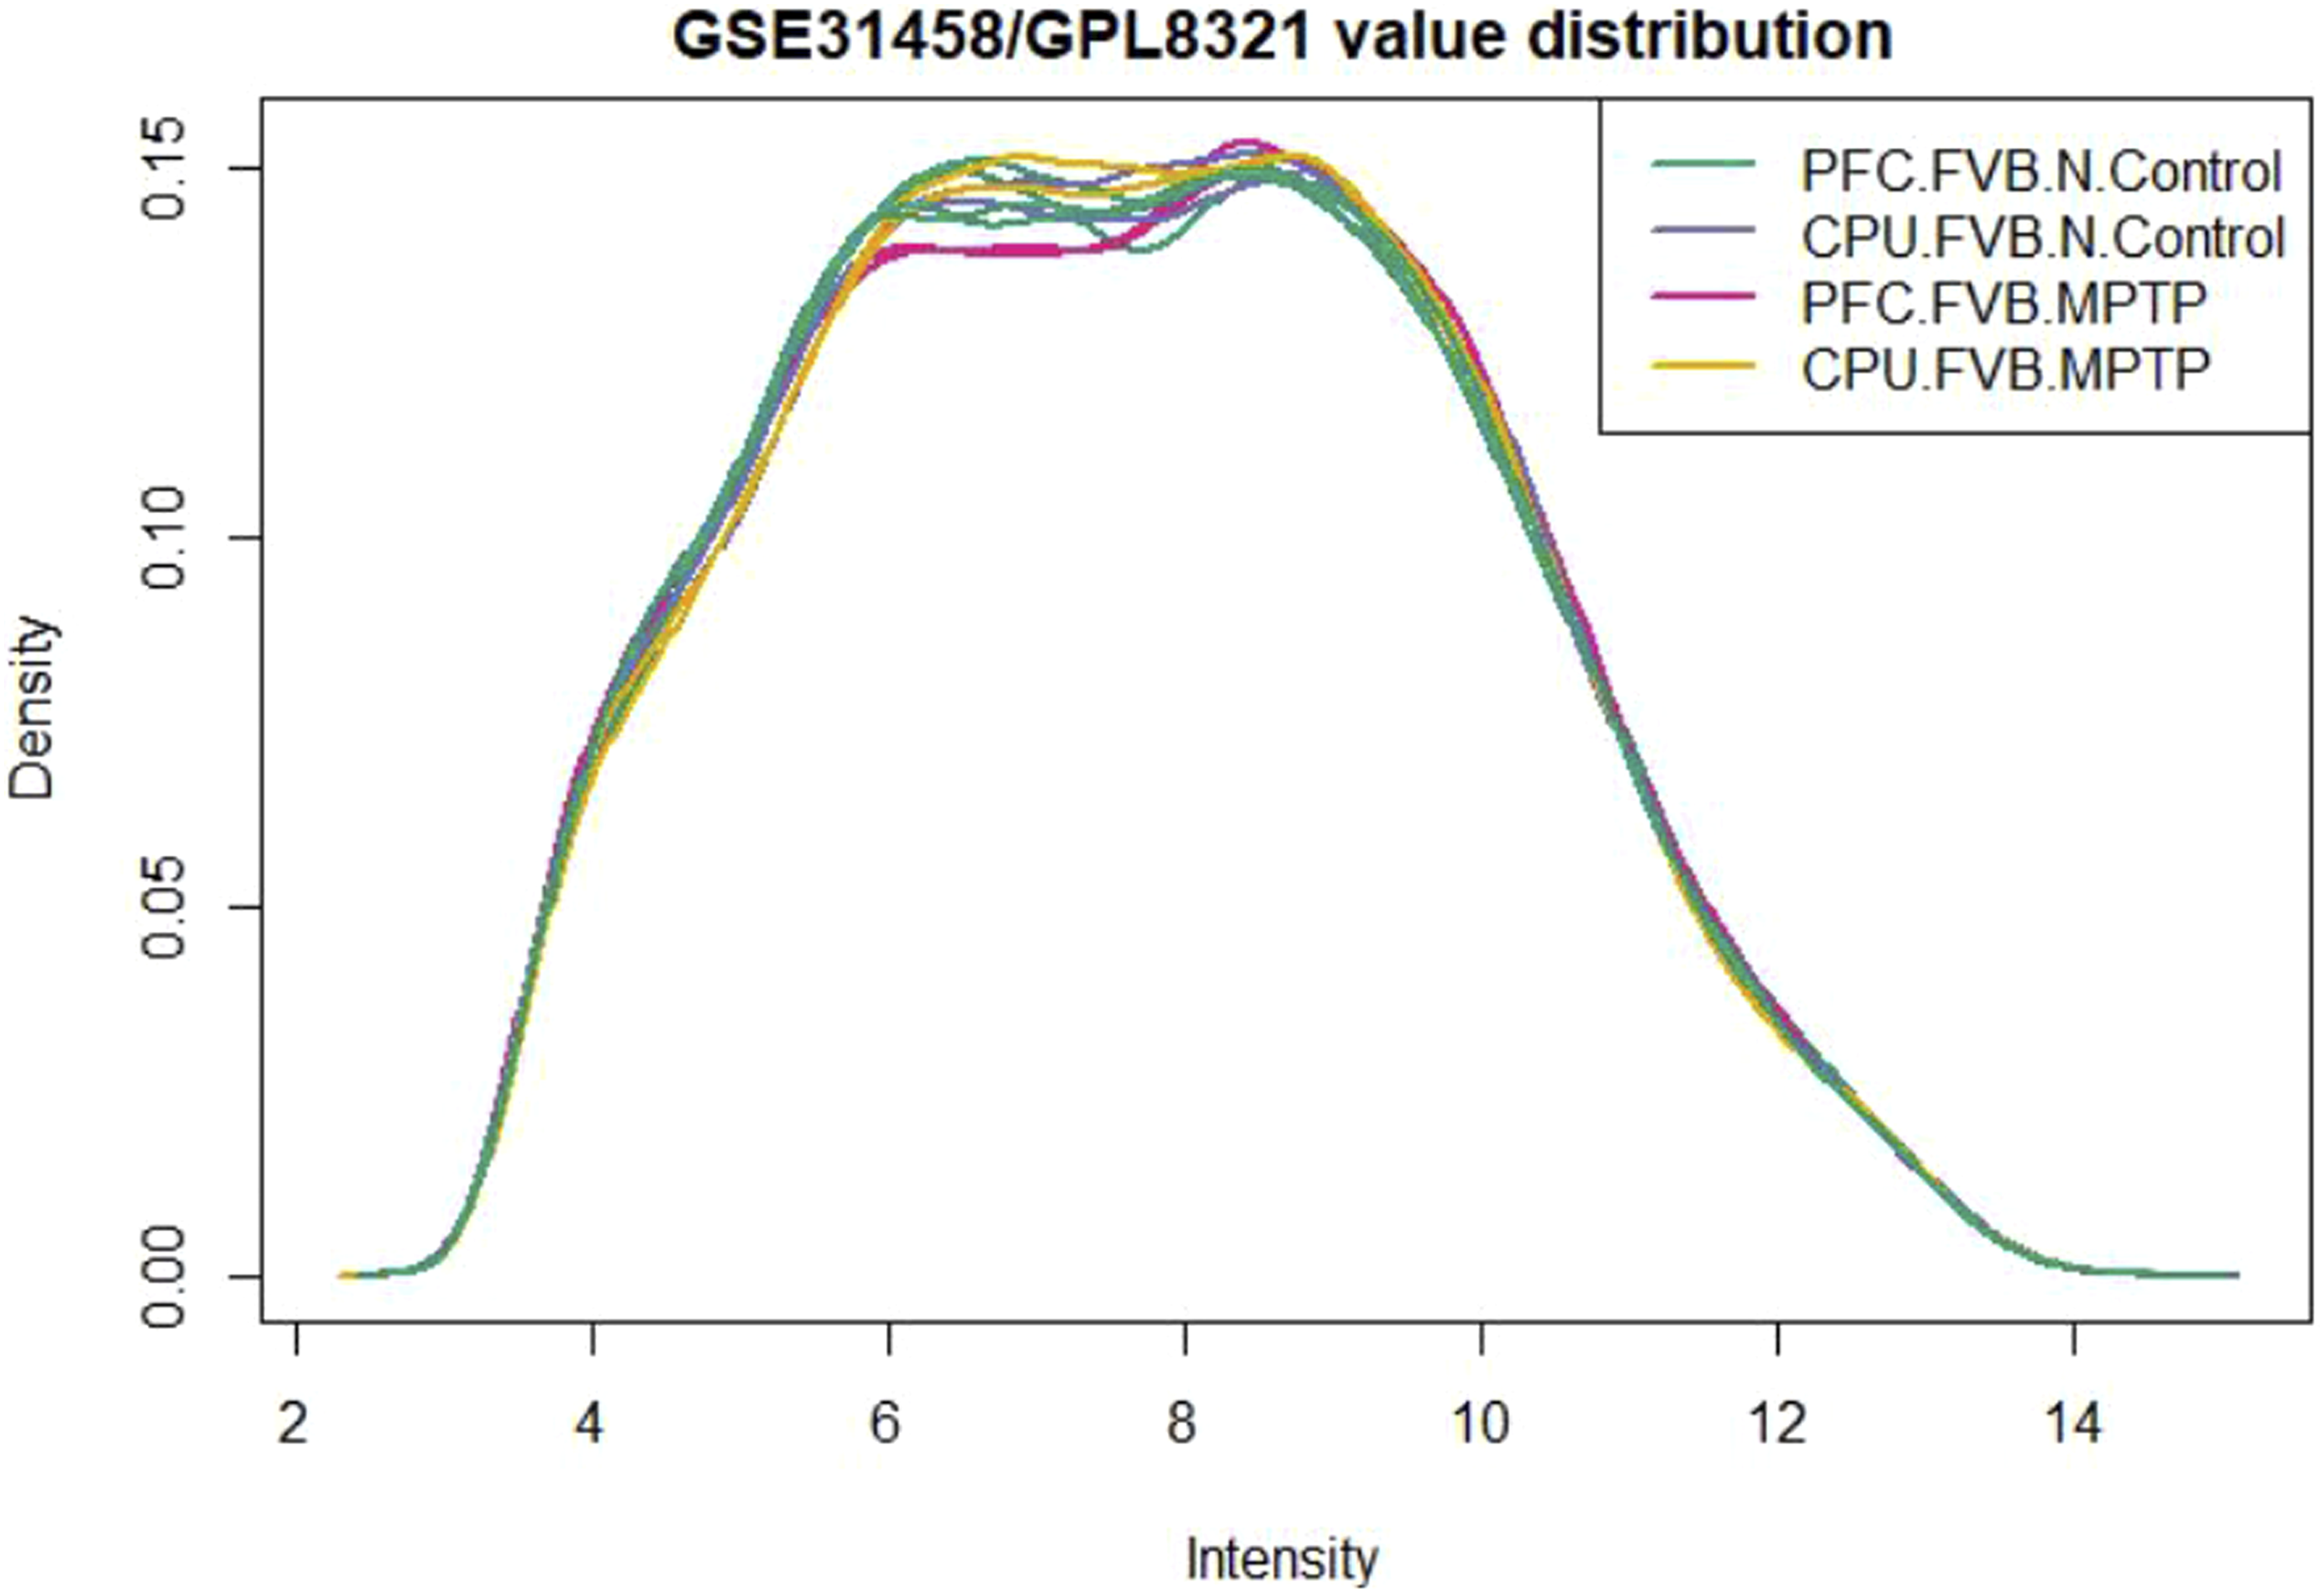
Expression density plot
Using limma in R, we saw the distribution values of the analyzed samples by expression density analysis. Figures 25–28 presents the results, indicating the presence of four group samples. Expression density plot of total RNA molecules in groups comparing the intensity and density of samples. Expression density plot of total RNA molecules in groups comparing the intensity and density of samples. Expression density plot of total RNA molecules in groups comparing the intensity and density of samples. Expression density plot of total RNA molecules in groups comparing the intensity and density of samples.


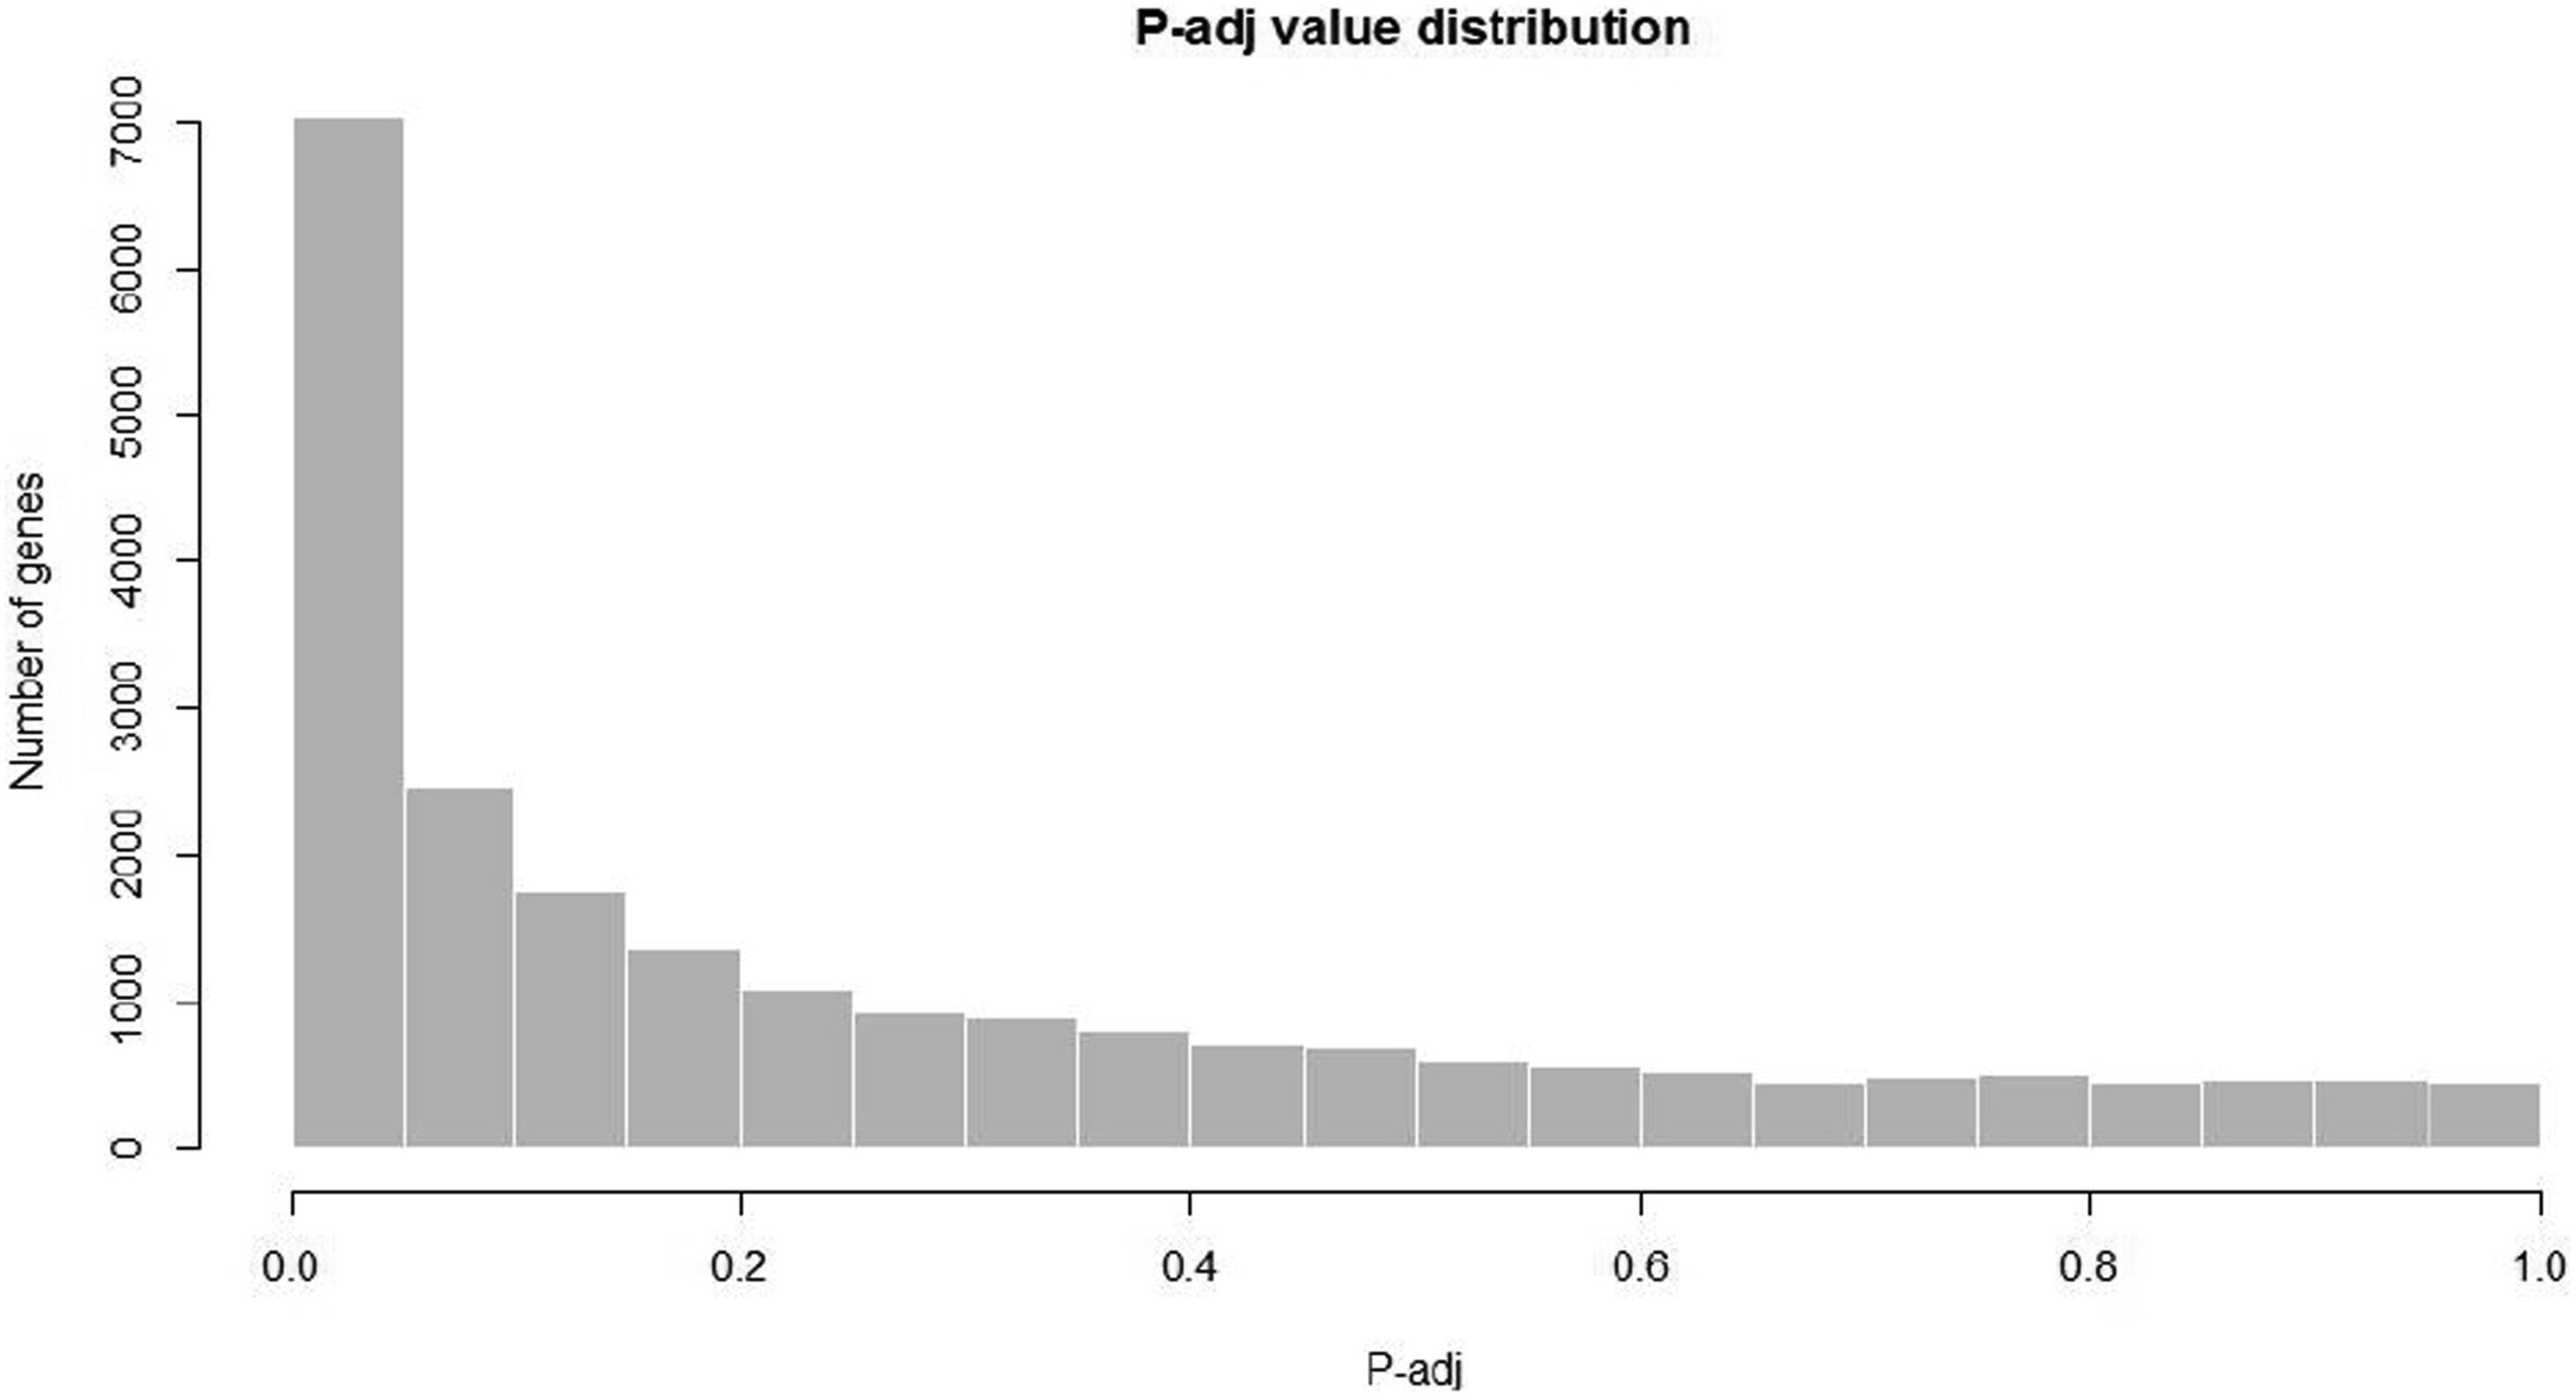
p-value histogram
Results of the p-value histogram of four group samples are present in Figures 29–32. p-value histogram. p-value histogram. p-value histogram. p-value histogram.


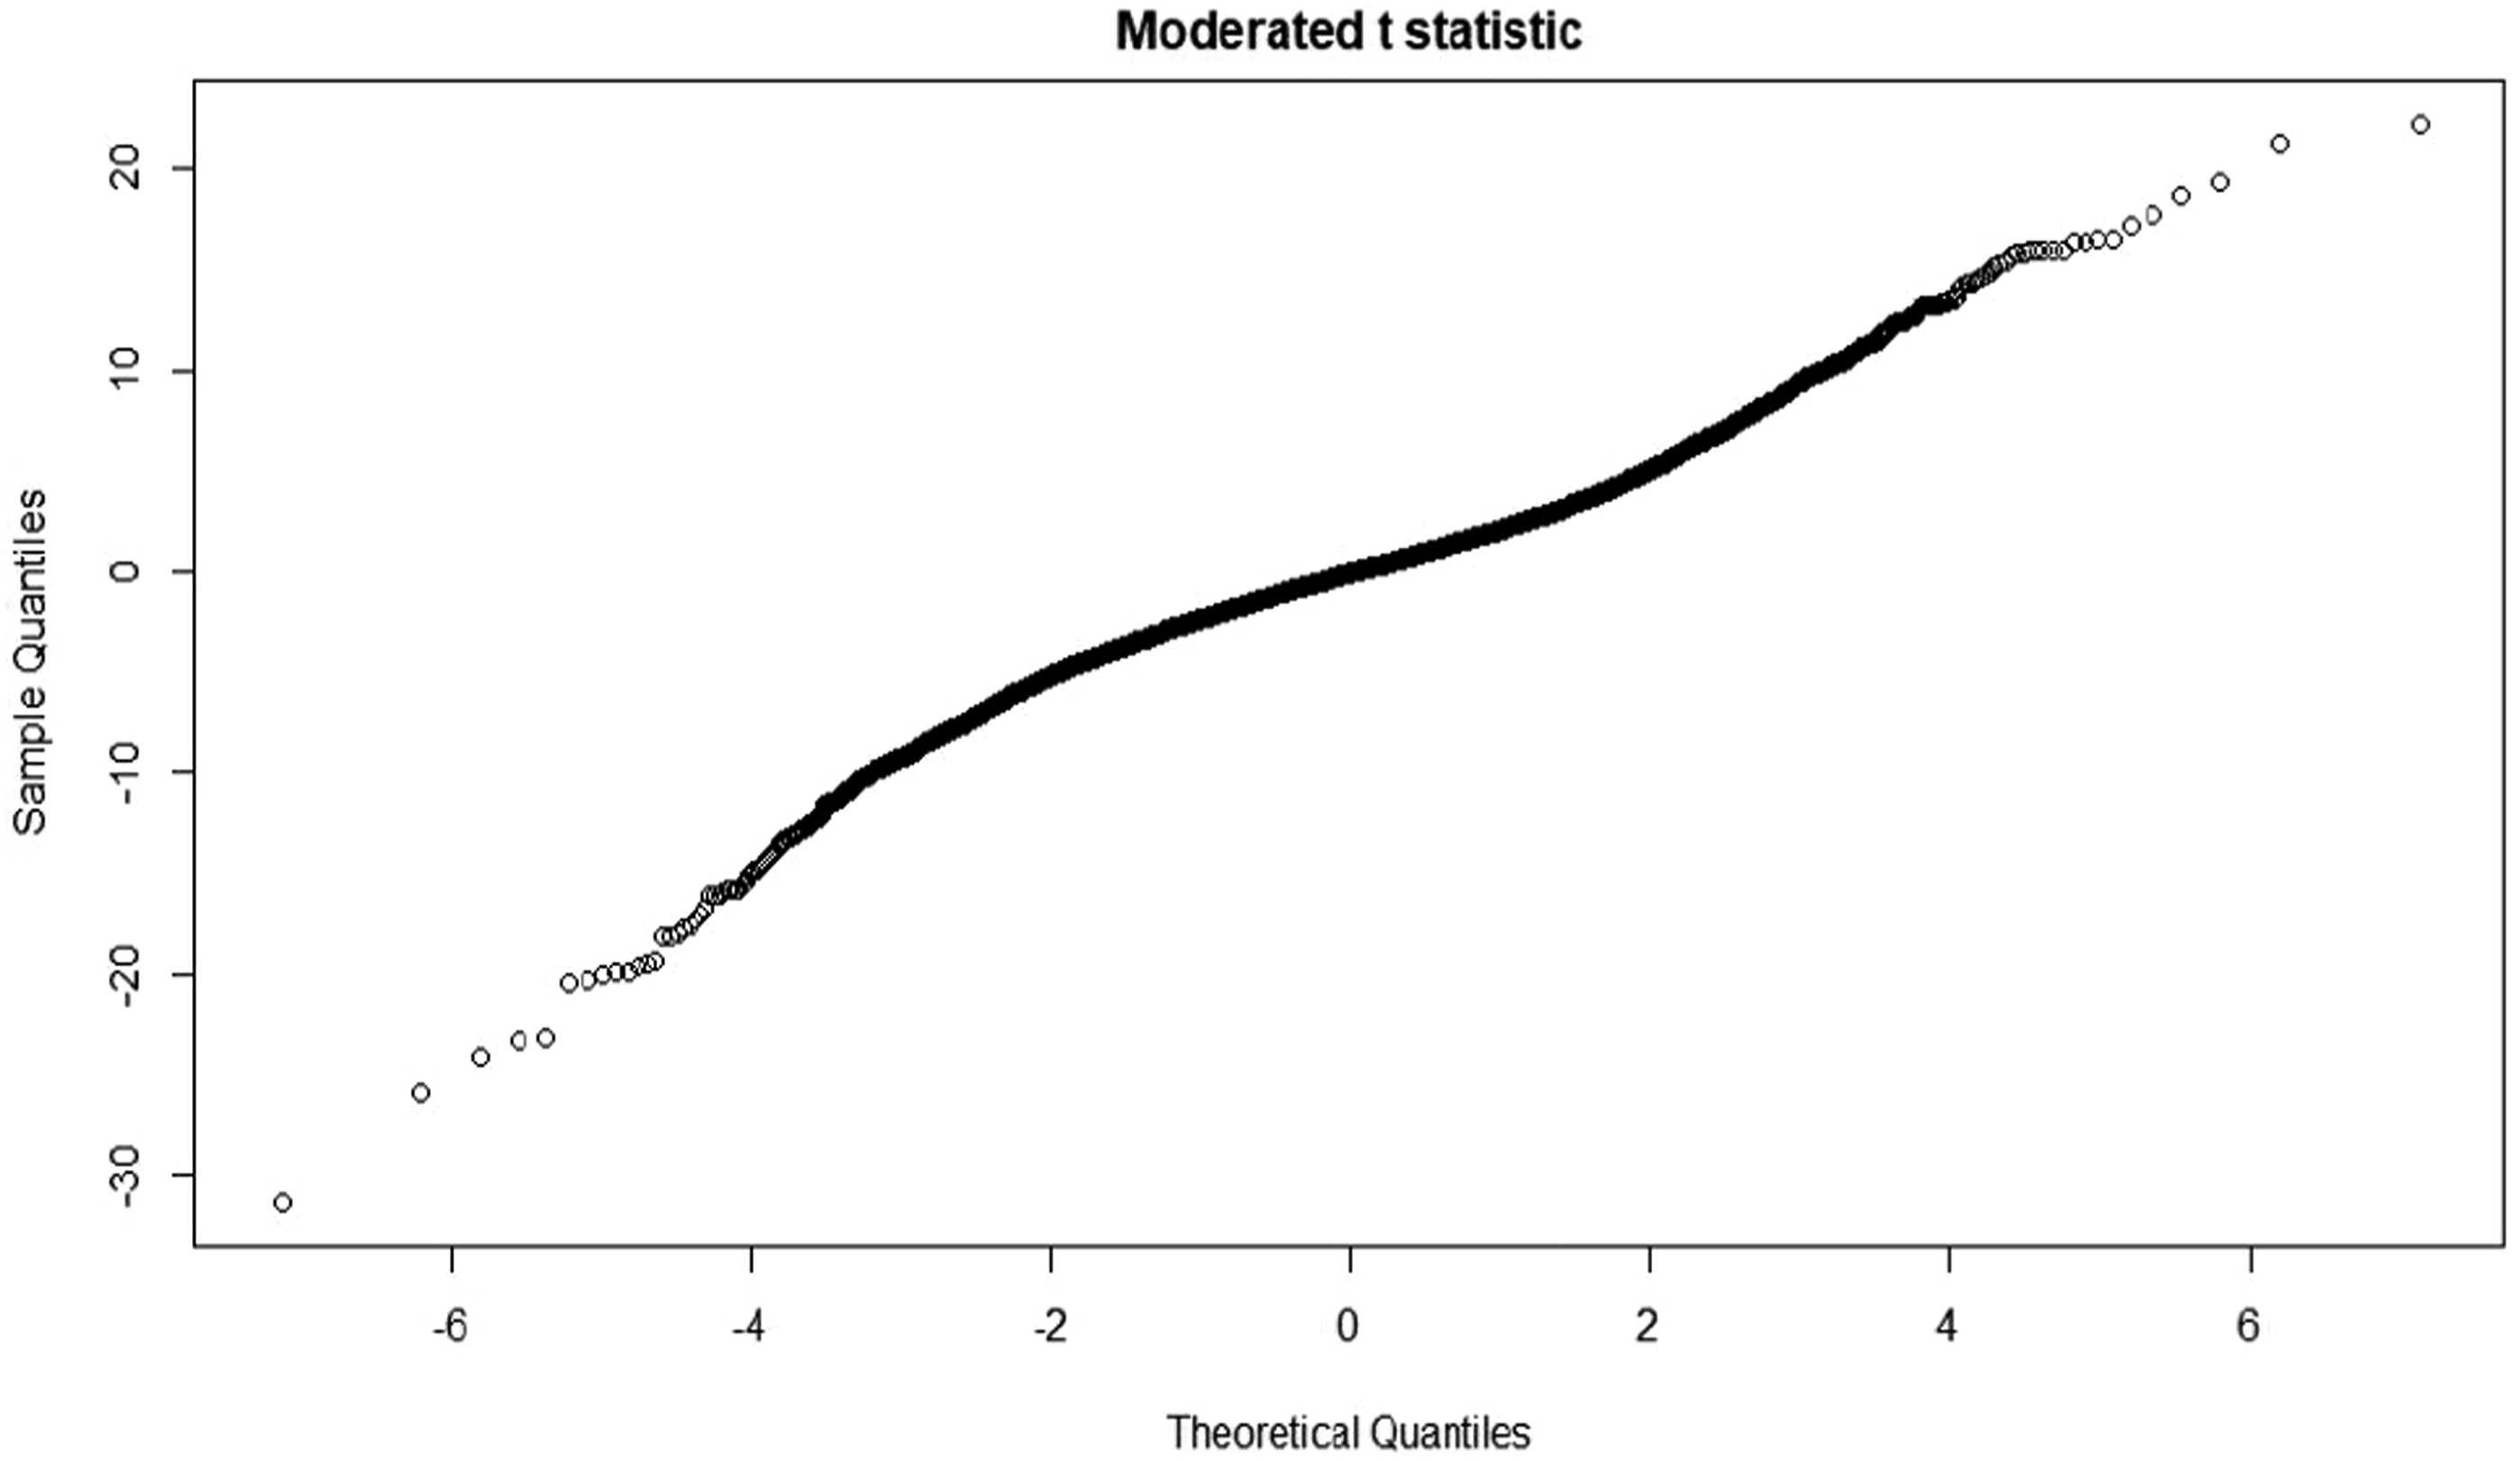
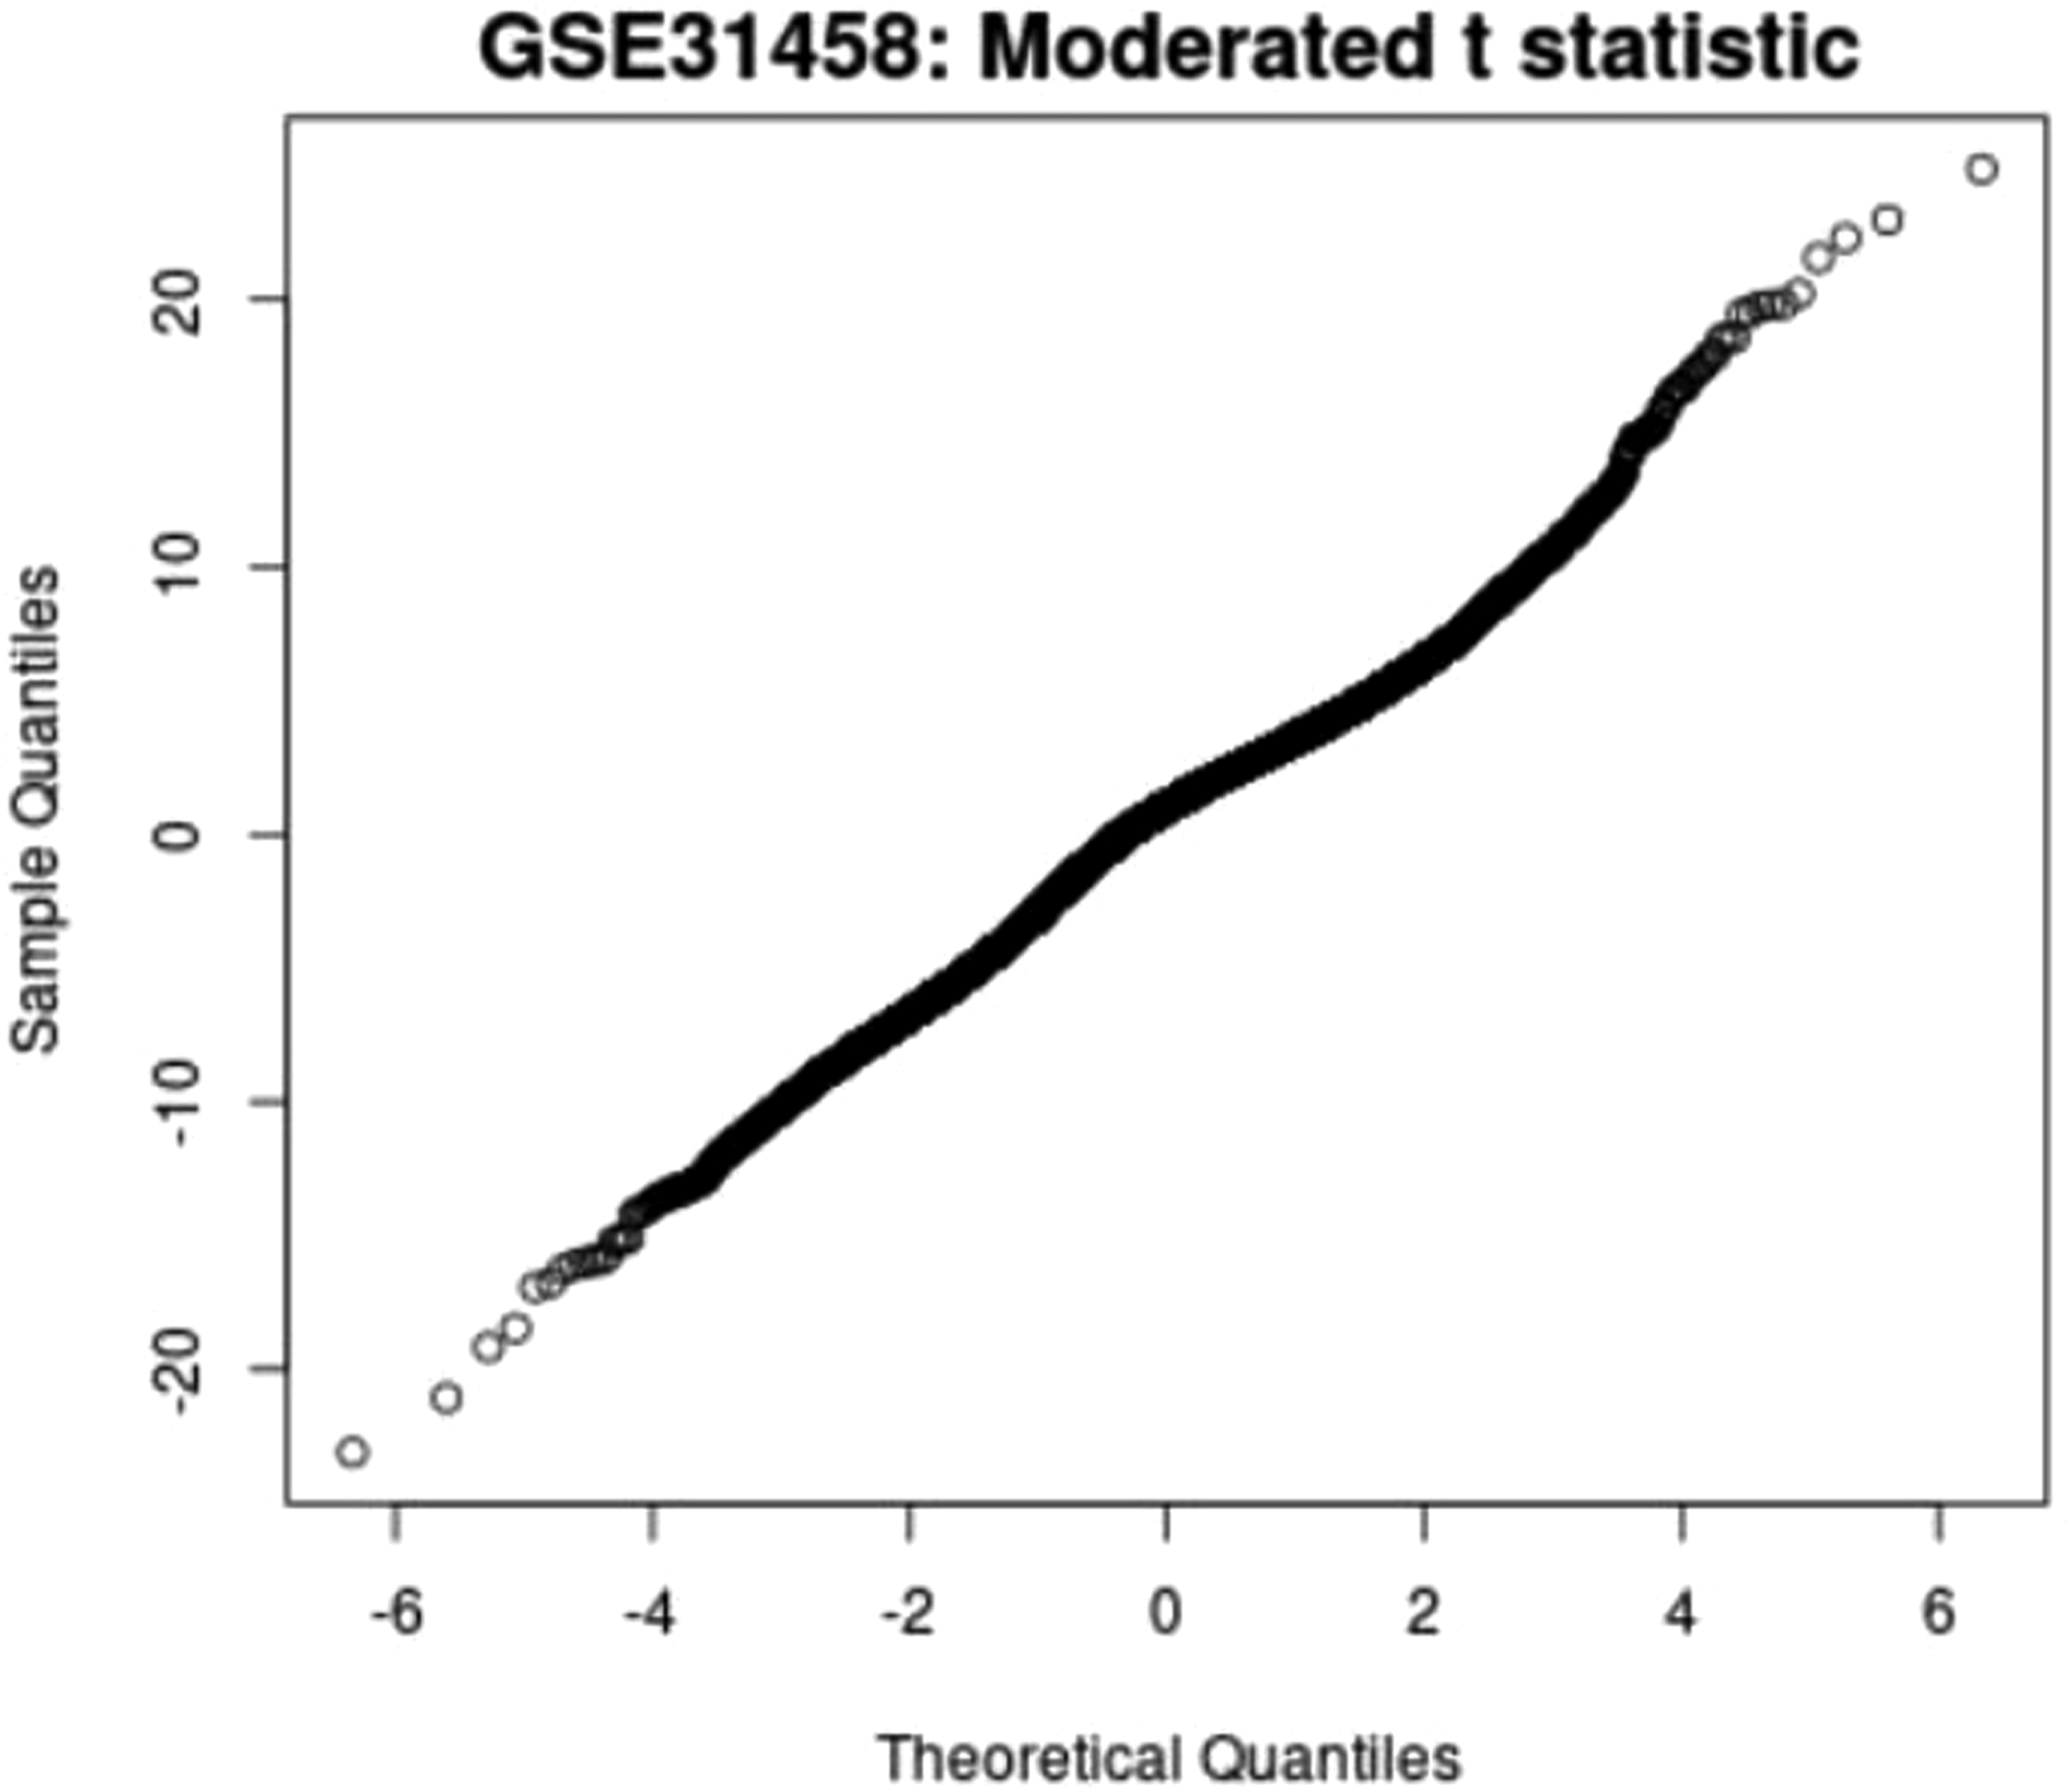
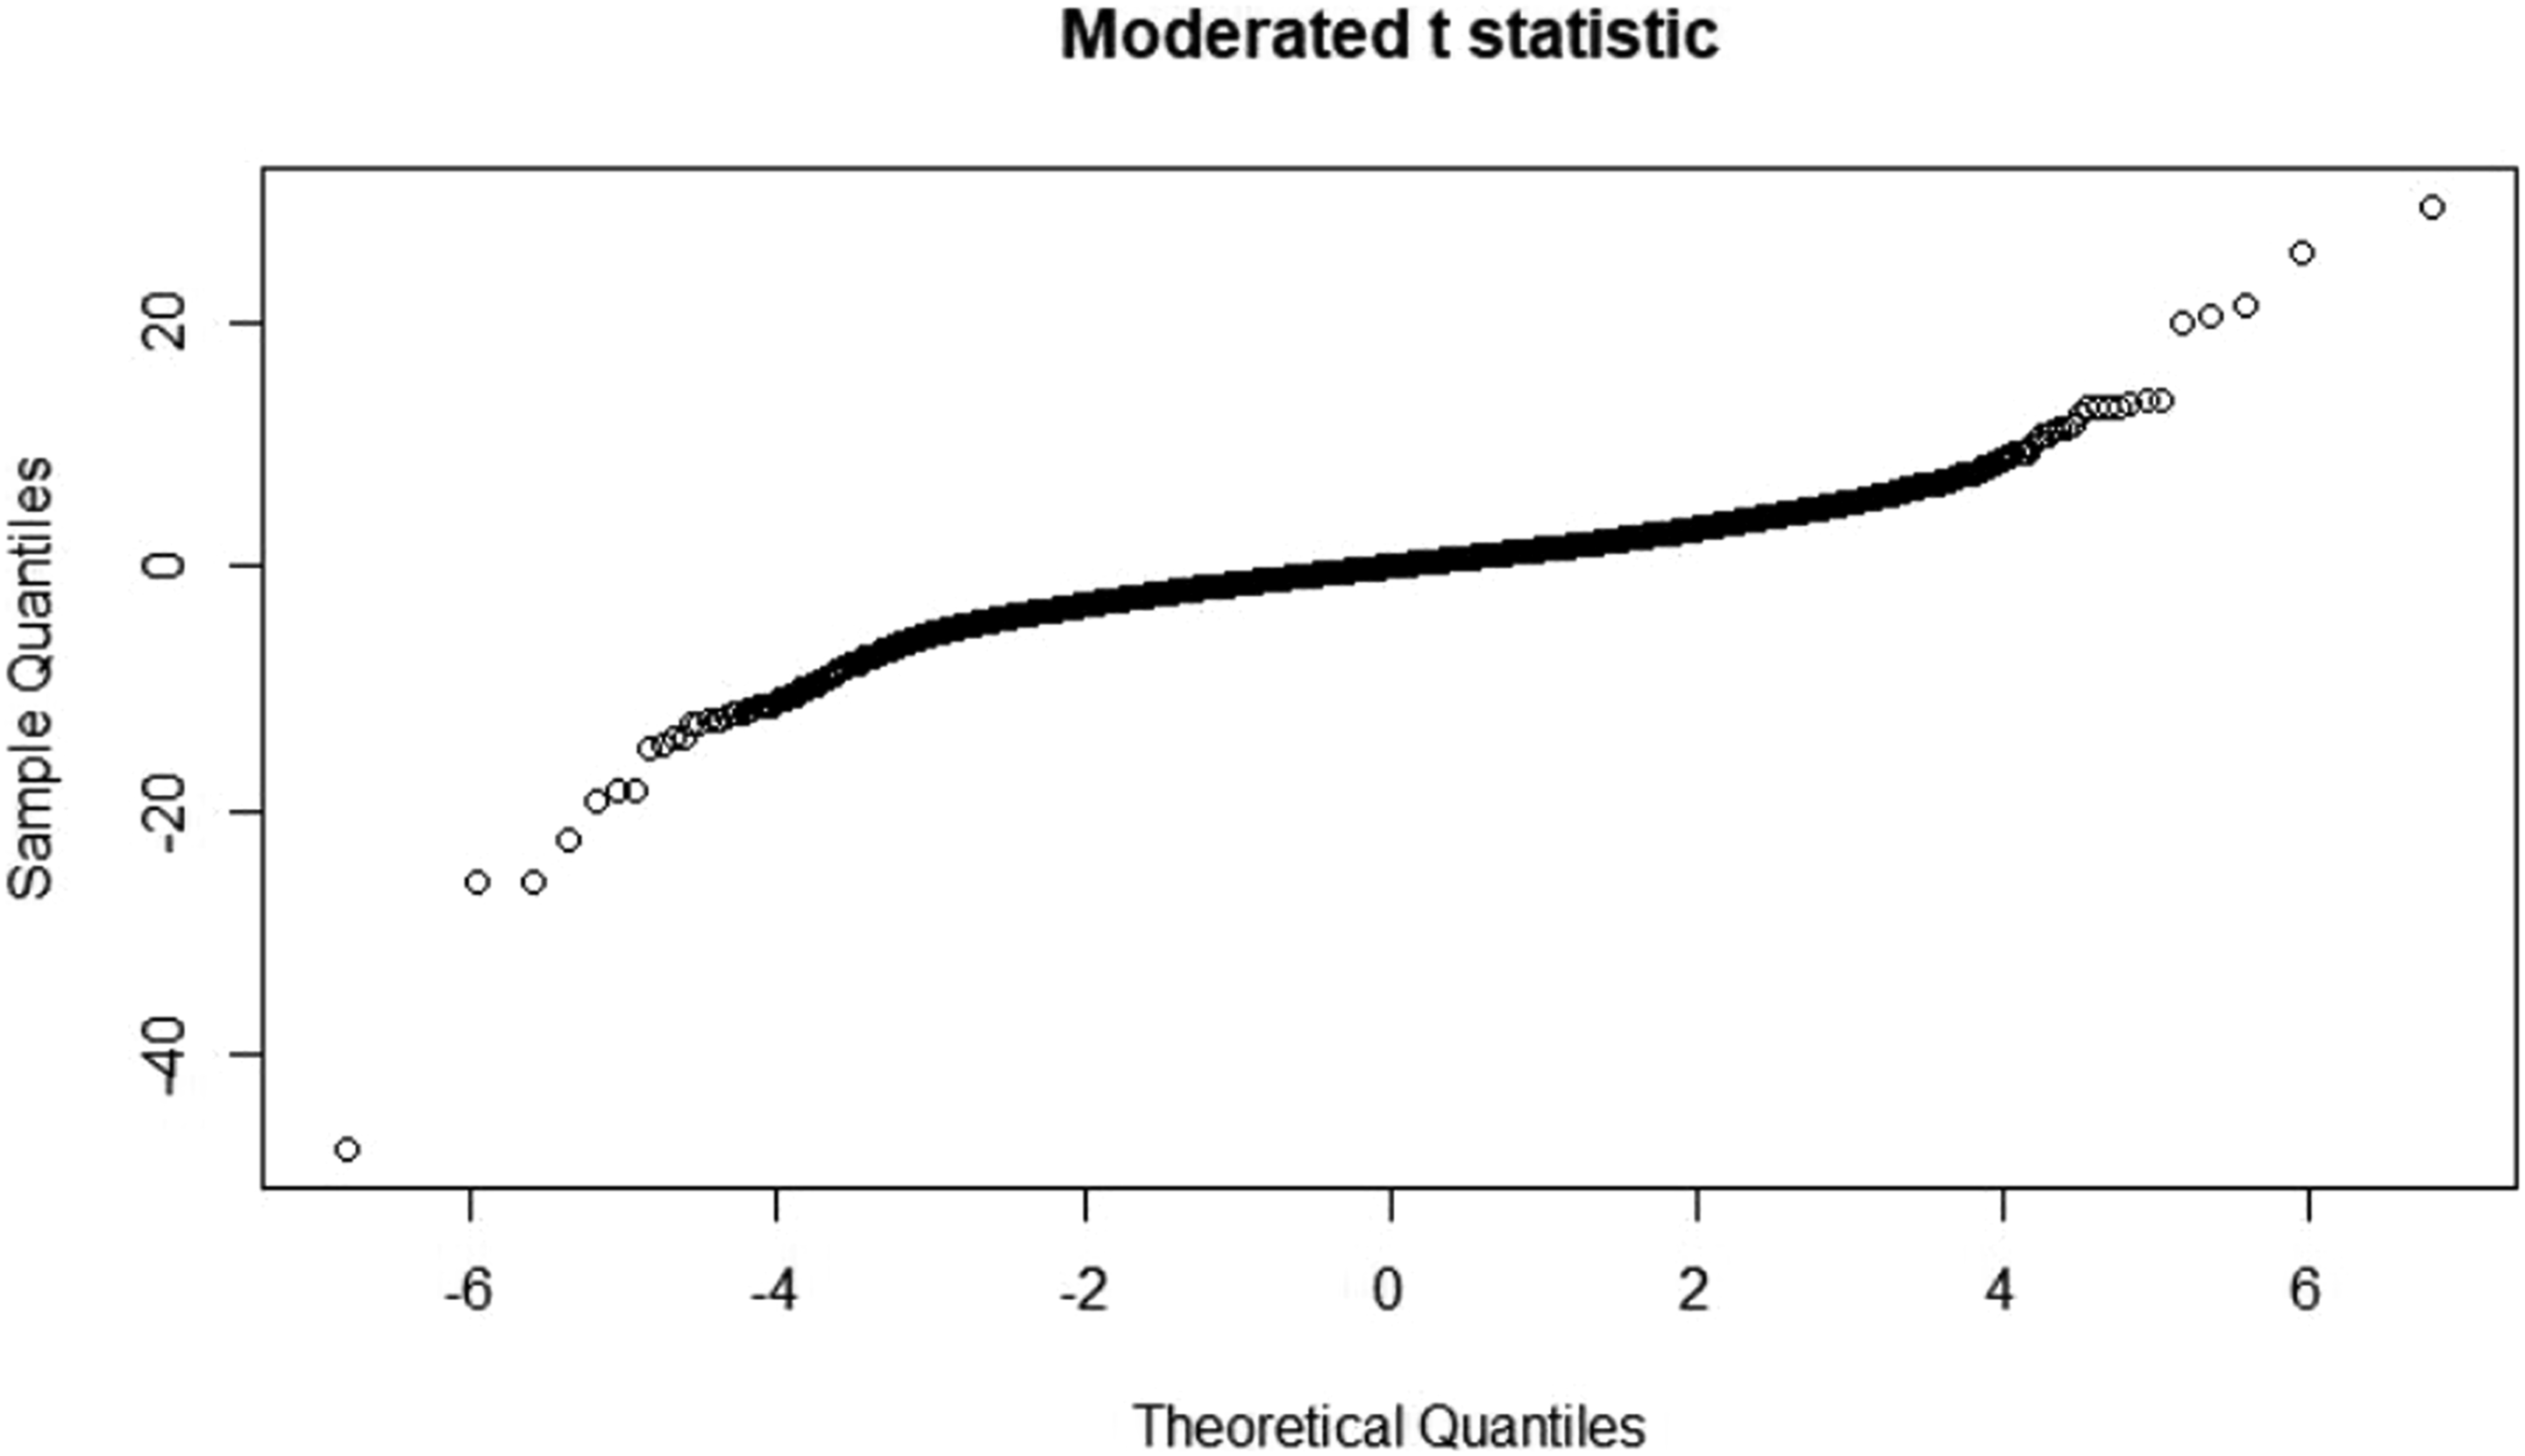
T statistic quantile-quantile (q-q plot)
Moderate t statistic quantile-quantile (q-q plot) generates using the limma package. Points present the amount of sample data relative to the theoretical model of the Student's t test distribution. The ideal case is a straight line, which indicates that the values of the moderated t-statistic test apply during the theoretical prediction of the distribution. When comparing the samples of all four groups in a murine model, an ideal situation is where the values follow the theoretical prediction of the model. Figures 33–36 presents the results from four sample groups. T-statistic quantile-quantile plot of murine samples. T-statistic quantile-quantile plot of murine samples. T-statistic quantile-quantile plot of murine samples. T-statistic quantile-quantile plot of murine samples.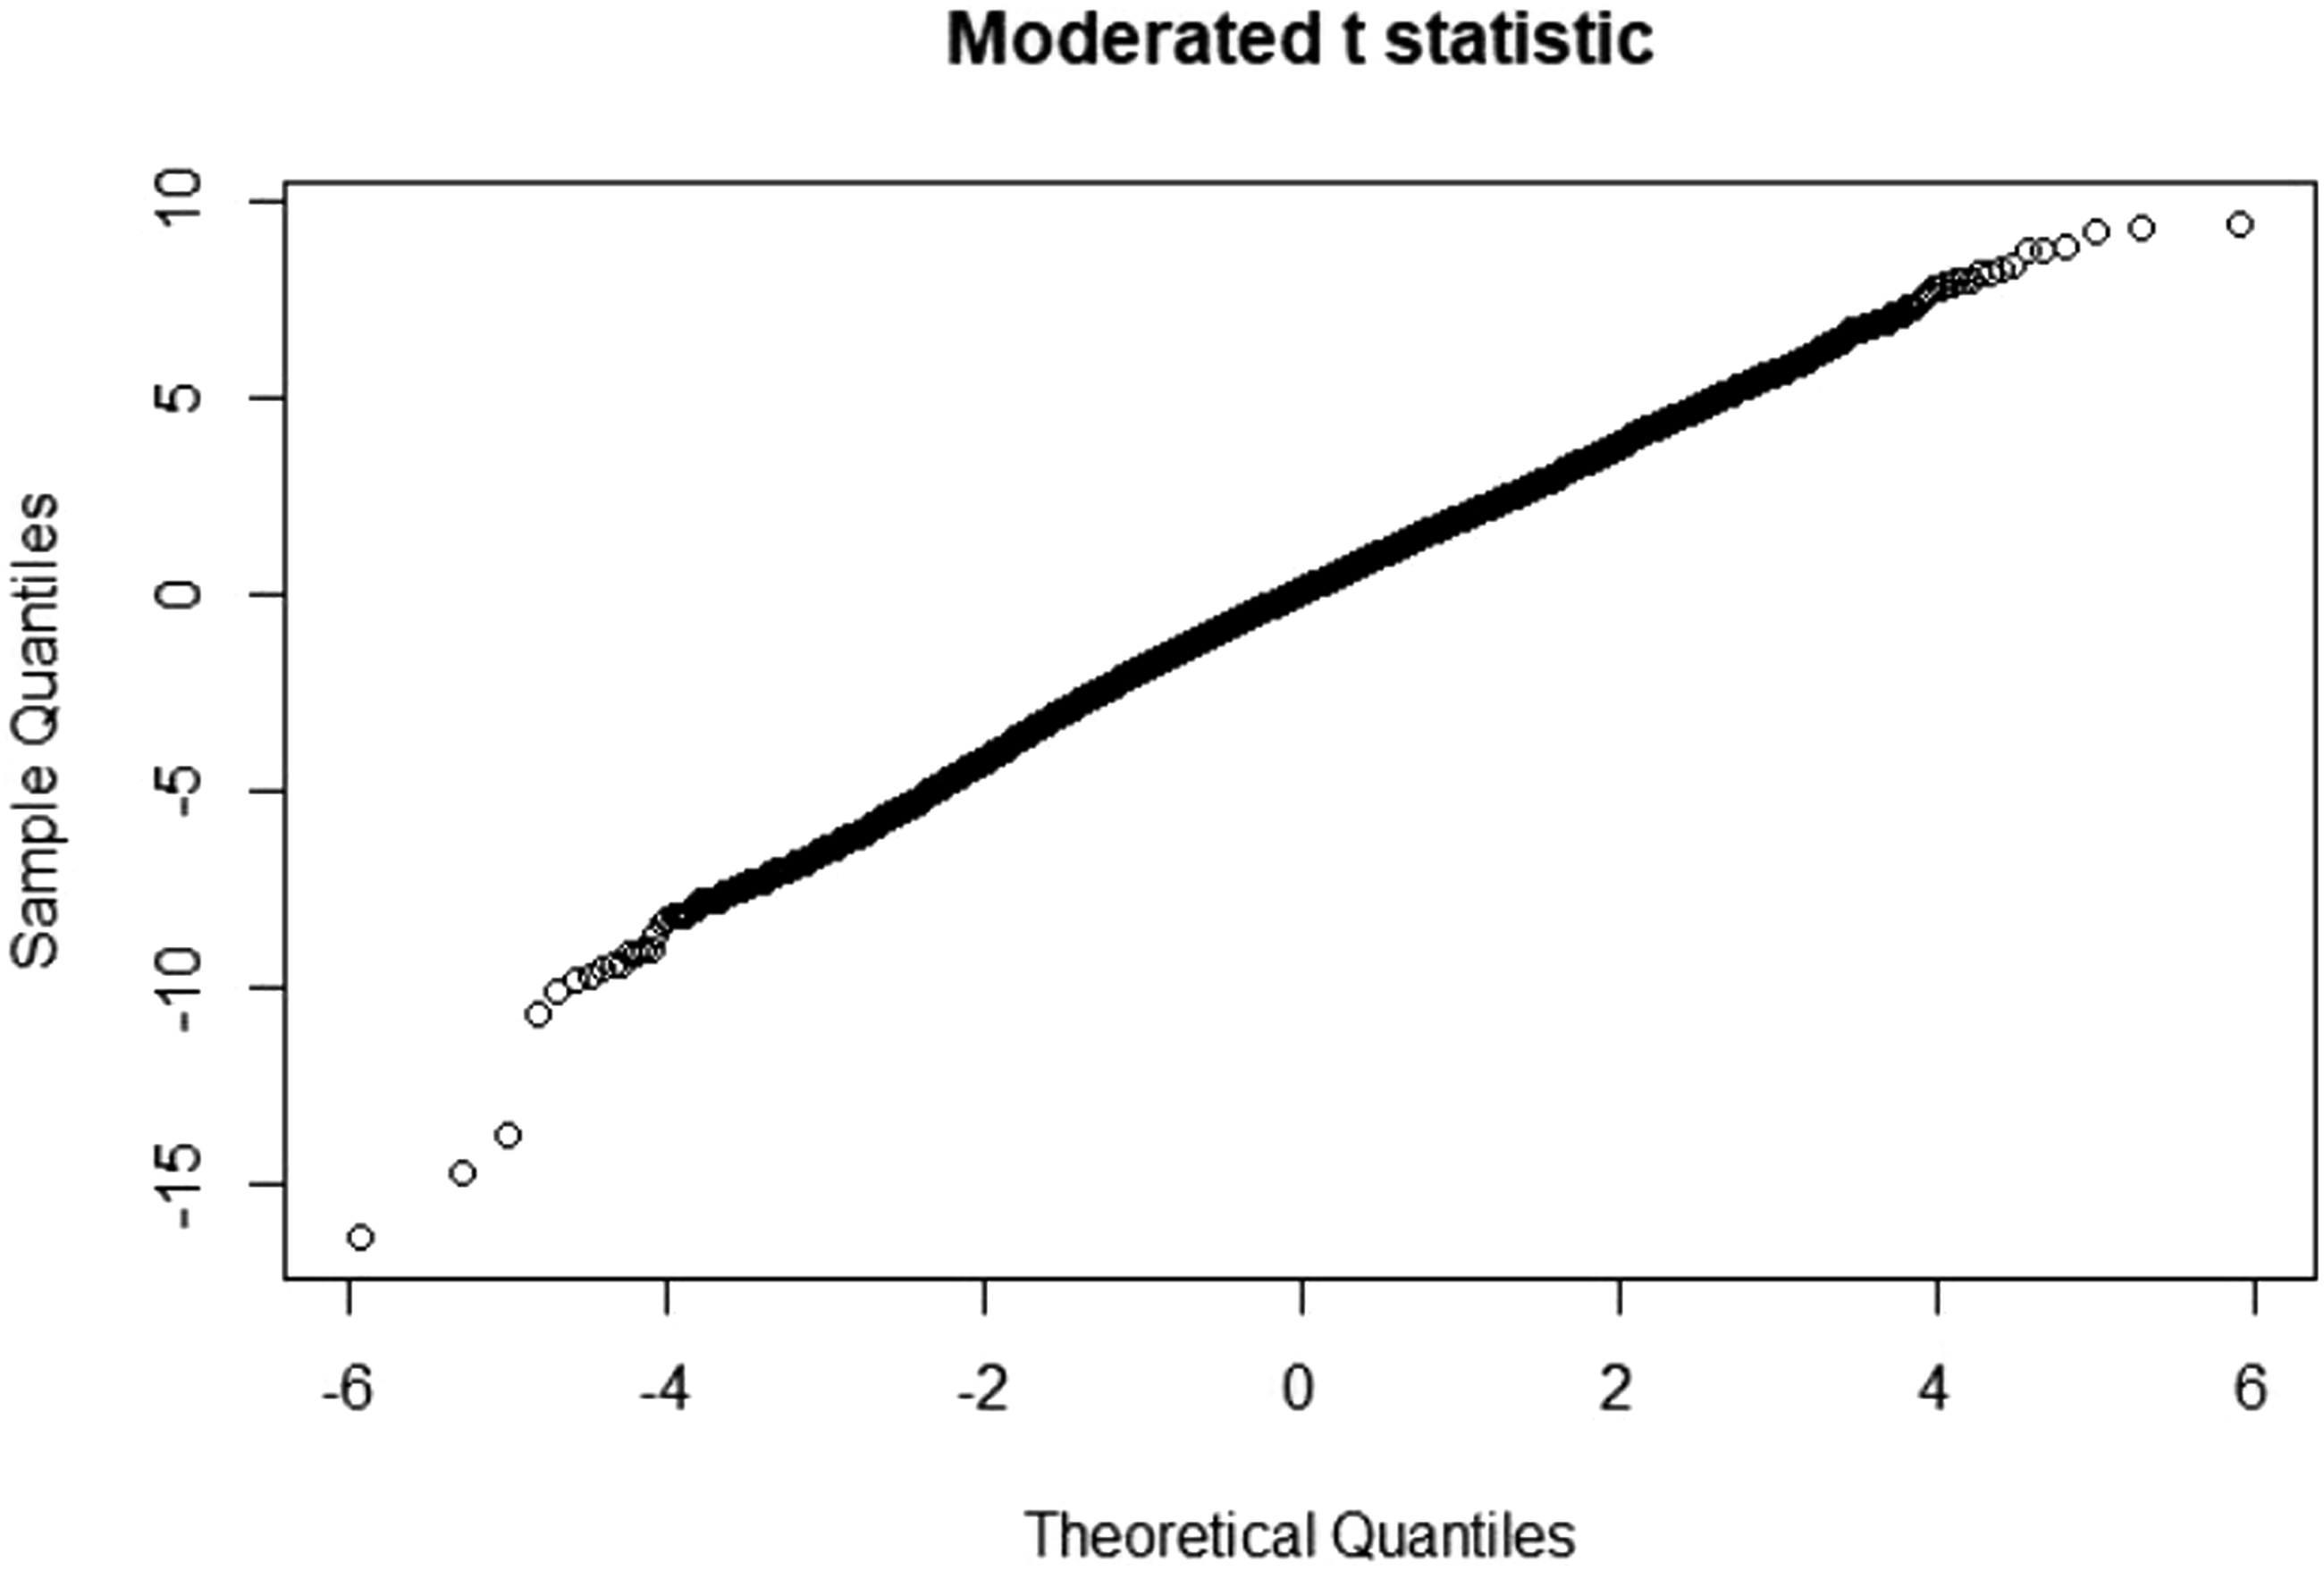
Mean-variance trend plot
After fitting a linear model, a mean-variance trend plot using R limma predicts the mean-variance relationship. The graphic shows if there is variability in the data. Each dot represents an RNA. The red line is a mean-variance trend assumption during differential expression analysis. The blue line is the variance prediction constant. This Graph generates without grouping selections. A logFC analysis indicates the log2 fold-change between the experimental conditions, as seen in Figures 37–40 for four sample groups. Mean-variance trend plot. Mean-variance trend plot. Mean-variance trend plot. Mean-variance trend plot.


Differential expression analysis
Significant DEG exists in all four groups, as presented in the Supplemental files 1-4. Some of the examples of identified results include:
Supplementary file 1: Tbc1d8 (p-value = 5.24e−14) and Stk26 (p-value = 1.47e−13) present in exosomes, membrane, nucleus, and cytoplasm perinuclear region. These extremely small p-values suggest a highly significant result, and implies high statistical power, especially if the sample size is adequate. When p-values are this low, the probability of a Type II error (false negative) is very low, indicating strong evidence that these genes are differentially expressed.
Supplementary file 2: Ido1 (p-value = 1.06e−10) and Calcr (p-value = 1.34e−10) present in tolerance induction, positive regulation of apoptotic processes, positive regulation of interleukin 12, protein localization in the plasma membrane, protein transport, etc. Again, these very small p-values suggest a high statistical power. Given such strong statistical significance, these results are likely reliable, and the chance of a false negative result is very low.
Supplementary file 3: In the 3rd group, comparing PFC R Control and CPU S Control, there are significant genes Copg1 (log 2 fold change = −0.67)and Atp6v0d1 (log 2 fold change = 0.285) and when comparing CPU S control versus CPU R control are Txnip (log 2 fold change = 0.58) and Aldh1a1 (log 2 fold change = 0.745). The log2 fold changes are not extremely large but still show differences between the groups.
Supplementary file 4: In the 4th group, comparing PFC FVB MPTP and CPU FVB MPTP, there are significant genes Atp6v0d1 (log 2 fold change = 0.225) and Ppm1a (log 2 fold change = 0.195). These are small log2 fold changes, indicating a small effect size.
A detailed list of genes and location changes is present in Supplemental files. Log2F change indicates how much the gene expression changes between conditions, where positive values indicate upregulation and negative values indicate downregulation. Evidence against the null hypothesis with lower p-values applies. Common types of identified DEG are involved in inflammation and immune responses, cell cycle and proliferation, apoptosis and cell death genes, stress response genes, metabolism-related genes, transcription factors, and developmental and cancer-related genes. Upregulation of genes like TNF and IL6 exists in the response to inflammatory stimuli and diseases involving immune activation. Upregulation is present in the case of CCND1 and MCM7 in tumors where downregulation suppresses cell proliferation. BAX and CASP3 are upregulated in increased cell death and downregulated in inhibited apoptosis. HSPA1A and GADD45 A activate in response to cellular stress and exposure to toxins. PKM2 and SIRT1 are up or down-regulated depending on metabolic changes associated with disease states and treatment. NF-kB and P53 indicate changes in gene regulation pathways with diverse biological processes. SOX2 and FGF2 connect to developmental disorders and cancer, while MYC and BRCA1 are up and downregulated in various cancers.
General Insights on Statistical Power on the provided results indicate high power with the extremely low p-values in Supplemental Files 1 and 2 (on the order of e−14 and e−10) suggesting that the statistical tests for these genes had very high power. This means the chance of failing to detect a true difference (Type II error) is extremely low. Moderate power exist for genes with small log2 fold changes in Supplemental Files 3 and 4, detecting significance despite small effect sizes likely required a good sample size. The statistical power in these cases could still be high if the sample size was sufficiently large to detect small changes.
Specific insight on Statistical Power on the provided information indicate specific results for each group in R software. The check for function availability show the presence of pwr.t.test in the list, so the study proceed using it.
The output for functional availability check is:

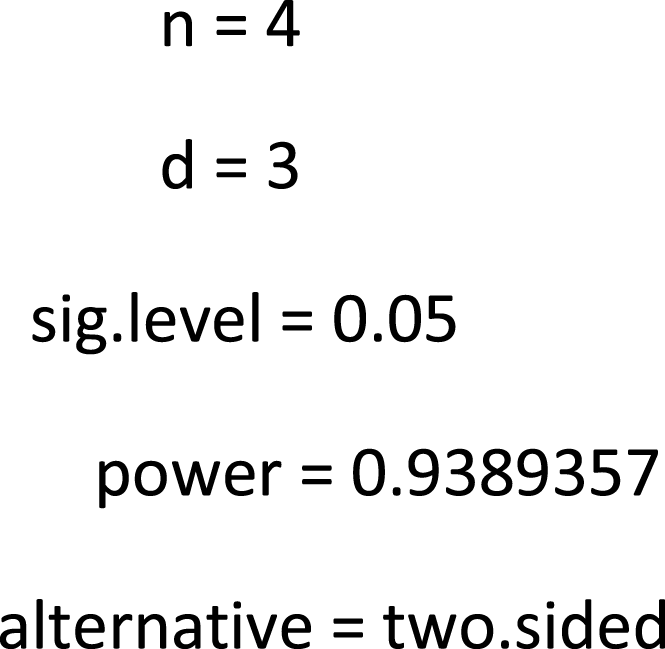
The power analysis show different results, depending on the statistical test and size effect. In the case of 3a example, one sample group t test, with effect size 1.5 and n < - 4 sample size per group, provided an output.
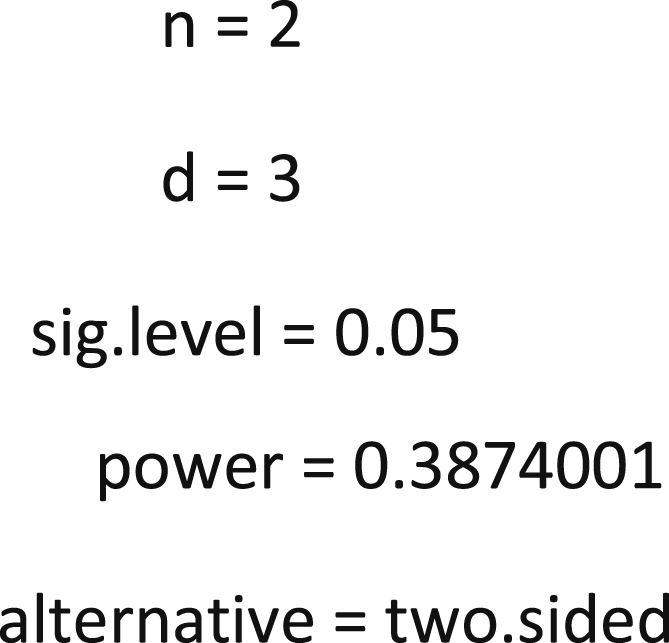
Two-sample t test power calculation
When defining the same effect size with two sample groups (n_control <-4 and n_mptp<−2), power calculation for PFC comparison (S control vs S-MPTP) show output results:
[1] “Power for S control vs S-MPTP (PFC):”> print(power_result_pfc)

When the effect size is 0.5, defining parameters change along with the power calculation and the final results:
[1] 0.146609
When we repeat the calculation for other comparisons, we gain the same results.
[1] 0.146609
When power calculation is done for CPU comparison, the results show output:
[1] “Power for S control versus S-MPTP (CPU):”> print (power_result_cpu)
Two-sample t test power calculation
When the effect size is 0.5, defining parameters change along with the power calculation and the final jittering results is 0.79.
Results of power analysis when comparing power analysis for all other groups are:

Functional enrichment and pathways analysis
This type of analysis indicates the involvement of cell cycle regulation, RNA processing, and immune response with KEGG pathways. Genes controlling G1, S, G2, and M phases are CCND1 and CDK2 upregulation, leading to cell proliferation and cell cycle point dysregulation. PRPF8 and SNRNP70 up-regulation indicate enhanced dysregulation of RNA processing that affects gene expression, where up-regulation of IL6 and TNF reflect an inflammatory immune activation state.
KEGG pathway analysis
KEGG pathway analysis showed involvement of diverse pathways like (a) cell cycle (hsa04110); (b) RNA transport (hsa03013); (c) Complement and Coagulation Cascades (hsa04610); (d) Toll-like Receptor (hsa04620); (e) p53 Signaling Pathway (hsa04115);. Genes involved in these pathways and biological processes are diverse and registered as:
(a) cell division in tumorigenesis (CCND1, CDK2, CDC20); (b) cell responses (XPO1 (Exportin 1), RAN (Ras-related Nuclear Protein; (c) immune response and inflammation (TLR4 (Toll-Like Receptor 4), C3 (Complement Component 3)); (d) cell control and apoptosis (TP53, MDM2). A detailed list of genes, pathways, and roles are present in the Supplemental files.
This type of result enables an understanding of the functional implication of the DEG in therapy.
Potential total-RNA biomarker identification
Lists of all potential top biomarkers are present in the Supplemental files. In the case of the GSE31458 dataset and platforms like Affymetrix Mouse Genome 430A 2.0 Array (GPL8321), the most common total RNA molecules detected are: a) mRNA (MYC and Ras, TP53, BRCA1); b) lncRNA (HOTAIR, XIST); c) miRNA (miR-21, miR-155); d) snRNA (U1, U2); e) snoRNA (U3 snoRNA, Box C/D snoRNA); f) rRNA (18S rRNA, 28S rRNA), making it a disease biomarker enabling insight into gene regulation and potential therapeutic target.
Based on all provided information in this GSE31458 dataset, we have more than 20.000 analyzed genes, 100 significant upregulated genes, 80 significant downregulated genes, 15 significant pathways identified, and more than 12 significant biological processes identified. Detailed information regarding outcome events and unadjusted and confounded adjusted estimates is present in Supplemental files. Category boundaries for continuous variables in the GSE31458 dataset exist in gene expression level, fold change and statistical significance. Gene expression categories are low (25th percentile; <5.0), medium (25-75th percentile; 5.0-10.0), and high (>75th percentile; >10.0) expression groups depending on the percentile and category boundaries. Fold change (log2FC) in the results indicate down-regulation (<-1.0), no significant change (−1.0 ≤ 1.0), or upregulation (>1.0). When comparing statistical significance, p values indicate statistically significant (p < .05) and not significant (p ≥ .05) change. This threshold is selected based on the biological relevance, data distribution, and specific research question.
When considering the estimate translation from relative to absolute risk during a meaningful period, we can use additional formulas like:
Relative risk to assess the risk of an outcome in exposed groups compared to the risk of a nonexposed group
And to calculate the actual probability of an outcome occurring in a group with absolute risk:
To translate relative risk into absolute, baseline absolute risk is determined in the nonexposed group. We calculated the risk in the exposed group by using the formula:
Since there is no detailed information in the primary study regarding the study period, we can assume that the study length is 1 year to ensure that the absolute risk translates into a meaningful time frame. Making it that there is a 2.5% relative risk and a baseline risk of 10% over a year.
Based on these findings, the exposed group has a 25% absolute risk of the outcome over the specific period.
Association with specific gene expression profiles led to the calculation of 3.0 RR when comparing mice with high gene expression, compared to lower expression, and the baseline absolute risk of PD in mice with low gene expression is 5% (0.05) over 5 years. Making results like this applicable to clinical and epidemiological studies enables the translation of the results into meaningful implications.
Discussion
Key results correlate with the study objectives. Significant gene expression differences exist between the MPTP and control sample groups. Upregulated genes are associated with oxidative stress, neuroinflammation, and cell repair in the MPTP group. DEG analysis showed that regulated genes correlate with synaptic plasticity and neuronal function, showing reduced expression in the MPTP group. Significant findings are genes GFAP (upregulated) and CAMK2A (downregulated) with log2 fold changes in mice where PD exists. Pathway and functional enrichment analysis indicate cell stress, RNA processing, splicing, and immune response, where upregulated genes are associated with MPTP exposure, whereas KEGG pathway analysis confirms these findings. Subgroup and interaction analysis identified a significant interaction effect between treatment and strain, where strain S showed more pronounced changes with PFC to MPTP exposure. Sensitivity analysis validated the robustness of the findings, where results remained consistent across different methods using normalization procedures. Based on the GSE31458 dataset, significant gene expression genes exist for MPTP treatment associated with oxidative stress and inflammation. These results contribute valuably to the molecular mechanism underlining the neurotoxicity contributing to PD. These findings represent a promising strategy for further research of targeted therapeutics in clinical and scientific research.
The computational method conducts research in a spectrum of scientific areas of neurodegenerative diseases, cancer, cardiovascular diseases, molecular biology, physiology, and genetics using GEO2R data analysis and R programming language. 21 An advantage is a multidisciplinary approach. Empirical research emphasizes quality theoretical papers. 22 Due to rising competitiveness among scientific disciplines, appropriate statistics is becoming an integral part of research institutes and academia. 23 The main differences in the analysis and interpretation of the results depend on the statistics. 24 In this study, we tried to examine the hypothesis to identify all influential factors and the complexity and size of sample data and groups. Based on this, we included 4. comparison sample analyses with the same statistics. With great certainty, using the limma package, we successfully found total RNA molecules in the Parkinson’s disease samples and control samples and their mutual relationship. The structural model gives information on theoretical model prediction. Larger datasets would enable more precise conclusions in research studies. Sample size determines the final values and strength of the relationship. p-value excludes false positive results. BH tests identify significant genes within groups by GEO2R analysis. Observation weight sample level observes along with identical distribution values. The tables display the final results regarding mutual interaction within diverse sample groups. Test variables enable us to see significant or not significant differences within the proposed biomarkers in PD.
Bioinformatics decreases the financial resources needed for available sample studies and ethical aspects of molecular biology and genetic studies. 25 Future research should benefit from gaining knowledge about molecular interactions and potentially expressed genes among total RNA molecules within investigated samples. The limitation of the study is the analysis of animal models and the sample size. Bioinformatics enables an understanding of the relations among diverse analyzed molecules and research models. 26 Because of this, law regulation is significant in maintaining the stability and security of analyzed data. 27 Uniforming legal standards for bioinformatical studies should be consistent, complete, reproducible, and acceptable to eliminate barriers in requirements and national legislations, update and supplement analyzed data, enabling solutions and understanding of Parkinson’s disease models. 28 Technological neutrality, informational equality, and anonymity of participants will provide better comprehension and implementation of knowledge regarding Parkinson’s disease and innovation. 29 Research budgeting requires a planning process, and every analysis represents the responsibility of the institutions and affects the performance and accountability of the research results. 30 Reducing costs, the institution is increasing the value prediction of predictive data and people. A budget enables operating balance among demands, activities, and resources, resulting in predictability and efficacy. 31 Bioinformatics data help utilize applicable processes to eradicate the arousing budgeting problems by increasing results predictability and institutional leadership. 32 The results of this study confirmed a hypothesis using a diverse approach. The development of young talents within research, academic institutions, and industry will provide the attraction, retention, and development of human capital and problem resolution. Without people, problem resolution wouldn’t arise. 33
Education is a crucial investment in any country and is significant for sustainability and economic development. Access to appropriate technology eradicates challenges and limits factors in disease understanding and therapy. 34 Strategies such as GEO2R analysis, bioinformatics, and statistics improve working research conditions, results understanding, and precision. Diverse factors like geological structure and environment impact the amount of total RNA molecules in the development and therapy of PD. 35 Data transparency, identification of process compatibility, risk identification, and error correction will enable disease eradication from the population or modest interaction satisfaction within total RNA molecules and gene expression profile. 36 Developing entrepreneurship in Software development bioinformatics and statistics will help cope with the changing environment. We should expect that valuable results interpretations and potential total RNA molecules and expression profiles may arise and will function in the development of this scientific discipline. 37
Human beings have to be respected. Their rights, life, rights to information, right not to know, and absence of discrimination based on genetic heritage to protect human rights and dignity. 38 In silico studies skip gaining informed consent for obtaining biological material and protecting private life and information. We didn’t need ethical research confirmation since we used open data on the GEO2R website. However, in research analysis, the applicability of law regulations is necessary for the clinical investigation of drugs and is significant in protocol approval during trials. Conducting EU regulations is notable for accession, legislation, regulation, and implementation of norms, standards, and ethics in molecular biological testing. Disease prevention, identification, therapy, and eradication are victorious thanks to advancements in modern technology and increasing competence within the field. 39
Identification of further research could enhance understanding of remaining questions like follow-up studies. Using different datasets, species, and experimental validation studies can confirm their role in other conditions and biological roles, exploring the underlying molecular mechanism and enabling understanding of how identified genes and pathways contribute to the observed phenotypes. Longitudinal studies understand how genes progress over time with omic data for a comprehensive understanding of the biological processes, making the view holistic. 40 Population studies enable the generalizability of the results involving different strains and human populations. 41 Therapeutic targets in translational research and clinics apply along with drug development, clinical trials, and personalized medicine in diverse ways in practice, policy, and further research exploration, so proper discussion is a must to demonstrate the real-world impact of the findings. 42 For example, results could be applicable in clinical practice by identifying potential biomarkers that could be a diagnostic tool to monitor disease onset, progression, outcome, and treatment. Results could influence public health policies and clinical guidelines by enabling preventive measures, diagnostic criteria, and treatment strategies. 43 Public health recommendations arise from discovering environmental factors contributing to significant gene expression change. 44 The results could lead to potential further research exploration, generating hypotheses, and developing future research tools and methods, implemented in educational material for students and professionals in significant fields, contributing to knowledge base training in bioinformatics., molecular biology, and genetics and enabling the dissemination of knowledge to a broader audience, promoting knowledge transfer and encouraging collaboration. Moreover, the results could be applicable in biotechnology, the pharmaceutical industry, and agriculture, depending on the nature of the study. Broader relevance is the practical application of the research findings that can affect the publication results, representing how this study can contribute to future research with real-world application contributing to scientific knowledge, healthcare, policy, and industry.
During the regular review, it is significant to have iterative processes to refine the analysis plan as new data and insights arise during the study. 45 Collaboration with statisticians and subject matter experts should emerge during the study. Flexibility and adaptability of new data, emerging insights, and unforeseen challenges will enable research iterations by regularly reviewing the analysis plan, incorporating feedback, adapting to new data, and documentation and engagement with collaborators, incorporating a new, more appropriate methodology based on the preliminary results, results should be updated and checked. 45 Re-running analysis, expanding sample size, and exploring new variables can be integrated into the results, enabling a plan for follow-up studies with a more focused methodology and collection of experimental data. 45 Documentation should follow up on additional changes and rationales behind the changes, making papers more transparent and reproducible about how research evolved. 45 The study will be of better quality and depth by sharing knowledge, discussing progress, sharing preliminary results, and brainstorming potential challenges and new directions, making it beneficial when dealing with multidisciplinary research to interpret data. Statisticians are crucial for checking data quality and interpretation and suggesting an appropriate methodology for analysis. Subject matter experts can enable knowledge of biological, clinical, or environmental significance based on the results found. Checking the writing and review process ensures comprehensiveness of the findings of the results, enabling accurate word expression. Iterations are necessary for a successful research project to refine the analysis plan. The study is more robust, credible, and impactful by overcoming the challenges, aligning it with the objectives, and contributing to valuable knowledge in the scientific community worldwide. Following this research plan in this study, analysis is systematic and rigorous, producing valid and actionable results.
Study limitations exist in this manuscript regarding small sample size, strains, region-specific variability, interaction confounding, missing data, platform-specific limitations, and generalizability to potential imprecision in data interpretation and understanding. Study limitations can influence the findings, where future studies with larger sample sizes are more controlled experimental designs, and additional validation models need to confirm and extend the findings.
The total sample size is relatively small, with 29 samples in total. Some groups, S-MPTP in the PFC and R-MPTP in the CPU, have 1 or 2 samples, where these small sample groups can lead to insufficient power to detect statistically significant differences. In this sense, with a small sample size of 1 and 2 samples, there is a high risk for low statistical power, increasing the likelihood of type I (false positive) and type II (false negative) errors, where effect detection fails, making it difficult to generalize the results, making it less reliable with high variability with skew results. This study utilizes a small sample size for several reasons. The data is from the pre-existing publicly available dataset, with specific inclusion criteria like treatment groups, tissue, genetic background, and mouse strain. Since this study didn’t generate new data, it suggests the limitation of the available data in the dataset. The study focuses on specific genetic and experimental variables, starting from mus musculus, narrowing the research scope to rare specific conditions, limiting the number of available samples, and justifying a small sample size. Data pass rigorous preprocessing and quality control, with steps of background correction, normalization, batch effect correction, and outlier detection to enable high-quality data confirming reliability even in the case of small sample size, minimizing the noise and variability. The study supports comprehensive coverage of gene expression of 22600 characterized mouse genes with the platform GPL8321 [Mouse430A_2, compensating for sample size and providing rich data. Cost and resource constraints involve animal models with complex treatments like MPTP exposure and transgenic variants, affecting the study cost and logistics challenges of maintaining animal models and conducting sophisticated molecular analysis. The study is a pilot exploratory, investigating gene expression changes correlated to neurotoxin-induced PD. This type of study uses a smaller sample size to gather initial insight before scaling up experiments. Methodological rigor controls confounding variables with randomization, batch effect correction (ComBat and SVA), and covariates in statistical models (strain differences, brain region, age, sex), ensuring that small sample sizes do not negatively impact findings. Ethical considerations in animal studies are significant for decreasing the number of animals. We used in silico bioinformatic analysis of the existing dataset, avoiding unnecessary animal experiments while still gaining insight into the process of focusing on high-impact differences in gene expression. With adequate statistical analysis, a small sample size detects a size effect in the controlled analysis. Prior knowledge and comparative analysis apply in the study, making it a good foundation for understanding MPTP-induced PD in mouse models, enabling focus on the analysis confirming and expanding the mechanisms while justifying the small sample size. Based on the proposed information, the study focuses on a small sample size due to a combination of pre-existing data that focus on specific genetic and experimental conditions while implementing advanced statistical techniques that control the variability with comprehensive support coverage from Affymetrix platform, bioinformatic pipelines, and quality control measures enabling reliable results despite limited sample numbers.
Despite the small sample size, results are reliable for high data quality, consistency, biological relevance, rigorous experimental control, and advanced analytical techniques. RNA-sequencing and omic technologies include high sensitivity and precise measurement. Consistency among patterns and findings across a few samples indicates a random chance, where statistics assess consistency and significance. Although the sample set is limited, confirmation of previously identified pathways and hypotheses provides a finding confirmation in a limited dataset. The applicability of controls in the study variability reduces and strengthens the conclusion even with a few samples. Small sample sizes can compensate by specific statistical and machine learning methods that extract more information than traditional methodology. Small sample sizes apply in exploratory research. The results are informative, with a foundation for further investigation in larger datasets cohort studies. Small sample size results are reliable due to population homogeneity, focusing on rare phenomena in pilot or preliminary studies. The small sample size is reliable if the sample is homogeneous with similar genetic and environmental backgrounds, where few samples are enough to detect meaningful differences, and where studies involving more complex populations require a large sample size to detect meaningful differences. Rare diseases and genetic mutations can be challenging to detect, and a small sample number presents a significant insight into diversity and disease complexity. Preliminary studies explore the feasibility, refine methodology, and identify trends enabling guidance to large-scale studies. Replicating independent studies and datasets enables consistency to support the reliability of the findings despite the small sample size. Ethical consideration can limit the exposure of harmful interventions to subjects, limiting the number of study participants. For example, some studies depend on technology resources, limiting the number of samples for processing where sequencing and proteomics can generate high-quality data with reliability. Moreover, in genetic studies, some mutations have a profound effect, enabling the detection of differences between subjects contributing to the results, although the number of samples is small.
In other cases, a small sample size is enough in longitudinal studies over some time, enabling researchers to collect repeated measures for each subject and increasing the statistical power by capturing dynamic changes in time. Detailed analysis in clinical settings of a few subjects enables comprehensive observations, measurements, and deeper insights with a small number of samples, offering new hypotheses for future research in the specific area. Sometimes, researchers can use surrogate, well-known biomarkers and apply them in small sample sizes to draw meaningful conclusions with immediate insight into the waiting for the development of the clinical outcome. In studies with matched pairs, experiments, and control, variability requires a small sample number in the analysis. Bayesian method implements prior knowledge, enabling a smaller sample size for the analysis. Fewer confounding factors in a small sample size reduce noise and control the environment. There are clinical trials in which one individual is studied across different conditions over time (N of 1 trial), enabling personalized insight in personalized medicine. Meta-analysis usage combines data from multiple studies, increasing sample size and providing a more robust conclusion where small size numbers broaden the research field. A theoretical framework supports small sample studies when predictions are clear and precise. Simulation computational models validate the experimental findings and make results reliable despite limited data.
While researching endangered species, rare cells, and historical and archaeological artifacts have limited access to samples. In this case, small sample sizes enable critical insights since they are rare opportunities to research without replication. Using high-precision tools like CRISPR gene editing, atomic force microscopy, and super solution imaging, enables high quality and precision of analyzed data, compensating for small sample size and leading to more reliable conclusions. Moreover, the sequential testing approach in which the sample size starts small increases when the results are not conclusive, enabling researchers to adapt and expand. In studies involving high-throughput sequencing, a small sample size can be highly informative when strong patterns emerge across molecular features. Synthetic data provide insight and test hypotheses to help validate results for limited data. In patient treatment, drug therapy can show success in a small number of patients, generating significance for future trials.
This study mentioned all the rationalities, supporting the small sample size and providing justifications. In this case, a small sample size with a robust study design, advanced methods, statistical techniques, high data quality, specific focus area, and methodology.
The precision of effect estimates is likely low, leading to wide confidence intervals and increased uncertainty of the proposed results, limiting the generalizability in a broader population. The observed gene expression changes are associated with multiple strains (S<R, FVB/N) and brain region (PFC, CPU), leading to overestimation of treatment effects and underestimating them in others, complicating the interpretation of the results. Confounding factors like age, sex, and environmental conditions are not controlled compared to strain, treatment, and brain region. Not controlling confounding can lead to incorrect attribution of gene expression changes to treatment compared to environmental factors. This manuscript didn’t introduce any missing data, making it potentially demanding to quantify the robustness of the findings. GPL8321 [Mouse430A_2] Affymetrix Mouse Genome 430A 2.0 Array platform can have a potential limitation like probe specificity and cross-hybridization issues. This limitation can lead to technical imprecision, causing false positives and negatives, impacting the accuracy of gene expression measurements for low abundance transcripts. The generalizability of the findings may not be transferable to human or similar studies with different model systems, leading to over and under-estimation of the gene expression profiles of the finding, reducing the relevance of the study findings to broader neurotoxicity research. All these factors can cause misleading of the study directions and magnitude of the observed effects.
Conclusion
Several conclusions for the dataset GSE31458 exist regarding potential biomarker identification and biological implications. The study identified potential total RNA biomarkers with high log2 fold changes and low p values belonging to mRNA, lncRNA, and miRNA. Genes with significant expression changes are detected between MPTP and control groups and are related to oxidative stress, neuroinflammation, and synaptic plasticity. Biological pathways and functional insight indicate up and down-regulated genes involved in cell cycle checkpoints relevant to proliferative conditions and cancer. Changes in RNA processing indicate alterations in gene expression regulation, affecting gene expression stability, where upregulation of immune response genes indicates active and dysregulated immune responses relevant to inflammatory and autoimmune conditions. KEGG pathway presents genes involved in cell cycle division, RNA processing and export, and potential changes in immune responses. Identified biomarkers and pathways should be validated in other datasets to conduct cross-validation of datasets, confirming their relevance and robustness. Pathway enrichment analysis indicates pathways related to cell cycle regulation, RNA processing, and immune response, suggesting that MPTP exposure impacts critical biological processes. Moreover, MPTP exposure has different effects depending on the mouse strain and region specificity. Additional experiments should confirm validation and asses these biomarkers as a prognostic, diagnostic, and therapeutic potential.
Identified genes and pathways represent potential biomarker candidates, enabling insight into the molecular mechanism and suggesting areas for further research exploration. Further studies should focus on biomarker validation, understanding their functional roles, and exploring their potential applications in scientific and clinical practice. We can conclude that the analysis of the GSE31458 dataset led to potential biomarker detection along with significant pathways in the specific condition. Further steps include findings validation, understanding the biological significance, and exploring their application in clinical practice, diagnostics, and therapies. Small sample sizes in certain groups are challenging due to the finding of robustness, reliability, and generalizability. Because of that, it would be beneficial to increase the sample size, especially in the groups with only 1-2 samples, to increase the statistical power and reliability of the findings. Primary data is from previously conducted studies, where additional validation studies might need to confirm the findings. Gene expression changes may not fully capture the complexity of the molecular biological changes within the cell and organism. MPTP exposure is modulated based on genetic and anatomic differences, meaning the study could not be generalizable to humans without further validation. The results should be considered exploratory and hypothesis-generating more than definitive since comparisons are across diverse genes, pathways, and interactions that can lead to type I error, although the effort of controlling this through p-value adjustment. Moreover, while providing valuable insight as an array platform, it can enable potential technical biases related to probe sensitivity affecting the accuracy of gene expression measurement in low abundance transcripts.
Comparison with similar studies indicates consistency of the finding with a unique contribution. For example, identified pathways related to oxidative stress and neuroinflammation are consistent in other studies with neurotoxicity, neurodegeneration, and PD.46-53 This study adds the pies of the puzzle in the knowledge of strain-specific and region-specific responses to MPTP exposure. This research could provide a basis for target investigation in genetic and anatomical factors contributing to neurotoxicity and development of PD, providing valuable insight into the molecular mechanism of MPTP-induced PD. The study should interpret results with caution due to limitations of sample size, variability in responses, and technical biases. The study results are consistent with broader research result evidence in the specific field. There is a need for further validation through sample size, more controlled study, and replication in diverse model system organisms. This study does not lead to a conclusion and suggests the need for further research avenues.
Acceptance of bioinformatics statistical methodology along with law legislation will enable methodology standardization and development along with scientific communication worldwide. The research model should increase liability and quantify molecule relations. Standards of low-price analysis and high predictability and security will be significant. Minimizing the research budget and increasing the productivity of research results will improve practical quality management, underlining relevance in problem-solving of money research in Serbia.
There is a continuity in institutional budgeting and traditional concepts of conducting research analysis in vitro and silico. Enable identification, quantification, and determination of total RNA molecular interactions within diverse disease models where empirical research doesn’t confirm discrepancies. Limitations like the economy, policies, politics, and delegation authority problems affect the final research outcome. Researchers deserve more space to increase the creativity of problem resolutions, representing a secure road map in disease detection, therapy, and eradication. Education development enables the creation of a new solution to the current question topics. Developing researchers within diverse areas will contribute to the elevation of quality of work performance and contribution to the world and disease patients. The disease image will be complete, along with therapeutic efficacy and disease eradication increase. Staff management and creativity are starting to perform high-quality research science and final disease understanding. Understanding socio-economic differences and the environment will enable investigating the effect on specific total RNA and the development of PD, therapy, and eradication without any complex methodology. Researching the rural areas, public transportation systems, education and work programs, lifestyle, and population density will enable a better understanding of the total RNA level and gene expression profiles among patients with Parkinson’s disease. The external validity has constraints due to species differences, strain specificity, brain region, and controlled experimental environment. These results provide valuable insight into molecular mechanisms of MPTP-induced neurotoxicity in mice. Further human studies are necessary to assess the effect of diverse environmental factors.
Supplemental Material
Supplemental Material - Analysis of total RNA as a potential biomarker of Parkinson’s disease in silico
Supplemental Material for Analysis of total RNA as a potential biomarker of Parkinson’s disease in silico by Snežana M Jovičić in International Journal of Immunopathology and Pharmacology.
Footnotes
Acknowledgments
I want to acknowledge the kind support of my parents for their sustained love and support. Thank you for enabling me to be who I am. Moreover, I want to thank the people who contributed to my education. Thank you all for being a part of this lovely Snežana (Snow White) story, my life story. Life writes novel.
Author contributions
The author was solely responsible for the study's conception and design, data acquisition, analysis, and interpretation. Additionally, the author drafted, reviewed, and approved the final manuscript for publication.
Declaration of conflicting interests
The author(s) declared no potential conflicts of interest with respect to the research, authorship, and/or publication of this article.
Funding
The author(s) received no financial support for the research, authorship, and/or publication of this article.
Supplemental Material
Supplemental material for this article is available online.
Appendix
References
Supplementary Material
Please find the following supplemental material available below.
For Open Access articles published under a Creative Commons License, all supplemental material carries the same license as the article it is associated with.
For non-Open Access articles published, all supplemental material carries a non-exclusive license, and permission requests for re-use of supplemental material or any part of supplemental material shall be sent directly to the copyright owner as specified in the copyright notice associated with the article.