
Abstract
Keywords
Introduction
Diabetes mellitus (DM) is a major health problem due to its high risk of multiple complications, including liver disease, heart disease, stroke, and diabetic nephropathy. 1 Although type 1 diabetes mellitus (T1DM) accounts for only approximately 10% of the diabetes cases, 2 its early onset and the central role of the liver in metabolism make T1DM a considerable risk factor for diabetic liver disease. 1 Although the liver damage and dysfunction associated with diabetes have been extensively described and studied in type 2 diabetes mellitus (T2DM), these have not been well addressed in T1DM. 3 Oxidative stress, apoptosis, inflammation, necrosis, and fibrosis are important contributors to the pathogenesis of diabetic liver damage.4–6 Recently, multiple studies have demonstrated that nonalcoholic fatty liver disease (NAFLD) is also a complication of T1DM.7,8 Thus, liver injury in T1DM and development drug interventions for its treatment require further research.
Several potential mechanisms have been implicated in the pathogenesis of diabetic liver injury, including the formation of reactive oxygen species (ROS), apoptosis, inflammation, necrosis, and fibrosis.9,10 Inflammation plays a crucial role in the development of diabetic liver injury. 11 Studies have shown that diseases characterized by a decline in lipid metabolism, such as T2DM, 12 metabolic syndrome, 13 diabetic kidney disease, 14 high blood pressure, 15 and NAFLD, 16 are all associated with an increased burden of inflammation. In addition, lipid metabolism disorders are involved in the pathogenesis of diabetic complication. 17
NOD-like receptor protein 3 (NLRP3) inflammasome is a multi-protein complex that stimulates caspase 1, leading to the maturation of interleukin (IL)-1β/IL-18, which trigger inflammatory reactions. 18 Blunting activation of NLRP3 is involved in the amelioration of inflammation in cardiac and metabolic conditions. 19 Nuclear factor-kappa B (NF-κB) is involved in regulating inflammatory signaling. 20 ROS can also activate NF-κB through mitogen-activated protein kinase (MAPK) pathways, promoting the expression of NLRP3, thereby promoting the activation of NLRP3 inflammasome. 18 In addition, NF-κB/NLRP3 mediates the progression of NAFLD by influencing lipid metabolic disorders.21,22 Hence, inhibition of NF-κB and NLRP3 might be a promising strategy in the discovery of new drugs for treating diabetic liver injury.
Several studies have shown that natural compounds may offer protective effects against diabetic liver damage.2,23 Sclareol (SCL), a diterpene alcohol isolated from Salvia sclarea, has various biological functions, including anti-tumor, anti-microbial, anti-inflammatory, anti-diabetic, and anti-hypertensive functions.24–26 Recently, the metabolic benefits of SCL have also been demonstrated in obese mice. 27 SCL has been reported to improve liver fibrosis in mice. 28 However, whether SCL ameliorates liver injury in T1DM is unknown.
In this study, we investigated the hepatoprotective effects of SCL against liver injury in mice with streptozotocin (STZ)-induced T1DM. Furthermore, we conducted in vivo experiments to examine whether SCL could suppress the NF-κB/NLRP3 pathway, thereby ameliorating inflammation and lipid metabolism disorder. This study provides an experimental basis for the use of SCL as a novel candidate for treating diabetic liver injury.
Materials and methods
Animal model
Male C57BL/6 mice (10 weeks old, 20 ± 2 g) were obtained from the Zhejiang Experimental Animal Centre (Hangzhou, Zhejiang, China). All mice were housed under specific conditions (22 ± 2°C, 12 h light and dark cycle, and 55% relative humidity). All the animals had free access to food and water. T1DM model was induced in mice as described previously.
29
STZ (100 mg/kg, dissolved in 0.1 M sodium citrate buffer (pH = 4.5)) was used to induce T1DM in mice. Fasting blood glucose concentrations were measured at week 8 and mice with fasting blood glucose ≥12 mmol/L were identified as diabetic mice. Sample size was calculated using resource equation approach and based on previous studies in this study.6,30,31 Twelve diabetic mice were randomly assigned to two groups (n = 6 in each group): (i) the T1DM group (0.5% sodium carboxymethyl cellulose (CMC-Na) solution, intragastrically (i.g.)) and (ii) the SCL treatment group (10 mg/kg SCL, i.g.). SCL was administered daily for 5 weeks. After treatment for 5 weeks, body weight and blood glucose levels were assessed (Figure 1(a)). The mice were intraperitoneally anesthetized with sodium phenobarbital (40 mg/kg). Blood was collected from the eyes of mice. The liver tissues were immediately removed and fixed in 4% paraformaldehyde for histological analysis. All animal experiments were approved by the Experimental Animal Welfare Ethics Committee of Zhejiang Academy of Agriculture. The liver index was calculated as follows: liver weight/body weight×100%. Improvements of body weight, liver index, and blood glucose by SCL treatment in T1DM mice (a) Illustration of experimental schedule. (b) Initial blood glucose levels were measured on the eighth week. (c) After SCL treatment for 5 weeks, final blood glucose levels were measured. (d) Body weight. (e) The liver index, which is the ratio of liver weight to body weight, were assessed after 5 weeks SCL treatment. Values are presented as the mean ± SD, n = 6. One-way ANOVA followed by the Newman-Keuls multiple comparison test was used for multiple groups (GraphPad Prism 7.0). *p < .05, ***p < .001 vs. control, #p < .05 vs. T1DM.
Liver histology
The liver specimens were immediately fixed in 4% paraformaldehyde for 24 h and embedded in paraffin. Then, the liver specimens were cut into 5 μm-thick sections and stained using a hematoxylin and eosin (H&E) staining kit (G1120, Solarbio Life Sciences, China) for histopathology analysis. Masson’s trichrome staining was used to assess fibrosis (G1340, Solarbio Life Sciences, China). Lipid accumulation in the hepatocytes was assessed using Oil Red O staining (C0157S, Beyotime, China). Sections were photographed under a microscope (Leica, Germany).
Blood biochemical indicators
Blood samples were centrifuged at 1000 g for 10 min at 4°C. The serum was used for blood biochemical index measurements. Serum concentrations of alanine aminotransferase (ALT), aspartate aminotransferase (AST), total cholesterol (TC), total triglyceride (TG), low-density lipoprotein cholesterol (LDL-C), high-density lipoprotein cholesterol (HDL-C), free fatty acids (FFA) were determined using an automatic biochemistry analyzer (Beckman, USA).
Transmission electron microscopy
The liver tissues were immediately placed in an the electron microscope fixed solution of 2.5% glutaraldehyde for 2 h, and then transferred to 1% osmium tetroxide in 0.1 M sodium cacodylate for post-fixation. Subsequently, dehydration using graded alcohol and acetone was performed on the slide. The tissues were embedded in Polybed 812 epoxy resin and cut into 70 nm-thick sections. Slides were counterstained with 1% lead citrate and 2% alcoholic uranyl acetate. The sections were observed under a transmission electron microscope (Hitachi, Japan).
Oxidative stress markers
Glutathione peroxidase (GSH-PX) activity was determined using a GSH-PX assay kit (A005-1; Nanjing Jiancheng, China) according to the manufacturer's instructions. Intracellular superoxide dismutase (SOD) activity was measured using an SOD assay kit (S0109, Beyotime, China).
The ROS levels in hepatocytes were analyzed using an ROS assay kit (S0033S, Beyotime, China). Briefly, the slides were incubated with a ROS solution for 30 min at 37°C in the dark, followed by washing trice with phosphate-buffered saline (PBS). After rinsing with PBS, the slides were counterstained with 4',6-diamidino-2-phenylindole (DAPI) for 10 min at room temperature and washed with PBS. Finally, antifluorescence quenching sealing tablets were used to seal the slides. Images were captured using a fluorescence microscope (Leica, Germany). The relative expression of intracellular ROS was calculated using the ImageJ software and expressed as the average fluorescence intensity (version 1.51, National Institutes of Health, USA).
Terminal deoxynucleotidyl transferase dUTP nick end labeling assay
Liver specimens were stained using an in situ cell death detection kit (11684817910; Roche, Switzerland). The slides were incubated with 20 μg/mL proteinase K for 15 min, followed by incubation with the TUNEL reaction mixture for 1 h. Cell nuclei were stained with DAPI (1:1000; C1002, Beyotime, China). The slides were examined under a fluorescence microscope (Leica, Germany), and three random fields were selected for each slide. The percentage of TUNEL-positive/DAPI-positive cells was calculated using the ImageJ software (version 1.51, National Institutes of Health, USA).
Immunohistochemical analysis
Immumohistochemistry conducted according to standard protocols was used to visualize the distribution of CD68, tumor necrosis factor (TNF)α, and IL-6 in each group. First, paraffin-embedded liver tissues were dewaxed and hydrated, followed by antigen retrieval and blocking with 5% normal goat serum. Second, the samples were incubated with primary antibodies against CD68, TNFα, and IL-6 for 4 h at 4°C and then washed trice with PBS. Finally, the samples were incubated with horseradish peroxidase-conjugated secondary antibodies for 2 h at room temperature and visualized using a diaminobenzidine (DAB) substrate. Images were obtained using a light microscope (Leica, Germany). The following primary antibodies were used: CD68 (1:800, ab125212; Abcam, USA), TNFα (1:800, ab6671; Abcam, USA), and IL-6 (1:800, ab290735; Abcam, USA).
Enzyme-linked immunosorbent assay
Blood samples were centrifuged at 1000 g for 10 min. To detect concentration of IL-6 (EK0411; Boster, USA) and TNFα (1217202; Dekewe, China) in serum, serum was used with enzyme-linked immunosorbent assay.
Western blotting
Total protein was extracted from the liver tissues using radioimmunoprecipitation assay (RIPA) lysis buffer (P0013B, Beyotime, China). Nuclear proteins were isolated using the Nuclear Protein Extraction Kit (C510002; Sangon Biotech, China). Protein concentration was measured using a bicinchoninic acid (BCA) protein assay kit (P0009; Beyotime, China). Proteins were separated by sodium dodecyl sulfate-polyacrylamide gel electrophoresis (SDS-PAGE) and electrotransferred onto polyvinylidene difluoride (PVDF) membranes. After sealing with 5% skim milk for 1 h, the membranes were incubated with acetyl-CoA carboxylase (ACC) (1:1000, #3676; CST, USA), sterol response element-bind protein (SREBP) 1 (1:2000, 14088-1-AP; Proteintech, USA), carnitine palmitoyl transferase 1 (CPT-1) (1:20,000, 15184-1-AP; Proteintech, USA), NF-κB p65 (1:1000, 66535-1-Ig; Proteintech, USA), NLRP3 (1:1000, ab263899; Abcam, UK), caspase 1 (1:1000, ab207802; Abcam, UK), IL-1β (1:1000, 16806-1-AP; Proteintech, USA), β-actin (1:5000, 66009-1-Ig; Proteintech, USA), and Lamin B (1:10,000, 12987-1-AP; Proteintech, USA) at 4°C followed by washing with Tris-buffered saline and Tween 20 (TBST). The membranes were subsequently incubated for 2 h at room temperature with horseradish peroxidase (HRP)-labeled goat anti-rabbit (1:1000, SA00001-2; Proteintech, USA) or anti-mouse (1:10,000, SA00001-1; Proteintech, USA) secondary antibodies. The protein signals were visualized using enhanced chemiluminescence (ECL) reagents. The density of the bands was quantified using the ImageJ software (version 1.52, National Institutes of Health, USA). β-actin or Lamin B was used as an endogenous control to normalize the band density of the target protein.
Statistical analysis
The data were expressed as the mean ± SD. All statistical analyses were performed using the GraphPad Prism 7.0 (GraphPad Software, USA). Data distribution was assessed using the Shapiro–Wilk tests. Data differences among multiple groups were analyzed using one-way ANOVA followed by the Newman-Keuls multiple comparison test. Differences were considered statistically significant at p < .05.
Results
Effect of Sclareol on body weight, liver index, and blood glucose
Mice with T1DM exhibited increased initial blood glucose concentrations compared to control mice. The final blood glucose levels significantly decreased after SCL treatment compared to that in the T1DM group (Figure 1(b) and (c)). Body weight in the T1DM group was significantly lower than that in control mice (14.5 ± 1.44 g vs. 23.12 ± 0.62 g, p<.001; Figure 1(d)). The liver index was higher in mice with T1DM than that in the control mice (6.09 ± 0.31% vs. 5.35 ± 0.24%, p < .001; Figure 1(e)). After SCL treatment, the liver index was significantly decreased in mice with T1DM (5.75 ± 0.19% vs. 6.09 ± 0.31%, p < .05; Figure 1(e)).
Sclareol ameliorated liver pathology and the serum biochemical index in mice with T1DM
As shown in Figure 2(a), many small lipid droplets and fibers accumulated extensively in mice with T1DM. Treatment with SCL reversed these abnormalities. In addition, hyperglycemia resulted in significantly elevated liver enzymes compared to the levels in the control group (ALT, 243.40 ± 45.12 U/L vs. 75.69 ± 13.75 U/L, p < .001; AST, 494.70 ± 66.67 U/L vs. 238.45 ± 33.88 U/L, p < .001; Figure 2(b) and (c)). Serum levels of TC, TG, and LDL-C were significantly higher in mice with TIDM compared to those in the control group (TC, 5.02 ± 0.27 mmoL/L vs. 2.42 ± 0.27 mmoL/L, p < .001; TG, 1.59 ± 0.32 mmoL/L vs. 0.45 ± 0.16 mmoL/L, p < .001; LDL-C, 1.90 ± 0.24 mmoL/L vs. 0.80 ± 0.08 mmoL/L, p < .001; Figure 2(d)-(f)), whereas HDL-C was lower compared to that in the control group (HDL-C, 0.74 ± 0.09 mmoL/L vs. 1.56 ± 0.26 mmoL/L, p < .001; Figure 2(g)). SCL treatment effectively ameliorated these changes. Taken together, SCL ameliorated liver injury in mice with T1DM. SCL ameliorated liver pathology and the serum biochemical index in mice with T1DM (a) Representative images of H&E and Masson's trichrome staining in the liver tissues. Biochemical analysis of ALT (b), AST (c), TC (d), TG (e), LDL-C (f), and HDL-C (g) in serum. Values are presented as the mean ± SD, n = 6. One-way ANOVA followed by the Newman-Keuls multiple comparison test was used for multiple groups (GraphPad Prism 7.0). **p < .01, ***p < .001 vs. control, ##p < .01, ###p < .001 vs. T1DM. Bar = 40 μm. SCL alleviated mitochondrial oxidative stress and structural damage caused by hyperglycemia in liver tissues (a) and (b) Effects of hyperglycemia and SCL on activities of GSH-PX and SOD in the liver tissues. (c) Transmission electron microscope images of mitochondria in hepatocytes of mice, Bars = 0.2 μm, 1 μm, 2 μm. (d) and (e) Intracellular ROS levels were determined using DCFH-DA staining in liver tissues. Values are presented as the mean ± SD, n = 6. One-way ANOVA followed by the Newman-Keuls multiple comparison test was used for multiple groups (GraphPad Prism 7.0). *p < .05, ***p < .001 vs. control, #p < .05, ##p < .01 vs. T1DM. Bar = 40 μm.

SCL alleviated mitochondrial oxidative stress and structural damage caused by hyperglycemia in liver tissues
GSH-PX and SOD are important enzymes involved in oxidative reactions. The results showed a significant reduction in the activities of GSH-PX and SOD in mice with T1DM compared to those in the control group (p < .05, Figure 3(a) and (b)). However, SCL significantly reversed the hyperglycemia-induced reduction in enzyme activity Figure 3(a) and (b). The mitochondria provide an essential intracellular niche for oxidative stress. Transmission electron microscopy revealed that mitochondrial swelling with cristae architecture was disrupted in the T1DM group, and SCL alleviated this structural damage (Figure 3(c)). SCL suppressed hepatocellular apoptosis in mice with T1DM (a) Representative images of TUNEL staining in the liver tissues. Bar = 20 μm. (b) The number of TUNEL-positive cells were calculated. Values are presented as the mean ± SD, n = 6. One-way ANOVA followed by the Newman-Keuls multiple comparison test was used for multiple groups (GraphPad Prism 7.0). ***p < .001 vs. control, ###p < .001 vs. T1DM.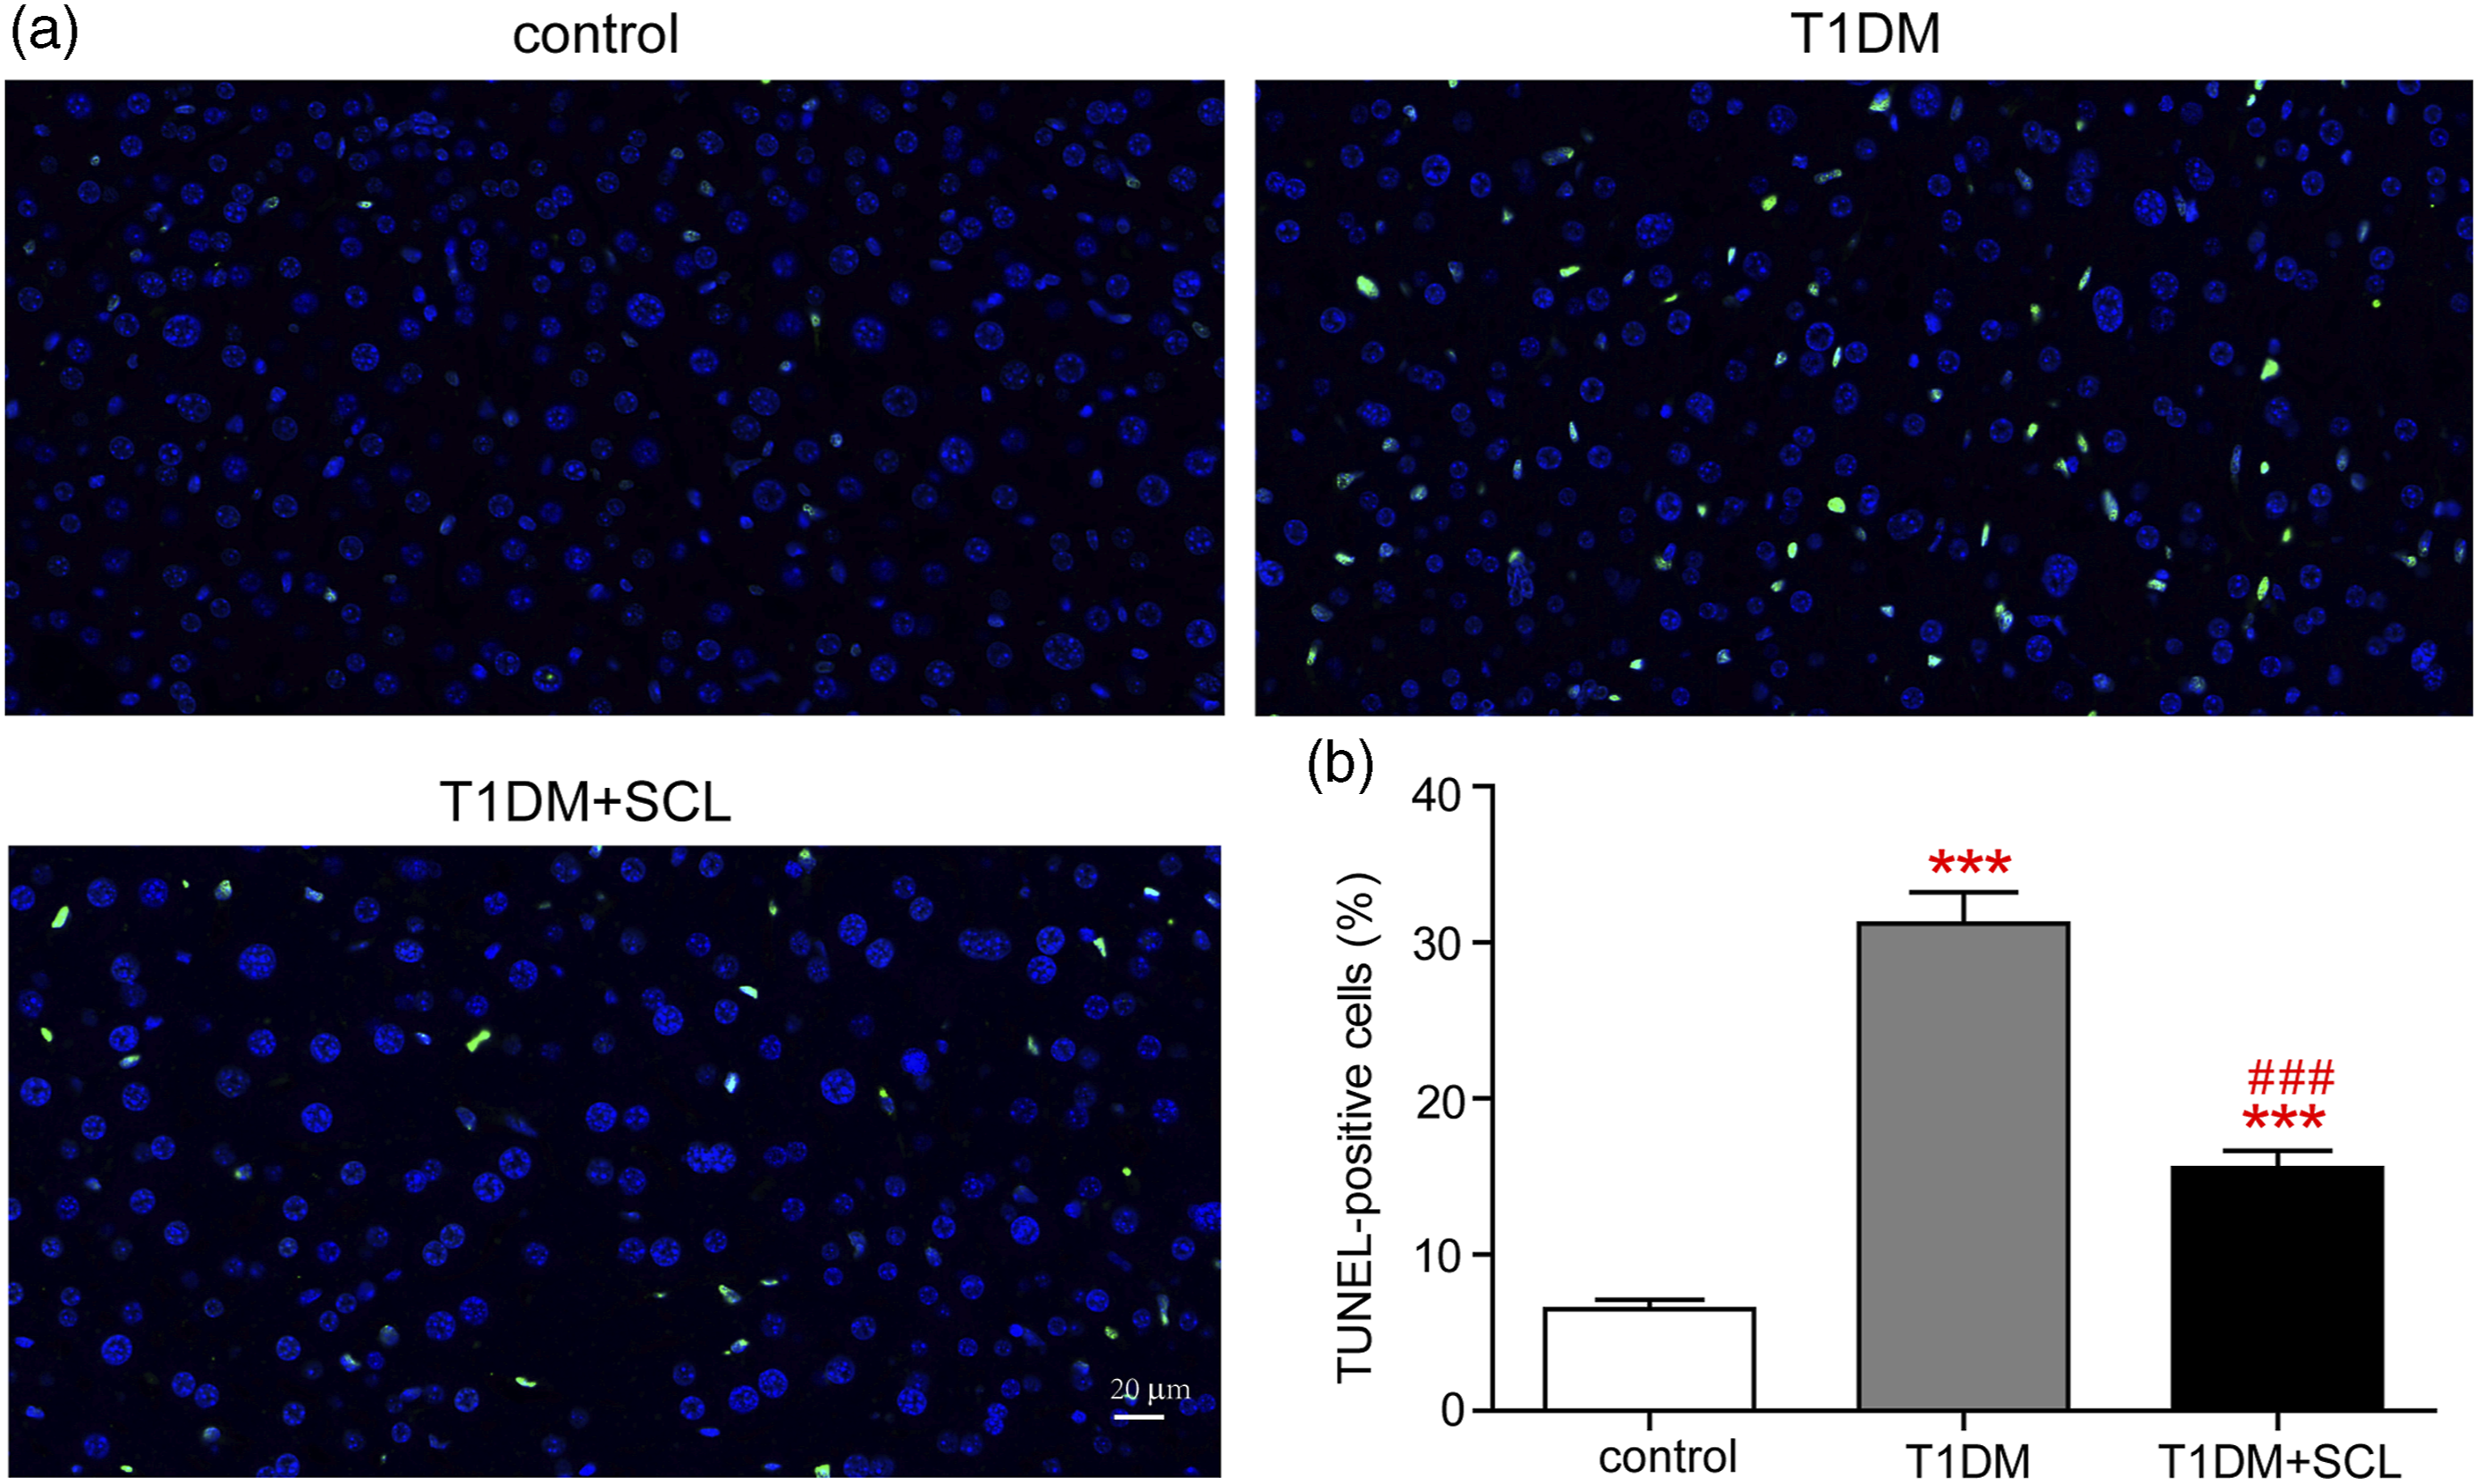
Hyperglycemic stimulation significantly increased intracellular ROS levels in the liver tissues of mice, which significantly improved after SCL treatment (Figure 3(d) and (e)). These results suggested that hyperglycemia increased oxidative stress and impaired mitochondrial structure in the liver tissues of mice, whereas SCL alleviated this damage.
Sclareol suppressed hepatocellular apoptosis in liver tissues of mice with T1DM
Excessive accumulation of ROS is an indicator of early apoptosis. We evaluated the effects of SCL on hepatocellular apoptosis. The T1DM group had more TUNEL-positive cells than the control group (p < .05, Figure 4(a) and (b)). SCL treatment significantly decreased the number of TUNEL-positive cells compared with those in the T1DM group (p < .05, Figure 4(a) and (b)).
SCL attenuated hyperglycemia-induced liver injury by inhibiting NF-κB/NLRP3-mediated inflammatory response
Infiltration of CD68, TNFα, and IL-6 positive cells was more prevalent in the liver of mice with T1DM than the control mice, whereas SCL attenuated the infiltration (Figure 5(a)). Furthermore, the serum concentrations of IL-6 and TNFα in mice with T1DM were higher than in control mice, and they were significantly inhibited by SCL treatment (Figure 5(b) and (c)). SCL attenuated hyperglycemia-induced liver injury by inhibiting NF-κB/NLRP3-mediated inflammatory response (a) Representative images of immumohistochemical staining for CD68, TNFα, and IL-6 in the liver tissues. Levels of serum IL-6 (b) and TNFα (c) were assessed using ELISA. (d) and (f) Western blotting was used to detect protein level of NF-κB p65. (e) and (g) Protein levels of NLRP3, caspase 1, and IL-1β in the liver tissues. Values are presented as the mean ± SD, n = 3 or 6. One-way ANOVA followed by the Newman-Keuls multiple comparison test was used for multiple groups (GraphPad Prism 7.0). **p < .01, ***p < .001 vs. control, ##p < .01, ###p < .001 vs. T1DM. Bar = 40 μm, 50 μm.
Western blotting was used to determine whether the hepatic inflammation in diabetic mice was induced by activation of the NF-κB signaling pathway. The NF-κB p65 expression was markedly upregulated in hyperglycemic mice compared to the normal mice (Figure 5(d)). In addition, SCL treatment effectively reversed the overexpression of NF-κB p65 induced by diabetes (Figure 5(d) and (f)). Liver NLRP3, caspase 1, and IL-1β protein expression were significantly elevated in the T1DM group compared to the control group, which was significantly attenuated after co-treatment with SCL (Figure 5(e) and (g)). To determine whether inflammatory reaction was dependent on the activation of the NF-κB/NLRP3 pathway, a NF-κB inhibitor (PDTC) was pretreated hepG2 cells for 1 h before SCL treatment. NF-κB inhibitor suppressed the transcript levels of NLRP3 and caspase 1 both in high glucose (HG) and lipopolysaccharide (LPS)-treated HepG2 cells (Supplementary Figure 1(a), (b), (d) and (e)). Furthermore, NF-κB inhibitor decreased levels of IL-6 in the supernatant in both HG and LPS-treated HepG2 cells (Supplementary Figure 1(c) and (f)). Collectively, the results suggested that SCL attenuated hyperglycemia-induced hepatic inflammatory response through inhibiting the activation of the NF-κB/NLRP3 pathway.
Sclareol improved hepatic steatosis via regulation of lipid metabolism disorder in mice with T1DM
Mice with T1DM showed elevated FFA in serum compared to the control group (724.82 ± 77.05 μmoL/L vs. 404.67 ± 37.00 μmoL/L, p < .001, Figure 6(a)), which was suppressed by SCL treatment (544.20 ± 71.16 μmoL/L vs. 724.82 ± 77.05 μmoL/L, p < .001, Figure 6(a)). In line with this result, Oil Red O staining showed an increase in the amount of lipids deposited in the livers of mice with T1DM compared to the control group, whereas SCL administration significantly attenuated hepatic steatosis (Figure 6(b)). To further understand the mechanisms underlying the alleviation of hepatic steatosis after SCL treatment, we examined the expression of several lipid metabolism-related proteins. The results showed that the expression levels of ACC and SREBP1 were significantly decreased, whereas those of CPT-1 were significantly increased by SCL treatment in mice with T1DM (Figure 6(c) and (d)). These data provide evidence that SCL attenuates hepatic steatosis in mice with T1DM by regulating lipid metabolism. SCL improved hepatic steatosis via regulation of lipid metabolism disorder in mice with T1DM (a) Serum FFA levels after stimulation of hyperglycemia and sclareol. (b) Representative images of oil red O staining in the liver tissue. (c) Western blotting for detecting expression of fatty acid metabolism-related proteins. (d) Quantification of ACC, SREBP1, and CPT-1 levels by densitometric analysis. Values are presented as the mean ± SD, n = 3 or 6. One-way ANOVA followed by the Newman-Keuls multiple comparison test was used for multiple groups (GraphPad Prism 7.0). *p < .05, **p < .01, ***p < .001 vs. control, #p < .05, ##p < .01, ###p < .001 vs. T1DM. Bar = 40 μm.
Discussion
The current study demonstrates for the first time that SCL attenuates liver injury in STZ-induced T1DM in mice by ameliorating steatosis, fibrosis, biochemical changes and apoptosis in the liver. Furthermore, diabetic mice administered SCL showed the ability to scavenge ROS, upregulate of antioxidants, and reduce the production of inflammatory cytokines. SCL improved liver inflammation and lipid accumulation by blunting the activation of NF-κB/NLRP3 inflammasome and dysregulation of ACC, SREBP1 and CPT-1. These result indicated that SCL ameliorates liver injury by inhibiting NF-κB/NLRP3-mediated inflammation and lipid metabolism disorder in type 1 diabetic mice.
ALT and AST in diabetic animals are two important indexes of liver disease associated with T1DM. 31 Our results show that SCL decreased ALT and AST levels in mice with T1DM, which is consistent with previous reports.6,32 Histological variations were observed in the liver tissues of STZ-induced mice, rats, and dogs, such as hepatic steatosis, apoptosis, hepatocytes with intracellular lipid droplets, and inflammation.6,8,32 We observed that steatohepatitis, fibrosis, and apoptosis were increased in the T1DM group, consistent with previous findings.8,32 Poor glycemic control elevated levels of serum triglycerides, VLDL, and LDL, and decreased HDL-C levels in both patients and experimental animals with diabetes.17,33-36 In our study, we found that diabetes resulted in elevated the levels of TC, TG, LDL-C, and decreased HDL-C level, which is line with previous studies.17,37 SCL normalized the levels of lipid biomarkers mentioned above. As previously shown, 27 SCL-loaded lipid nanoparticles increased serum HDL levels in obese mice but did not significantly decrease serum total cholesterol and triglycerides. Possible reasons for the different effects of SCL on the serum total cholesterol and triglycerides are the differences in animal models and administration.
It has been reported that hyperglycemia stimulates the generation of ROS and decreases antioxidant defense in the livers of diabetic rats. 38 In our study, the activities of antioxidant factors GSH-PX and SOD were decreased, whereas the level of ROS production was increased in mice with T1DM, which was consistent with previous studies showing that SOD activity was decreased in both STZ-induced diabetic mice and rats.37,38 A previous study has shown that SCL ameliorates lipopolysaccharide-induced acute lung injury by reducing ROS levels. 39 Consistent with the above report, our study found that SCL reduced ROS levels and increased the activities of antioxidant factors GSH-PX and SOD. Excess ROS damages mitochondrial membranes, triggering apoptotic pathways. 39 The present study showed that SCL alleviated mitochondrial damage and decreased apoptosis in the liver of diabetic mice.
Growing evidence shows that NAFLD is a common feature observed in T1DM, T2DM, and even cardiovascular diseases.7,40,41 These diseases are all associated with an increased burden of inflammation.16,41-43 Inflammation is a crucial contributor to the development of liver injury in diabetes by promoting the secretion of pro-inflammatory cytokines, such as TNFα and IL-6.21,44,45 The increased inflammation, also observed in our study, is caused by the effect of T1DM on increased serum concentrations of IL-6 and TNFα. The beneficial effect of SCL on inflammation is consistent with previous finding, which showed that it effectively downregulated mRNA levels of TNF-α, IL-1β, and IL-6 in a hyperglycemia-induced mouse model of renal injury. 29 Hyperglycemia-induced NF-κB activation in hepatocytes, which is stimulated by IL-6 and TNF α, leads to an increased infiltration of inflammatory cells at the site of hepatic injury.46,47 Increasing nuclear activation of NF-κB p65 activated inflammation in the livers of STZ-induced diabetic rats. 37 The activation of NF-κB initiates NLRP3 priming. 48 The combined NLRP3 inflammasome can stimulate the caspase 1 and promote the maturation of IL-1β or IL-18, and ultimately promoted the development of inflammation. 49 Inflammatory regulators such as NLRP3 and NF-κB are involved in the progression of NAFLD. 48 Studied have reported that the NLRP3/NF-κB signaling pathway is involved in STZ-induced liver injury.32,50 In our study, we observed that diabetes increased inflammation by upregulating the activation of NF-κB p65 and NLRP3 inflammasome, which is line with previous study. 32 Consistent with previous reports, our data indicated that SCL inhibits the activation of NF-κB.29,36
It has been reported that NAFLD in T1DM can develop into steatohepatitis.51-53 The NF-κB/NLRP3 inflammasome and inflammatory cytokines regulate lipid metabolism disorder, thereby drive the progression of NAFLD.21,22 Recent research has demonstrated that activated IL-1β participates in the activation of SREBP1, which is responsible for modulating lipid homeostasis in mammals. 21 Moreover, The NLRP3 inhibitor MCC950 suppressed the expression of SREBP1, and thus inhibited lipogenesis in the liver. 54 Hyperglycemia stimulated lipogenesis mediated by overexpressing SREBP1 and ACC and reducing CPT-1 activity in diabetic animals. 17 Similarly, a recent study reported that T1DM is associated with abnormally upregulated transcription factors, such as SREBP 1c, which stimulate hepatic lipid synthesis and steatosis. 37 In line with these studies, we found that administration of SCL improved lipid metabolic balance in the liver tissues of mice with T1DM by reducing expressions of SREBP1 and ACC and enhancing CPT-1 activity.
However, our study has a few limitations. First, we investigated hepatoprotective effects of SCL only in mice with T1DM. Further studies are required to determine the hepatoprotective effects of SCL in mice with T2DM. Second, SCL-loaded lipid nanocarriers, which increase the bioavailability of lipophilic substances, should be investigated further studies.
Conclusion
This study investigated the hepatoprotective effects of SCL in mice with T1DM. SCL suppressed the NF-κB/NLRP3 signaling pathway, thereby reducing inflammatory cytokines, and further regulated lipid metabolism, resulting in the attenuation of hepatic lipid accumulation. Therefore, SCL is a potential therapeutic agent for the protection against diabetic liver injury.
Supplemental Material
Supplemental Material - Sclareol ameliorates liver injury by inhibiting nuclear factor-kappa B/NOD-like receptor protein 3-mediated inflammation and lipid metabolism disorder in diabetic mice
Supplemental Material for Sclareol ameliorates liver injury by inhibiting nuclear factor-kappa B/NOD-like receptor protein 3-mediated inflammation and lipid metabolism disorder in diabetic mice by Leilei Tang, Xuan Mei, Mengling Ye, Yang Liu, Yujie Huang, Jiawen Yu, Lingdi Zhang, Sheng Zhuge Guojun Jiang and Jianjun Zhu in International Journal of Immunopathology and Pharmacology
Footnotes
Author contributions
LT and XM contributed equally to performing the experiment and writing the manuscript. JZ, GJ and SZ: designed this research. LT, XM, YL, MY, YH, JY and LZ: performed the experiment and contributed to the analysis. LT, XM and MY: wrote the main manuscript. LT: revised the article for important intellectual content. All the authors read and finalized the manuscript.
Declaration of conflicting interests
The author(s) declared no potential conflicts of interest with respect to the research, authorship, and/or publication of this article.
Funding
The author(s) disclosed receipt of the following financial support for the research, authorship, and/or publication of this article: This work was supported by the Science and Technology Plan Project of Hangzhou [Grant Number 20201231Y118], Major Science and Technology Plan Project of Xiaoshan [Grant Number 2020310], Development Support Science and Technology Special Project of Hangzhou Biomedical and Health Industry [Grant Number 2022WJC139, 2022WJC234], Natural Science Foundation of Zhejiang [LQ20H090006].
Ethical statement
Supplemental Material
Supplemental material for this article is available online.
References
Supplementary Material
Please find the following supplemental material available below.
For Open Access articles published under a Creative Commons License, all supplemental material carries the same license as the article it is associated with.
For non-Open Access articles published, all supplemental material carries a non-exclusive license, and permission requests for re-use of supplemental material or any part of supplemental material shall be sent directly to the copyright owner as specified in the copyright notice associated with the article.