
Abstract
Introduction
Gliomas are neuroepithelial neoplasms that occur from the central nervous system’s supporting glial cells, which are the most common brain cancer in the central nervous system and can be divided into four grades based on pathological phenotypes.1,2 In general, the World Health Organization classification system categorizes gliomas from grade 1 (lowest grade) through grade 4 (highest grade).1,2 The grade I gliomas are commonly biologically benign and could be removed surgically. Low-grade gliomas (LGG) are grade I gliomas and grade II gliomas.1; 2 Grade II gliomas are usually considered tumors, and they may not be completely resectable, whereas grade III gliomas are invasive and aggressive, with rapid progression and poor outcomes. Grade IV gliomas, also known as glioblastoma multiforme (GBM), are the most aggressive and have a poor prognosis.1,2
The metabolic enzyme isocitrate dehydrogenase-1 (IDH1) gene mutations have been discovered in the majority of LGG (70–80%) and some GBM (12%) patients.2,3 Besides, approximately 64% of IDH1 mutated tumors also carry tumor protein 53 (TP53) mutations. 4 Thus, there is a high correlation between IDH1 and TP53 mutations in gliomas. 4 IDH1 mutations are usually changed to histidine and inhibit its ability to convert isocitrate to α-ketoglutarate.5,6 Moreover, the R132H mutation confers a novel gain of function, allowing the mutant enzyme to result in patients with a high level of 2-hydroxyglutarate (2-HG; is converted from α-ketoglutarate), epigenetic modifications, and extracellular matrix (ECM) remodeling, which may promote glioma growth and inhibit glioma cell differentiation.5,6 The TP53 gene was detected on chromosome 17p13.1 in humans and encodes the 393-amino-acid p53 protein. 7 P53 activity is low under normal conditions, and MDM2 and MDM4 (MDMX) regulate it through ubiquitination and degradation. TP53 mutations are associated with the progression of gliomas, and p53 inactivation is coupled to a more invasive, less apoptotic, more proliferative, and stem-like phenotype and causes malignancy and tumorigenicity, which may increase cell survival and growth in several cancers, thereby increasing their chemotherapy resistance. 7 However, the underlying mechanisms of IDH1 and TP53 mutations in glioma patients remain unclear. In addition, few studies have been designed to look at the differences between wild-type patients’ wild-type and those with IDH1 and TP53 mutations.
In the present study, the TCGA database was used to compare the differences between wild-type patients’ wild-type and the patients with IDH1 and TP53 mutations to select the characteristic differentially expressed genes with IDH1 and TP53 mutations. So, we aim to obtain the potential target genes for future IDH1 and TP53 mutations.
Materials and methods
Samples and data preparation
This study was obtained from the TCGA database. The data were downloaded from the official websites of TCGA (https://portal.gdc.cancer.gov) cohorts. All data were collected with the approval of the Review Shenzhen Samii Medical Center Board (No. F-YXLL-01-CZGC-23-0), which included 1122 patients with LGG and GBM. Details of data generation (including the inclusion and exclusion criteria) have been previously reported.
8
The TCGAbiolinks package is 2.24.0.9,10 The clinicopathological characteristics, mRNA expressions, somatic mutations, and copy number variations were analyzed. By differentially expressed gene (DEG) analysis, the gene expression data were only from IlluminaHiseq RNASeq version 2, and patients were divided into wild-type (without IDH1 and TP53 mutations) group and mutant group (both IDH1 and TP53 mutations) by selecting from the mutation results. The workflow is shown in Figure 1. Overview of the workflow to summarize the specific gene selection. The raw data were collected from the TCGA database, which was generated in 2016 by Michele et al. The patients were then divided into two groups: those who did not have IDH1 and TP53 mutations and those who did. The expression and mutation of IDH1 or TP53 were used in the overall survival analysis. Using DEG analysis, select the specific marker between the wild-type and co-mutant groups and then compare the selected marker to the general cancer database to filter the glioma-specific markers and generate overall survival results of the glioma-specific markers. Abbreviation: IDH1: isocitrate dehydrogenase-1; TP53: tumor protein 53; DEGs: differentially expressed genes.
Statistical analysis
Clinicopathological characteristics of samples in TCGA cohorts.
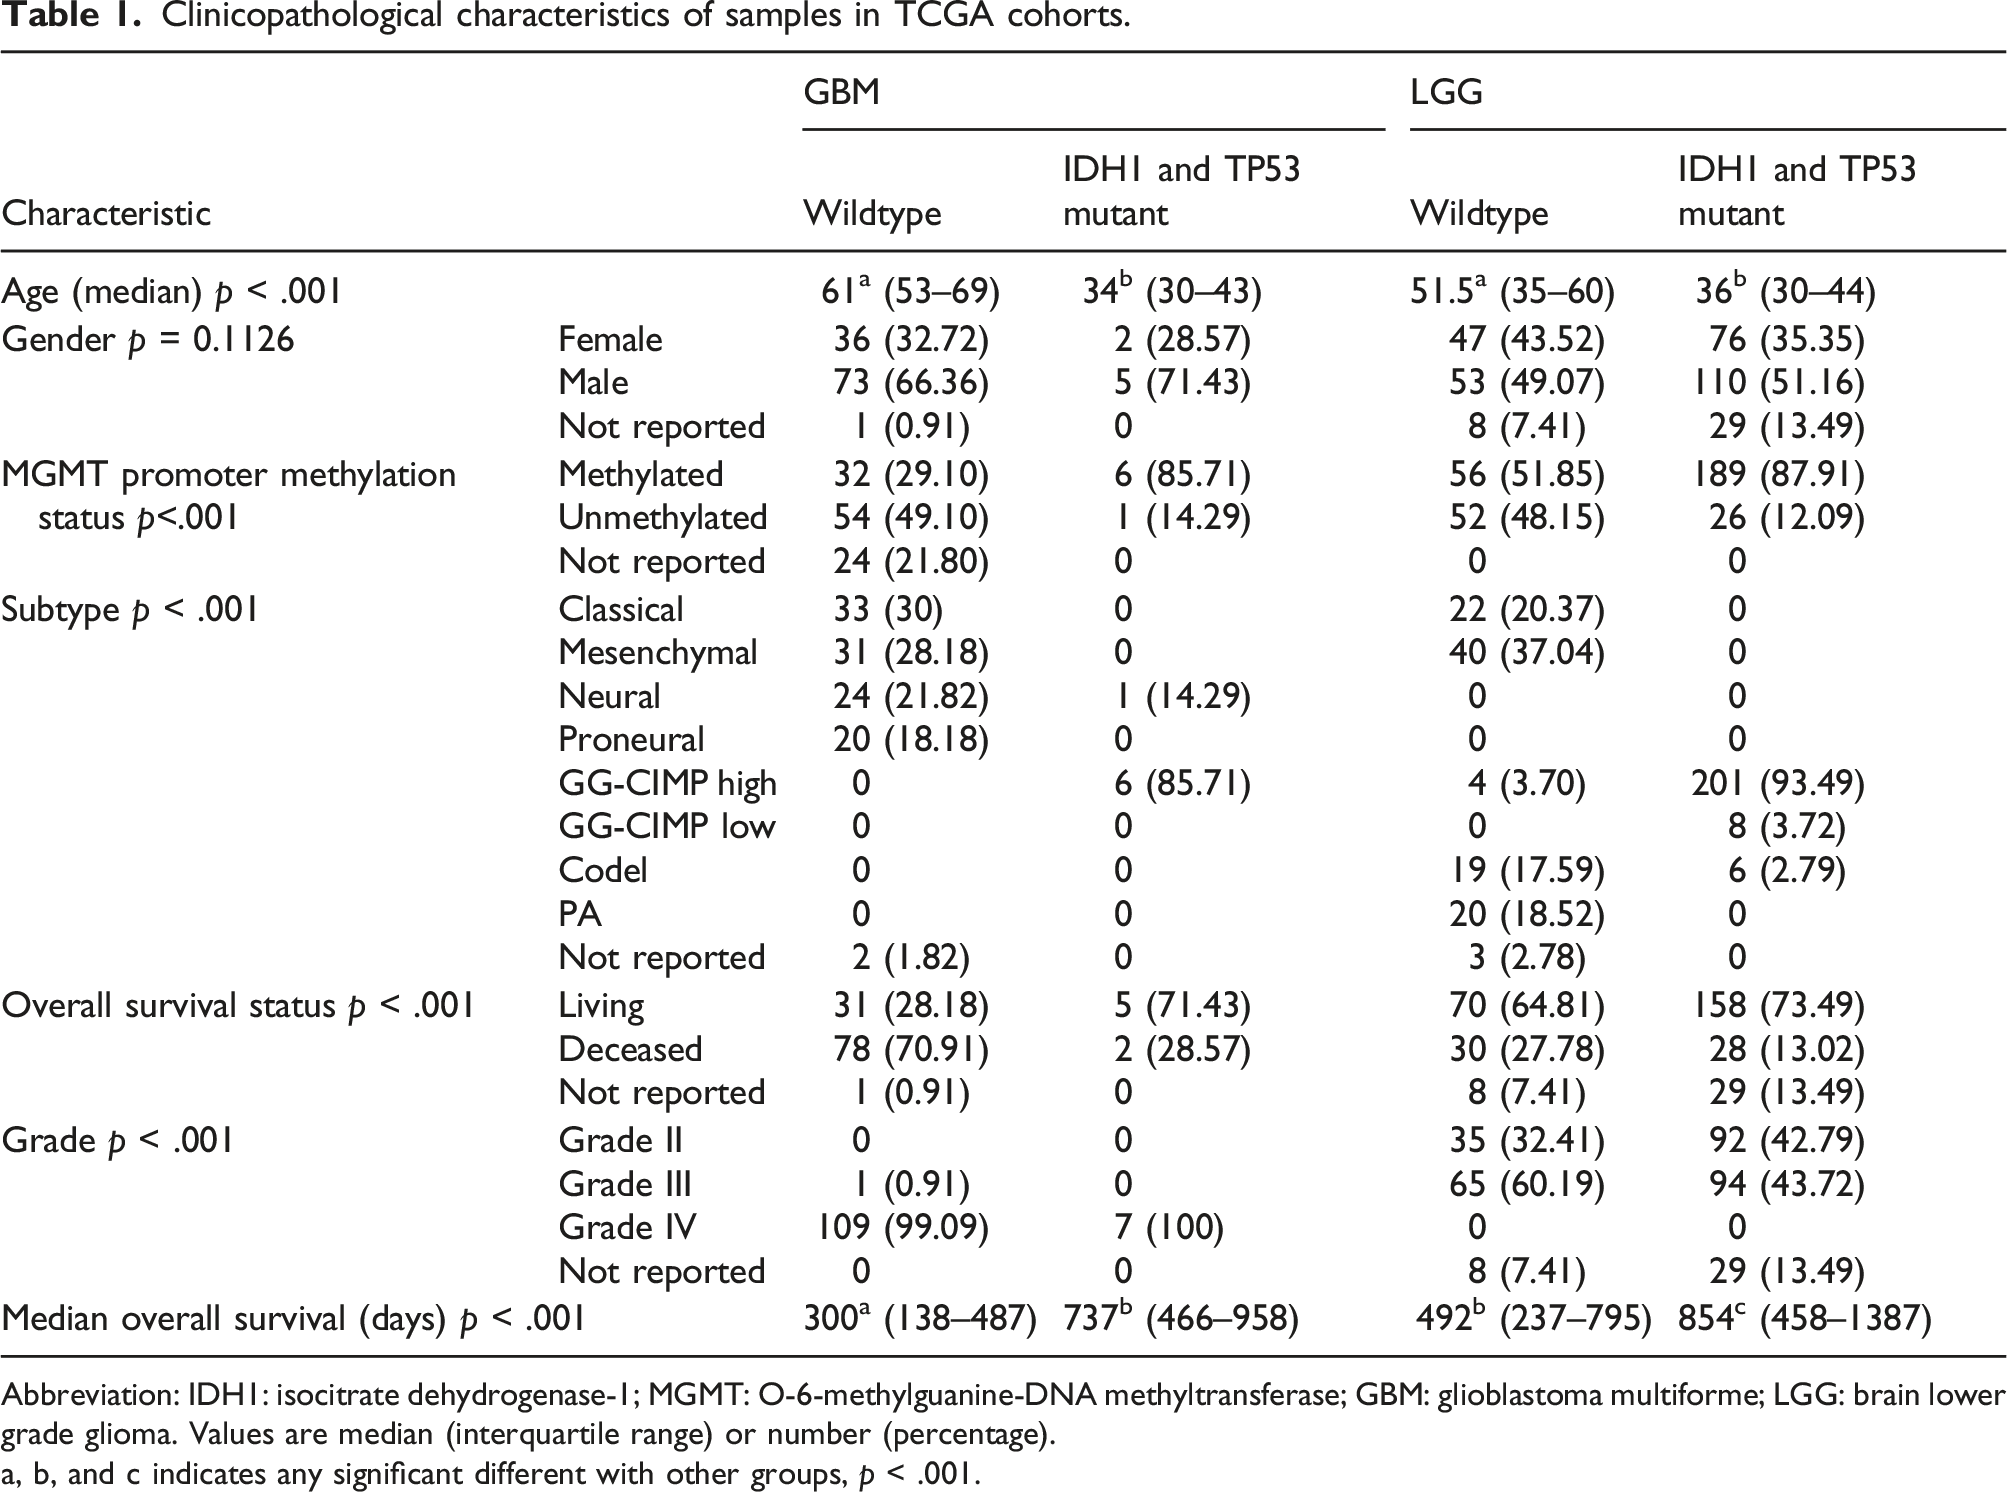
Abbreviation: IDH1: isocitrate dehydrogenase-1; MGMT: O-6-methylguanine-DNA methyltransferase; GBM: glioblastoma multiforme; LGG: brain lower grade glioma. Values are median (interquartile range) or number (percentage).
a, b, and c indicates any significant different with other groups, p < .001.
Gene Ontology 14 and the Kyoto Encyclopedia of Genes and Genomes (KEGG) pathway enrichment analyses were used for DEGs using the Database for Annotation, Visualization, and Integrated Discovery.15-17 FDR < 0.05 was set as the cutoff criterion for the analyses. Gene Set Enrichment Analysis (GSEA) program 14 was used to adjust the false-positive rate from multiple testing. The survival heat map analysis and principal component analysis were performed in the GEPIA2 database. All statistical analyses were performed using R version 4.0.5.
Results
IDH1 and TP53 mutations are the most influencing genes in GBM and LGG cohorts
A total of 1122 GBM together with LGG cohort in Figure 2 have shown that IDH1 mutation was more than 50% in the cohort, meanwhile, TP53 mutation occurred at more than 50% and together with ATRX mutation occurred at more than 30% when IDH1 mutant was present, which is also found in the previous studies.
18
Surprisingly, a large portion of copy number gain (amplification and gain) was detected in patients who did not have the IDH1 mutation, while a large portion of copy number loss was detected in patients who did have the IDH1 mutation but did not have the TP53 mutation. Furthermore, patients with both IDH1 and TP53 mutations were younger than others, and their vital status was also better than others. Overview of glioma cohort with GBM and LGG. There are 6 main contents in this map, which are grouped by IDH1 mutation and without IDH1 mutation. The mutation rate result shows the mutations per megabase (Mb) in each patient. The red triangular symbol is the most mutation count in the cohort. The situation of age, vital status, and gender are shown below the mutation rate, respectively. The top 25 mutated genes are listed with count and mutation types. The copy number gain and loss are shown with count and types. It also included the information about mRNAseq consensus non-negative matrix factorization (cNMF); mRNAseq cHierarchical; miRseq cNMF; miRseq cHierarchical; miRseq Mature cNMF; miRseq Mature cHierarchical; CN cNMF; methylation cNMF; reverse phase protein arrays (RPPA) cNMF; and RPPA cHierarchical.
Wild-type and IDH1 and TP53 mutation groups have different clinicopathological characteristics and differentially expressed genes between GBM and LGG cohorts
To analyze the mutation effect of IDH1 and TP53, we divided wild-type and both IDH1 and TP53 mutation groups. The clinicopathological characteristics of the patients in GBM and LGG cohorts are shown in Table 1. Only 402 patients have both the mutation data of IDH1 and TP53 and the RNAseq count data. There was no difference in sex distribution between wild-type and both mutation group in GBM and LGG cohorts. The age of wild-type patients was both older than the age of IDH1 and TP53 mutation patients in GBM and LGG. The MGMT promoter methylation status was almost half and half in wild-type patients, while most of both mutation patients were methylated in GBM and LGG cohorts. The median overall survival days in the patients with IDH1 and TP53 mutations were both longer than wild-type in GBM and LGG. However, the heat map of DEGs in TCGA GBM and LGG has not shown a uniform gene expression zone in both IDH1 and TP53 mutation groups (Figure S1).
IDH1 and TP53 mutations, not gene expression, affect the survival probability in the GBM and LGG patients
The patients with IDH1 mutation had a higher survival probability than the patients without IDH1 mutation both in the total GBMLGG cohort or separated GBM and LGG cohort (Figures 3(a)–(c)). Though the patients with low IDH1 expression had a higher survival probability than the patients with high IDH1 in the total GBMLGG cohort, the effect was relatively weaker in the separated GBM and LGG cohort (Figures 3(d) and (e)). The mutation and expression results of TP53 were similar to the IDH1 (Figure 3(g)–3(l)). Interestingly, the patients with ATRX mutation also showed a higher survival probability than the patients without ATRX mutation, but only in the total GBMLGG cohort and separated GBM cohort, not in the LGG cohort (Figure S2(a)–S2(c)). Moreover, the expression of ATRX did not affect the survival probability. Yet, we found that the TP53 R273C mutant has a high accumulation with the IDH1 R132H mutant (Figure S2(g)), but not in one ATRX mutant (Figure S2(h)). IDH1 mutation and TP53 mutation are associated with improved overall survival in patients with glioma. a. Kaplan–Meier plot for the overall survival of IDH1 wildtype and IDH1 mutant patients in the TCGA GBMLGG cohort; b. Kaplan–Meier plot for the overall survival of IDH1 wildtype and IDH1 mutant patients in the TCGA GBM cohort; c. Kaplan–Meier plot for the overall survival of IDH1 wildtype and IDH1 mutant patients in the TCGA LGG cohort; d. Kaplan–Meier plot for the overall survival of low- and high IDH1 expression patients in the TCGA GBMLGG cohort; e. Kaplan–Meier plot for the overall survival of low- and high IDH1 expression patients in the TCGA GBM cohort; f. Kaplan–Meier plot for the overall survival of low- and high IDH1 expression patients in the TCGA LGG cohort; g. Kaplan–Meier plot for the overall survival of IDH1 wildtype and TP53 mutant patients in the TCGA GBMLGG cohort; h. Kaplan–Meier plot for the overall survival of IDH1 wildtype and TP53 mutant patients in the TCGA GBM cohort; i. Kaplan–Meier plot for the overall survival of IDH1 wildtype and TP53 mutant patients in the TCGA LGG cohort; j. Kaplan–Meier plot for the overall survival of low- and high-TP53 expression patients in the TCGA GBMLGG cohort; k. Kaplan–Meier plot for the overall survival of low- and high-TP53 expression patients in the TCGA GBM cohort; and l. Kaplan–Meier plot for the overall survival of low- and high-TP53 expression patients in the TCGA LGG cohort. Abbreviation: IDH1: isocitrate dehydrogenase-1; MGMT: O-6-methylguanine-DNA methyltransferase; GBM: glioblastoma multiforme; LGG: brain lower grade glioma; TP53: tumor protein 53; DEGs: differentially expressed genes.
Gene Ontology analysis and KEGG pathway analysis in GBM and LGG cohorts
From the GBM cohort, the GO analysis results (Figure 4(a)) found that the IDH1–TP53 co-mutations group was different from the wild-type group in the modulation of chemical synaptic transmission, regulation of trans-synaptic signaling, and regulation of membrane potential of BP part, in the glutamatergic synapse, synaptic membrane, and transporter complex of CC part and in metal ion transmembrane transporter activity, gated channel activity, and calmodulin-binding of MF part. In the KEGG pathway (Figure 4(b)), neuroactive ligand–receptor interaction, calcium signaling pathway, and cAMP signaling pathway were the top 3 different pathways between the IDH1–TP53 co-mutations group and the wild-type group. Gene Ontology and KEGG pathway analyses of DEGs by analyzing the TP53 together with IDH1 mutation status in the TCGA glioma cohort. a. Gene Ontology analysis of DEGs among the TP53 and IDH1 mutation groups in the TCGA GBM cohort; b. KEGG pathway analysis of DEGs among the TP53 and IDH1 mutation groups in the TCGA GBM cohort; b. Gene Ontology analysis of DEGs among the TP53 and IDH1 mutation groups in the TCGA LGG cohort; and d. KEGG pathway analysis of DEGs among the TP53 and IDH1 mutation groups in the TCGA LGG cohort. Abbreviation: IDH1: isocitrate dehydrogenase-1; MGMT: O-6-methylguanine-DNA methyltransferase; GBM: glioblastoma multiforme; LGG: brain lower grade glioma; TP53: tumor protein 53; DEGs: differentially expressed genes.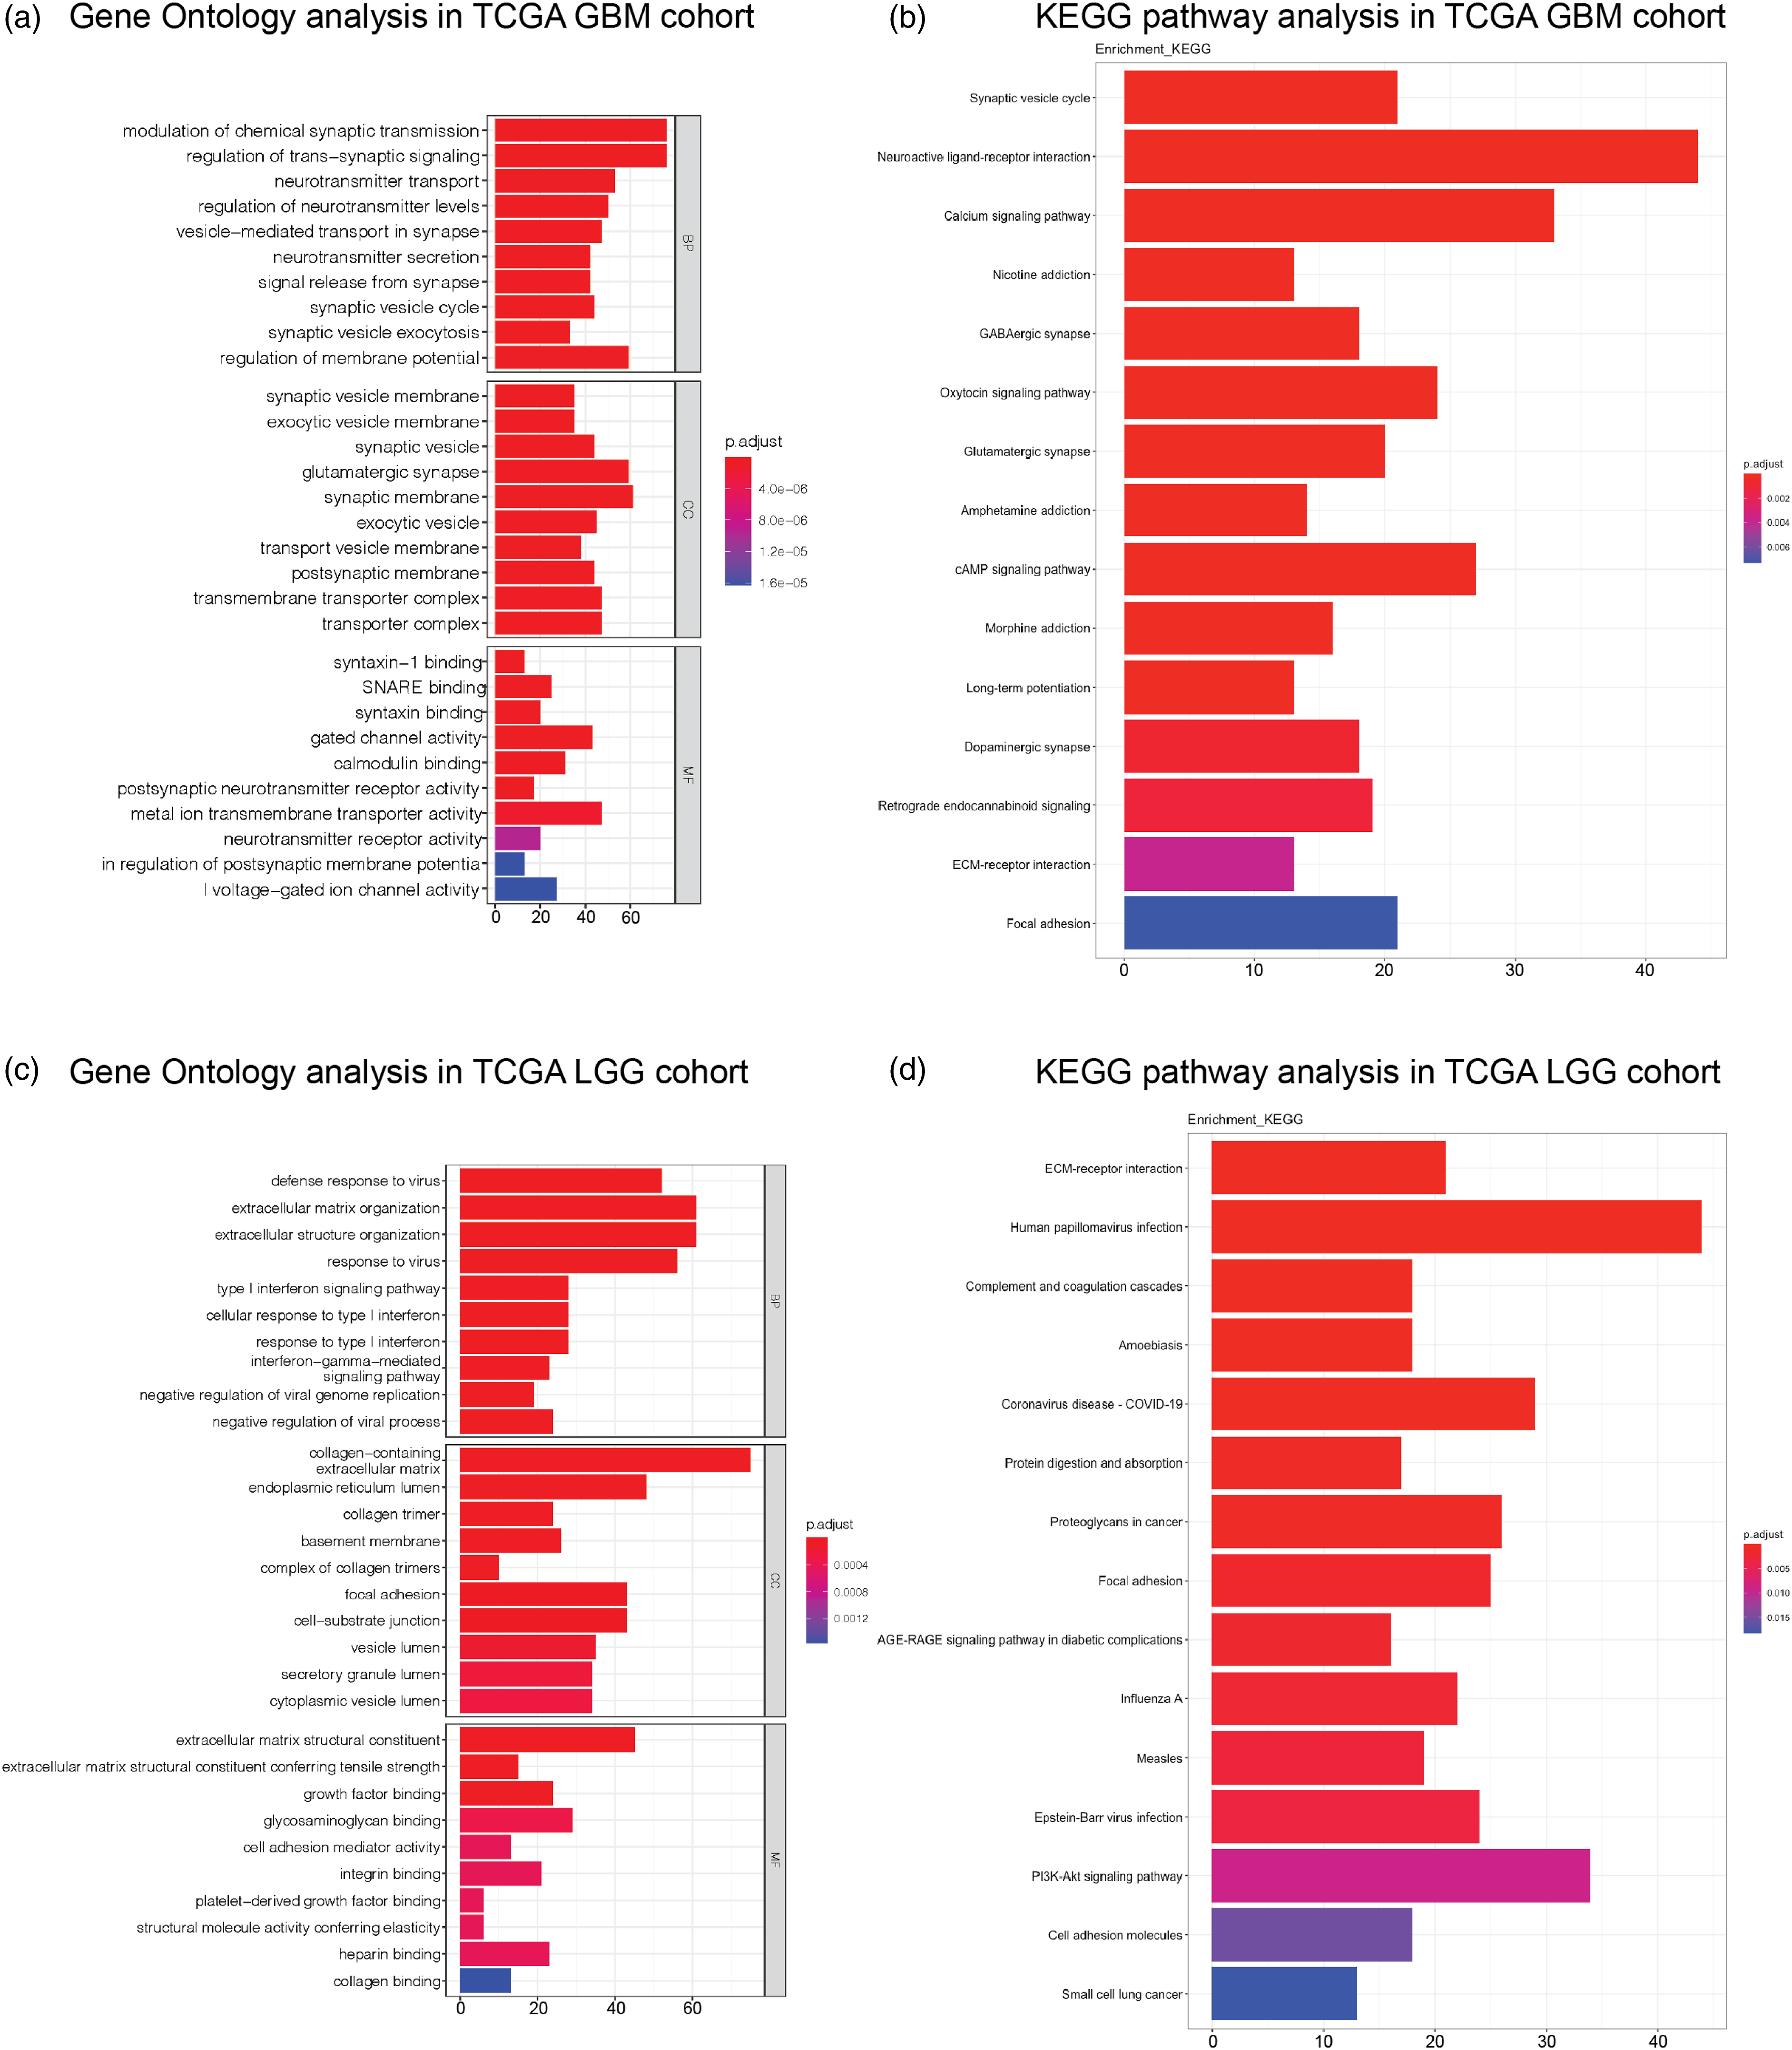
However, in the LGG cohort, the GO analysis results (Figure 4(c)) found that the IDH1–TP53 co-mutations group was different from the wild-type group in extracellular structure and matrix organization, and response to the virus in BP part, in collagen-containing, endoplasmic reticulum lumen, and focal adhesion of CC part, in extracellular matrix structural constituent, glycosaminoglycan binding, and growth factor binding of MF part. Interestingly, in the KEGG pathway (Figure 4(d)), human papillomavirus infection, COVID-19, and PI3K-Akt signaling pathway were the top 3 different pathways between the IDH1–TP53 co-mutations group and the wild-type group.
Top selected DEGs could be markers of the LGG cohort and have fine distinctions between LGG, GBM, and normal brain tissues
To find the key factor co-mutated IDH1 and TP53 in the patients, we then selected the DEGs on the top rank of GBM and LGG for checking the specificity among the TCGA cancer database. In the survival heat map of the TCGA cancer database (Figure S3), we found that most of the top DEGs were only correlated with the LGG cohort (red square frame is the significant correlation), except for SAA1 and SSTR1 which were also correlated with the COAD cohort.
The top rank of DEGs is also the selected gene group to perform principal component 3D analysis (Figure 5). The results indicate that the selected gene group has a high feature of the cohort populations between LGG, GBM, and normal brain tissues. Notably, the selected gene group of the GBM cohort was better to separate from the normal brain tissue than the LGG cohort. Principal component 3D analysis of top rank of differentially expressed genes in TCGA glioblastoma multiforme brain lower grade glioma and GTEx brain tissue cohort.
GSEA analysis of top rank of DEGs in the TCGA GBMLGG tissue cohort
To specify the pathway that the top rank of DEGs may be affected, we performed the GSEA analysis. The GSEA analysis of CFH result shows that autoimmune thyroid disease was the highest score pathway (Figure 6(a)). HMGA2 result shows that ECM–receptor interaction was the highest score pathway (Figure 6(b)). EMILIN3 result shows that glutathione metabolism was the highest score pathway (Figure 6(c)). PCDH15 result shows that ribosome was the highest score pathway (Figure 6(d)). Moreover, those high score pathways were also found in the GSEA results of other top ranks of DEGs. GSEA analysis of top rank of DEGs in the TCGA GBM LGG tissue cohort. A. GSEA analysis of CFH in the TCGA GBM LGG tissue cohort; B. GSEA analysis of HMGA2 in the TCGA GBM LGG tissue cohort; C. GSEA analysis of EMILIN3 in the TCGA GBM LGG tissue cohort; and D. GSEA analysis of PCDH15 in the TCGA GBM LGG tissue cohort. Abbreviation: IDH1: isocitrate dehydrogenase-1; MGMT: O-6-methylguanine-DNA methyltransferase; GBM: glioblastoma multiforme; LGG: brain lower grade glioma; TP53: tumor protein 53; DEGs: differentially expressed genes.
The expression of top selected DEGs may involve in the survival possibility of the patients with wild-type and the patients with both IDH1 and TP53 mutations
To investigate the effect of DEG expression on the GBM and LGG patients with wild-type and the patients with both IDH1 and TP53 mutations, the survival analysis was performed with different cohorts and different mutations. In total, the patients of the LGG cohort have a higher survival possibility than the patients of the GBM cohort. In EMILIN3 and HAMP expression results (Figures 7(a) and (b)), the survival possibility of the patients with both mutations was higher than the LGG patients with wild-type. High EMILIN3 or HAMP expression was not different from low EMILIN3 or HAMP expression in the patients with both mutations but was significantly lower than the low EMILIN3 or HAMP expression in the LGG patients with wild-type. The EMILIN3 and HAMP expression was not found in the different survival possibilities between the GBM patients with both mutations and wild-type. In IFT80 expression results (Figure 7(c)), the survival possibility of the patients with both mutations was higher than the patients with wild-type. High IFT80 expression was significantly lower than the low IFT80 expression in the patients with both mutations and also in the patients with wild-type. The IFT80 expression was not found in the different survival possibilities between the GBM patients with both mutations and wild-type. In SAA1 expression results (Figure 7(d)), the survival possibility of the patients with both mutations was higher than the patients with wild-type, but only in the LGG patients with high SAA1 expression. Low SAA1 expression reached a higher survival possibility in the GBM patients with both mutation and the LGG patients with wild-type. In CHIC2 expression results (Figure 7(e)), the survival possibility of the patients with both mutations was higher than the LGG patients with wild-type. Low CHIC2 expression reached a higher survival possibility in the LGG patients with both mutation and the LGG patients with wild-type. The CHIC2 expression was not found in the different survival possibilities between the GBM patients with both mutations and wild-type. In VSTM2A expression results (Figure 7(f)), the survival possibility of the patients with both mutations was higher than the LGG patients with wild-type. High VSTM2A expression reached a higher survival possibility in the LGG patients with both mutation and the LGG patients with wild-type. The CHIC2 expression was also found to have a higher survival possibility in the GBM patients with both mutations. Selected DEG expression is associated with improved overall survival in IDH1 and TP53 mutation patients with glioma. a. Kaplan–Meier plot for the overall survival of low- and high-EMILIN3 expression patients in the TCGA GBMLGG cohort; b. Kaplan–Meier plot for the overall survival of low- and high-HAMP expression patients in the TCGA GBMLGG cohort; c. Kaplan–Meier plot for the overall survival of low- and high-IFT80 expression patients in the TCGA GBMLGG cohort; d. Kaplan–Meier plot for the overall survival of low- and high-SAA1 expression patients in the TCGA GBMLGG cohort; e. Kaplan–Meier plot for the overall survival of low- and high-CHIC2 expression patients in the TCGA GBMLGG cohort; and f. Kaplan–Meier plot for the overall survival of low- and high-VSTM2A expression patients in the TCGA GBMLGG cohort. Abbreviation: IDH1: isocitrate dehydrogenase-1; MGMT: O-6-methylguanine-DNA methyltransferase; GBM: glioblastoma multiforme; LGG: brain lower grade glioma; TP53: tumor protein 53; DEGs: differentially expressed genes.
Discussion
IDH1 mutation and TP53 mutation are widely found in glioma patients. Previous studies had shown that IDH1 mutations occurred in about 40% of gliomas. 19 TP53 was a tumor suppressor, and its mutation preferentially happened in younger patients and co-occurring mutations in IDH1/2. 11 It seems TP53 mutation could usually occur with IDH1 in patients. Though some papers had shown that IDH1 mutation has a good improvement for the better prognosis in glioma patients,18,20 still it as a cancer feature is now more believed to be a genetic factor to promote the growth advantage for glioma initiation.15,21 The better overall survival of glioma patients with IDH1 mutation had to be considered as better for surgical resection than wild-type. 22 The mutation of TP53, was a bad clinical outcome in many cancers, which usually lost the tumor suppression and promote the tumor ability of invasion, metastasis, proliferation, and cell survival.23,24 In GBM patients, TP53 GOF mutation promotes inflammatory responses and facilitates chemotaxis. 25 Moreover, TP53 mutation in non–small cell lung cancer (NSCLC) is associated with poor targeted therapy response and showed a poor prognosis and poorer overall survival in breast cancer patients.26,27 In this study, we focus more on glioma patients with both mutations of IDH1 and TP53, to investigate the mutation effect in the pathway and different genes with wild-type and IDH1–TP53 mutation.
In total, the effect of the mutation in glioma patients was higher than the effect of gene expression on overall survival. In GO analysis, GBM cohort patients were different from LGG cohort patients, especially the GBM patients not LGG patients with IDH1 and TP53 mutations were different from wild-type in neuro functions, such as chemical synaptic transmission, neurotransmitter transport and secretion, membrane potential, and glutamatergic synapse and also some parts were related neurotransmitter release (SNARE pathway, neurotransmitter receptor, and transporter) and ion gated channel activity. What’s more, the results of the KEGG pathway also confirmed that synaptic and neuroactive receptor-related pathways had a difference between the GBM patients with IDH1 and TP53 mutations and the GBM patients with wild-type. In GBM cells, blockade of SNARE protein syntaxin-1 reduced both the growth and invasion ability. 28 While IDH1 mutation was found to be an impairment in the IDH1 enzyme and contributed to tumorigenesis by increasing the levels of HIF-1α, 29 also the mutant IDH1 could produce more R-2-hydroxyglutarate (R-2HG) and promote glioma growth. 5 Calcium signaling pathway, ECM–receptor interaction, and c-AMP signaling pathway were found to be the significant differences between the patients with IDH1 and TP53 mutations and the patients with wild-type, which played important cooperating roles in the glioma tumorigenesis.30,31 Interestingly, nicotine addiction and morphine addiction were also found to be a significant difference between the patients with IDH1 and TP53 mutations and the patients with wild-type, which was also reported in the previous GBM studies,32-34 but here suggested could be closely related to the IDH1 and TP53 mutations. In the LGG cohort, the patients with IDH1 and TP53 mutations seem to have many immunological changes than the patients with wild-type, for example, the anti-viral function (defense response to virus, negative regulation of viral process, and type I interferon signaling pathway), which might indicate that the immune status in the patients with IDH1 and TP53 mutations is different from the patients with wild-type. Previous studies have shown reduced infiltration of immune cells in IDH1 mutant gliomas and suppressed PD-L1 expression,35,36 while TP53 GOF mutation had shown it promotes inflammation and has a profound effect on patient prognosis. 25 In KEGG pathway results, the patients with IDH1 and TP53 mutations suggest more correlation with the other viral infection, such as COVID-19, influenza A, measles, and Epstein-Barr virus, that might be the consequences of the suppression of immune function in these patients.
In this study, we selected a group of differentially expressed genes between the patients with IDH1 and TP53 mutations and the patients with wild type. The survival map of the selected group of differentially expressed genes only showed a significant difference in the LGG cohort compared with other cancer, and the PCA analysis results also showed this group of genes was differently expressed among the GBM cohort, LGG cohort, and normal brain tissue. Thus, the selected group of differentially expressed genes could represent the marker of the patients with IDH1 and TP53 mutations, which were found to have important roles in thyroid function, ECM–receptor interaction, glutathione metabolism, and ribosome function. The abnormal thyroid function, hypothyroidism, was found in previous studies,37,38 but did not study the correlations with IDH1 and TP53 mutations, which could be a potential effect of validating. The ECM–receptor interaction, glutathione metabolism, and ribosome biogenesis indicated that IDH1 and TP53 mutations affect tumor invasion and metastasis via ECM–receptor interaction and39,40 metabolic dysfunction via glutathione metabolism. 41
The interesting question is who is the governor (IDH1 or TP53)? The TP53 R273C mutant shows a high accumulation with the IDH1 R132H mutant, which indicates the mutant co-effect between TP53 R273C and IDH1 R132H. Indeed, some publications had also shown that most IDH1 R132 mutants harbor mutation of TP53 R273 and suggest that these two hotspots of mutant co-occurrence might play critical roles in the IDH1 mutant gliomas.3,42,43 Yet, it is still not clear what is the mechanism behind the formation of IDH1 mutant gliomas. On the neuronal part, patients with IDH1 mutant gliomas have shown a slower growth rate disrupt structural and functional neural networks and impaired brain connectivity. 44 Also, patients with IDH1 mutant gliomas had better preserved microstructural integrity of normal-appearing white matter than patients with IDH1 wild-type gliomas. 45 The mutation of TP53 also affects neuron function. As we know, p53 is a critical gene for inducing apoptosis in neural progenitors and postmitotic neurons during the development of the central nervous system. 46 The previous finding shows that the TP53 mutation increased the nerve density and improved the neuritogenesis during early tumorigenesis by inactivating TP53 function. 47 On the immune part, patients with IDH1 mutation exhibit an “immune cold” phenotype, making it less immunoreactive than IDH1 wild-type. 48 TP53 mutation was found to promote tumor formation, invasiveness, and angiogenesis, all of which contribute to tumor malignancy in gliomas. 25 It’s worth noting that the majority of IDH1 R132 mutant tumors express the proneural subtype signature (a positive prognostic indicator), and none possessed the mesenchymal signature. 49 The previous phenotypic finding confirmed that IDH1 R132 mutant GBMs might arise by evolution from IDH1 R132 mutant LGGs. 43 Increasing evidence suggests that TP53 mutation-induced loss of p53 function is a key early event in glioma development. 46 In summary, it is hard to identify which one is the governor, but it suggests that finding a specific target treatment is necessary for the IDH1 mutant subtype.
The high EMILIN3 mRNA was shown to be associated with poor survival in the LGG patients with a high risk of the IDH1 wild-type. 50 In our study, we found that the low expression of EMILIN3, SAA1, and VSTM2A had a higher survival rate in the LGG patients with IDH1 wild-type, but the mRNA expression of EMILIN3, SAA1, and VSTM2A had no difference and with higher survival rate in the LGG patients with IDH1 and TP53 mutation, which was similarly found in HAMP mRNA expression in GBM patients with IDH1 and TP53 mutations. According to previous studies, EMILIN3 (elastin microfibril interface 3) is involved in glioma development through heparin and heparin sulfate proteoglycans on the extracellular matrix.51-53 SAA1 (serum amyloid A1) is a high-density lipoprotein mainly present in the liver in response to infection and tissue damage and has been linked to the development of a high-inflammation microenvironment.54,55 VSTM2A (V-set and transmembrane domain-containing 2A) was identified as a novel fusion partner of EGFR in some glioma patients. 56 However, how these genes could be affected especially in survival possibility in the patients with IDH1 and TP53 mutation is still unclear. Low expression of HAMP, IFT80, and CHIC2 was found to be associated with higher survival rate in the LGG patients with wild-type, but the survival possibility in the patients with high expression of HAMP, IFT80, and CHIC2 could also increase with IDH1 and TP53 mutation, but the mechanisms behind it are unclear.
There are several limitations that need to be addressed. First, there are fewer Asian patients involved in the TCGA database, which might limit the universality of the selected markers. In addition, we did not compare the detailed hotspot mutation of IDH1 and TP53, and the potential molecular mechanisms of IDH1 mutant gliomas remain unclear. Furthermore, the present study assessed the selected marker in the survival possibility; more in vivo or in vitro experiments are needed for future work.
Conclusion
In conclusion, the GBM and LGG patients with IDH1 and TP53 mutations had a higher survival possibility than the patients with wild-type, which might be related to neuron function, immune function, tumor invasion, and metastasis. The different mRNA expressions of EMILIN3, SAA1, VSTM2A, HAMP, IFT80, and CHIC2 were correlated with the different survival possibilities of the LGG patients with wild-type, but the correlation was disappeared and both had a high survival possibility in GBM and LGG patients with IDH1 and TP53 mutations. The selected genes in GBM and LGG patients with IDH1 and TP53 mutations could be potential prognosis markers in the future.
Supplemental Material
Supplemental material—Integrated analysis of the genomic and transcriptional profile of gliomas with isocitrate dehydrogenase-1 and tumor protein 53 mutations.
Supplemental material for integrated analysis of the genomic and transcriptional profile of gliomas with isocitrate dehydrogenase-1 and tumor protein 53 mutations by Han-Qing Liu, Wei-Xin Li, Ya-Wen An, Tao Wu, Guang-Yu Jiang, Yu Dong, Wei-Xin Chen, Jian-Chun Wang, Cheng Wang, and Shuo Song in the International Journal of Immunopathology and Pharmacology.
Footnotes
Acknowledgment
The authors would like to thank the support from the Central Laboratory, Shenzhen Samii Medical Center, Guangdong, 518118, China.
Declaration of conflicting interests
The author(s) declared no potential conflicts of interest with respect to the research, authorship, and/or publication of this article.
Funding
The author(s) received no financial support for the research, authorship, and/or publication of this article.
Supplemental Material
Supplemental material for this article is available online.
References
Supplementary Material
Please find the following supplemental material available below.
For Open Access articles published under a Creative Commons License, all supplemental material carries the same license as the article it is associated with.
For non-Open Access articles published, all supplemental material carries a non-exclusive license, and permission requests for re-use of supplemental material or any part of supplemental material shall be sent directly to the copyright owner as specified in the copyright notice associated with the article.