
Abstract
Introduction
Gliomas are, the commonest cancerous tumors of the central nervous system (CNS), and they are stratified as low grade (Grade I or II) and high grade (Grade III or IV), of which glioblastomas (GBMs, Grade IV) display the highest malignancy, with a 5-year survival of less than 5%.1,2 The 2016 WHO Classification of Tumors of the CNS introduces molecular pathology into the diagnosis of gliomas for the first time, combining the molecular markers IDH and 1p19q for classification and nomenclature, which breaks with the tradition of histological classification and helps further understand the nature of CNS tumors. 1 Wide-range exploration has been implemented for such genetic variations in gliomas as IDH1/2, 3 TP53 4 and ATRX mutations, 5 TERT promoter mutations, 6 MET amplification, 7 Omur6-methylguanine-DNA methyltransferase (MGMT) promoter methylation 8 and 1p/19q co-deletion. 9 These variations can help guide the classification, treatment and prognosis of gliomas. The prognosis of most patients with malignant gliomas treated by surgery, radiotherapy and chemotherapy tumor treating fields is still poor, and more new treatments need to be actively explored. 10 Recent research has put mounting focus on immune checkpoints (ICs) and their inhibitors, expanding opportunities for treating cancerous tumors. 11 Breakthroughs have been made in molecular targets and immunotherapy in other malignant tumors, and they are also important directions in the research and development of new therapies for gliomas.
Inflammation, especially persistent chronic inflammation, has been proven to induce tumorigenesis and promote tumor progression in a variety of solid tumors. 12 Past studies have suggested that inflammation impels tumorigenesis probably by way of “lymphoreticular infiltration”, and that immune cells and inflammatory cytokines in the tumor microenvironment (TME) are involved in tumor growth, progression and immunosuppression.13,14 Acute and transient inflammation is an important factor in tissue damage control and repair, while chronic inflammation is related to all stages of cancer development, and inflammatory TME is considered to be a marker of cancer. 15 Long-term inflammatory response is conducive to tumor cell survival and proliferation, immunosuppression and angiogenesis. 16 Blood vessels are an important component of TME, and TME determines tumor invasive behavior and affects tumor response to immunotherapy. 17 Neovascularization is a feature of TME, which has the characteristics of continuity and disorder. In general, tumor cells facilitate angiogenesis and inflammation, thereby evading monitoring and clearing by the immune system. 18 In the inflammatory microenvironment of gliomas, a number of inflammatory cells, inflammatory factors and related signaling pathways appear to display close relevance to the progression and prognosis of gliomas.19–22 In addition, the development of gliomas, highly vascularized tumors, depends on the generation of new blood vessels, and several angiogenic factors and genes have been found to promote angiogenesis in gliomas. 23
Most current research focuses on the individual role of inflammatory response-related genes (IRRGs) and angiogenesis-associated genes (AAGs) in tumor progression and prognosis, but there was no systematic discussion on the joint role of inflammatory responses and angiogenesis in gliomas. Therefore, this study focuses on the prognosis, clinicopathological features, TME, immune landscape and immunosuppressive molecules of gliomas to comprehensively analyze the role of IRRGs and AAGs in gliomas and provide a possible basis for future molecular studies.
Materials and methodology
Data snatching
We snatched data of 706 samples (701 glioma tissue samples vs. 5 non-glioma tissue samples) from The Cancer Genome Atlas (TCGA) dataset (https://portal.gdc.cancer.gov/). Meanwhile, gene expression profiles and the patient’s age, gender, survival information, and pathological grade, were downloaded. Additionally, RNA-seq and survival data from 1018 glioma samples were snatched from the Chinese Glioma Genome Atlas (CGGA) [(1. mRNAseq_693 (batch 1); 2. mRNAseq_325 (batch 2)] dataset (http://www.cgga.org.cn/). Then, 257 IRRGs retrieved from the HALLMARK_INFLAMMATORY_RESPONSE, and 58 AAGs were retrieved from WP_ANGIOGENESIS Systematic and MSigDB Team (Hallmark Gene Set).
Ascertaining of prognostic differentially expressed genes (DEGs)
DEGs in glioma tissues versus normal tissues were ascertained with the aid of Limma package in R, and a false discovery rate (FDR) < 0.05 was the cut-off. Next, we filtered IRRGs and AAGs of prognostic significance from DEGs using univariate Cox regression analysis (CRA), and p < 0.05 connoted a difference of statistical significance. Then, we drew a Venn diagram to show the interactions between genes pertaining to prognosis and DEGs. Correlation analysis was performed on prognosis-associated DEGs, and the interaction network in the STRING database was analyzed to determine hub genes. 24
Building and evaluation of a prognostic risk score model (PRSM) combining IRRGs and AAGs
To investigate the importance of DEGs in the prognostic assessment of gliomas, 9 DEGs were filtered using least absolute shrinkage and selection operator (LASSO)-CRA, and validated by the Gene Expression Profiling Interactive Analysis (GEPIA, http://gepia.cancer-pku.cn/) database, so as to build a 9-gene signature as a PRSM. On this basis, the patients fell into high-risk (HR) group and low-risk (LR) group, and intergroup comparison of the overall survival (OS) was implemented by way of Kaplan-Meier (KM) analysis. Later, we adopted R software to visualize the risk score (RS) distribution and survival outcomes for glioma patients. Afterwards, we took measure of the predictive efficiency of the PRSM via the area under the curve (AUC) of ROC curve with the aid of timeROC package in R for subjects at 1, 2 and 3 years. Principal component analysis (PCA) and t-SNE analysis were used to explore whether the model was able to differentiate between different risk groups for gliomas. We utilized univariate and multivariate CRAs for ascertaining whether this signature serves as an independent prognostic marker for gliomas. Lastly, through clinical correlation analysis, the relationship of age, gender, and pathological grade with RS of glioma patients was determined.
Comprehensive analysis of TME and tumor immune correlation
We aimed at elucidating relationship between immune status and RS among different risk groups. First, we employed single-sample gene set enrichment analysis (ssGSEA) for calculation of the scores of immune cell infiltration and immune-associated function separately for glioma samples in the TCGA and CGGA cohorts. After the calculation, we introduced Bioconductor Limma package in R to take the measure of the distinction in immune scores and immunotyping, and to draw box plots. Then, we applied Spearman correlation test to assess the RS and the interrelation between PD-L1 and PD-L2 immune checkpoint (IC) expressions and survival. Next, we analyzed the obtained immune, stromal and composite scores of gliomas and drew scatter plots with the aid of Estimate and Limma packages in R.
GSEA and immune profile assessment
First, we employed Limma package in R to filter DEGs from HR and LR groups, and FDR < 0.05 and |log2-fold change| > 1were cut-off values. Later we implemented Gene ontology (GO) and Kyoto Encyclopedia of Genes and Genomes (KEGG) analyses25,26 with the aid of ClusterProfiler package in R for ascertaining how these DEGs biologically function and the enriched pathways. In the end, we implemented ssGSEA for calculation of the scores of cell infiltration and immune-associated function. 27
Protein-protein interaction (PPI) network of DEGs
We compared HR and LR group regarding RNA-seq data distribution by harnessing Limma package in R, and picked out DGEs with padj < 0.5. Then we made evaluation towards these DEGs on the strength of STRING database v11.5 (https://string-db.org/). On this basis, we obtained data pertaining to PPI network (interaction score >0.40), which were manipulated and presented by Cytoscape software v3.9.0. Lastly, we employed topological algorithm for screening of hub genes with the aid of cytoHubba plugin cell Hubba v0.5.
Results
Prognostic DEG identification
We filtered 68 DEGs and 98 prognostic genes were with the aid of univariate CRA from 701 glioma tissue samples and 5 normal brain tissues, of which 13 genes were intersecting prognostic DEGs (Figure 1(a)–(c)). The PPI network between prognosis-related DEGs is shown in Figure 1(d). Filtering of discrepant prognostic inflammatory response-related genes and ARGs. (a) Intersection of differentially expressed genes and prognostic genes with the aid of Venn diagram. (b, c) Thermograms and forest maps of 13 prognostic inflammatory genes. (d) Interrelation network of candidate genes.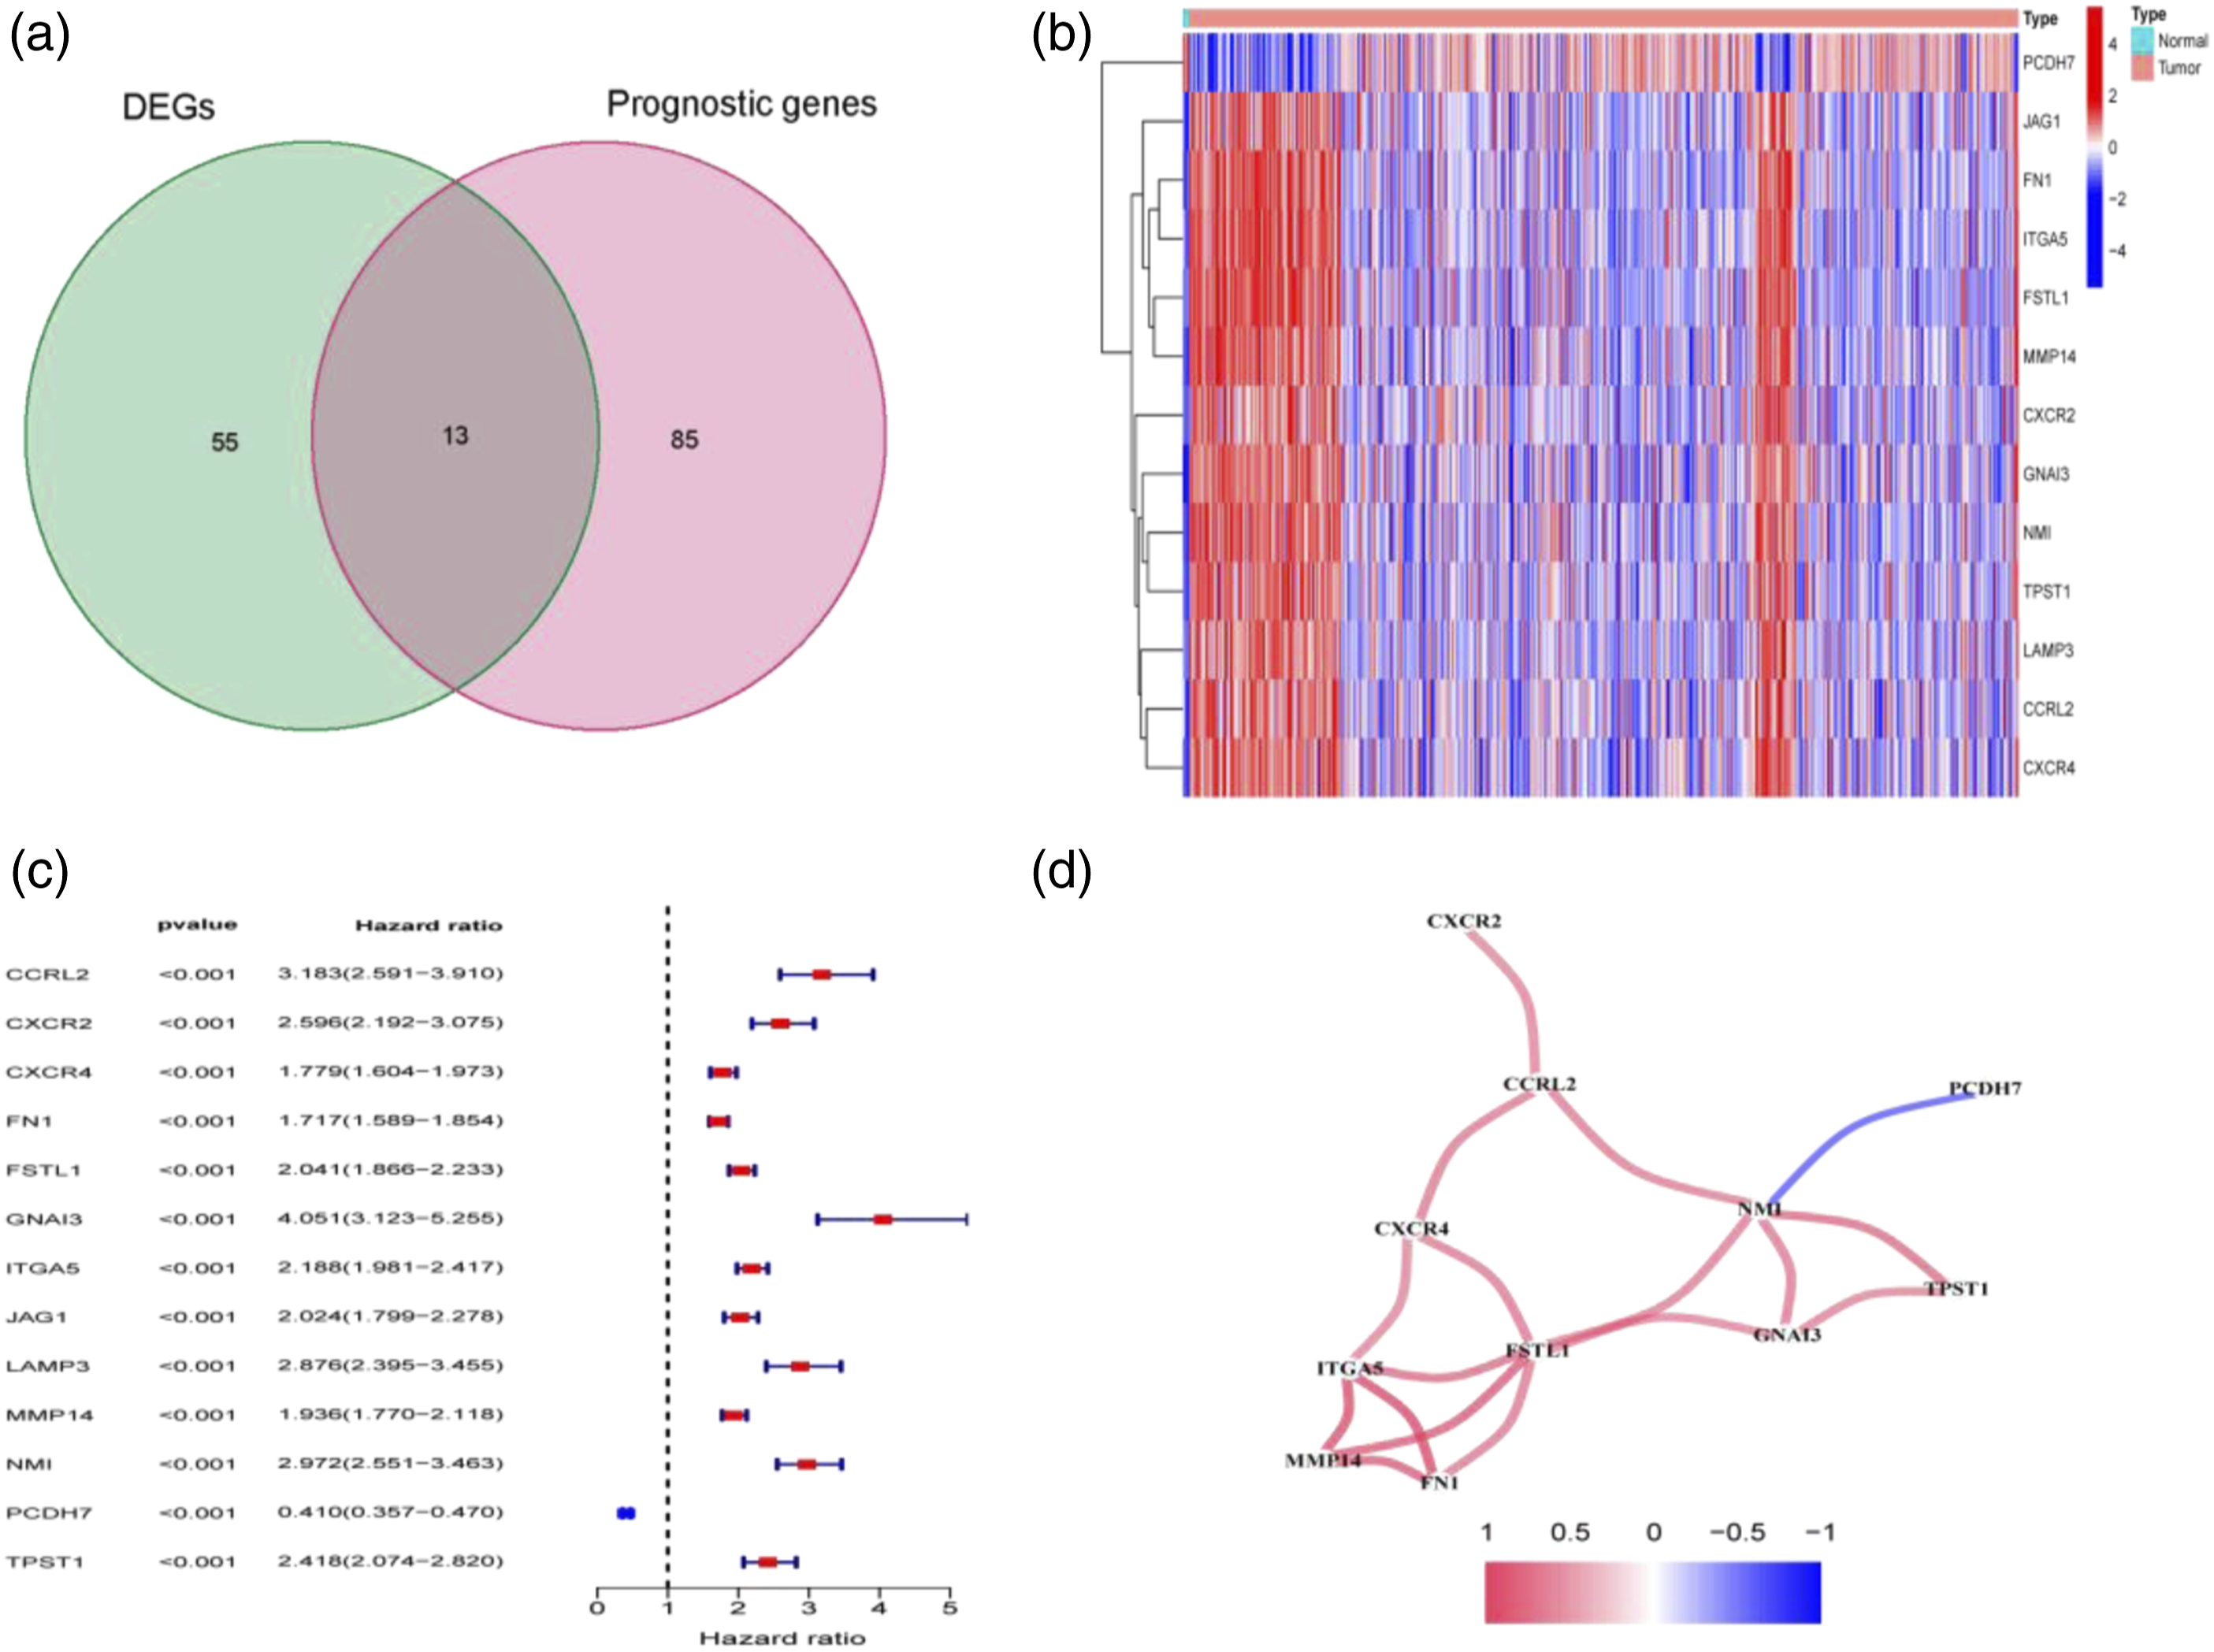
Construction and evaluation of the 9-gene signature
On the strength of the expression data of 13 prognostic DEGs, we performed LASSO-CRA to narrow down the number of genes, 8 IRRGs (optimum variables, CCRL2, CXCR2, GNAI3, ITGA5, LAMP3, MMP14, NMI, and PCDH7) and 1 AAG (FSTL1) were ascertained to build a novel signature (Figures 2(a) and (b)). The RS for such a signature was: [ExpressionCCRL2 × (0.0988789635985483)] + [ExpressionCXCR2 × (0.0699053420780196)] + [ExpressionFSTL1 × (0.308377481979318)] + [ExpressionGNAI3 × (0.121524322663025)] + [ITGA5 expression × (0.212316747300437)] + [ExpressionLAMP3 × (0.130900667299019)] + [MMP14expression × (0.0641830447449308)] + [NMI expression × (0.179432352124152)] + [ExpressionPCDH7 × (-0.251722945088849)]. The glioma cases were then classified into HR and LR groups using the median RS as the truncation value. KM assessments was employed for analyzing the variance in OS between HR and LR groups in the TCGA cohort (Figure 2(d)), and validated using the CGGA cohort (Figure 2(C)). The AUC was 0.857, 0.881 and 0.903 for 1-, 2-, 3-year ROC of this signature in TCGA cohort (Figure 2(e)), and 0.715, 0.782 and 0.774 in CGGA cohort (Figure 2(f)). Consistently, LR glioma cases had a weaker potential of dying earlier compared to HR cases (Figure 3(a), (b), (e) and (f)). PCA and t-SNE analyses yielded that HR and LR glioma cases were highly distinguishable (Figure 3(c), (d), (g) and (h)). GEPIA database ascertained that nine DEGs were expressed at higher levels in both LGG and GBM tissues than in normal brain tissues (Figures 4(a)–(i)). Building and assessment of a PRSM comprising inflammatory response-related genes and angiogenesis-associated genes. (a, b) Least absolute shrinkage and selection operator-Cox regression analyses assisted in filtering 9 differentially expressed genes, and establishing a PRSM. (c, d) Kaplan-Meier curves for overall survival in high-risk and LR groups. (e, f) Area under the curve and time-dependent receiver operating characteristic curve curves for overall survival. (d, e) The cancer genome atlas cohort, (c, f) Chinese glioma genome atlas cohort. Prognostic assessment of the 9-gene signature in TCGA and ICGC cohorts. (a–d) TCGA cohort, (E–H) Chinese glioma genome atlas cohort. (a, c) Risk score median value and distribution. (b, d) Overall survival result distribution. (e, g) Principal component analysis plot. (f, h) t-SNE analysis. TCGA = the cancer genome atlas. Higher expressions of 9 differentially expressed genes were detectable in both LGG and glioblastomas than in normal brain tissuea in gene expression profiling interactive analysis. (a) FSTL1; (b) CXCR2; (c) ITGA5; (d) MMP14; (e) CCRL2; (f) GNAI3; (g) LAMP3; (h) NMI; (i) PCDH7.


Interrelation between RS and clinical traits
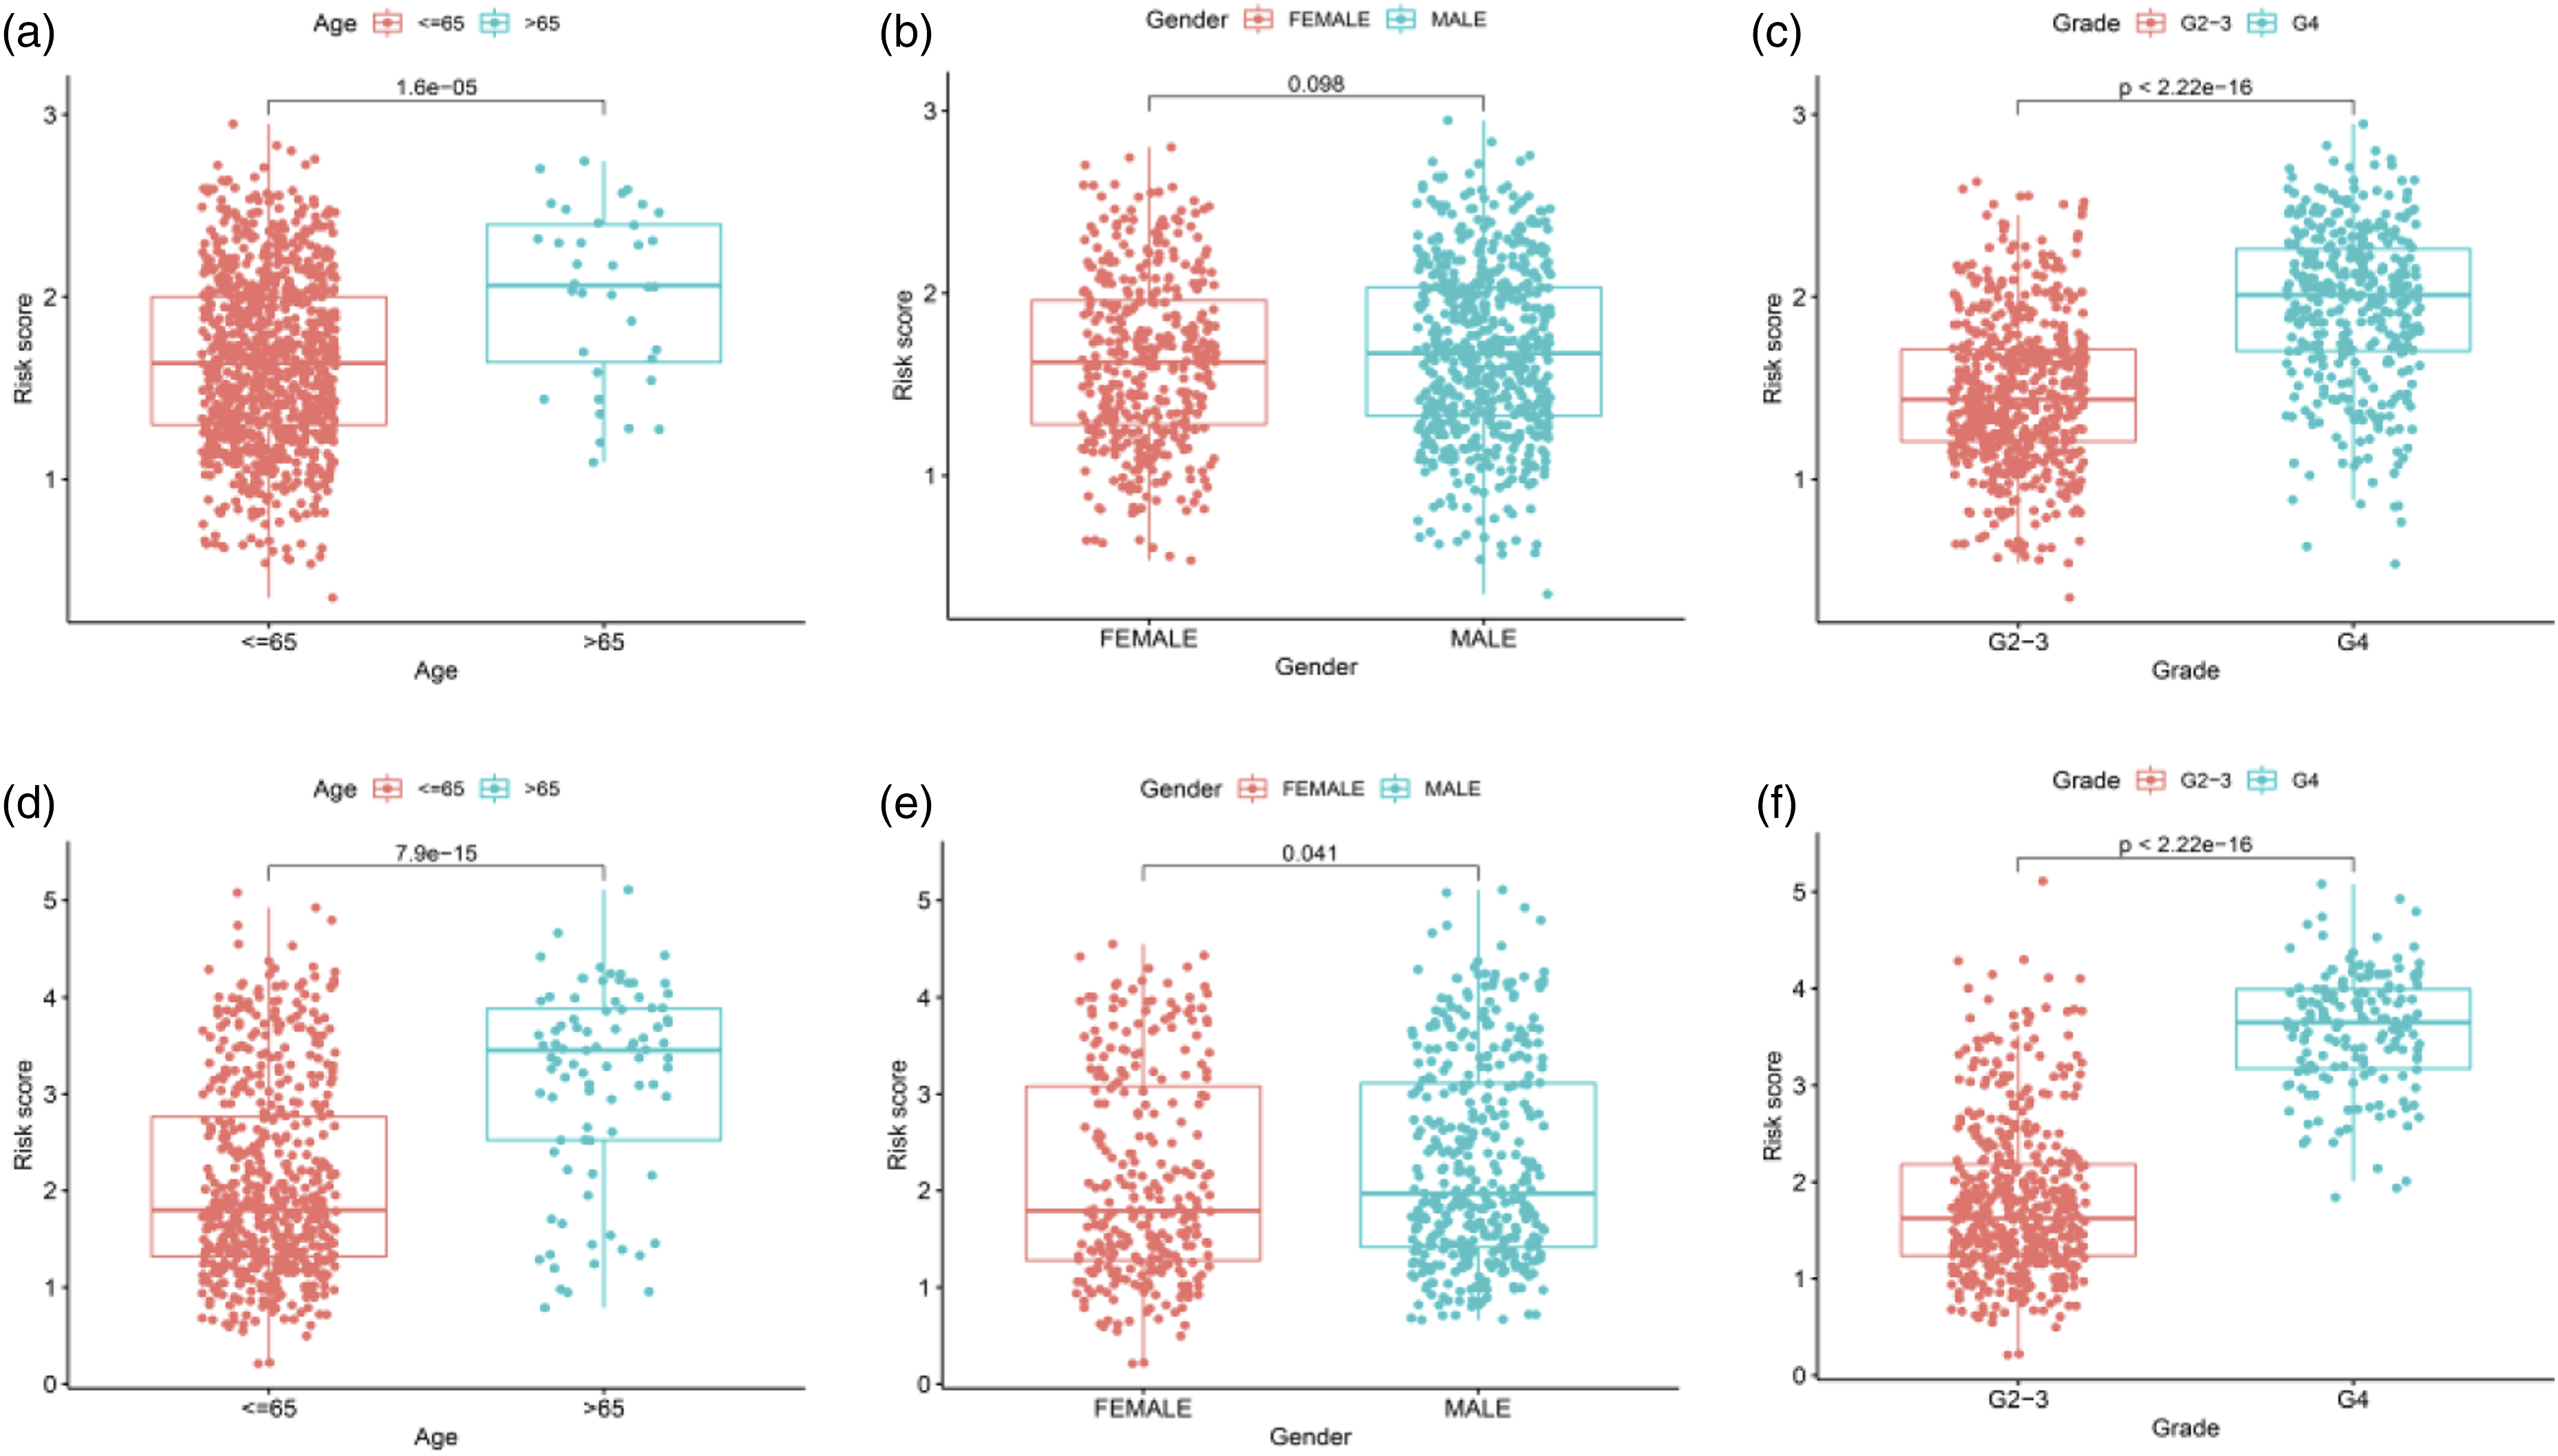
Clinical characteristics related to OS in the univariate analysis included age, grade and RS. In TCGA cohort, multivariate CRA uncovered RS, age and grade were independent predictors of OS in glioma (Figures 5(a) and (b)), identical to univariate and multivariate CRAs in CGGA cohort (Figures 5(c) and (d)). These factors were unveiled to largely differ between RS and age, gender and tumor grade in TCGA cohort (Figure 6(a)–(c)) from those in CGGA cohort (Figures 6(d)–(h)). Further, we made assessment of the clinical characteristics in HR and LR groups by drawing a clinical correlation heat map and found significant intergroup differences in age and grade in TCGA cohort (Figure 7(a)), and intergroup differences in age, grade and gender in CGGA cohort (Figure 7(b)). The cancer genome atlas cohort (a, b) and Chinese glioma genome atlas cohort (c, d). (a–d) Factors pertaining to overall survival were filtered by univariate and multivariate cox regression analysess. Chinese glioma genome atlas cohort (a–c), The cancer genome atlas cohort (d–h). Age, gender, and tumor grade differed between high-risk and low-risk groups. Risk analysis and clinical utility. Heat map (red and blue indicate high and low expression levels) of the interrelation between clinical traits and RS (*p < .05, **p < .01, ***p < .001). (a) The cancer genome atlas; (b) Chinese glioma genome atlas.

Interrelation between immune subclasses and immunity
On the strength of ssGSEA, we derived 16 immune cell subpopulations from TCGA cohort and 13 immune-associated functions from CGGA cohort, aiming at elucidating the association between RS and immunity. The findings uncovered that in TCGA cohort, 12 immune cell subpopulations were significantly more infiltrated in HR group versus in LR group (p < .05) (Figure S1(a)). Further analysis indicated that HR group had considerably higher scores of 13 immune-pertaining functions and pathways versus LR group (p < .05) (Figure S1(b)). Immunocorrelation investigation in CGGA cohort yielded similar results (Figure S1(c) and (d)). It could be deduced that HR group presented activity immunity versus LR group.
Refering to relevant data derived from the TCGA database, intergroup comparison of RS and immune phenotypes immunophenotyping, involving C3 (inflammatory), C4 (lymphocyte-depleted), and C5 (immunologically quiet). It was unveiled that C3-C5 differences and C4-C5 differences were striking (p < .05). The peak RS appeared in C4, and the minimal RS in C5 (Figure S1(e) and (f)).
Correlation analysis of TME and immunity
We delved into the interrelation between RS and the TME, with the purpose for elucidating the avails of the TME in the prognosis of glioma cases. Cancer stem cell (CSC) investigation unveiled that RS of glioma cases exhibited positive relevance to DNAss (p < .001) and negative relevance to RNAss (p < .001) (Figures 8(a) and (b)). The scatter plot illustrated that the RS of glioma cases born positive associations with immune and stromal scores (Figures 8C and (d)), connoting that larger proportions of immune and stromal cell components of the TME corresponded to a higher RS and worse prognosis of glioma cases. Consequently, the RS of this novel prognostic model presents a pronounced association with the activity of TME and CSCs. In addition, aiming at making assessment of the feasibility of the PRSM in predicting the immune response of gliomas, we pored over the correlations of RS with PD-L1 and PD-L2. It was uncovered that in TCGA cohort, PD-L1 and PD-L2 were expressed at substantially higher levels in HR group than in LR group, and both showed positive relevance to RS (p < .05) (Figures 8(e) and (f)), which was validated in CGGA cohort (Figures 8(g) and (h)). It could be deduced that HR group displayed higher tendency to benefit from immunotherapy. Interrelation assessment of the infiltration mode of immune cells. (a–d) Correlations of RS with RNAs, DNAs, interstitial score and immune score. (e–h) PD-L1 and PD-L2 expressions and their relevance to RS were compared between HR and low-risk groups. (e–f) PD-L1, (g–h) PD-L2. RS = risk score.
GO and KEGG functional analyses
This signature-pertaining biofunctions and pathways were pored over with the aid of GO and KEGG analyses of DEGs between HR and LR groups. The biological process (BF) associated with GO comprised of extracellular matrix and structure organization and external encapsulating structure organization, and cellular component was primarily associated with collagen-containing extracellular matrix and presynapse (Figure S2(a)–(c)). Further, as unveiled by KEGG analysis, DEGs showed involvement primarily in HPV infection, MAPK signaling pathway, ECM-receptor interplay, and proteoglycans (Figure S2(d)–(f)).
PPI network of DEGs
The PPI network built as above was demonstrated in Figure S3(a), and the corresponding data were displayed and handled by harnessing Cytoscape software (a plug-in to Cytoscape for identifying DEGs-derived hub genes). 10 hub genes were screened in the PPI network (Figure S3(b)), including MKI67, DTL, HMMR, CDKN3, MCM10, CDC6, UBE2C, BIRC5, NCAPG and EGFR, and were sorted using a sorting method. Gene expression was then compared between non-glioma and glioma tissues, manifesting that glioma cases had higher proportions of BIRC5, NCAPG and EGFR expressed. Survival analysis disclosed that EGFR mRNA expression in hub genes was substantially associated with prognosis of glioma cases (Figure 9(a)). Besides, the EGFR mRNA expression differed among discrepant age, gender and grade groups. The highest expression of EGFR appeared in cases over 65 years old (Figure 9(b)), males had a higher expression of EGFR (Figure 9(c)), and this expression rose with the increase of tumor grade (Figure 9(d)). (a) Survival analysis for subgroup patients stratified by EGFR mRNA expression. (b–d) The EGFR mRNA expression difference among different age, gender and grade groups. EGFR = epidermal growth factor receptor.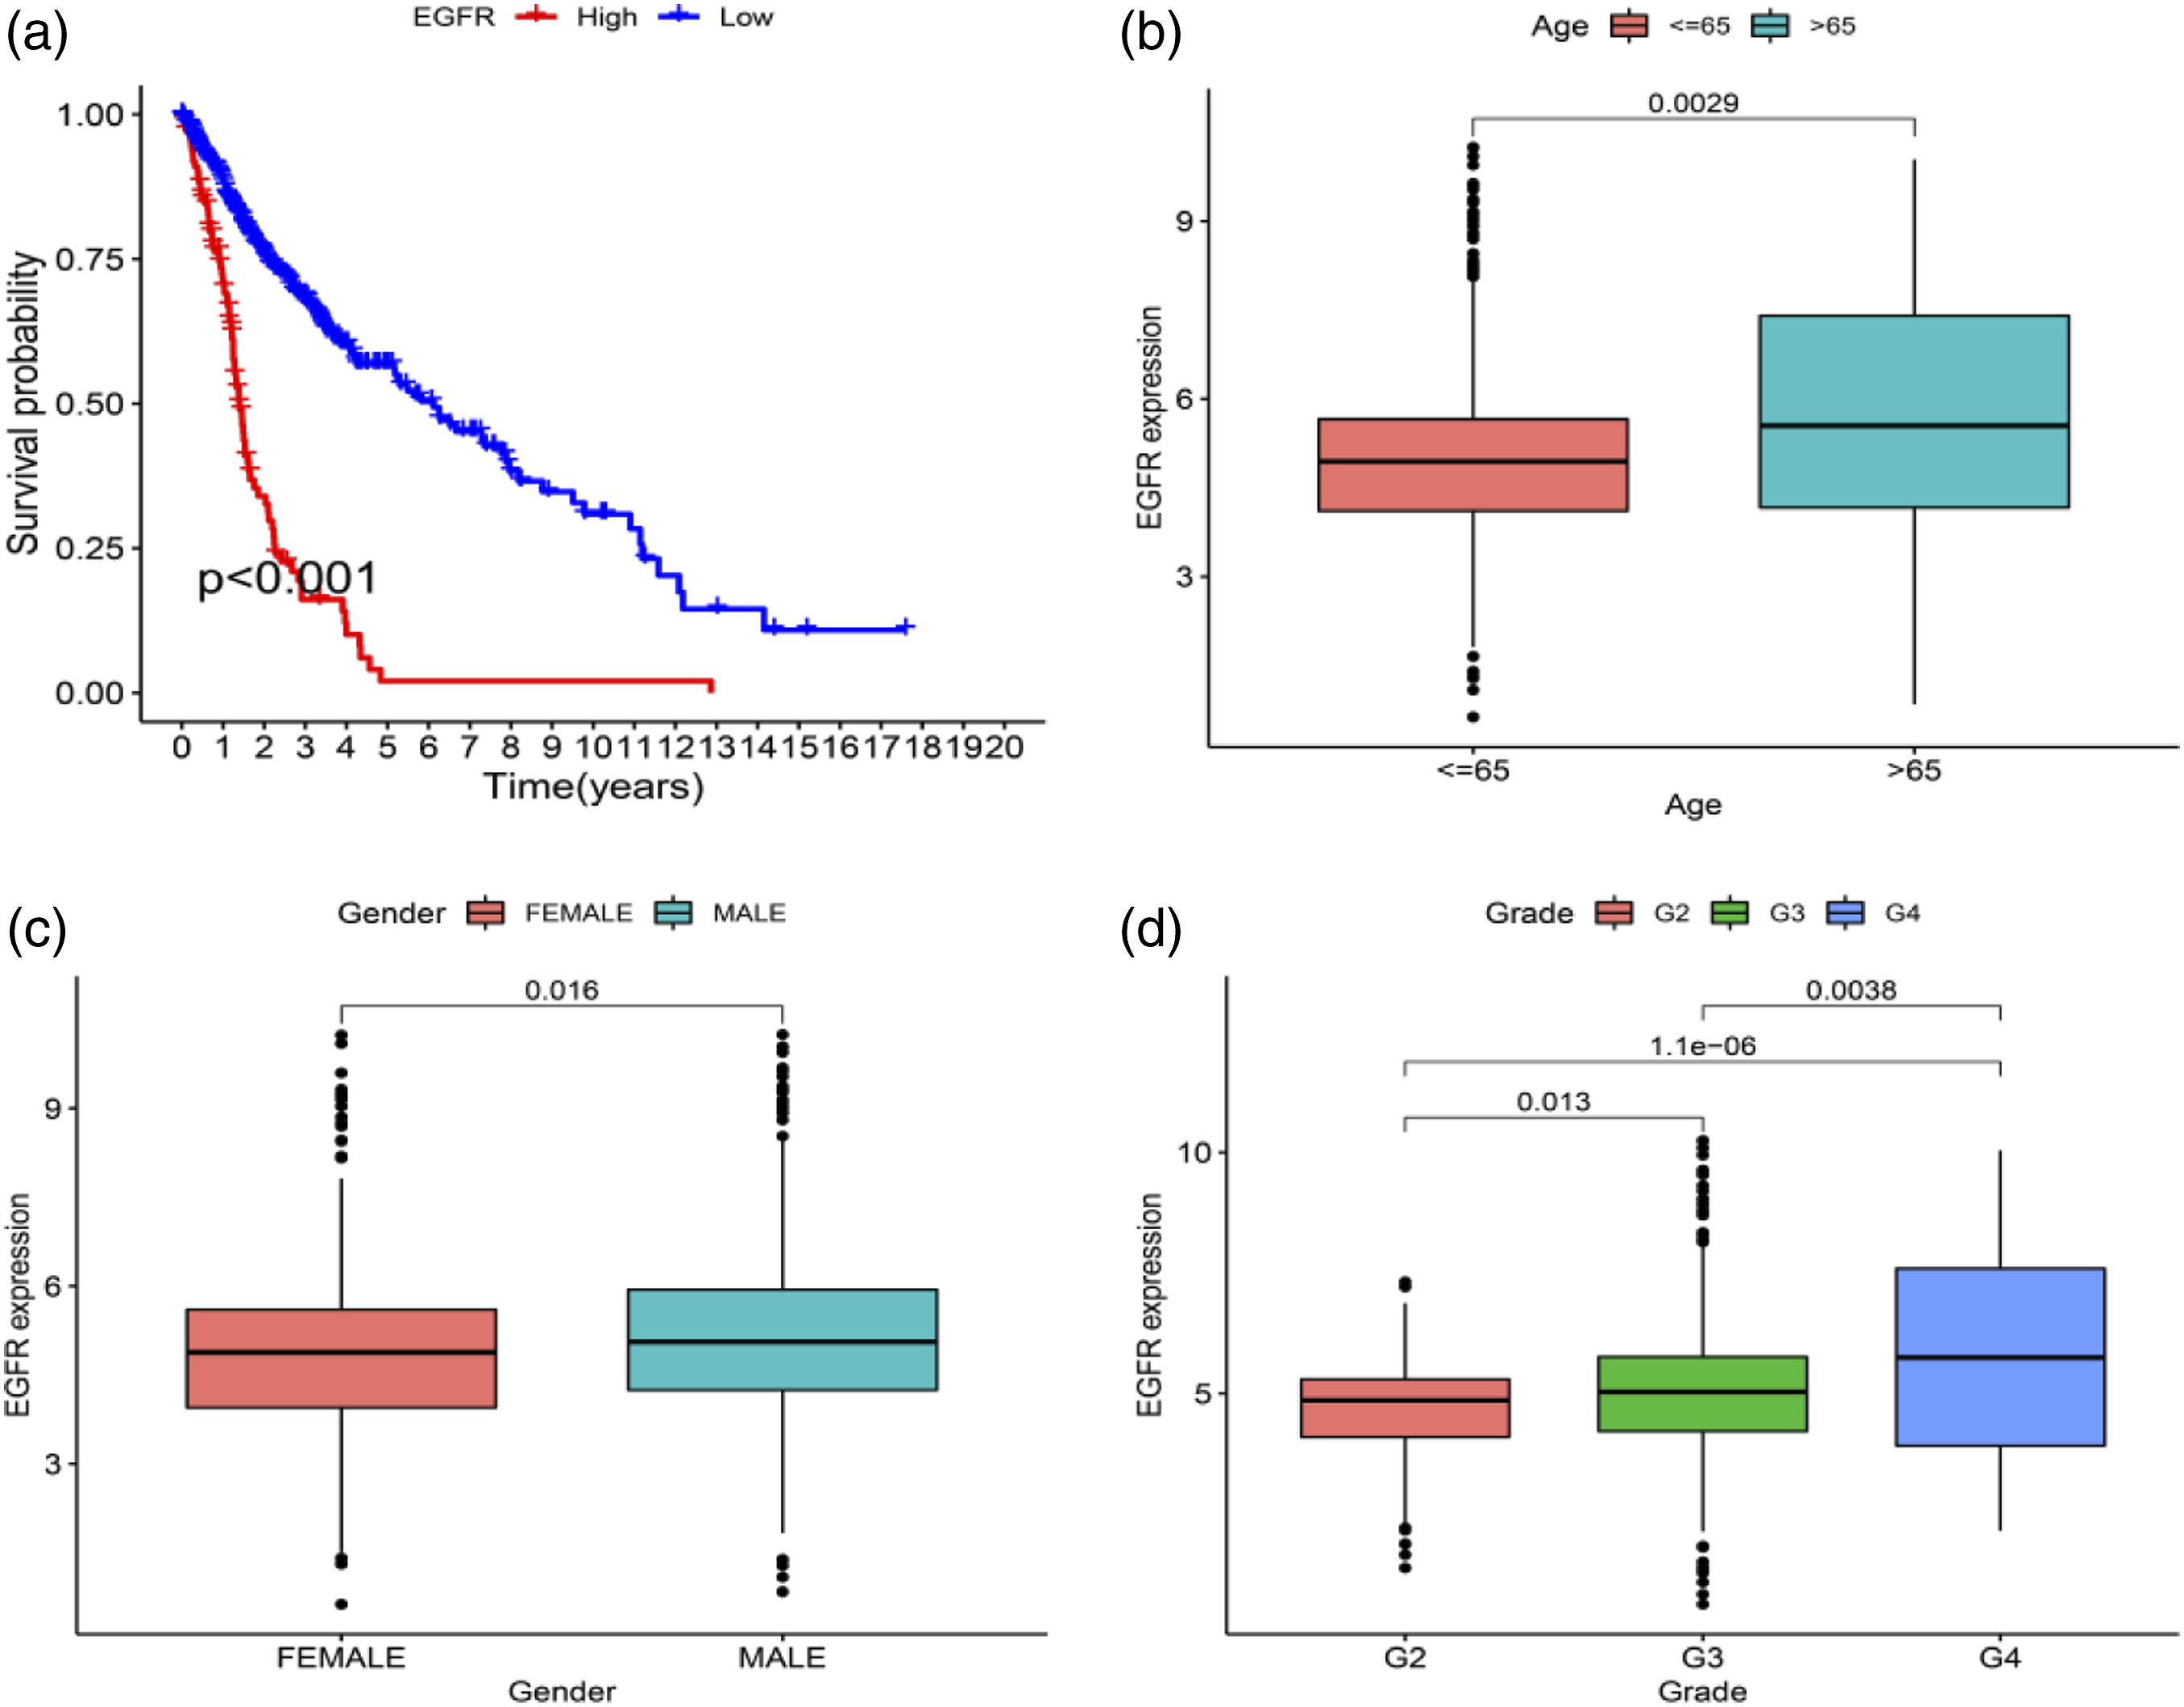
Discussion
Wide-spread prior research has unveiled that inflammatory responses and angiogenesis are closely associated with tumorigenesis and progression. Here, thorough exploration was implemented for the expression levels, prognostic significance and characteristics of tumor immune infiltration of 257 IRRGs and 58 ARGs in gliomas. To surprise, most IRRGs and ARGs were variably expressed between glioma and normal brain tissues. In univariate CRA, approximately 30% of RRGs and ARGs were related to survival, giving proof of the possible function of IRRG and ARG in glioma and the practicability of combining both to construct a prognostic expression signature. A 9-gene signature was built, involving CCRL2, CXCR2, FSTL1, GNAI3, ITGA5, LAMP3, MMP14, NMI, PCDH7.
Macrophages are one of the main cells of inflammatory responses. CCRL2, an atypical receptor activated by endotoxin and cloned from macrophages, has been shown to modify the immune response in various inflammatory conditions, and it has been found that the expression of tumor CCRL2 is a powerful predictor of anti-tumor T cell response in human cancer. 28 Yin F et al. 29 firstly ascertained the strikingly elevated expression level of CCRL2 in high- and low-grade glioma tissues and cell lines. Findings also unveiled that CCRL2 overexpression notably strengthened GBM cell migration and invasions. CXCR1 and CXCR2 are two receptors of IL-8, the first CXC chemokine. 30 CXCR2 has tumorigenic and pro-angiogenic properties similar to CXCR1, 31 and it mediates neutrophil migration to sites of inflammation. 32 CXCR2 is implicated in the proliferation, migration, invasion or metastasis of many malignancies, including intracranial tumors.33–34 FSTL1, belonging to the SPARC family, is a protein-coding gene and a regulator of cell signaling pathways and the progression of many diseases, 35 displaying involving in multifold BFs, including vascularization and modulation of immune responses. 36 In GBM patients, the up-regulation of FSTL1 has been shown to link to worse prognosis.37,38 Also, FSTL1 is a positive regulator of Temozolomide (TMZ) resistance, and overexpressed FSTL1 enhances resistance to TMZ by up-regulating MGMT. 39 The guanine nucleotide-binding protein G(i) subunit alpha-1/3 (Gαi1/3) is a participant in multifold receptor-controlled signaling, and expressed in large quantities. 40 Gαi1/3 is a pivotal player in keeping the macrophage-modulated homeostasis and is a necessity of normal polarization. 41 GNAI3 is one of the Gαi family proteins that has been confirmed to be involved in the regulatory control of a multitude of cellular activities, including invasion, apoptosis, migration and proliferation. 42 Gαi3 appears to rise in human gliomas, activating Akt activation and controlling over the proliferation of cancer cells. 43 In addition, Gαi3 is also a suppressor of irradiation in glioma cells. 44 Integrin Subunit Alpha 5 (ITGA5), belonging to the integrin family, is a momentous controller for proliferation, metastasis, invasion and metastasis in tumors.45–47 In addition, the overexpression of ITGA5 may have a potential and important relationship with tumor immune invasion. 48 Recently, it was found that the epigenetic and transcriptional levels of ITGA5 can effectively predict the drug resistance of TMZ and bevacizumab, suggesting that ITGA5 can be used as an index to predict the treatment outcome of glioma patients. 49 TGA59 is also involved in infiltration of immune cells and remodeling of the immune microenvironment, as demonstrated by a larger range of immune cell infiltration with a high ITGA5 expression. ITGA5 also tightly connect with IC molecules, which may benefit from IC blockade strategies. 50 Lysosome associated membrane glycoprotein 3 (LAMP3), belonging to the LAMP protein family, is overexpressed in a variety of cancers in which it is related to an unsatisfactory prognosis and may be pivotal for tumor metastasis. 51 Matrix metalloproteinase 14 (MMP14) is a membrane-type MMP, and the enhanced MMP14 activity is frequently associated with malignancy and is thought to promote metastasis. 52 Past studies have shown that the use of the HDAC inhibitor suberoylanilide hydroxamic acid (SAHA) in radiotherapy improves the prognosis of GBM patients, and Zhou Y et al. first revealed the role of the MMP14 gene on SAHA-induced radiosensitization in GBM. 53 N-myc interactor (NMI) is a member of the Myc family of oncogenes, which presents an intimate relevance to the onset and progression of tumors. 54 The NMI polymorphism was previously shown to be strongly associated with genetic susceptibility to gliomas in the Chinese Han population. 55 Upregulated NMI turns out to be a momentous participant in the progression of GBM on the strength of inflammatory responses. 56 Procadherin-7 (PCDH7) is a complete membrane protein in the cadherin superfamily, which can strengthen synapses and play a certain role in signal transduction. 57 As a transmembrane protein, PCDH7 can inhibit the formation of homotypic cell-in-cell (hoCIC) and promote tumor growth. 58
Previous studies have demonstrated that inflammatory responses and angiogenesis are closely associated with tumors. Promoting angiogenesis and inflammatory responses affects the glioma microenvironment, evades monitoring and clearance by the immune system, and influences the tumor response to immunotherapy. To investigate the impact of TME and tumor immunity on glioma prognosis, we performed a correlation analysis between RS and TME. It was unveiled that immune and stromal scores manifested positive relevance to RS in glioma patients, which may be significantly correlated with TME and CSC activity. To predict the feasibility of glioma immune responses, we delved into the interrelation between RS and immunosuppressive checkpoints, and found that PD-L1 and PD-L2 expressions were expressed at a larger quantity in HR group versus LR group, and glioma cases in HR group had higher tendency to benefit from immunotherapy. Among 10 pivotal genes screened in the PPI network, the EGFR expression tightly connected to the prognosis of glioma cases. EGFR is not an uncommon oncogenic mutation site in IDH-WT GBM 59 and showed relevance to tumor cell proliferation, migration and freedom from apoptosis. 60
To sum up, we build a 9-gene signature, which shows independent relevance to OS in the TCGA database and had a central action in the glioma microenvironment and immunosuppression. It provides new ideas and approaches for prognostic determination and immunotherapy of glioma.
There are several limitations in our study: 1) Typical analytical methods were used to build and evaluate this novel prognostic risk model. Although the validity of these analytical methods has been validated in numerous studies, more sophisticated methods and techniques are needed in future studies. 2) The combined features of inflammation and angiogenesis were constructed and validated using public datasets, and real-world datasets are needed for accuracy and validity assessment. 3) The mechanistic dissection between genes and glioma immunity have not been clarified at the molecular level, so we should tackle this issue via more laboratory-based research.4) This study lacked in vitro and in vivo trials, which are required for validation in the future.
Conclusion
In this study, IRRG and ARG were used to establish a novel signature that screened for prognostic markers in glioma cases, and their functions in TME and immune responses were delved into. IRRGs and ARGs can be used as biomarkers of therapeutic response to glioma, which provides a valuable basis for further study of immunotherapy and individualized treatment of glioma patients.
Supplemental Material
Supplemental material - Construction of a prognostic classifier and prediction of the immune landscape and immunosuppressive molecules in gliomas based on combination of inflammatory response-related genes and angiogenesis-associated genes
Supplemental material for Construction of a prognostic classifier and prediction of the immune landscape and immunosuppressive molecules in gliomas based on combination of inflammatory response-related genes and angiogenesis-associated genes by Chunbao Chen, Xue Du, Hongjun Liu, Xingyu Lu, Dong Li and Jian Qi in European Journal of Inflammation
Footnotes
Acknowledgement
The authors gratefully acknowledge the Cancer Genome Atlas (TCGA) database and the Chinese Glioma Genome Atlas (CGGA) database, which made the data available.
Author contribution
This research was conducted in collaboration with all authors. Chenbao Chen and Xue Du performed the data curation and analysis. Chenbao Chen, Xue Du and Hongjun Liu and Jian Qi analyzed and interpreted the results. Chenbao Chen, Xingyu Lu and Dong Li drafted and reviewed the manuscript. All authors read and approved the final manuscript.
Declaration of conflicting interests
The author(s) declared no potential conflicts of interest with respect to the research, authorship, and/or publication of this article.
Funding
The author(s) received no financial support for the research, authorship, and/or publication of this article.
Supplemental Material
Supplemental material for this article is available online.
References
Supplementary Material
Please find the following supplemental material available below.
For Open Access articles published under a Creative Commons License, all supplemental material carries the same license as the article it is associated with.
For non-Open Access articles published, all supplemental material carries a non-exclusive license, and permission requests for re-use of supplemental material or any part of supplemental material shall be sent directly to the copyright owner as specified in the copyright notice associated with the article.