
Abstract
Background
Lung cancer has the fastest increase in morbidity and mortality, and is one of the most threatening malignant tumors to human health and life. Both radiotherapy and targeted therapy are typical treatments after lung cancer surgery. Radiotherapy is a means of locally killing cancer lesions, and it plays an important role in the entire management of lung cancer. Gefitinib is one of the most commonly used targeted therapy drugs in the treatment of lung cancer. The purpose of this project is to explore the mechanism by which deacetylation of RBBP8 mediated by radiotherapy-promoting protein SIRT6 in lung adenocarcinoma enhances the sensitivity of targeted therapy.
Methods
In both the cell experiments and the animal experiments, the samples were divided into five groups: Model group, RT group, CT group, RT+CT group, and RT+CT+inhibitor group. The CCK8 method was used to detect the viability of each group of cells. The flow cytometry experiment was used to analyze the apoptotic characteristics of each group of cells. The scratch test was used to detect the migration ability of each group of cells. Transwell invasion test was used to determine the invasion ability of each group of cells. The lung tumor tissues of each group of mice were collected to analyze the tumor size, volume, and metastasis characteristics. The TUNEL experiment was used to detect the apoptosis characteristics of the cells in the lung cancer tissues of each group mice. Immunohistochemistry experiments were used to analyze the distribution and relative expression characteristics of protein SIRT6 in mouse lung cancer tissues. The colorimetric experiments were used to detect the activity of Caspase 3 and Caspase 8 in each group. Western blot method was used to detect the expression of SIRT6, RBBP8, and MYC in each group.
Results
In each experiment, the results of the experiment have mutually proven consistency, and there is no contradiction. In addition to the Model group, the other 4 groups used different treatment methods. The better the curative effect, the lower the cell viability of cancer cells and the higher the apoptotic ratio. This is reflected in the CCK8 test, flow cytometry analysis, cell scratch test, Transwell cell migration test, and TUNEL detection. At the same time, colorimetric detection and Western blot analysis also analyzed the levels of SIRT6, RBBP8 and other cancer-related proteins in each group at the molecular level, implying the importance of SIRT6 protein in the treatment process.
Conclusion
Our project has proved that radiotherapy can promote the protein SIRT6 to deacetylate RBBP8 proteins, and ultimately enhance targeted therapy drug sensitivity.
Introduction
In morbidity and mortality, lung cancer has the fastest increase. And it is one of the most threatening malignant tumors to human health and life. Every year, 18 million people are diagnosed with lung cancer, accompanied by 16 million people’s death. The 5-year survival rate varies from four to seventeen%, depending on stage and regional differences. 1 In the past half century, many countries have reported that the incidence and mortality of lung cancer have increased significantly. The incidence and mortality of lung cancer in men are the first among all the malignant tumors, and that of lung cancer in women are the second of all malignant tumors. 2
Non-small cell lung cancer (NSCLC) accounts for about 80% of the total number of lung cancers. Radiotherapy is the only possible cure for inoperable stage I and stage Ⅱ NSCLC patients. Radiotherapy is a means of locally killing cancerous lesions, which plays an important role in the whole process of management in lung cancer. 3 Radiotherapy is also often used in combination with targeted therapy in patients with inoperable stage Ⅲa and Ⅲb NSCLC. 4 At the same time, the benefits of radiotherapy and targeted therapy are to shorten the total treatment time, increase the intensity of treatment, and play the synergistic effect of radiotherapy and targeted therapy, thereby increasing the median survival rate of patients. 5
Gefitinib is a selective EGFR (epidermal growth factor receptor) tyrosine kinase inhibitor. Inhibition of EGFR tyrosine kinase activity can inhibit tumor growth, metastasis and angiogenesis, and activate tumor cell apoptosis. 6
Sirtuin 6 (SIRT6) belongs to the Sirt2 protein family, and it is currently known to have three functions: deacetylation, defatty-acylation and mono-ADP-ribosylation, which are NAD-dependent. 7 Through these two functions, SIRT6 plays an important role in regulating DNA repair, telomere maintenance, glucose and lipid metabolism, inflammation, and the occurrence and development of cancer. Therefore, it is very important for the longevity and health of the body. 8
Currently known SIRT6 deacetylation substrates mainly include lysine at position 9 (H3K9) on H3 histone, lysine at position 56 (H3K56) on H3 histone and C-terminal binding protein Interacting protein (CtIP). RBBP8, the alternative name of CtIP, plays a key role in cell cycle monitoring point regulation and DNA damage repair. 9
It is currently known that SIRT6 can increase the radiosensitivity of non-small cell lung cancer and has a protective effect on radiation-induced lung injury. 10 This work intends to explore the molecular mechanism of radiotherapy for lung adenocarcinoma enhancing the sensitivity of targeted therapy drugs, through upregulating SIRT6 expression, which can deacetylate RBBP8.
Materials and methods
Cell experiments
Experiment design
Culture A549 cells and NCI-H23 cells of lung adenocarcinoma cell line strictly in accordance with the requirements of aseptic culture. When the cells grow in the logarithmic phase, divide the cells into groups and set them as model group 1, RT (Radiotherapy) group 1, RT group 2, and RT group 3. The radiation doses are 2 Gy, 4 Gy, and 8 Gy, and radiation exposure for 24 h, 48 h, and 72 h. The CCK8 (Cell counting kit-8, Thermo-Fisher, USA) method was used to detect the viability of each group of cells. In addition, model group 2, TT (Targeted therapy) group 1, TT group 2, and TT group 3 were set up. The targeted therapy drug Gefitinib was administered at 3 μM/day, 5 μM/day, and 7 μM/day dilutions for 24 h, 48 h, and 72 h. The CCK8 method was used to detect the viability of each group of cells. Finally, set up the model group, RT group, TT group, RT+TT group, and RT+TT+SIRT6 inhibitor (OSS_128,167) group. The radiation dose was 2 Gy, irradiating for 48 h, and the targeted therapy drug Gefitinib was administered at a dilution of 5 μM/day for 48 h. These 5 groups of cells would be used in subsequent experiments. The CCK8 method was used to detect the viability of each group of cells. The flow cytometry experiment was used to analyze the apoptotic characteristics of each group of cells. The scratch test was used to detect the migration ability of each group of cells. Transwell invasion test was used to determine the invasion ability of each group of cells. The colorimetric experiment was used to detect the activity of Caspase 3 and Caspase 8 in each group of cells. Western blot method was used to detect the expression of SIRT6, deacetylated RBBP8, MYC in each group of cells.
CCK8 detection
Inoculate 100 μL of cell suspension in each well of a 96-well plate, and then place the culture plate in an incubator (37°C, 5% CO2) for pre-incubation for 24 h. Add 10 μL of CCK8 solution to each well, and then incubate in an incubator for 4 h. Finally, the absorbance at 450 nm was measured with a microplate reader.
Flow cytometry analysis
Select 1*105 cells by cell counting, add 5 mL DPBS for washing, then centrifuge at 2000 r/min for 5 min at room temperature, discard the supernatant, and then resuspend the cells with 200 μL DPBS. FITC dye-labeled antibody was added to the cell suspension, incubated at 4°C for 30 min, and then washed twice with DPBS. Then add PE dye-labeled antibody to the cell suspension, incubate at 4°C for 30 min, and then wash twice with DPBS. The stained cells were resuspended in 500 μL DPBS, and fluorescence sorting was performed using a flow cytometer.
Cell scratch test
After the 5 groups of cells were digested and counted, 8 × 10⁵ cells were divided into 35 mm2 culture dishes. Use a marker to draw a line on the bottom of the dish as a mark, aspirate the culture medium, and use a 10 μL pipette tip to mark the cells in the dish perpendicularly to the marker. Rinse with PBS to remove the marked cells, add serum-free culture medium to continue culturing. Take pictures at 24 h, and select the intersection of the line drawn by the marker and the cell scratch as the observation point, and then observe at a fixed point.
Transwell cell invasion test
Twenty-four hours before the experiment, the cells of different groups were replaced with serum-free medium, and the culture was continued. Before inoculation, soak the 24-well plate and Transwell chamber with 1 × PBS for 5 min to moisten the chamber. Digest the cells, wash the cells with serum-free medium, resuspend the cells in serum-free medium, count the cells, and dilute to adjust the cell density to 5 × 10⁵/ml. Inoculate 0.2 mL cell suspension (5 × 10⁴ cells) into the Transwell chamber, and then add 0.7 mL of RPMI-1640 medium containing 10% FBS to the lower 24-well plate, 3 replicate holes per group, and place them in a 37°C incubator for 24 h to terminate the culture. Add 1 mL of 4% formaldehyde solution to each well of the above cells, and fix them at room temperature for 10 min. Aspirate the fixative solution, wash once with 1 × PBS. Add 1 mL 0.5% crystal violet solution to each well, wash with 1 × PBS three times after dyeing for 30 min. Use a cotton swab to carefully wipe off the cells that have not migrated in the Transwell, place them under a 200× microscope, and count the number of cells in each field of view.
Colorimetric detection
Use appropriate methods to induce cell apoptosis and collect cells. Wash the cells twice with PBS (centrifugation at 2000 r/min, 5 min), collect 5 × 10⁶ cells, and remove the PBS supernatant as much as possible. Add 200 μL of ice-cold Lysis Buffer to the collected pelleted cells (add 0.5 μL of DTT to every 50 μL of Lysis Buffer before use), and pipette evenly. Place it on ice for 60 min, vortex and shake 4 times, 10s each time. Centrifuge (10,000 r/min) for 1 min at 4°C. Carefully pipette the supernatant (containing the lysed protein) into a new tube, and place it on ice for later use.
Aspirate 50 μL of cell lysis supernatant containing 200 μg protein, and add 50 μL of 2 × Reaction Buffer. Add 5 μL Caspase-3 Substrate or Caspase-8 Substrate and incubate at 37°C in the dark for 4 h. Measure the absorbance at a wavelength of 405 nm with a microplate reader. Determine the activation degree of Caspase-3 and Caspase-8 by calculating the value of ODinducer/ODnegative control. Take 50 μL Lysis Buffer +50 μL 2 × Reaction Buffer as negative control.
Western blot analysis
Collect cells from each group, and add 200 μL of cell lysate to each six-well plate. When sonication is finished, the cells were lysed on ice for 1 h. Then the cell samples were centrifuged at 12,500 r/min at 4°C for 15 min. Then transfer the supernatant in the centrifuge tube to a clean one. Actin protein quantification kit was used to quantify protein concentration. The measured protein samples were stored at −80°C refrigerator. In Western blot electrophoresis, the protein loading concentration was 50 μg per well. After SDS-PAGE electrophoresis, the membrane was transferred and blocked. Protein SIRT6, deacetylated RBBP8 and MYC primary antibody (1: 500, Sigma-Aldrich, USA) were diluted until it can be used. The samples were incubated overnight on a shaker at 4°C. After PBS washing, the samples were incubated with the secondary antibody (1: 1000, Sigma-Aldrich, USA) for 30 min at 25°C in the dark. Finally, the developer was used for photography and analysis.
Animal experiments
Experiment design
Construction of NSCLC mouse model: inoculate human non-small cell lung cancer H460SM cells into the left lung area of SCID mice to construct an orthotopic animal model of human non-small cell lung cancer, and measure mouse weight, tumor size, and volume every 7 days. After 4 months, the tumor volume was larger than 1 cm3, indicating that the transplanted tumor model was successful. Experimental groups: set up model group, RT group, CT group, RT+CT group, and RT+CT+SIRT6 inhibitor (OSS_128,167) group, each with 12 mice. Even though 12 mice per group were sufficient for statistically significant results, we indeed did not have accurate calculations and proofs for the selection of sample sizes for animal experiments. This was one of the limitations of this study. The radiation dose was 6 Gy, and the radiation was continuously irradiated for 5 days, with an interval of 2 days, and lasts for 3 cycles. The targeted therapy drug Gefitinib was administered via tail vein at a dose of 25 mg/(kg d), acting for 5 days with an interval of 2 days for 3 cycles. After 21 days of treatment, the mice were anesthetized with isopentane, and the necks were severed. The lung tumor tissues of each group of mice were collected to analyze the tumor size, volume, and metastasis characteristics. The TUNEL experiment was used to detect the apoptosis characteristics of the cells in the lung cancer tissues of each group of mice. Immunohistochemistry (IHC) experiments were used to analyze the distribution and relative expression characteristics of protein SIRT6 in mouse lung cancer tissues. The colorimetric experiment was used to detect the activity of Caspase 3 and Caspase 8 in each group of mouse lung cancer tissues. Western blot analysis was used to detect the expression of protein SIRT6, RBBP8 and MYC in each group of mouse lung cancer tissues.
Tumor tissue analysis
The lung tumors of each group of mice were dissected, and the mucous membranes and muscles attached to the tumor mass was peeled off when dissecting, and the integrity of the tumor tissue was not destroyed. Use a vernier caliper to measure the size of each tumor to judge the difference in the treatment effect.
TUNEL detection
The lung cancer tissue sections were deparaffinized with xylene and then hydrated with gradient ethanol. After soaking with NaCl solution and PBS solution, fix with paraformaldehyde, and then soak with PBS solution. Treat the tissues with 100 μL 20 μg/mL Proteinase K for 15 min at room temperature, and then soak with PBS solution. Repeat the steps of fixing and dipping. Add 100 μL of balance solution and equilibrate in a wet box for 10 min. Add 100 μL of the prepared TUNEL reaction mixture to the specimen, add a cover glass, and react for 1 h at room temperature in a dark humidified box. The sample was immersed in a 2 × SSC solution to stop the reaction, and then immersed 3 times. Dip it in 0.3% H2O2 to seal the POD, and then dip it 3 times. Add 100 μL streptavidin-labeled HRP (diluted in 1:500 PBS) for 30 min, and then dip and wash 3 times. Add 100 μL of DAB mixture, react for 10 min, then rinse with deionized water 3 times. Use FITC for counterstaining, rinse and dehydrate, and mount the slides with neutral gum. Use a fluorescence microscope to observe the slices.
IHC analysis
The lung cancer tissues of each group were seeded on a six-well plate and fixed in 4% paraformaldehyde at 25°C for 24 h. All these samples were washed 3 times with PBS. The samples were then sealed with 5% BSA for 30 min. The primary antibody FBP17 and PPRRD (1: 500, Sigma-Aldrich, USA) were diluted until it can be used. After incubating on a 4°C shaker overnight and washed 3 times with PBS, the samples were incubated with secondary antibody (1: 1000, Sigma-Aldrich, USA) at 25°C for 30 min in the dark. Finally, the samples were observed under a microscope with pictures taken at the same time. Image J software was used for positive area analysis.
Colorimetric detection
Put each 100 mg of solid tissue in a petri dish, cut into small pieces of 3 mm × 3 mm with surgical scissors, add 200 μL of ice-cold Lysis Buffer (add 0.5 μL of DTT to every 50 μL of Lysis Buffer before use), and then manually homogenize 15 times on a glass homogenizer. Transfer the tissue homogenate to a 1.5 mL pre-cooled centrifuge tube, centrifuge at 10,000 r/min at 4°C for 5 min. Carefully pipette the supernatant (containing the lysed protein) into a new tube, and place it on ice for later use.
Aspirate 50 μL of cell lysis supernatant containing 200 μg protein, and add 50 μL of 2 × Reaction Buffer. Add 5 μL Caspase-3 Substrate or Caspase-8 Substrate and incubate at 37°C in the dark for 4 h. Measure the absorbance at a wavelength of 405 nm with a microplate reader. Determine the activation degree of Caspase-3 and Caspase-8 by calculating the value of ODinducer/ODnegative control. Take 50 μL Lysis Buffer +50 μL 2 × Reaction Buffer as negative control.
Western blot analysis
The detailed steps of Western blot analysis are the same as the W. blot analysis in the Cell experiments section, so they would not be repeated here.
Statistical analysis
The experimental results are expressed as mean ± standard deviation. Statistical analysis was performed using SPSS 22.0 (IBM Corp.) software. The figures were produced with Origin 2021 (Originlab Corp.) and Adobe Illustrator 2020 (Adobe Systems Incorporated) software.
Results
Cell experiments
CCK8 detection
The CCK8 method was used to detect the effect of radiotherapy with different doses and irradiation time on the viability of lung cancer cells. The results are shown in Figure 1(a). It can be seen from the figure that with the increase of the radiation dose and the extension of the irradiation time, the viability of lung cancer cells is getting lower and lower, which shows that radiation therapy has a significant killing effect on lung cancer cells. The results of CCK8 detection. The data of Model groups are consistent with the normal value. (a) The results of each radiotherapy group. With the increase of radiation dose and time, cell activity decreased. (b) The results of each targeted therapy group. With the increase of dosage and time, cell activity decreased. (c) The results of Model, RT, CT, RT+CT and RT+CT+inhibitor group. The symbol * means p < 0.05 (compared to Model group). The symbol # means p < 0.05 (compared to the RT and CT group).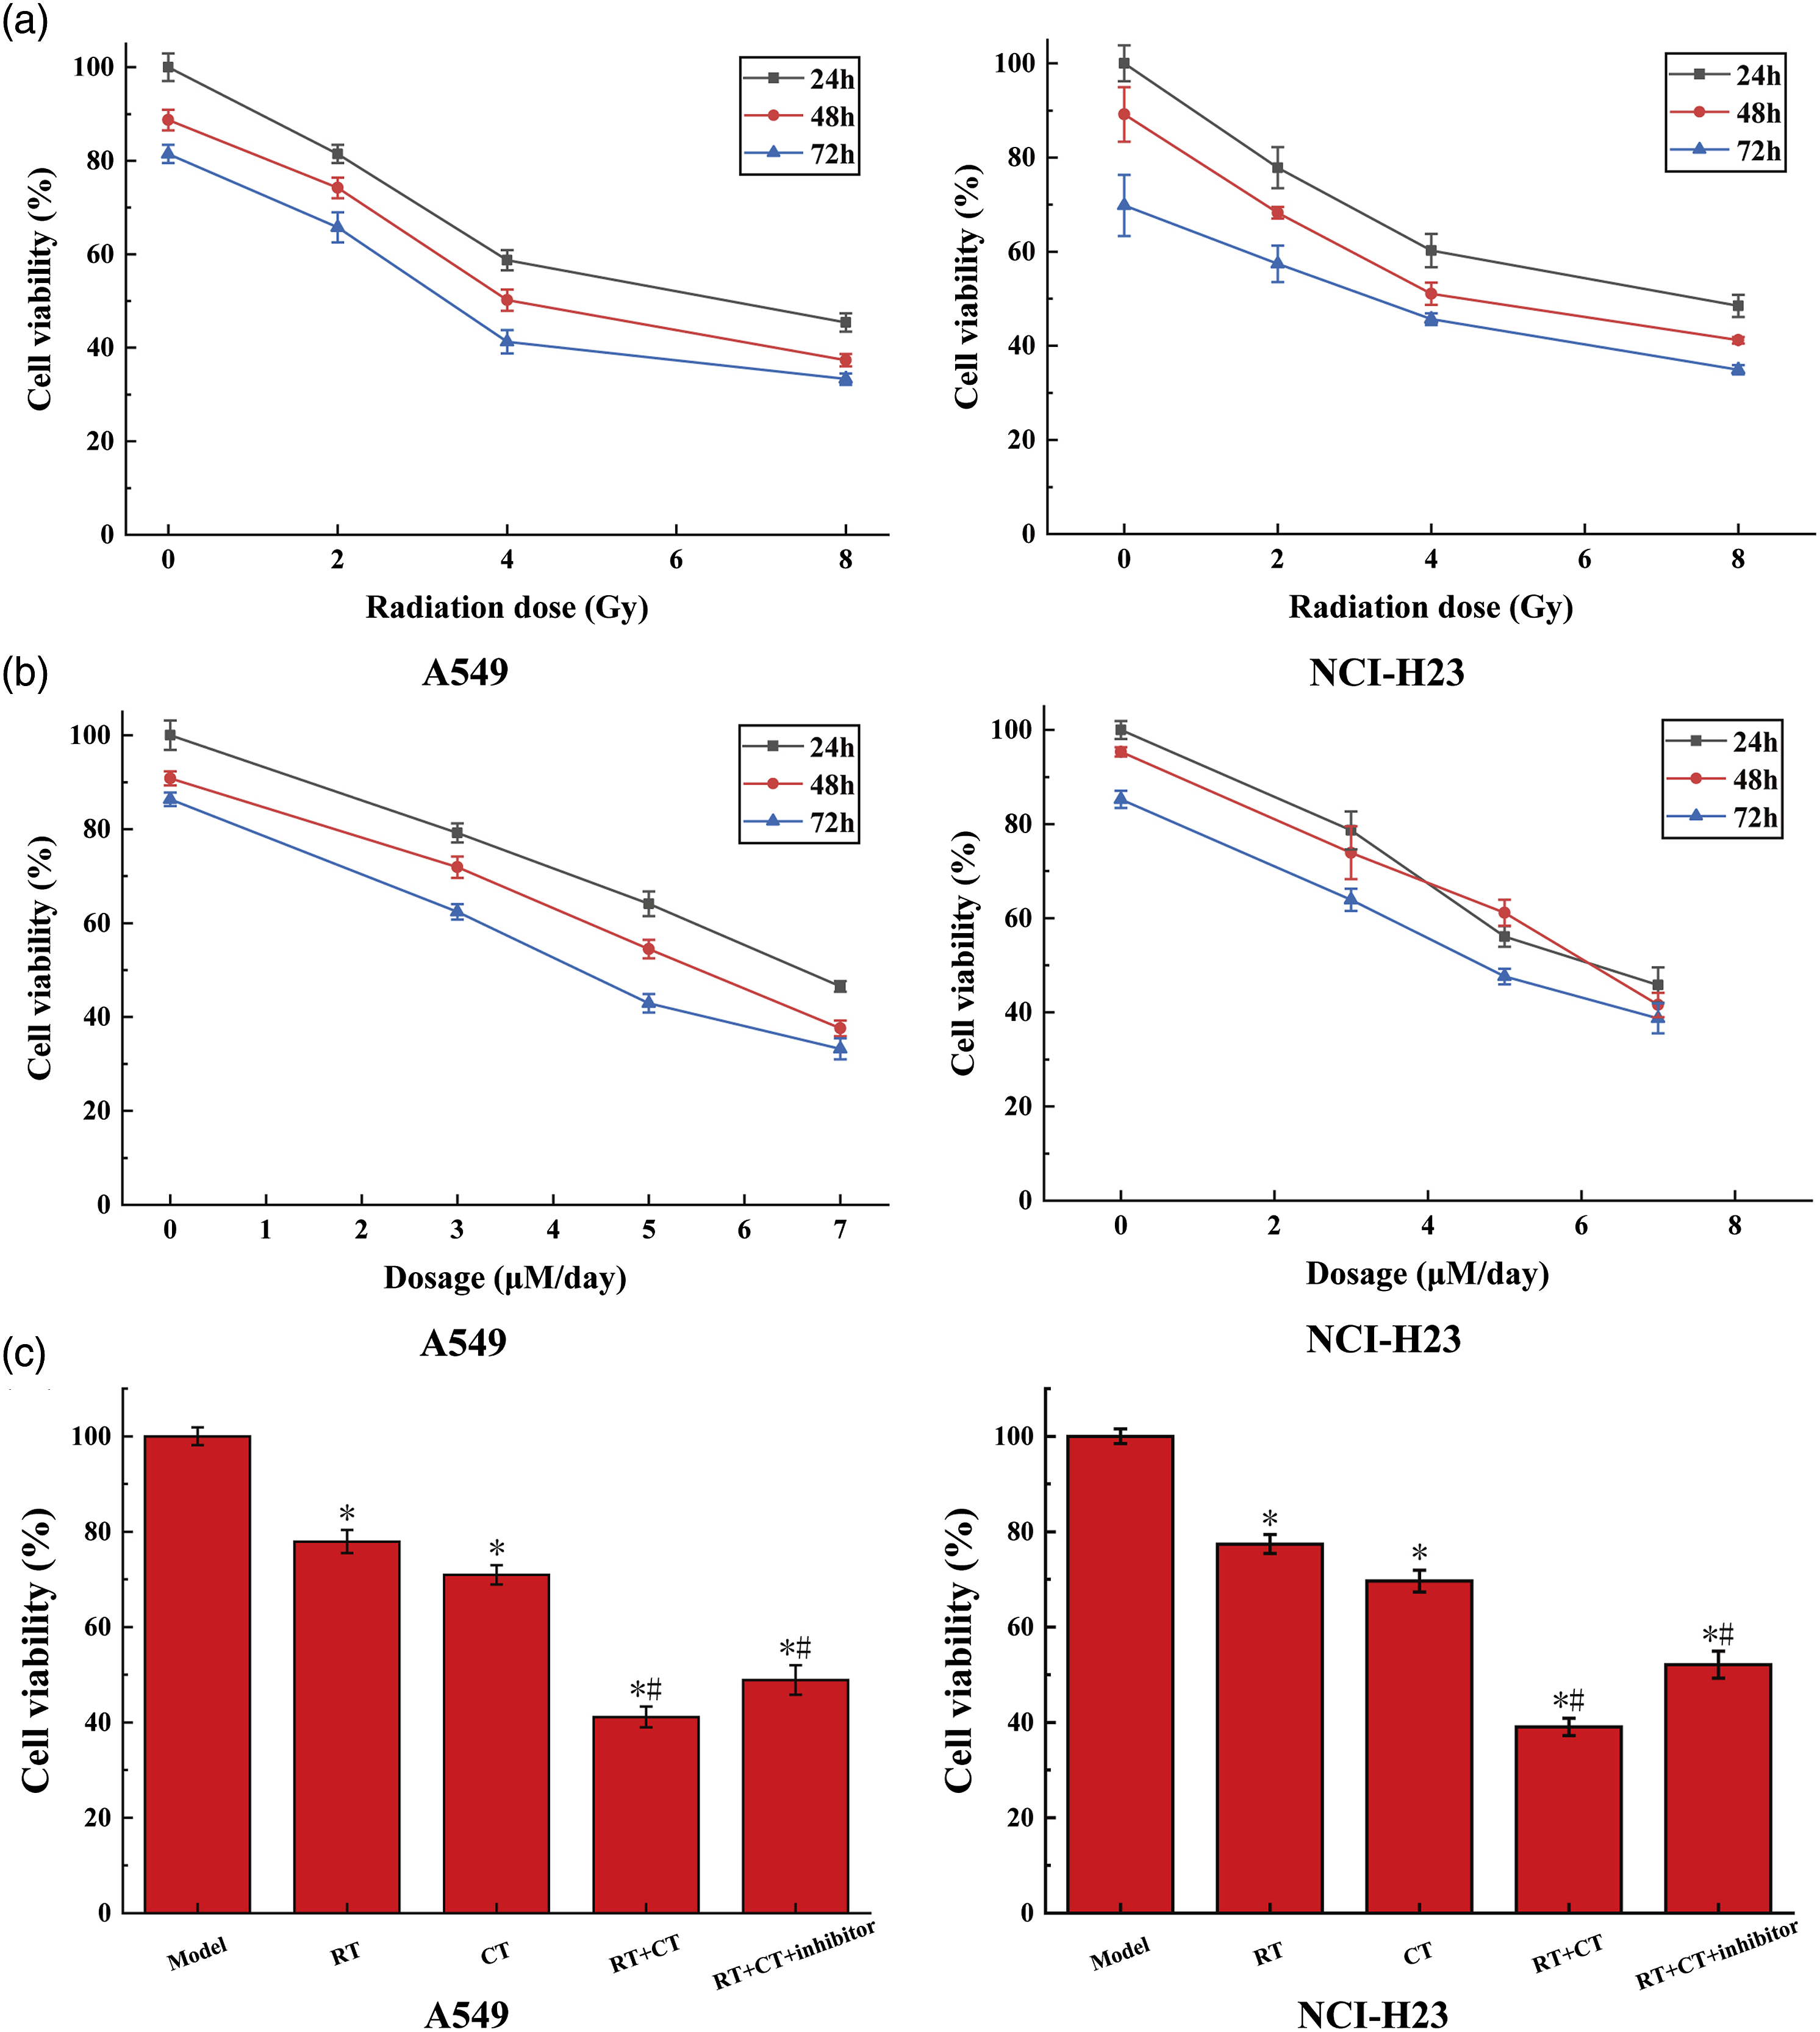
The CCK8 method was also used to detect the effect of targeted therapy with different doses and time of administration on the viability of lung cancer cells. The results are shown in Figure 1(b). It can be seen from the figure that with the increase of the dosage and the prolongation of the administration time, the viability of lung cancer cells is getting lower and lower, which shows that targeted therapy also has a significant killing effect on lung cancer cells. This result is consistent with the result of radiotherapy.
According to the experimental results of radiotherapy and targeted therapy, the cells in subsequent cell experiments were divided into five groups: Model group, RT group, CT group, RT+CT group, and RT+CT+inhibitor group. The results of the CCK8 method to detect the viability of these five groups of cells are shown in Figure 1(c). Compared with the model group, the cell viability of the other four groups after applying any treatment method has been significantly reduced, which shows that these treatment methods have a certain killing effect on lung cancer cells. On this basis, the treatment effect of the RT+CT group is better than that of the RT group and the CT group. Although the treatment effect of the RT+CT+inhibitor group with further addition of SIRT inhibitors is better than that of the RT group and the CT group, it is lower than that of the RT+CT group, which shows that the SIRT6 protein has played a positive role in the treatment process.
Flow cytometry analysis
The results of flow cytometry analysis are shown in Figure 2. The target cell is the apoptotic cell in lung cancer cells. It can be seen from the results that no matter what treatment is used, the proportion of apoptotic cells has been significantly increased. At the same time, the rate of apoptosis in the RT+CT group with dual therapy was significantly higher than that in the two groups with targeted therapy or radiotherapy alone. On the basis of the RT+CT group, the rate of apoptosis in the RT+CT+inhibitor group with a SIRT6 protein inhibitor was added. Compared with the RT+CT group, the proportion of deaths decreased, which shows that the SIRT6 protein has indeed played a positive role in the treatment process, and the results are consistent with the CCK8 test. The results of flow cytometry analysis. The data of Model group are consistent with the normal value. The target cells are apoptotic cells in cancer cells. The symbol * means p < 0.05 (compared to Model group). The symbol ** means p < 0.01 (compared to Model group). The symbol # means p < 0.05 (compared to the RT and CT group). The symbol and means p < 0.05 (compared to the RT+CT group).
Cell scratch test
The results of the cell scratch test are shown in Figure 3. Cell scratch is one of the non-quantitative testing methods for cell viability. After 24 h, the narrower the scratch, the higher the cell viability. As shown in the figure, the cell migration ability of the Model group is the highest, while the migration ability of the RT group and the CT group has decreased. The cells in the RT+CT group and RT+CT+inhibitor group hardly migrated. The cell viability trend shown in the results of this experiment is completely consistent with the results of CCK8 detection. The results of cell scratch test. The data of Model group are consistent with the normal value. The symbol * means p < 0.05 (compared to Model group). The symbol ** means p < 0.01 (compared to Model group). The symbol # means p < 0.05 (compared to the RT and CT group).
Transwell cell invasion test
The results of the Transwell cell invasion test are shown in Figure 4. Transwell cell invasion is similar to cell scratches, both of which are compared with cell migration capabilities to obtain differences in cell activity. More cells means more severe invasion, which means higher cell viability. The trend of the results of this experiment is also consistent with the results of the cell scratch test. The results of Transwell cell invasion test. The data of Model group are consistent with the normal value. The results of this experiment are consistent with the results of the cell scratch test.
Colorimetric detection
The results of the colorimetric experiment to detect the activities of Caspase 3 and Caspase 8 are shown in Figure 5(a). Both Caspase 3 and Caspase 8 are one of the important proteases that induce cell apoptosis, and their activity is positively correlated with the proportion of cell apoptosis. Comparing the results of this experiment with the results of flow cytometry analysis, it can be found that the activity of the two proteases and the trend of the ratio of apoptosis are indeed consistent. The results of Colorimetric detection. The data of Model groups are all consistent with the normal value. (a) The results of cell experiments. (b) The results of animal experiments. The symbol * means p < 0.05 (compared to Model group). The symbol ** means p < 0.01 (compared to Model group). The symbol # means p < 0.05 (compared to the RT and CT group). The symbol and means p < 0.05 (compared to the RT+CT group).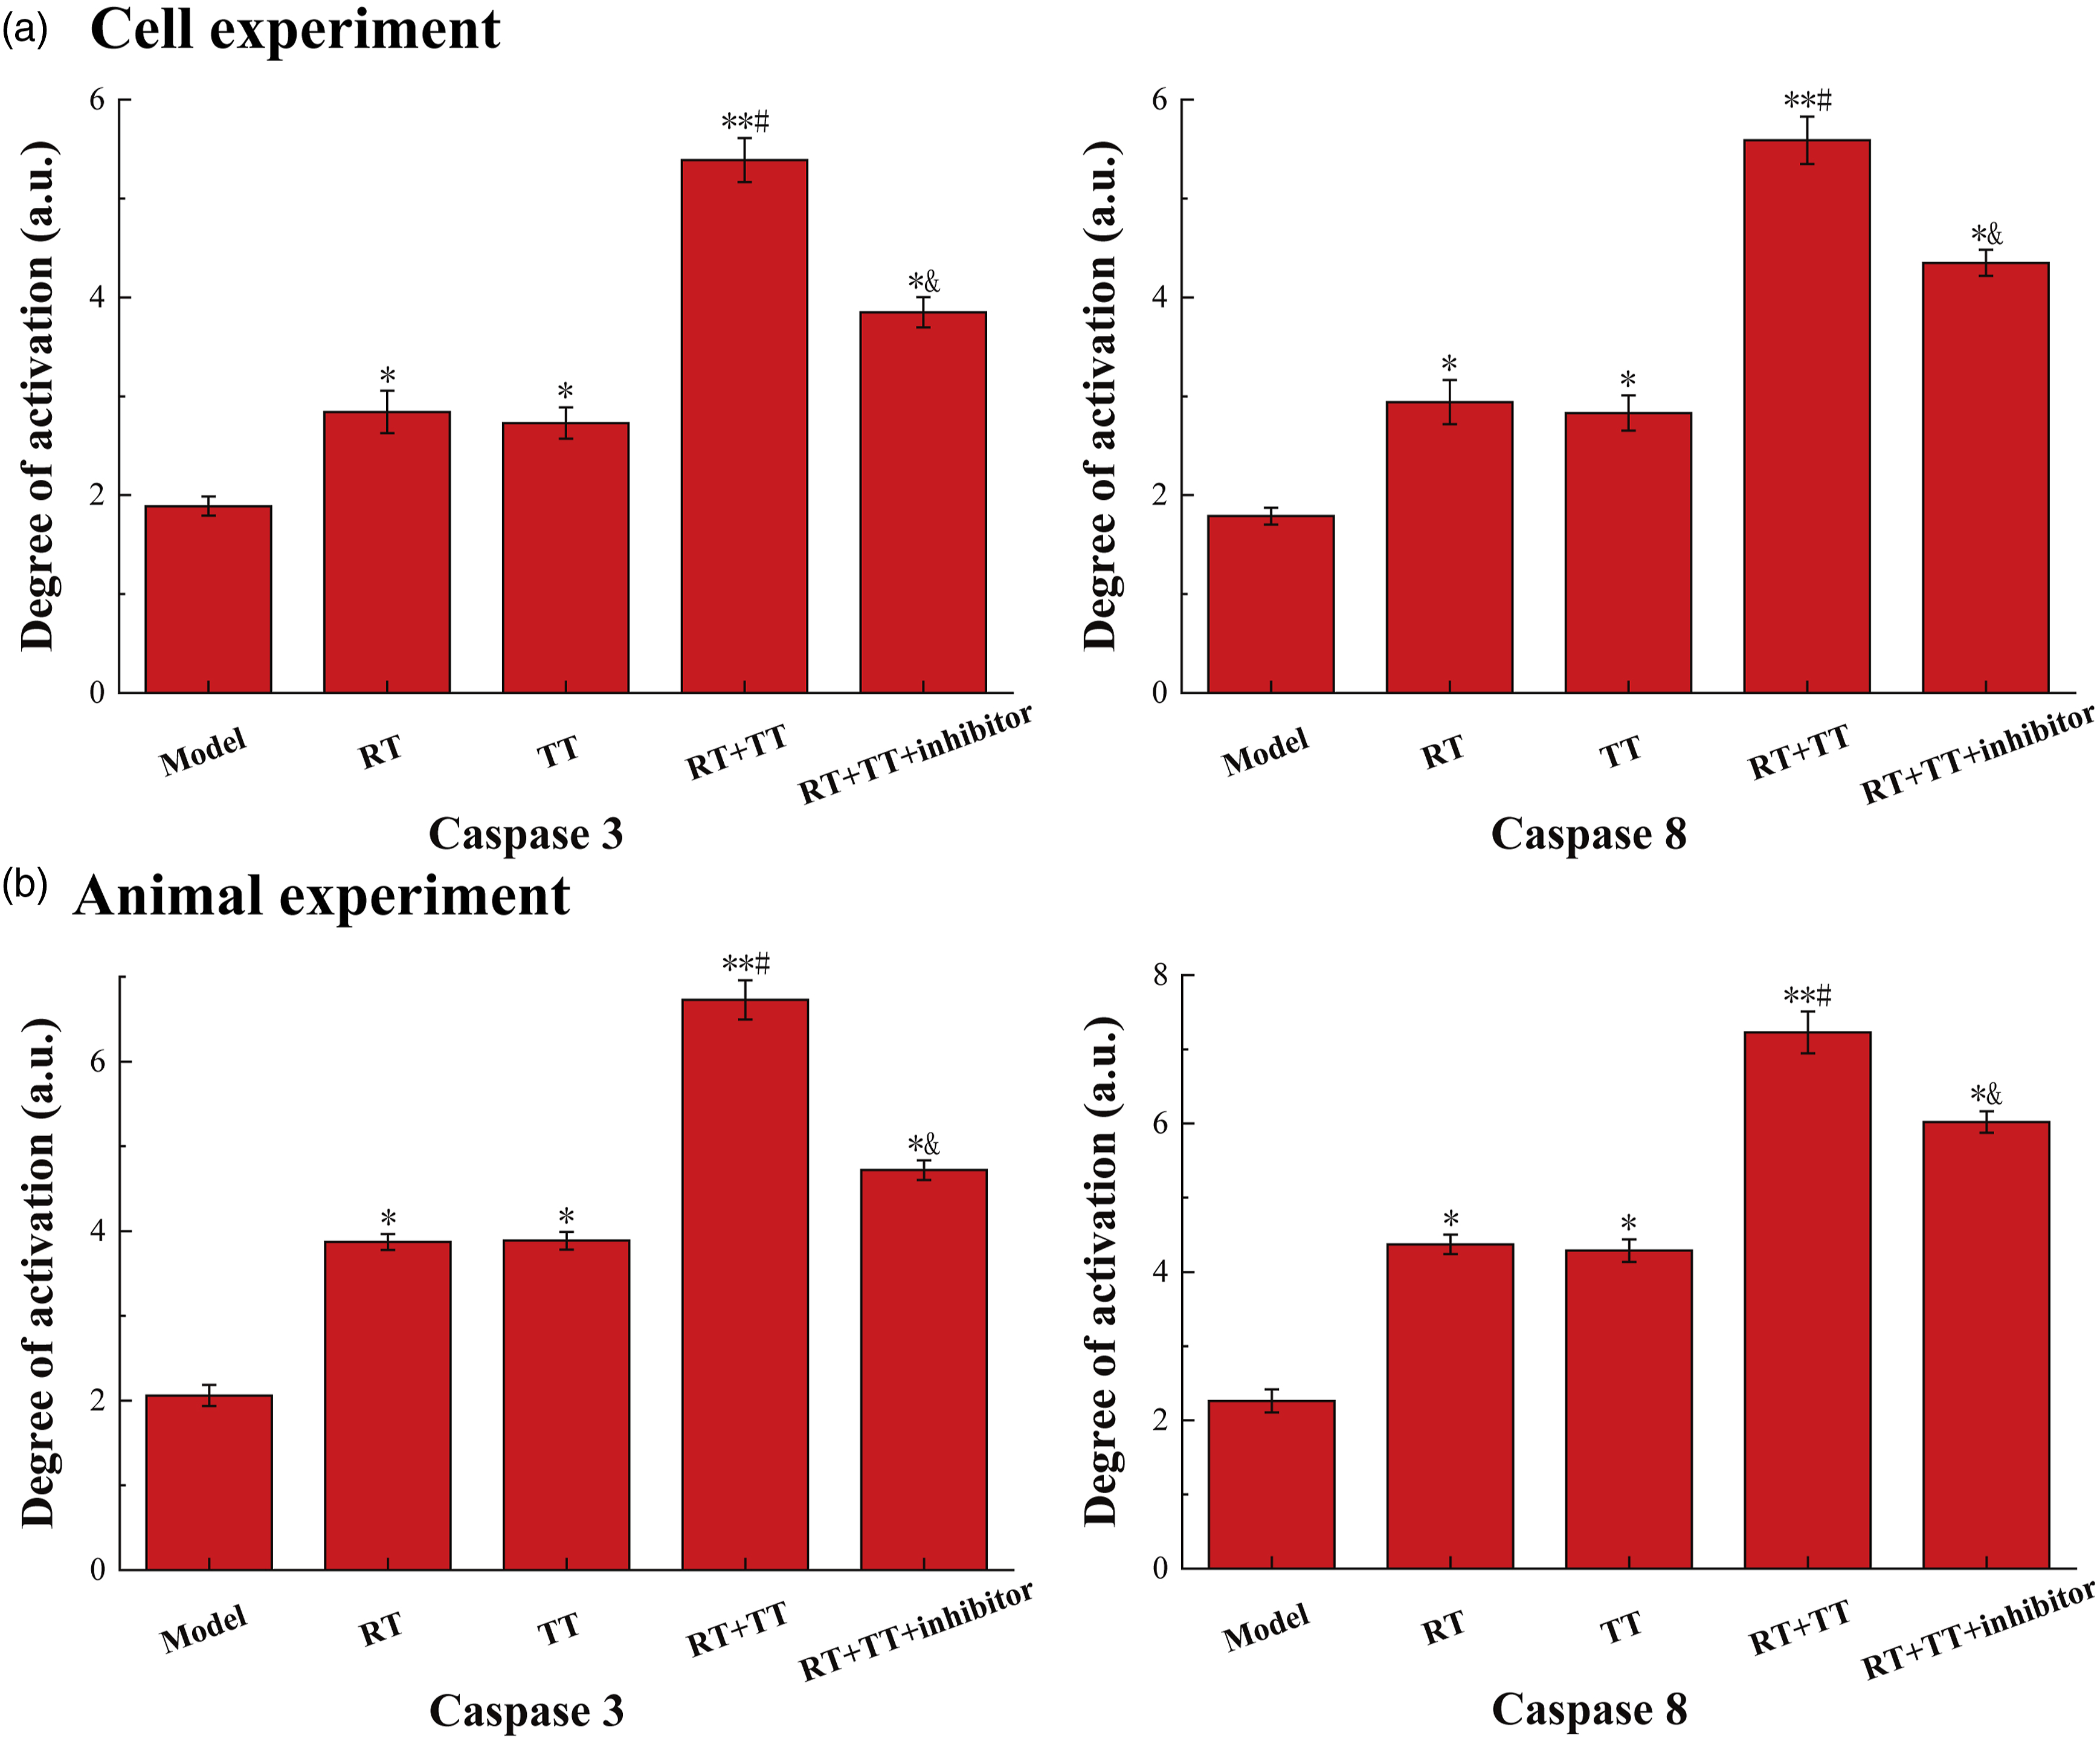
The results of the colorimetric detection in the animal experiments, which are shown in Figure 5(b), are completely consistent with the same experimental results of the cell experiments, and the conclusions that can be drawn are also the same.
Western blot analysis
The results of Western blot analysis are shown in Figure 6(a). Both SIRT6 protein and deacetylated RBBP8 protein play an important role in the process of cancer cell apoptosis, so the protein content is positively correlated with the ratio of cell apoptosis. The MYC protein promotes the development of cancer, contrary to the effects of the other two. The results show that the activity trend of SIRT6 protein and RBBP8 protein is consistent with the apoptosis ratio, while the activity trend of MYC protein is opposite. The results of Western blot analysis. The data of Model group are all consistent with the normal value. (a) The results of cell experiments. The radiation dose was 2 Gy, irradiating for 48h, and the targeted therapy drug Gefitinib was administered at a dilution of 5 μM/day for 48 h. (b) The results of animal experiments. The radiation dose was 6 Gy, and the radiation was continuously irradiated for 5 days, with an interval of 2 days, and lasts for 3 cycles. The targeted therapy drug Gefitinib was administered via tail vein at a dose of 25 mg/(kg d), acting for 5 days with an interval of 2 days for 3 cycles. The symbol * means p < 0.05 (compared to Model group). The symbol ** means p < 0.01 (compared to Model group). The symbol # means p < 0.05 (compared to the RT and CT group). The symbol and means p < 0.05 (compared to the RT+CT group).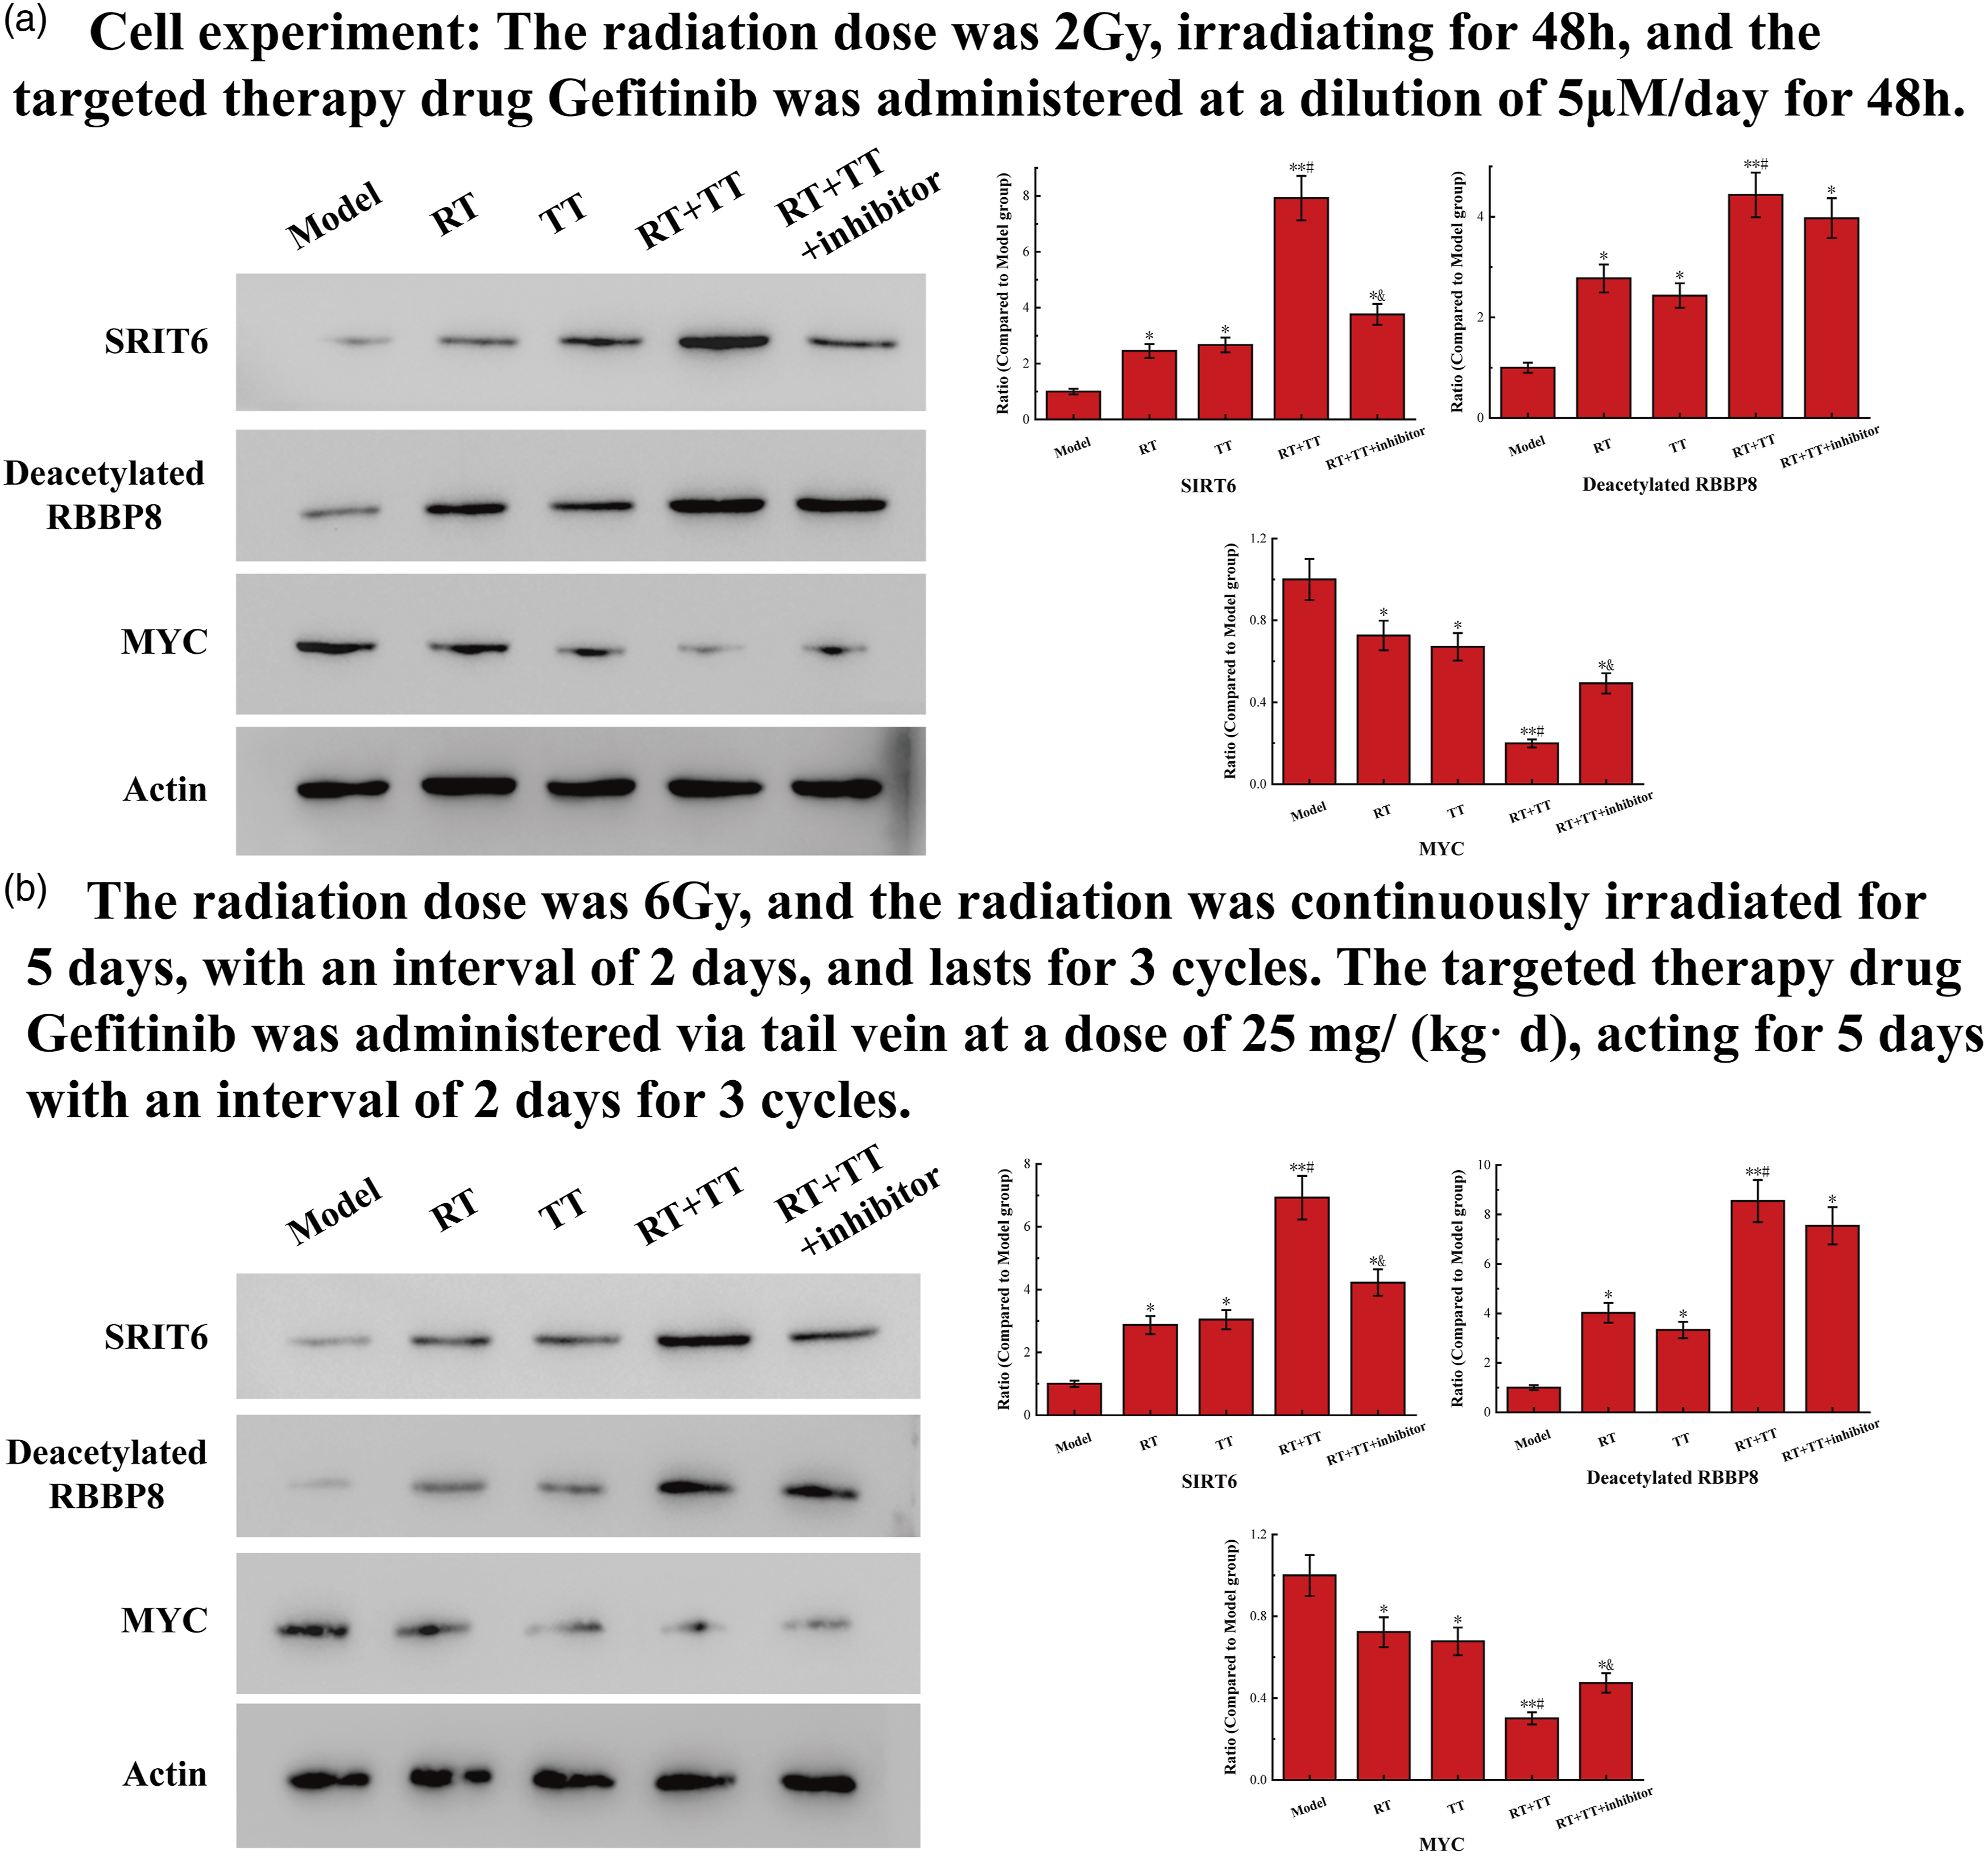
The results of the colorimetric detection in the animal experiments, which are shown in Figure 6(b), are completely consistent with the same experimental results of the cell experiments, and the conclusions that can be drawn are also the same.
Animal experiments
Tumor tissue analysis
The results of tumor tissue analysis are shown in Figure 7. The tumor tissue sizes of the five groups were significantly different. The tumors in the RT group and the CT group were significantly reduced compared to the Model group, while the tumors in the RT+CT group using dual therapy became smaller. As the results of the aforementioned experiments have shown that SIRT6 protein inhibitors will hinder the progress of the treatment, the tumor tissue is slightly enlarged. This showed the same trend as the results of cell experiments, further explaining the importance of SIRT6 protein in the treatment process. The results of tumor tissue analysis. The data of Model group are consistent with the normal value. The symbol * means p < 0.05 (compared to Model group). The symbol ** means p < 0.01 (compared to Model group). The symbol # means p < 0.05 (compared to the RT and CT group). The symbol and means p < 0.05 (compared to the RT+CT group).
TUNEL detection
The results of the TUNEL test are shown in Figure 8. The TUNEL test is a unique method for detecting the degree of apoptosis of the broken gene ends. It is a very good choice to determine the degree of lung cancer cell apoptosis in this animal experiment. It can be seen from the results that the proportion of apoptosis in animal experiments is consistent with that in cell experiments. The results of TUNEL detection. The data of Model group are consistent with the normal value. The part where FITC produces green fluorescence is where the apoptotic cells are located.
IHC analysis
The results of immunohistochemical analysis are shown in Figure 9. The brown-yellow part is the location of the SIRT6 protein. It can be seen from the results that the more obvious the tumor killing effect, the more SIRT6 protein content, which is consistent with the conclusion drawn by Western blot analysis in cell experiments, and further shows the close connection between SIRT6 protein and tumor treatment. The results of immunohistochemical analysis. The data of Model group are consistent with the normal value. The brown-yellow part is the location of the SIRT6 protein.
Discussion
This project studied the relationship between radiotherapy, targeted therapy, SIRT6 protein, and RBP8 protein by establishing a scientific cell and animal model, implementing suitable treatment means, and rigorous control variables. Through basic purification, characterization, etc., we demonstrated that radiotherapy can promote the process of protein SIRT6 to deacetylate RBBP8 proteins, and ultimately enhance targeted therapy drug sensitivity.
The greatest malignant tumor, the one with the highest incidence and mortality growth, and the greatest threat to people’s health and lives is lung cancer. Many nations have reported that during the past 50 years, lung cancer mortality and morbidity rates have considerably grown. Of all malignant tumors, male lung cancer is the most common and deadly, with female lung cancer incidence coming in second. 11 The second place belongs to mortality. Ninety percent of lung cancers need to be treated with targeted therapy, which is the primary form of treatment for the disease. Even a tiny percentage of early small cell lung cancer that was treated with targeted treatment and survived, whether it was early or late, was effective against small cell lung cancer. The major method of treating non-small cell lung cancer is targeted treatment, which has a 40 to 50% to 50% tumor alleviation rate for this kind of disease. Targeted treatment often only serves to extend patient survival and enhance quality of life in patients with non-small cell lung cancer.12,13 Therapeutic targeted treatment and adjuvant targeted therapy are two categories of targeted therapy. Depending on the histological type of lung cancer, targeted treatment needs different targeted therapy medications and different targeted therapy regimens. Gefitinib is a typical targeted therapy agent for treating lung cancer.14,15
When treating lung cancer, radiotherapy is used in conjunction with targeted therapy and is the primary surgical option. Patients with non-small cell lung cancer who do not satisfy the requirements for surgery may also get aggressive treatment with radiation. 16 Radical radiotherapy is the name for this high-intensity radiation treatment. Radical radiation has been improved using continuous hyper-segmentation acceleration radiotherapy (CHART), which delivers a significant radiotherapy dosage in a little amount of time. Chest radiation after non-small cell lung cancer surgery is typically not advised, while it could be helpful for some patients with N2 lymph no mediastinum. Outside of individuals with small cell lung cancer, chest radiation is typically recommended. 17 Additionally, this experiment demonstrated that SIRT6 protein-mediated targeted therapy may be used to provide radiation during treatment, demonstrating the clear significance of radiotherapy in the healing process.
A significant amount of radiation will be used during radiotherapy to harm the DNA of cancer cells. Through the deacetylation of RBBP8, SIRT6 facilitates DNA end excision following DNA damage. SIRT6 controls the expression of several glycolytic genes to regulate glucose homeostasis, functions as a co-repressor of the transcription factor HIF1, and is necessary for proper IGF1 serum levels. 18 SIRT6 has a significant impact on various pathways involved in cancer, metabolism, senescence, cell senescence, and apoptosis through regulating the integrity of telomeres, regulating the expression of genes associated to aging, avoiding genomic instability, and maintaining metabolic homeostasis. 19 BRCA1 and RBBP8 are connected, and it is assumed that RBBP8 controls BRCA1’s ability to govern cell cycle checkpoints, repair DNA, and/or regulate transcription. This suggests that the gene may act as a tumor suppressor and that it functions along the same route as BRCA1.20,21 In this experiment, it was demonstrated that SIRT6-mediated deacetylation of RBBP8 contributed significantly to the onset of cancer and enhanced the therapeutic efficacy of the targeted treatment medication Gefitinib. This is a lot of fun.
Conclusion
This project has conducted a series of experiments and proved that radiotherapy can promote the occurrence of SIRT6 protein-mediated deacetylation of RBBP8, and then improve the efficacy of Gefitinib. However, we still do not know how to specifically make the most effective combination of radiotherapy and targeted therapy to achieve effective killing of lung cancer under the premise of harming health cells as less as possible. Therefore, in order to truly promote the conclusion of this project to the future diagnosis and treatment of lung cancer, more in-depth investigations remain to be processed.
Footnotes
Acknowledgements
We would like to acknowledge everyone for their helpful contributions in this paper.
Declaration of conflicting interests
The author(s) declared no potential conflicts of interest with respect to the research, authorship, and/or publication of this article.
Funding
The author(s) received no financial support for the research, authorship, and/or publication of this article.