
Abstract
Objectives
Lymphocyte-activation gene 3 (LAG-3) represents a potential immune checkpoint target for cancer treatment. We investigated LAG-3 expression and its prognostic value in patients with surgically treated clear cell renal cell carcinoma (RCC) and correlated LAG-3 expression with programmed cell death ligand 1(PD-L1).
Methods
We evaluated LAG-3 and PD-L1 expression using immunohistochemistry on tissue microarrays incorporating 134 primary excision specimens of clear cell RCC (ccRCC). The patients were analyzed as two groups: the whole cohort and those with metastatic RCC (mRCC). The cancer genome atlas (TCGA) data analysis of LAG-3 was done through UALCAN web servers.
Results
Using the UALCAN cancer transcriptional data analysis, we found that LAG-3 was overexpressed in ccRCC. LAG-3 expression was significantly correlated with PD-L1 expression in the whole cohort and in the mRCC group (all, p < 0.05). Both LAG-3⁺ RCC and PD-L1⁺ RCC presented with a higher TNM stage and higher Fuhrman nuclear grade (all, p < 0.05). PD-L1⁺/LAG-3⁺ RCC and PD-L1⁻/LAG-3⁺ RCC showed poorer cancer-specific survival (CSS) than PD-L1⁻/LAG-3⁻ RCC (all, p = 0.01). Similarly, PD-L1⁺/LAG-3⁺ mRCC and PD-L1⁻/LAG-3⁺ mRCC showed poorer CSS than PD-L1⁻/LAG-3⁻ mRCC (all, p < 0.05). Multivariate analysis showed that PD-L1⁺/LAG-3⁺ mRCC (hazard ratio: 3.19; 95% CI: 0.77–13.67; p = 0.033) was a predictor of poor CSS.
Conclusion
Both LAG-3⁺ and PD-L1⁺ RCC have adverse pathological features, and their coexpression predicts worse clinical outcomes. Our findings suggest LAG-3 blockade in combination with programmed cell death 1/PD-L1 blockade as a potential therapeutic approach for RCC.
Keywords
Introduction
Renal cell carcinoma (RCC) comprises approximately 90% of kidney cancer cases, of which 70% are clear cell RCC (ccRCC). 1 Although the surgical resection of early-stage RCC has a good prognosis, the 5-year survival rates for relapsed or metastatic RCC (mRCC) have traditionally been quite low (0%–20%).2,3 In systemic treatment for mRCC, systemic cytokine therapy, followed by targeted therapies, including tyrosine kinase inhibitors (TKIs) and inhibitors of mammalian target of rapamycin (mTOR), have been reported to prolong survival. However, approximately 20%–25% of patients derive no benefit from first-line targeted therapy or become treatment-resistant.4,5 Fortunately, the introduction of immune checkpoint inhibitors (ICIs) has revolutionized the treatment paradigm for mRCC. Immune checkpoint inhibitors targeting cytotoxic T-lymphocyte-associated protein 4, programmed cell death 1 (PD-1) receptor, or PD-1 ligand (PD-L1) have shown clinical efficacy in mRCC treatment.6,7 Despite improved survival and treatment efficacy using ICIs, the treatment efficacy of the checkpoint blockade in mRCC remains limited to a specific subpopulation of patients. 8 Thus, efforts are being made to find alternative pathways and auxiliary targets to overcome the limited efficacy of ICI treatment and treatment resistance.
Lymphocyte-activation gene 3 (LAG-3), also known as CD233, is an example of a new immune checkpoint target. This inhibitory receptor is mainly found on activated immune cells (ICs) and is involved in negative regulatory effects on T-cells and their biological functions related to immune and inflammatory responses.9,10 Based on the coexpression of LAG-3 with other inhibitory receptors, recent preclinical and clinical evidence has revealed PD-1 pathway blockade in combination with LAG-3 inhibition as a potentially effective immunotherapy strategy. 11 However, the expression of LAG-3 and its coexpression with PD-L1 in primary RCC tissue has not been fully investigated. Additionally, the prognostic role of LAG-3 expression in RCC and the synergistic effect on prognosis upon coexpression with PD-L1 remains unclear. Therefore, we investigated the clinicopathological and prognostic significance of the coexpression of LAG-3 and PD-L1 in primary ccRCC tumors. In addition, the association of LAG-3 mRNA expression with immune cells was analyzed using The Cancer Genome Atlas (TCGA) ccRCC database.
Methods
Patients
This study was retrospective in nature. The inclusion criteria for patient enrollment are as follows: We obtained samples from 134 patients diagnosed with ccRCC by clinical, radiological, and histopathological assessment. All patients underwent radical or partial nephrectomy at Inje University Busan Paik Hospital, South Korea, between January 2011 and January 2019. They had no other history of other malignancies and did not undergo radiotherapy or chemotherapy before surgical treatment. The exclusion criteria were (1) subjects with rheumatic immune disease, (2) other types of tumors, and (3) incomplete information. All pathological tissue specimens were provided by Inje Biobank. The study protocol conformed to the ethical guidelines of the 1975 Declaration of Helsinki, as reflected in a prior approval by the Institutional Review Board of Inje University Pusan Paik Hospital (approval no. 20–0121). Data on the histopathological features, such as histological subtype, tumor size, lymphovascular invasion, sarcomatoid features, Fuhrman nuclear grade, and distant metastases at surgery, were collected. The pathological stage was determined according to the 2010 version of the American Joint Committee on Cancer TNM staging system and the Heidelberg classification of renal tumors. The follow-up duration was calculated from the date of surgery to the date of the last follow-up or death. The study patients were analyzed as two groups, namely, the whole cohort and those with mRCC (determined according to the metastatic disease and systemic treatment status during follow-up). Clinical information regarding demographic characteristics, International Metastatic Renal Cell Carcinoma Database Consortium (IMDC) risk classification, and follow-up data were extracted from the patients’ electronic medical records.
Confirmation of LAG-3 expression and association with immune cells in clear cell RCC
UALCAN (http://ualcan.path.uab.edu/), an interactive website for analyzing cancer transcriptome data (TCGA - KIRC), was used to determine the effects of PD-L1 and LAG-3 in ccRCC patients. 12 We used cancer transcriptome data to evaluate stage-dependent changes in expression and survival of both genes in ccRCC patients and data from the Clinical Proteomic Tumor Analysis Consortium (CPTAC) to assess the effect on PD-L1 expression in protein expression analysis. Timer analysis was used to investigate the correlation between infiltration of various immune cells and prognosis of the ccRCC patients according to the status of expression of LAG-3 within the tumor. 13
Tissue microarrays (TMAs) and immunohistochemistry
Six TMA blocks comprising a total of 402 cores with 2-mm diameter were constructed using custom-made precision instrument (Beecher Instruments, Silver Spring, MD). Triplicate from 3 different regions including invasive margin and tumor center containing viable and representative tumor cells (TCs) and stroma with tumor-infiltrating ICs after review of whole tissue section slide in each formalin-fixed paraffin-embedded (FFPE) primary RCC tissue blocks of 134 patients was made. LAG-3 and PD-L1 expression were analyzed in 4-μm-thickness serial sections from each TMA block by immunohistochemistry (IHC). Normal human FFPE tonsil sections treated with and without these primary antibodies were used as positive and negative controls, respectively. Antigen retrieval was performed at 120°C for 10 min in citrate buffer, pH 6.0, using a pressure cooker. IHC staining was performed on a BenchMark ULTRA automated platform (Ventana), according to the manufacturer’s protocol. The following primary antibodies were used and incubated for 2 h at room temperature: anti-LAG-3 mAb (1:200; clone D2G4O, Cell Signaling Technology, MA, USA), PD-L1 (1:100; clone SP263, Ventana Medical Systems, Inc., AZ, USA). After conjugation with an antibody-bound enzyme, the detection was carried out using a Dako REAL EnVision Detection System (LAG3, K5007; Agilent Technologies, CA, USA) and OptiView DAB IHC Detection Kit (PDL1, Ventana Medical Systems, Tucson, AZ).
LAG-3 and PD-L1 scoring
Tissue microarrays and individual slides were visually scored by an experienced pathologist blinded to clinical information. LAG-3 and PD-L1 scoring of ICs is a controversial matter in the current literature; in our study, we used the method of Burugu et al. and Motzer et al.14,15 LAG-3 scores were reported as absolute counts, and any positive expression on ICs (≥1 IC per TMA core) was used for dichotomization into positive and negative cases. IC expression of PD-L1 was assessed as the percentage of ICs with membranous or cytoplasmic expression; any cores with ≥1% of PD-L1+ ICs were considered positive. All IC types, including macrophages and lymphocytes, were counted together to calculate the LAG-3 and PD-L1 scores. PD-L1 expression in TCs was assessed as the percentage of carcinoma cells with membranous expression at any intensity. Any expression of ≥1% in a TMA core that included at least 100 evaluable TCs was considered positive. 7 For the final statistical analysis, PD-L1+ cells were defined as any positive PD-L1 staining on ICs or TCs. The three tumor TMA cores for each case were independently scored, and if any of the three cores were positive, that case was considered positive in the statistical analysis.
Statistical analysis
Continuous variables were presented as means (standard deviation) or medians (interquartile ranges, IQRs). Categorical variables were presented as frequencies with percentages. Differences in the distribution of variables among groups were evaluated using the chi-square test, Fisher exact test, and linear-by-linear association for categorical variables. The Student t-test was used for continuous variables. Cancer specific survival according to the expression status of immune markers was estimated using the Kaplan–Meier method and compared using the log-rank test. Univariate and multivariate Cox proportional-hazard models adjusted by LAG-3 and PD-L1 expression status were utilized to identify any clinicopathological factors that might have affected CSS. The risk was expressed as the hazard ratio (HR), and the 95% confidence interval (CI) was determined using the reference groups. Statistical analysis was performed with SPSS v25.0 (IBM Corp., Armonk, NY, USA) and MedCalc v20.0 (MedCalc Software, Ostend, Belgium). In all tests, a two-sided p-value < 0.05 was considered statistically significant.
Results
LAG-3 and PD-L1 expression in TCGA data
The cancer genome atlas data were analyzed using UALCAN to predict the effect of the mRNA expression of LAG-3 and PD-L1 on the cancer progression of ccRCC patients. The mRNA expression of LAG-3 was significantly increased in cancer tissues of ccRCC compared to normal tissues (Figure 1(a)), and the expression was increased according to the stage of cancer patients (Figure 1(b)). The survival rate of high LAG-3 mRNA expression group was lower than that of the medium/low LAG-3 mRNA expression group (p = 0.049). This indicates that higher degree of the expression of LAG-3 in ccRCC patients could potentially cause poorer prognosis (Figure 1(c)). The mRNA expression of PD-L1 was also increased in cancer tissues of ccRCC compared to normal tissues (Figure 1(d)). The patients with high PD-L1 mRNA expression showed better survival rate than patients with medium and low PD-L1 mRNA expression (Figure 1(f)). However, unlike the analysis using PD-L1 mRNA expression, the protein expression of PD-L1 in ccRCC was increased in the tissues of cancer by stage compared to normal tissues (Figure 1(e) and (h)). Expression of LAG-3 and PD-L1 in ccRCC patients using UALCAN. mRNA levels of LAG-3, (a) and PD-L1, (d) in ccRCC tissues and adjacent normal renal tissues. LAG-3 (b) and PD-L1, (e) mRNA expression in normal tissues and ccRCC tissues according to tumor stage. Kaplan-Meier survival curves of patients with ccRCC according to LAG-3, (c) or PD-L1, (f) mRNA expression. PD-L1 protein expression in ccRCC tissues and normal renal tissues (g), and PD-L1 protein expression in normal tissues and ccRCC tissues differing in tumor stage, (h) Data are mean ± SE ***p < 0.001, **p < 0.01, *p < 0.05 from respective expression of normal tissue. TPM: Transcript per million.
Patient characteristics
Clinicopathologic characteristics for renal cell carcinoma patients.

LAG-3 and PD-L1 expression
Expression of LAG-3 and PD-L1 in clear cell renal cell carcinoma.

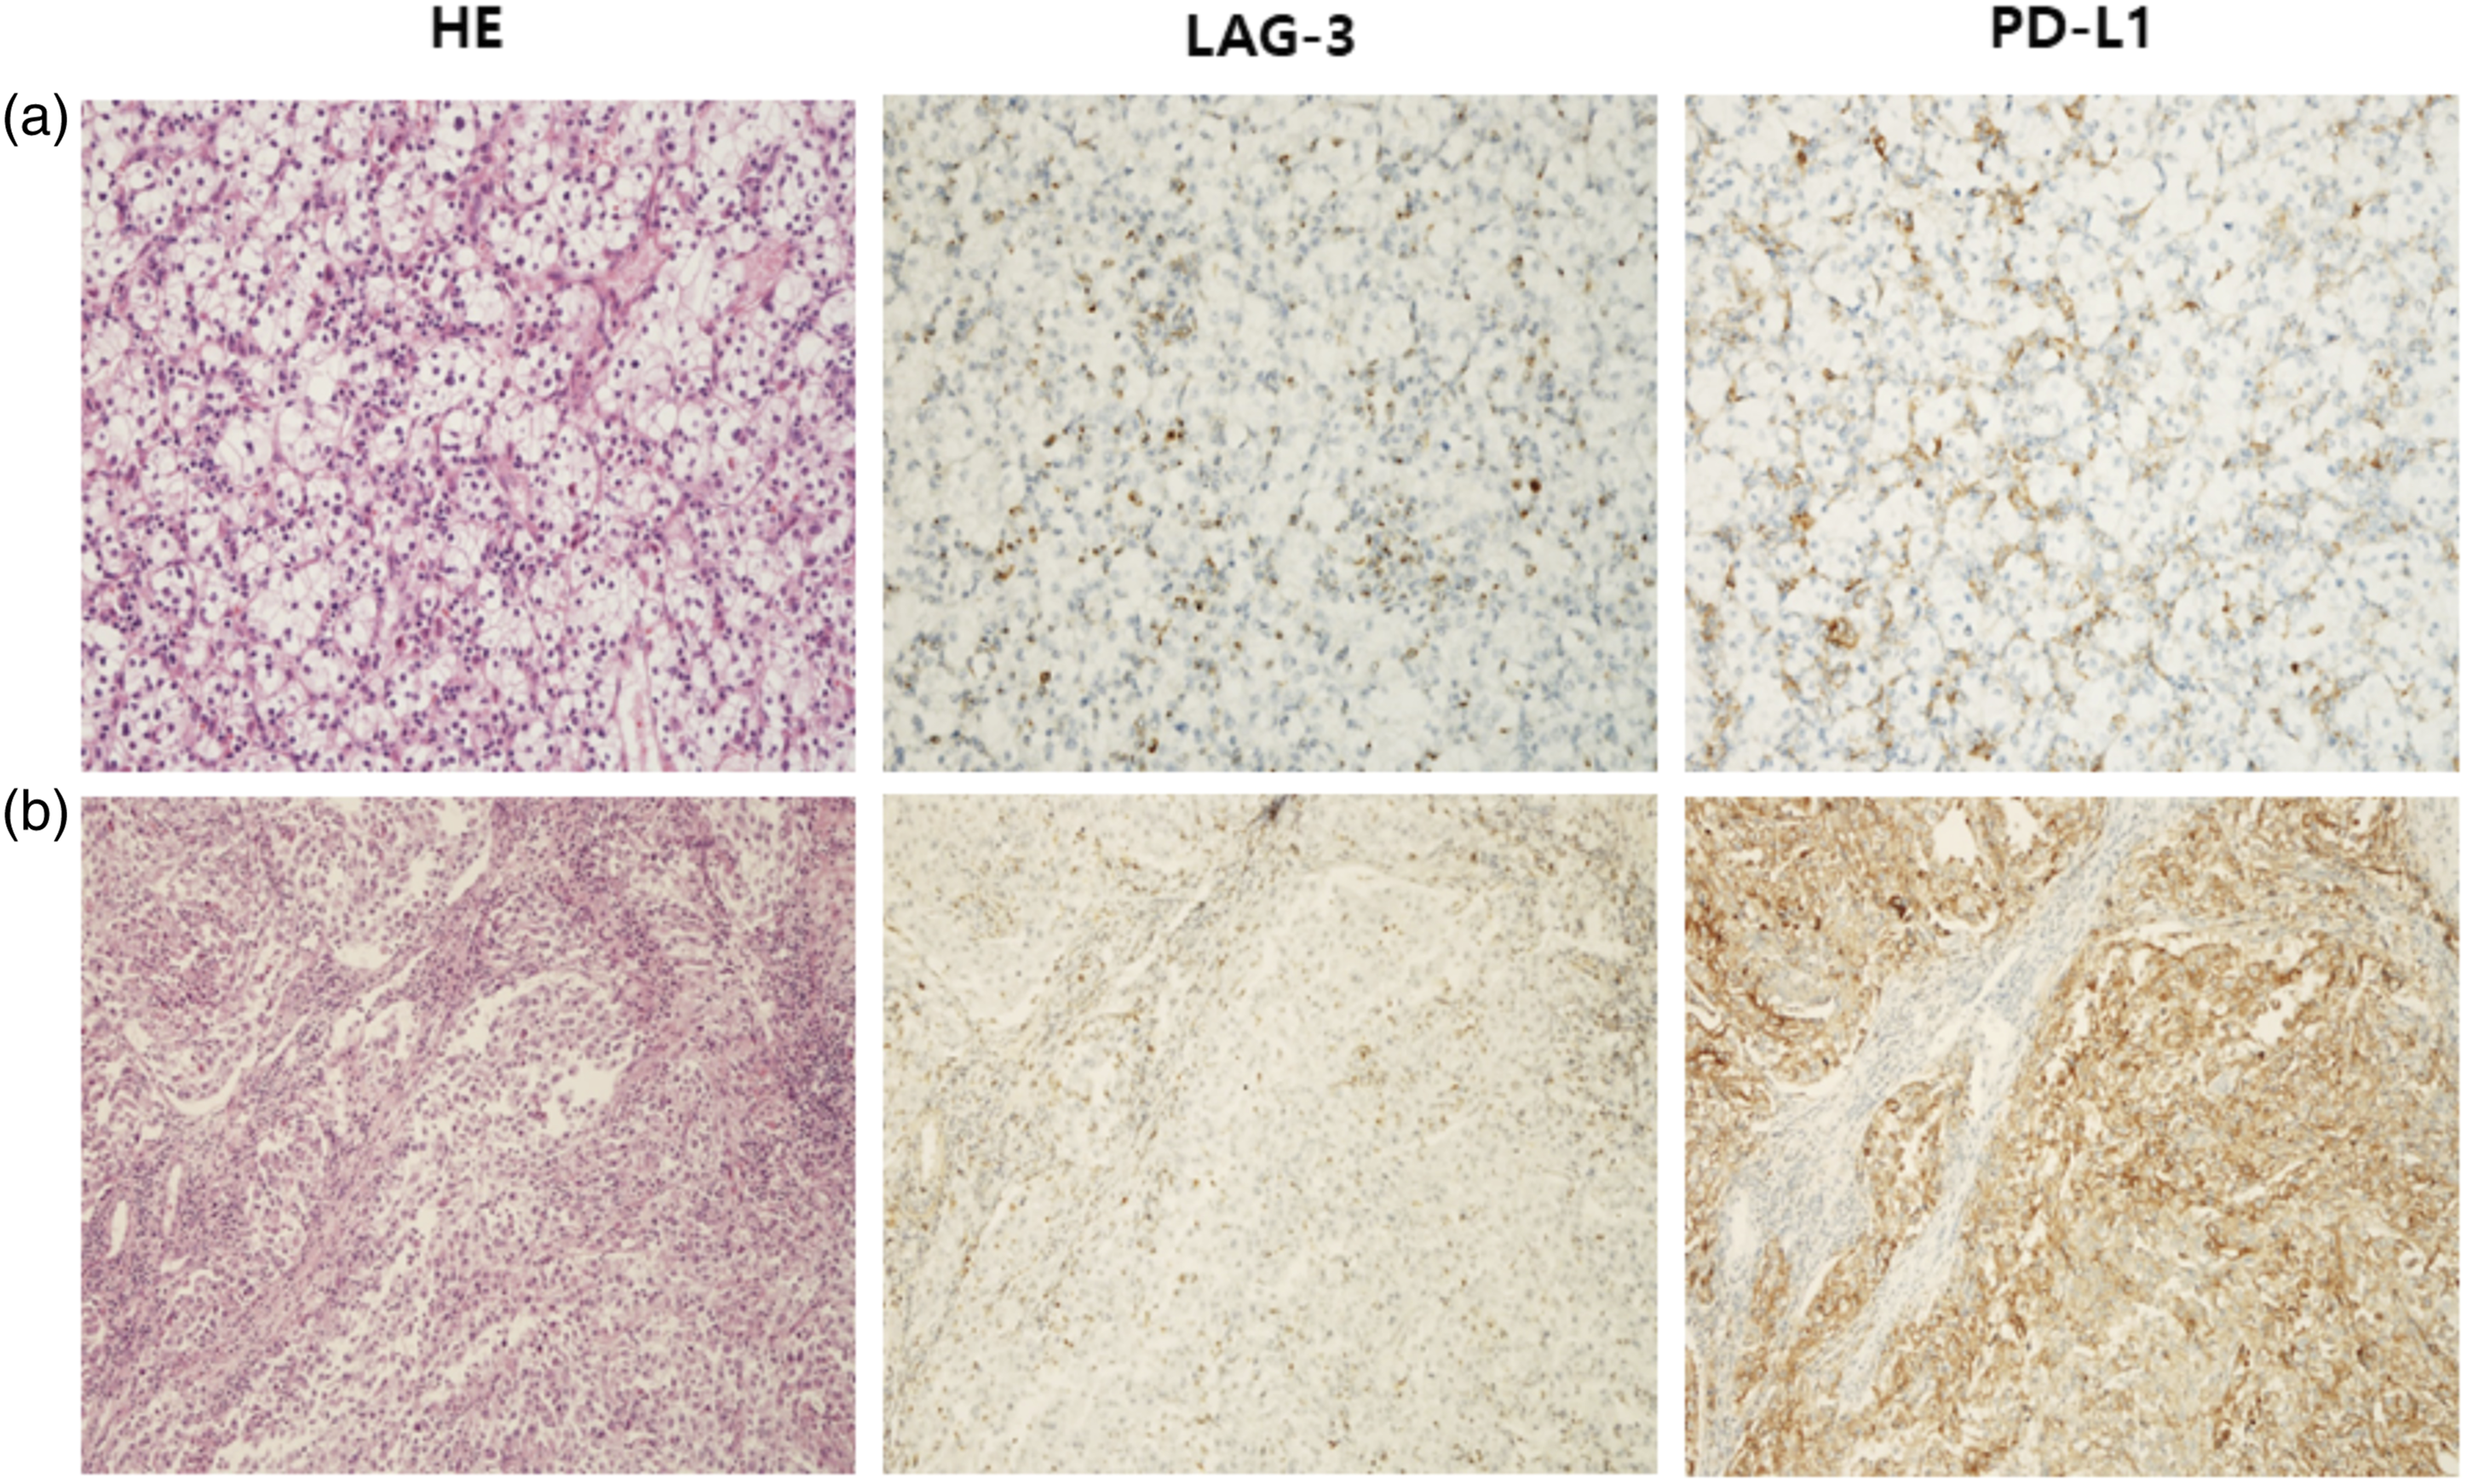
Expression of LAG-3 and PD-L1 by immunohistochemistry on serial section of same tissue. (a) LAG-3 and PD-L1 in immune cells (ICs), (b) LAG-3 in ICs and PD-L1 in tumor cells (TCs). Original magnification, ×200.
Clinicopathological significance of LAG-3 and PD-L1 expression
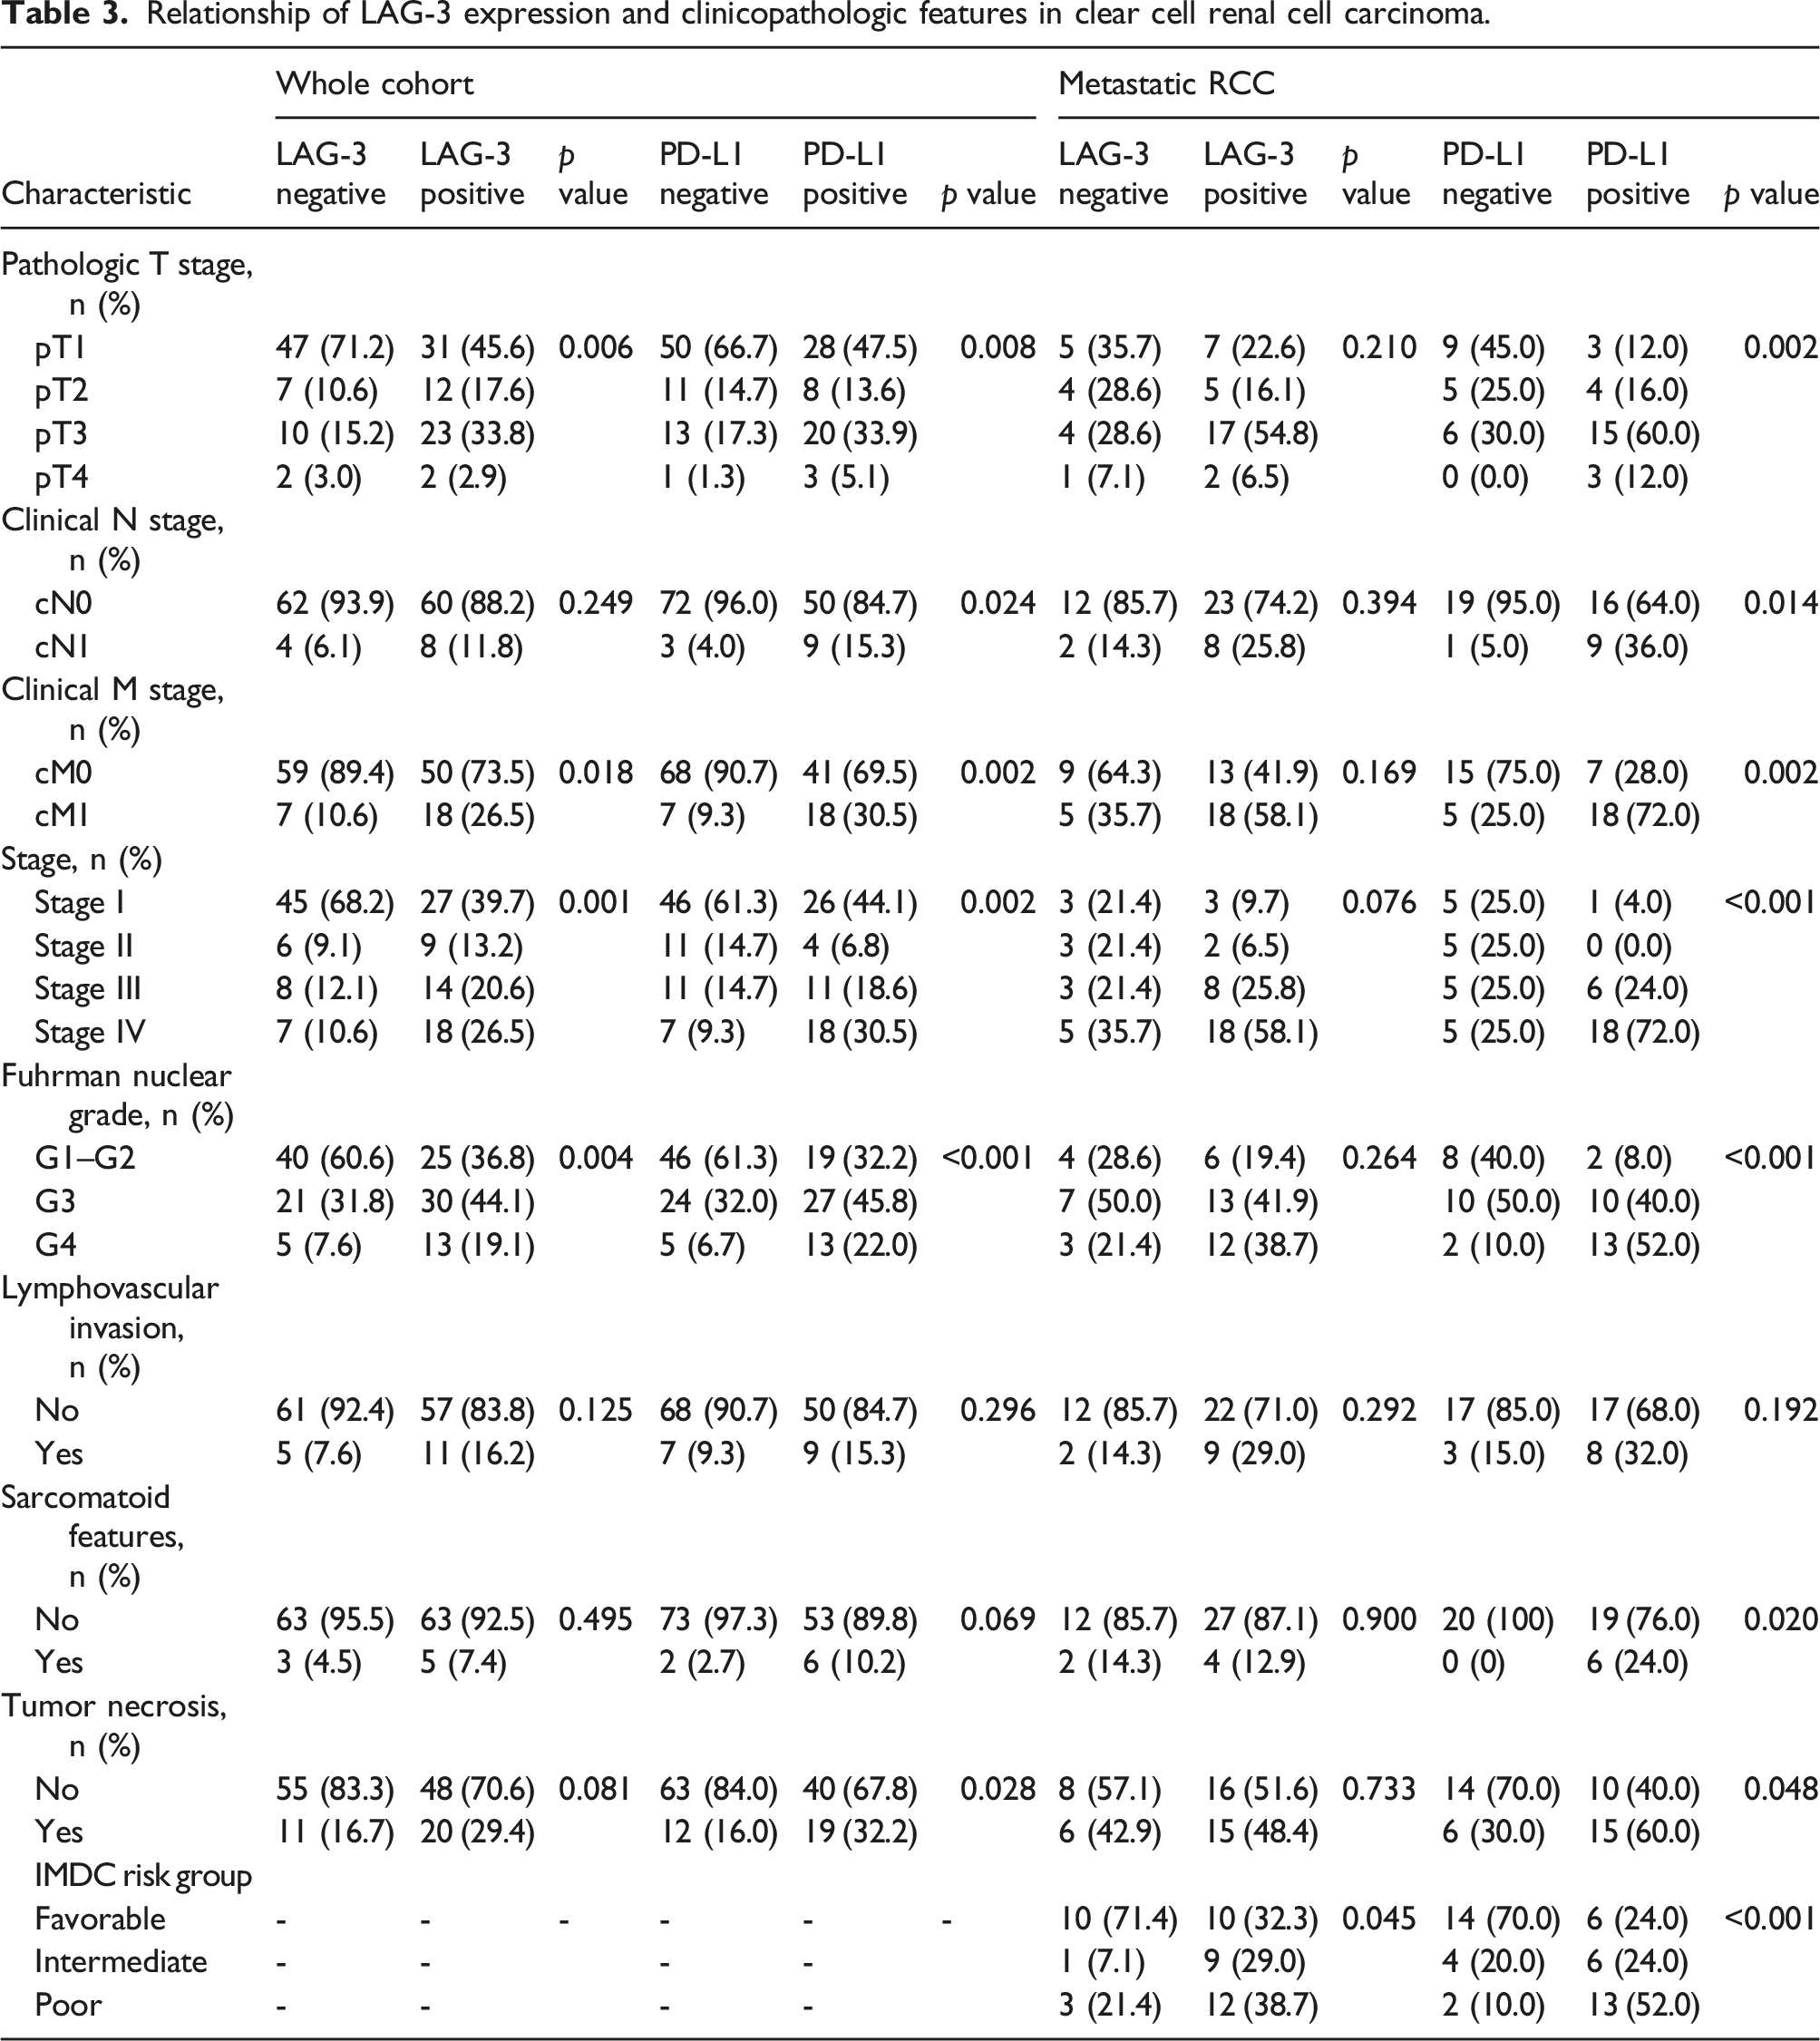
Both LAG-3⁺ RCC and PD-L1⁺ RCC presented with higher TNM stage and higher Fuhrman nuclear grade (all, p < 0.05) (Figure 3). PD-L1⁺ RCC presented with more tumor necrosis (p = 0.028) (Table 3). Both LAG-3⁺ mRCC and PD-L1⁺ mRCC presented with more IMDC intermediate and poor risk patients than LAG-3⁻ mRCC and PD-L1⁻ mRCC (all, p < 0.05). Only PD-L1⁺ mRCC showed higher TNM stage, higher Fuhrman nuclear grade, more sarcomatoid features, and more tumor necrosis (all, p < 0.05). Expression of LAG-3 by immunohistochemistry according to Fuhrman nuclear grade of clear cell renal cell carcinoma. Fuhrman grade 2 (a), grade 3 (b), grade 4 (c), sarcomatous differentiation (d). Original magnification, ×200. Relationship of LAG-3 expression and clinicopathologic features in clear cell renal cell carcinoma.
Relationship of cancer specific survival with LAG-3 and PD-L1 expressions
Patients with LAG-3⁺ RCC had significantly poorer CSS than patients with LAG-3⁻ RCC. The mean CSS was 60.4 months (95% CI: 50.9–69.9) in LAG-3⁺ RCC and 101.4 months (95% CI: 89.1–113.6) in LAG-3⁻ RCC (HR: 3.11; 95% CI: 1.53–6.30; p = 0.0016) (Figure 4(a)). Similarly, patients with PD-L1⁺ RCC showed significantly poorer CSS than patients with PD-L1⁻ RCC (mean, 63.7 months [95% CI: 53.6–73.7] vs. mean, 96.3 months [95% CI: 84.8–107.8]; HR: 2.31; 95% CI: 1.11–4.77; p = 0.0236) (Figure 4(b)). The differences between the four subgroups classified according to LAG-3 and PD-L1 expression were not statistically significant, but PD-L1⁺/LAG-3⁺ RCC showed poorer CSS than PD-L1⁻/LAG-3⁻ RCC (mean, 62.7 months [95% CI: 50.9–74.5] vs. mean, 105.4 months [95% CI: 92.5–118.4]; HR: 4.62; 95% CI: 1.80–11.87; p = 0.0014). Additionally, PD-L1⁻/LAG-3⁺ RCC showed poorer CSS than PD-L1⁻/LAG-3⁻ RCC (mean, 60.5 months [95% CI: 46.7–74.3] vs. mean, 105.4 months [95% CI: 92.5–118.4]; HR: 6.26; 95% CI: 1.93–20.26; p = 0.0022) (Figure 4(c)). Kaplan–Meier curves of cancer specific survival (CSS) in the whole cohort and metastatic renal cell carcinoma according to expression of lymphocyte-activation gen 3 (LAG-3) and programmed cell death ligand-1 (PD-L1). Cancer specific survival in patients with LAG-3+ (a) and PD-L1+ (b) were significantly lower than with LAG-3- and PD-L1- (p = 0.0016, p = 0.0236). PD-L1+/LAG-3+ group was showed significantly lower CSS than PD-L1-/LAG-3-, PD-L1-/LAG-3+ and PD-L1+/LAG-3- groups (p = 0.0014, p = 0.0022, p = 0.0474) (c) in whole cohort. In metastatic RCC group, LAG-3+ patients were significantly lower than LAG-3- patients (p=0.0369) (d) and PD-L1+ patients were showed lower CSS than PD-L1- (p = 0.0639) (e). PD-L1+/LAG-3+ mRCC group was showed significantly lower CSS than PD-L1-/LAG-3-, PD-L1-/LAG-3+ and PD-L1+/LAG-3- mRCC groups (p = 0.0389, p = 0.0149, p = 0.0401) (f).
Similar results were also observed in mRCC. The median CSS was 13.0 months (95% CI: 6.0–36.0) in LAG-3⁺ mRCC and 43.0 months (95% CI: 9.0–43.0) in LAG-3⁻ mRCC (HR: 2.30; 95% CI: 1.05–5.06; p = 0.0369) (Figure 4(d)). The median CSS was 22.5 months (95% CI: 13.0–31.9) in PD-L1⁺ mRCC and 11.0 months (95% CI: 5.0–45.0) in PD-L1⁻ mRCC (HR: 2.09; 95% CI: 0.95–4.59; p = 0.0639) (Figure 4(e)). PD-L1⁺/LAG-3⁺ mRCC showed poorer CSS than PD-L1⁻/LAG-3⁻ mRCC (median, 11.0 months [95% CI: 5.00–45.0] vs. not reached; HR: 2.91; 95% CI: 1.05–8.04; p = 0.0389). PD-L1⁻/LAG-3⁺ mRCC also showed poorer CSS than PD-L1⁻/LAG-3⁻ mRCC (median, 30.0 months [95% CI: 4.00–37.0] vs. not reached; HR: 4.74; 95% CI: 1.35–16.61; p = 0.0149) (Figure 4(f)).
Univariate and multivariate Cox proportional analysis of pathologic parameters and LAG-3, PD-L1 expressions in mRCC patients.

*Multivariate analysis (adjusted for LAG-3 or PD-L1 expression status) was performed using statistically significant variables (p<0.05) excluding LAG-3 and PD-L1 combination.
Discussion
Recently, several immune checkpoints on tumor-infiltrating ICs, which are key regulators of the immune escape of cancer cells, were studied and clinically applied to the treatment of various solid tumors. In primary ccRCC, PD-1, or PD-L1 inhibitors, which are hallmark immunological treatments, have offered a survival benefit in this decade. 16 However, even after such immunotherapy, a significant number of patients still show refractory disease or acquire resistance. 8 Therefore, demands for new therapeutic targets have emerged, of which is LAG-3 is attracting attention.
LAG-3 is mainly expressed in activated in activated CD4⁺ and CD8⁺ T cells, TCR-Natural Killer T Cells (NKT), and Regulatory T cells (Treg). 17 Furthermore, coexpression of LAG-3 and PD-1 has been reported under pathological conditions in inflammatory or tumor microenvironment. 9 Based on these studies, we performed TCGA data analysis and tissue staining to determine whether the expression of LAG-3 and PD-L1, the counter partner of PD-1, indicates a poorer prognosis in ccRCC.
Our study clearly showed that the expression of LAG-3 in ccRCC was restricted to immune cells. Similarly, Panda et al. 18 have reported that expression of the cytotoxic T-cell marker CD8A is strongly correlated with LAG-3 expression in various cancers, including RCC. However, it is necessary to confirm the correlation with other cells and analyze the reason for the decrease in the survival rate despite the correlation with CD8. Therefore, we analyzed the expression of LAG-3 and its effect on immune cells through TCGA data analysis using Timer analysis to evaluate the intracellular expression of LAG-3 and its effect on the cancer microenvironment (Supplemental Figure 1). As a result, it was confirmed that as the cancer cells' purity increased, the cancer cells had a negative correlation with the expression of LAG-3. Also, along with the our IHC results, in immune cells, except for CD4 resting memory T cells and Myeloid derived suppressor cells (MDSCs), the expression of LAG-3 and the degree of invasion of cancer tissues showed a positive correlation. In addition, as a result of analyzing the survival rate using the degree of invasion of various immune cells and the expression of LAG-3, an increase in the infiltration of CD4 activated memory T cells, NKT, and MDSCs caused a decrease in the survival rate. These results suggest that LAG-3 expressed in immune cells may be involved in regulating the invasion or the function of these three types of cells to regulate the cancer microenvironment.
Similarly, tumor-infiltrating lymphocytes isolated from patients with hepatocellular carcinoma, 19 ovarian cancer, 20 breast cancer, 14 and melanoma 21 showed significant upregulation of LAG-3. Additionally, these studies noted the function of LAG-3 as an immune checkpoint molecule, demonstrating its potential role as a target for cancer immunotherapy in various solid tumors. However, only a limited number of studies examining the role of LAG-3 in kidney cancer using tissues derived from kidney cancer patients have been reported. Giraldo et al. 22 reported the prognostic role of PD-L2 and LAG-3 in the immunomodulation of ccRCC. Zelba et al. 23 used flow cytometry analysis to reveal that PD-1 and LAG-3 were the most frequently upregulated inhibitory receptors within RCC tumor-infiltrating lymphocytes. Most recently, there was a report of poor survival in ccRCC with LAG-3 expression and LAG-3 DNA methylation. 24
In this tissue-based cohort study on surgically resected ccRCC, we found that LAG-3 expression is a prognostic indicator for poor CSS in ccRCC. Unlike previous studies reporting a simple survival analysis according to the LAG-3 expression status,22,24 our study analyzed the predictive and prognostic implication of LAG-3 in comparison with various clinicopathological features associated with aggressive tumor behavior, including pT stage, grade, lymphovascular invasion, tumor necrosis, and sarcomatoid features, in tissue samples from patients with ccRCC. In fact, LAG-3 immunopositivity on ICs in tumor tissues was associated with an advanced pT stage and higher Fuhrman nuclear grade. Systemic treatment using ICIs is the main therapeutic approach for mRCC rather than for localized RCC, which can be cured by surgical treatment. Thus, it is more relevant to evaluate the prognostic value of LAG-3 in mRCC. Accordingly, the subgroup analysis consisted of mRCC patients who were treated with targeted therapy, and we demonstrated poor survival in patients with ccRCC who had LAG-3+ primary tumors.
The major strength of our study was the examination of the correlation between LAG-3 and PD-L1 expression and the synergistic effect on ccRCC prognosis when both immune checkpoint molecules were expressed simultaneously. The expression rate of PD-L1 on TCs was similar to that of previous studies, but the expression rate of PD-L1 on ICs was relatively lower than previous reports.15,26 Differences in patient cohorts, the types of antibodies used in immunohistochemistry experiments, and the selection of cutoffs can contribute to this discrepancy. The expression of PD-L1 on TCs or ICs was positively correlated with LAG-3 expression in our study. Our results demonstrated that PD-L1⁺/LAG-3⁺ RCC patients had a poorer CSS than PD-L1⁻/LAG-3⁻ RCC patients. Furthermore, in the multivariate analysis using a subgroup consisting of mRCC patients only, PD-L1 and LAG-3 coexpression was found to be a significant predictor of poor CSS. Because LAG-3 and PD-1 synergistically regulate T-cell function to promote tumoral immune escape, 22 PD-L1⁺/LAG-3⁺ RCC patients could have poorer CSS than PD-L1⁻, LAG-3⁻, or PD-L1⁻/LAG-3⁻ RCC patients. A similar result was reported in a study comparing the relationship between LAG-3 and PD-L1 in non-small cell lung cancer. 27
Recent clinical trials have shown that high levels of PD-L1 expression are associated with a worse prognosis, but when treated with PD-1/PD-L1 inhibitors, patients with higher levels of PD-L1 expression tend to respond better to therapy. 28 However, since a significant number of patients do not respond to PD-1/PD-L1-targeting therapy regardless of their PD-1/PD-L1 expression status, alternative pathways need to be identified to overcome refractory disease or resistance to anti-PD-1/PD-L1 treatment. After blocking PD-1/PD-L1, TCs can still counteract the activity of immune checkpoints and activate additional inhibitory pathways by expressing other immune checkpoints and their ligand within the tumor immune microenvironment. 29 Indeed, LAG-3 cell-surface expression was upregulated in vitro upon PD-1 blockade using patient-derived RCC tissue. 23 Fortunately, clinical research on melanoma demonstrated that the combination of anti-LAG-3 and anti-PD-1 treatment is effective in tumors resistant to prior anti-PD-1/PD-L1 therapy. 30 In addition, recently reported phase III trial demonstrated that the combination of relatlimab, an anti-LAG-3 antibody, with anti-PD-1 treatment improved progression-free survival compared to anti-PD-1 monotherapy in patients with untreated advanced melanoma. 31 In line with these findings, our results that PD-L1⁻/LAG-3⁺ or PD-L1⁺/LAG-3⁺ RCC and mRCC had significantly poorer CSS than PD-L1⁻/LAG-3⁻ RCC and mRCC suggest that anti-LAG-3 monotherapy or a combination of anti-LAG-3 and anti-PD-1/PD-L1 treatment could be beneficial for LAG-3⁺ RCC patients who are refractory or resistant to anti-PD-1/PD-L1 treatment.
Besides LAG-3, T cell immunoreceptor with Ig and ITIM domains (TIGIT) is the next wave of co-inhibitory receptor target and is being explored in various stages of clinical trials in advanced solid tumors. TIGIT blockade restores antitumor immune activity by augmenting T-cell and NK cell function, and suppressing Treg-mediated immune suppression. 32 In recent phase II clinical trial, the combination of tiragolumab, anti-TGIT antibody, with PD-L1 has shown promising outcomes in the first-line setting for in advanced NSCLC. 33 Similar to LAG-3, TIGIT, and PD-1/PD-L1 blockade have additive activity. Therefore, it is expected that LAG-3 and TIGIT will serve as co-inhibitory anti-tumor target together with anti-PD-1/PD-L1 treatment in ongoing clinical trials regarding advanced solid tumors including RCC.
Our study had several limitations. First, although we identified the association of LAG-3 expression in ccRCC with known risk factors for survival, some clinicopathological factors were not statistically significant because of our study’s retrospective design and relatively small number sample size. Furthermore, the calculation and justification of the sample size were not done in this study. Therefore, additional prospective studies with a large patient cohort are necessary to confirm our results. Second, the TMA of the primary tumor tissue cannot completely reflect the immune markers analyzed in the tumor microenvironment. Additionally, although we showed LAG-3 and PD-L1 expression on ICs, we could not evaluate the IC type-specific expression of either checkpoint molecule. Third, the evaluation of immunohistochemical stain was performed by only one pathologist in this study. Each microscopic scoring result was examined at least three times to avoid intrapersonal bias. Finally, despite recent advances in ICIs in the treatment of mRCC, our study only includes a survival analysis of mRCC patients who were treated with targeted therapy. However, because previous studies show the poor prognostic role of PD-L1 expression in mRCC patients who were treated with targeted therapy, our results of the analysis of the prognostic role of LAG-3 in ccRCC and mRCC could be clinically relevant.34,35 In the near future, the results of ongoing clinical trials using an anti-LAG-3antibody, such as relatlimab, will be used to determine the prognostic role of LAG-3 for various solid tumors, including RCC. 11
Conclusion
We demonstrated that LAG-3 and PD-L1 expression in ccRCC is positively correlated with adverse clinicopathological features. Additionally, the coexpression of LAG-3 and PD-L1 predicts poor clinical outcomes in ccRCC. These findings provide a scientific rationale for LAG-3 blockade in combination with PD-1/PD-L1 blockade as a potential therapeutic approach for ccRCC. Data from ongoing clinical trials are required to validate these hypotheses.
Supplemental Material
Supplemental Material - Coexpression of lymphocyte-activation gene 3 and programmed death ligand-1 in tumor infiltrating immune cells predicts worse outcome in renal cell carcinoma
Supplemental Material for Coexpression of lymphocyte-activation gene 3 and programmed death ligand-1 in tumor infiltrating immune cells predicts worse outcome in renal cell carcinoma by Chan Ho Lee, Soo Jin Jung, Won Ik Seo, Jae Il Chung, Dae Sim Lee, Dae Hoon Jeong, Youkyoung Jeon and Inhak Choi in International Journal of Immunopathology and Pharmacology
Footnotes
Acknowledgements
Authors’ contributions
Chan ho Lee, Soo Jin Jung, and Inhak Choi designed the study, performed statistical analysis and drafted the article. Youkyoung Jeon helped to download TCGA data and performed analysis. Won Ik Seo, Jae Il Chung, Dae Hoon Jeong, and Dae Sim Lee performed data collection and analysis. All authors have commented on previous versions of manuscript and approved the final manuscript.
Declaration of conflicting interests
The author(s) declared no potential conflicts of interest with respect to the research, authorship, and/or publication of this article.
Funding
The author(s) disclosed receipt of the following financial support for the research, authorship, and/or publication of this article: This work was supported by the National Research Foundation of Korea (NRF) grant funded by the Korea government (MSIT; No. 2020R1F1A1071003).
Ethics approval
This study was approved by the Busan Paik Hospital Institutional Review Board (IRB No. 20–0121) and was in compliance with ethical guidelines according to the Declaration of Helsinki.
Informed consent
Written informed consent was obtained from all subjects before the study.
Supplemental Material
Supplemental material for this article is available online.
References
Supplementary Material
Please find the following supplemental material available below.
For Open Access articles published under a Creative Commons License, all supplemental material carries the same license as the article it is associated with.
For non-Open Access articles published, all supplemental material carries a non-exclusive license, and permission requests for re-use of supplemental material or any part of supplemental material shall be sent directly to the copyright owner as specified in the copyright notice associated with the article.