
Abstract
Eosinophilic chronic rhinosinusitis (ECRS) is a chronic inflammatory disease characterized by prominent eosinophilic infiltration along with a T-helper-2 (Th2) response. It has been well documented that signal transducer and activator of transcription 6 (STAT6) is a nuclear transcription factor that mediates Th2-type immunity and is implicatory of STAT1 and STAT3 in the pathogenesis of allergic airway diseases. However, little is known about the association between STATs and ECRS. Here, we explored the relationship between STAT1, STAT3, and/or STAT6 and eosinophilic inflammation accompanied by Th2-type immunity in a mouse model of ECRS. An ovalbumin (OVA)-staphylococcal enterotoxin B (SEB)-induced ECRS murine model was first established. The mucosal histological alterations were determined using hematoxylin and eosin staining. The number of eosinophils in peripheral blood was measured using a blood cell analyzer. The cytokine (IL-4, IL-5, IL17 A and IFN-γ) expression levels in the sinonasal mucosa and total and OVA-specific IgE from serum were measured using ELISA. Then, the protein levels of STAT1, STAT3, STAT6, phosphorylated STAT1 (p-STAT1), p-STAT3, p-STAT6, T-box expressed in T-cells (T-bet), GATA binding protein 3 (GATA-3), and retinoic acid receptor-related orphan receptor γ (RORγt) in the sinonasal mucosa were examined by immunohistochemical staining or Western blotting. Local administration of OVA combined with SEB (OVA + SEB) induced multiple polyp-like lesions, accompanied by prominent eosinophilic infiltration in the sinonasal mucosa. The OVA- and OVA+SEB-treated groups showed significantly higher eosinophil counts from peripheral blood and total and OVA-specific IgE levels from serum than those in the PBS- and SEB-treated groups. The levels of p-STAT6 were markedly increased by OVA + SEB exposure, as well as GATA-3, IL-4, and IL-5, but did not affect STAT6, p-STAT1, p-STAT3, T-bet, RORγt, IFN-γ, or IL-17A. Furthermore, an eosinophil count in the sinonasal mucosa showed a positive correlation with the level of p-STAT6 in the ECRS mouse model. Signal transducer and activator of transcription 6 signaling could be activated in the OVA+SEB-induced ECRS model and might be a crucial signal transducer in the development of Th2-skewed ECRS.
Keywords
Introduction
Eosinophilic chronic rhinosinusitis (ECRS) is a subgroup of chronic rhinosinusitis with nasal polyps (CRSwNP) and is characterized by eosinophil-dominant inflammatory cell infiltration and overproduction of multiple proinflammatory type 2 helper T-cell (Th2)-related cytokines. 1 In Europe and America, prominent eosinophilic infiltration is frequently observed in 60–90% of CRSwNP patients. 2 Emerging evidence has demonstrated that the incidence of ECRS has persistently increased in patients with CRSwNP in East Asian countries.3,4 Patients with ECRS generally present with loss of smells, chronic nasal congestion, thick mucus production, and intermittent acute exacerbations of secondary infections, which significantly impair the quality of life of these patients. Although patients with ECRS are sensitive to glucocorticoid therapy, it is difficult to maintain long-term efficacy after glucocorticoids are discontinued. Moreover, patients with nasal polyps are prone to eosinophilic infiltration and exhibit a strong tendency for recurrence.5,6 In addition, these patients are more likely to have complications involving asthma. 7 Currently, the poor therapeutic effect of ECRS places a considerable economic burden on patients. 8 Although previous studies have demonstrated that ECRS is associated with staphylococcal enterotoxins (SEs), heredity, fibrin, periostin, and protease inhibitors, the mechanisms of eosinophilic inflammation and proliferation are poorly understood.1,4
As with allergic rhinitis (AR), ECRS is considered to occur in Th2-dominant environments. 9 Signal transducer and activator of transcription 6 (STAT6) is a transcription regulator and is essential for the induction of Th2-type immunity.10,11 Signal transducer and activator of transcription 6 regulates Th2 cell differentiation and mediates IL-4/IL-13-induced eotaxin (CCL11) production, resulting in eosinophilic infiltration.12,13 Recently, the STAT6 signaling pathway has gained increasing attention in the field of nasal allergic diseases. It was found that phosphorylated STAT6 (p-STAT6) was overexpressed in the sinonasal tissues of an eosinophilic CRSwNP mouse model. 14 In addition, depletion of STAT6 ameliorated allergic symptoms in AR mice. 15 Similarly, intranasal application of STAT6-siRNA suppressed eosinophil infiltration and alleviated the Th2 immune response in a mouse model of AR and asthma.16,17 Although these studies only emphasized the role of STAT6 in Th2 responses, some other studies indicated that STAT1 and/or STAT3 play important roles in antigen-induced airway inflammation and hyperresponsiveness.18–20 In addition, induction by topical antigen failed to result in inflammation and hyperresponsiveness of nasal airways in STAT1-deficient mice. 21 Wang et al. 22 reported that in addition to STAT6, STAT3 plays an important role in the development of AR.
However, these pioneering studies focused mainly on the role of STATs in the pathogenesis of AR and asthma, and little is known about the association between STATs and ECRS. In this manuscript, we investigated the relationship between STATs (STAT1, STAT3, and STAT6) and eosinophilic inflammation of the sinonasal mucosa using a murine model induced by ovalbumin (OVA)-staphylococcal enterotoxin B (SEB).
Materials and methods
Experimental animals and reagents
The current study was an experimental design and was conducted from April to August 2021 following the principles of randomization, control and repetition. We used 46 female BALB/c mice (6 weeks old, 20–30 g) in the study. All mice had patent nasal passages and were identified as having no nasal symptoms or signs of infection. The animals were acclimated under SPF conditions. Water and standard food were provided throughout the experiment. All mouse experimental procedures were conducted under institutional animal care and complied with the related ethical regulations of China. This study was approved by the Committee on the Use and Care of Animals at Soochow University. Staphylococcal enterotoxin B was purchased from Toxin Technology Inc. (Sarasota, FL, USA). Ovalbumin (OVA: grade V) was acquired from Sigma (St. Louis, MO, USA).
Animal model and experimental protocols
Forty-six mice were randomly divided into the following groups: (1) the PBS-treated group (negative control group, Group A, n = 10) was challenged with phosphate buffered saline (PBS); (2) the SEB-treated group (Group B, n = 12) was challenged with SEB; (3) the OVA-treated group (Group C, n = 12) was challenged with OVA; and (4) the OVA+SEB-treated group (Group D, n = 12) was treated with OVA+SEB. Eosinophilic inflammation of the sinonasal mucosa was induced according to previous protocols with minor modifications (Figure 1).
23
Experimental protocol for the induction of ECRS challenged with OVA plus SEB in a mouse model. OVA or PBS (short arrows) was challenged three times a week. SEB (long arrows) was challenged one time a week. PBS = phosphate buffered saline; Alum = aluminum hydroxide gel; OVA = ovalbumin; SEB = staphylococcal enterotoxin B; i.p.: intraperitoneal injection; i.n.: intranasal instillation.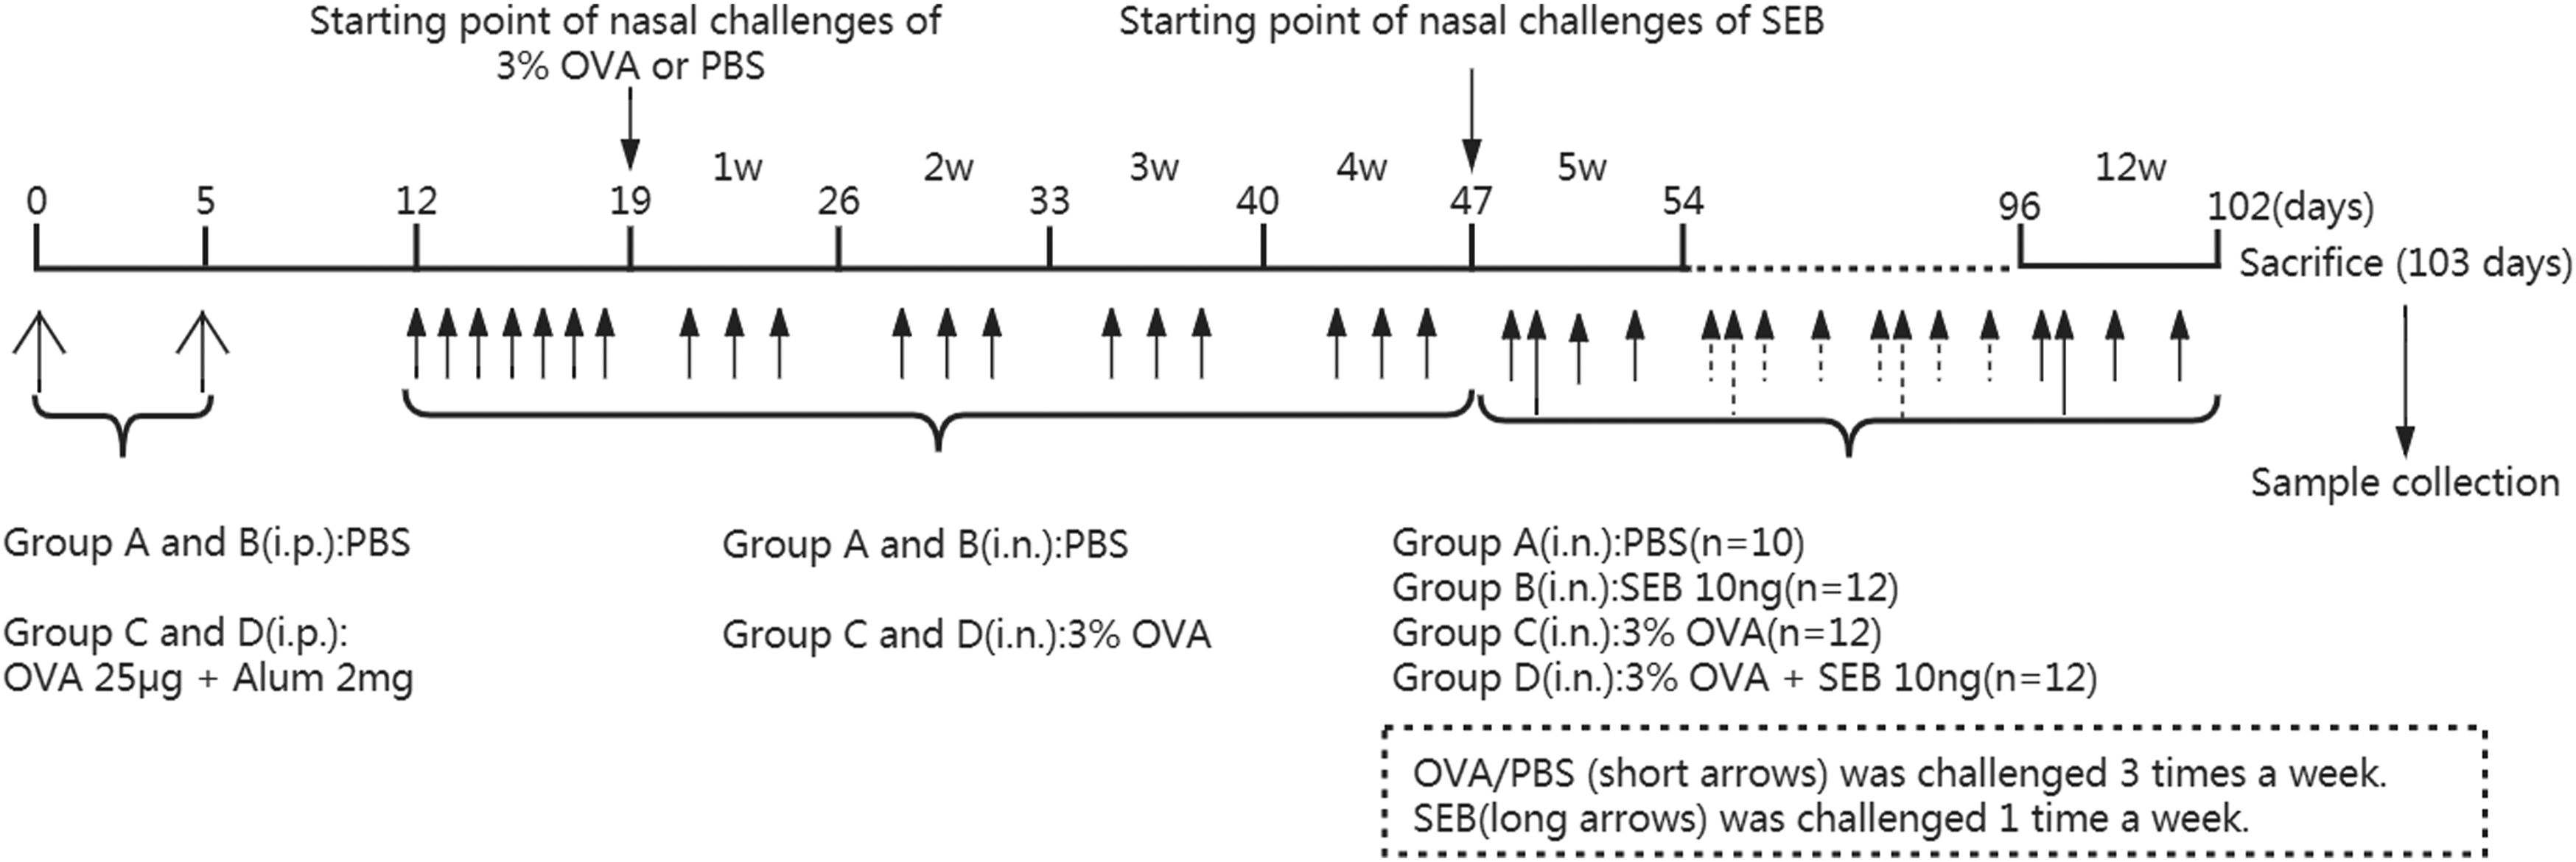
In Group A, PBS was injected intraperitoneally (i.p.) and subsequently instilled intranasally (i.n.). The mice in Group D were systemically sensitized with 25 μg of OVA dissolved in 200 μL of PBS in the presence of 2 mg of aluminum hydroxide gel as an adjuvant by intraperitoneal injection on Days 0 and 5. One week after the second intraperitoneal injection, the mice were challenged intranasally with 3% OVA diluted in 40 µL of PBS daily for 1 week. Thereafter, continual intranasal challenge was maintained in the same fashion three times per week for four consecutive weeks. Finally, 3% OVA diluted in 40 μL of PBS was applied intranasally at the same intervals for eight consecutive weeks. During that period, 10 ng SEB diluted in 20 μL PBS was challenged intranasally once a week. In Group B, the treatment in the first 46 days was the same as that in Group A, and 10 ng SEB diluted in 20 μL PBS was challenged intranasally once a week during the last 8 weeks. In Group C, the other treatments were the same as those in Group D except that SEB was not added during the last 8 weeks. Twenty-four hours after the final intranasal instillation with PBS, OVA, and/or SEB, the mice were sacrificed and decapitated. Half of the randomly selected mice in each group were prepared for histologic examination. The sinonasal mucosa in the remaining half was harvested for enzyme-linked immunosorbent assays The photograph demonstrates the nasal septum, the maxillary and ethmoid sinuses, and the olfactory region. The sinonasal mucosa of the ethmoid sinuses and its affiliated turbinates were harvested (hematoxylin and eosin staining, ×20).
Measurement of blood eosinophils and the related IgE levels
Measurement of blood eosinophils and leucocytes
The mice were anesthetized and enucleated before sacrifice, and blood was collected from the orbital venous plexus. The peripheral blood of half of the mice in each group was obtained and immediately sent to the laboratory for the detection of leukocytes and eosinophils. Another blood sample was collected from the other half of the animals in each group for IgE detection. Fresh blood samples were immediately sent to the laboratory for detection with a blood cell analyzer (Mindray, BC-6800) (Shenzhen Mindray Bio-Medical Electronics Co., Ltd.).
Measurement of the total and OVA-specific IgE
After the peripheral blood was centrifuged, serum samples were collected and stored at −70°C to measure the IgE. Quantitative assessments of total and OVA-specific IgE in serum were performed using ELISA kits purchased from Abcam Ltd. (Cambridge, UK) (ab157718) and Cusabio Biotech Co., Ltd. (Wuhan, China) (CSB-E08914 m), respectively. The sensitivities of the total IgE and OVA-specific IgE were 1.83 ng/mL and 3.20 ng/mL, respectively. The expression levels of the total and OVA-specific IgE in mouse serum were detected according to the operation steps of the ELISA kits.
Histological analyses
While the mice were sacrificed, the head skin and soft tissue were cut off, the whole nasal cavity and paranasal sinuses were excised vertically along the posterior margin of the orbit, and the bone integrity was maintained during the resection. The removed specimens were fixed immediately in 2% paraformaldehyde for 48 h and decalcified in 10% ethylene diamine tetracetic acid for three to 4 weeks until complete decalcification. The tissues were dehydrated and degreased and then embedded in paraffin following standard procedures. The embedded tissue was cut into serial 4-μm-thick coronal sections. The sections were stained with hematoxylin and eosin (H&E) to examine polyp-like lesions and eosinophilic inflammation. The true maxillary sinus, lateral wall of the nasal cavity, and ethmoid labyrinths were identified according to the previously reported anatomy of the nasal cavity and paranasal sinuses in mice. Consistent with previous studies,23,24 we also identified the maxillary and ethmoid sinuses, which are illustrated in Figure 2. Two consecutive coronal sections that were similar to the sinus cavity were chosen for evaluation. Polyp-like lesions were characterized by a prominent mucosal bulge that was accompanied by diffuse mucosal swelling and eosinophilic infiltration. The number of polyp-like lesions and eosinophils were analyzed by two independent evaluators in a high-power field (HPF, 400× magnification) (First, evaluators observed the overall condition of the mucosa at a magnification of ×200). The number of eosinophils was counted in five areas of sinonasal mucosal sections under HPF in each mouse. The eosinophil count results are expressed as cells per HPF. Polyp-like lesions were counted microscopically and expressed as a total number in each mouse. In addition, the length of the polyp protrusion cavity was calculated. To obviate processing errors, two consecutive slides were reviewed.
Measurement of inflammatory cytokines
The expression of cytokines in the sinonasal mucosa was detected by ELISA. Fresh sinonasal mucosal tissues were harvested and treated as previously reported. 25 Briefly, sinonasal mucosa tissues were homogenized mechanically and resuspended in 500 μL of PBS. The filtrates were then centrifuged at 12,000g for 5 min at 4°C after being filtered using a 70-μm cell strainer. Supernatants were collected and then stored at −70°C. The levels of interleukin (IL)-4, IL-5, IL-17A, and interferon-γ (IFN-γ) in the supernatants were determined using mouse cytokine-specific ELISA kits (MultiSciences (Lianke) Biotech Co., Ltd., Hangzhou, China) according to the operation steps of the ELISA kits. All samples were tested repeatedly.
Immunohistochemistry
Phosphorylated STAT1 (p-STAT1), p-STAT3, and p-STAT6 expression levels were assessed by immunohistochemistry using a previously reported method. 26 Briefly, 5-μm-thick paraffin-embedded coronal sections were deparaffinized in xylene and rehydrated with ethanol. All sections were blocked with 1% normal goat serum after being washed with PBS and incubated for 12 h at 4°C with primary polyclonal antibodies against p-STAT1 (ET1611-20) (Huabio Ltd., Hangzhou, China), p-STAT3 (ET1607-39) (Huabio Ltd., Hangzhou, China), and p-STAT6 (ab28829) (Abcam Ltd., Cambridge, UK) according to the manufacturer’s instructions. The sections were washed with PBS, incubated with a secondary antibody conjugated to HRP and developed with an EnVision staining kit (Dako, Glostrup, Denmark). Finally, the sections were counterstained with hematoxylin (Sigma) after diaminobenzidine showed a color and were mounted on coverslips with a drop of glycerol gelatin (Merck, Amsterdam, The Netherlands) in preparation for microscopic analyses.
The sections were analyzed by microscopy in high-power fields (HPFs, 400× magnification) blindly by two examiners in the case of unknown animal grouping. Positive cells at the transition zone of the olfactory and respiratory epithelium were counted in five HPFs of five randomly selected sections per animal using the NIS-Elements BR 3.0 system (Nikon Eclipse, Tokyo, Japan), and the average number of positive cells per HPF was used for statistical analysis.
Western blotting
Immunoblot analysis was performed as previously described. 27 In brief, proteins were obtained from sinonasal mucosal tissues by homogenization, centrifugation and supernatant collection. The protein samples were electrophoretically separated on a 7.5% sodium dodecyl sulfate–polyacrylamide gel and then transferred to a polyvinylidene fluoride (PVDF) membrane. After blocking with 1% blockace (Dainippon Sumitomo Pharma, Osaka, Japan), PVDF membranes were incubated with each primary rabbit polyclonal antibody for anti-STAT1 (10,144-2-AP) (1:1000 dilution; Proteintech Group Inc., Chicago, USA), anti-phospho-STAT1 (ET1611-20) (1:1000 dilution; Huabio Ltd., Hangzhou, China), anti-STAT3 (10,253-2-AP) (1:4000 dilution; Proteintech Group Inc., Chicago, USA), anti-phospho-STAT3 (ET1607-39) (1:2000 dilution; Huabio Ltd., Hangzhou, China), anti-STAT6 (51,073-1-AP) (1:1000 dilution; Proteintech Group Inc., Chicago, USA), anti-phospho-STAT6 (ab28829) (1:1000 dilution; Abcam Ltd., Cambridge, UK), T-bet (ab91109) (1:1000 dilution; Abcam Ltd., Cambridge, UK), GATA-3 (ab106625) (1:1000 dilution; Abcam Ltd., Cambridge, UK), and RORγt (ER1916-09) (1:2000 dilution; Huabio Ltd., Hangzhou, China). Then, the membrane was incubated with secondary antibodies (HA1001) (horseradish peroxidase-conjugated goat anti-rabbit immunoglobulin G, 1:40 000; Huabio Ltd., Hangzhou, China), processed using enhanced chemiluminescence (Pierce, Rockford, IL, U.S.A.) and analyzed by a densitometry system. A GAPDH antibody (A00227-1) (1:2000 dilution; Bosterbio Ltd., Wuhan, China) was used to demonstrate equal protein loading in each lane.
Statistical analysis
All statistical analyses were conducted using SPSS software (ver. 18.0; SPSS Inc., Chicago, USA). Graphs were generated using GraphPad Prism software (ver. 5.0; GraphPad Software, Inc., San Diego, CA). Data are expressed as the mean ± standard error of the mean (SEM). Because the data in this experiment did not conform to a normal distribution and variance was not uniform, the Kruskal–Wallis test was used to compare the differences among the groups. If analysis of variance showed significant differences between groups, the Mann–Whitney U test was then used to identify the groups with differences. The Spearman rank correlation test was used to determine variable relationships. A p value < 0.05 was considered statistically significant.
Results
Examination of blood eosinophils and related IgE levels
There was no significant difference in leucocyte count among the PBS-, SEB-, OVA-, and OVA+SEB-treated groups. However, a significantly greater number of blood eosinophils was observed in the OVA- and OVA + SEB-treated groups than in the PBS- and SEB-treated groups (p < 0.05). Although this difference was not statistically significant between the OVA- and OVA + SEB-treated groups, there was a trend toward a higher eosinophil count in the mice treated with OVA + SEB. Similarly, the percentage of blood eosinophils in the OVA- and OVA + SEB-treated groups was higher than that in the PBS- and SEB-treated groups (p < 0.05). In addition, all of the OVA-treated groups (Groups C and D) showed significantly higher total and OVA-specific IgE levels from serum than that of the PBS- and SEB-treated groups (p < 0.05). However, there was no significant difference in terms of the total and OVA-specific IgE levels between the OVA- and OVA + SEB-treated groups (Figure 3). The numbers of blood leucocytes and eosinophils were measured by a blood cell analyzer. Serum total and ovalbumin (OVA)-specific IgE levels were measured by enzyme-linked immunosorbent assay (ELISA). (a) Blood leucocyte count; (b) Blood eosinophil count; (c) Percentage of blood eosinophils; (d) Serum total IgE; (e) Serum OVA-specific IgE. The number of blood eosinophils, the percentage of blood eosinophils, and the levels of serum total and OVA-specific IgE were markedly elevated in Groups C and D compared with Groups A and B (*p < 0.05). However, no difference in blood leucocyte count existed among Groups A, B, C, and D. PBS indicates Group A; SEB indicates Group B; OVA indicates Group C; SEB + OVA indicates Group D.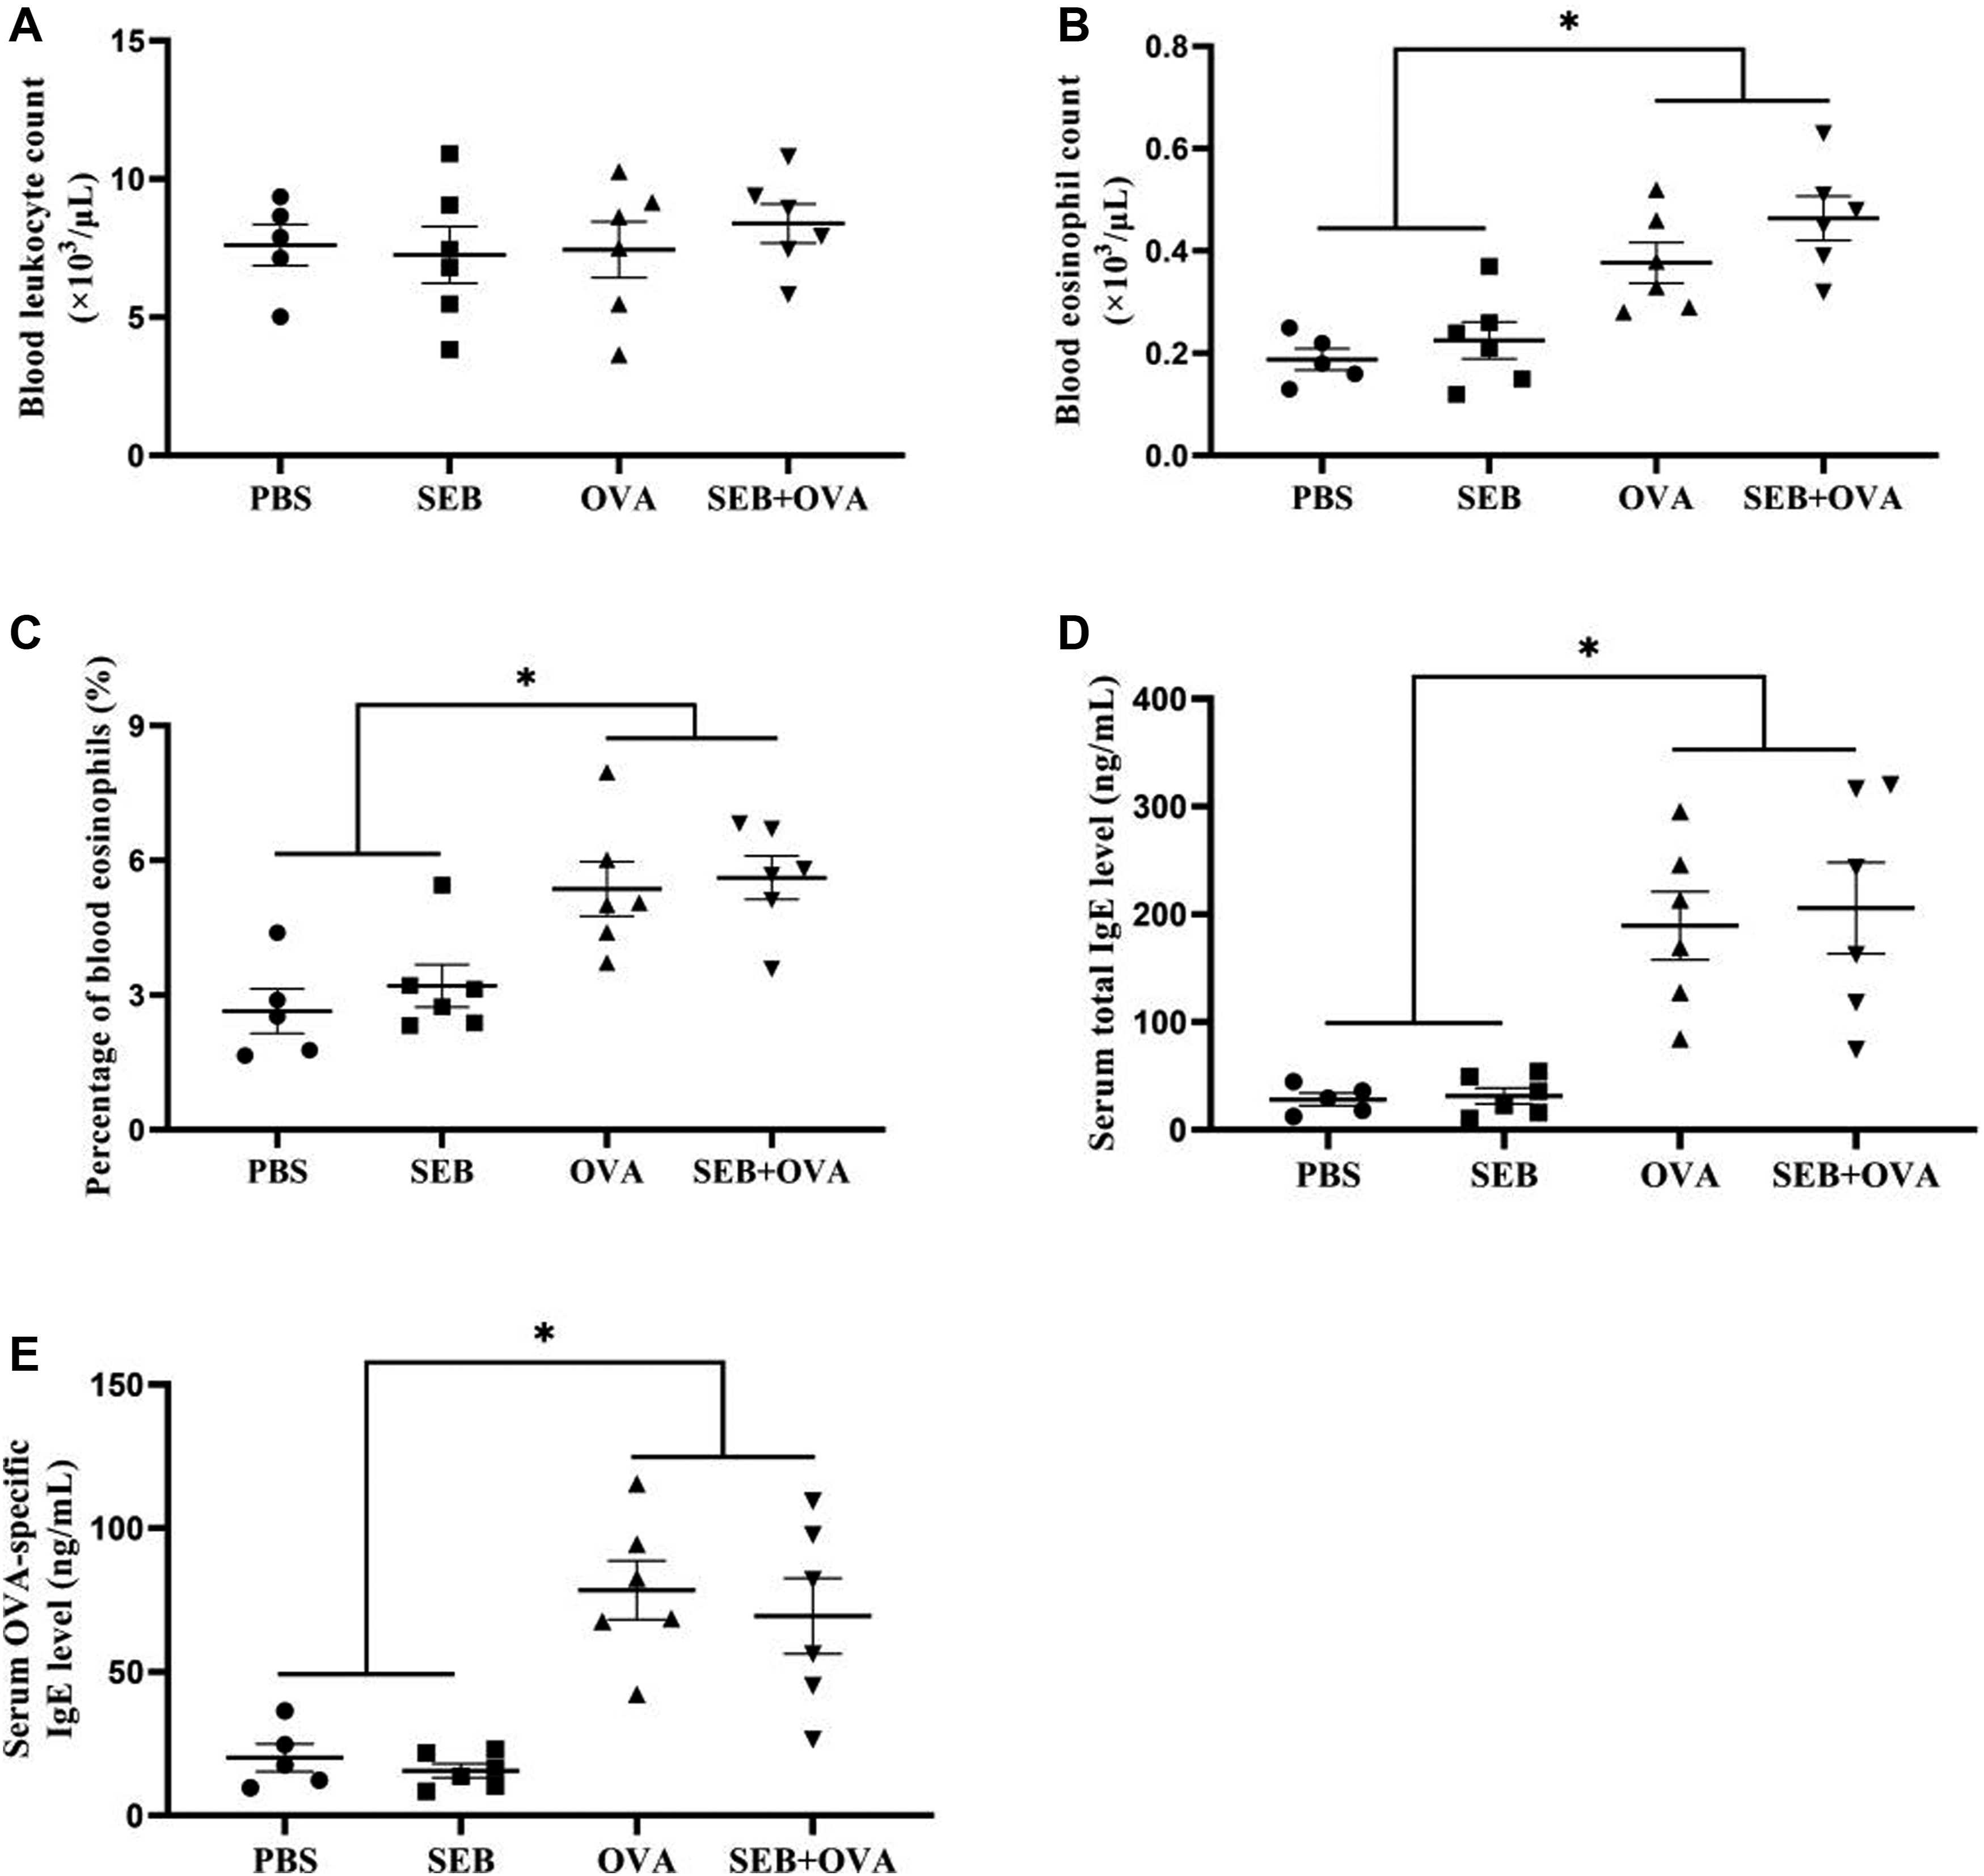
Histological findings
To evaluate the ECRS murine model induced by OVA-SEB, histological analysis was first performed. For polyp-like lesion analysis, we found that a total of fourteen polyp-like lesions were observed in the six mice induced with OVA+SEB, while no polyp-like lesions were observed in the other three groups treated with PBS, SEB and OVA, the difference was statistically significant (p < 0.05) (Figure 4(a) and (c)). The fourteen polyp-like lesions in the six mice induced with OVA + SEB protruding into cavity had lengths of approximately 50 μm, 55 μm, 64 μm, 70 μm, 76 μm, 80 μm, 92 μm, 95 μm, 106 μm, 120 μm, 138 μm, 164 μm, 175 μm, and 190 μm. For eosinophilic infiltration analysis, the results showed that mice treated with PBS exhibited no definite infiltration of eosinophils. Conversely, scattered eosinophils were observed in the sinonasal mucosa after nasal SEB induction, while eosinophils were obviously observed after OVA induction. There was a significant difference in the infiltration of eosinophils between the SEB and OVA-treated groups (p < 0.01). In addition, the SEB + OVA-treated group recruited more eosinophils into the lamina propria of the sinonasal mucosa than that of the OVA-treated group (p < 0.01) (Figure 4(a) and (b)). The polyp-like lesions were mainly located at the transition zone between the olfactory and respiratory epithelia in the nasal cavity, and the degree of eosinophilic inflammation was most severe in the transitional zone of the olfactory and respiratory epithelia. To visualize polyp-like lesions and eosinophilic infiltration in the nasal cavity clearly, magnified histological images at the transition zone were noted (Figure 5). In addition, we observed a thinned olfactory epithelium and decreased epithelial cells in the olfactory mucosa in the upper part of the nasal septum near the roof of the nasal cavity in the OVA + SEB-treated group compared to the PBS-treated group (Figure 6). (a) Changes in the histological parameters (eosinophilic infiltration and polyp-like lesions). A large number of eosinophils were observed in the sinonasal mucosa in Groups C and D, especially in Group D. Polyp-like lesions were observed only in Group D. Polyp-like lesions were characterized by a prominent mucosal bulge that was accompanied by diffuse mucosal swelling and eosinophilic infiltration. For eosinophilic infiltration and polyp-like lesions in the OVA + SEB-treated group, Figure D2 shows magnified images of the black border in Figure D1, and Figure D3 shows magnified images of the red border in Figure D1. Thin arrows indicate eosinophils (cytoplasmic red-dyed) in Figure D3. The arrowhead indicates polyp-like lesions in Figures D2 and D3 (hematoxylin and eosin staining, ×200 in Figure D1, ×400 in Figures A, B, C, and D2, ×800 in Figure D3). (b) The number of infiltrated eosinophils in Groups C and D was statistically higher than that in Groups A and B. In addition, there was a significant difference in tissue eosinophil count between Groups C and D (**p < 0.01). (c) No polyp-like lesions were observed in Groups A, B, and C. There were fourteen polyp-like lesions in six mice of Group D, and the difference was statistically significant compared with Groups A, B, and C (*p < 0.05). PBS indicates Group A; SEB indicates Group B; OVA indicates Group C; SEB + OVA indicates Group D. OVA: ovalbumin; SEB: staphylococcal enterotoxin B. Comparison of histological morphology at the transition zone between the PBS- and SEB + OVA-treated mice. OVA: ovalbumin; SEB: staphylococcal enterotoxin B. Morphological characteristics of the olfactory mucosa. (a) Mucosal epithelial cells in the olfactory region are abundant (red border), and nerve bundles (thin arrow) are visible in the PBS-treated group. (b) Thinned olfactory epithelium and decreased mucosal epithelial cells (red border) were observed in the SEB + OVA-treated group in contrast to the PBS-treated group, but nerve bundles (thin arrow) were also visible (hematoxylin and eosin staining, ×800). OVA: ovalbumin; SEB: staphylococcal enterotoxin B.


In Figure 5, Figures a and b represent the nasal and sinus tissue morphology of mice in the PBS- and SEB + OVA-treated groups, respectively. Figures c and d are magnified images of the black borders in Figures a and b, respectively. The transition zone between the olfactory (red arrow) and respiratory epithelia (black arrow) is shown in Figure c, and it is clearly visible in Figure g after enlarging Figure c. No edema or inflammatory cell infiltration was observed in the PBS-treated group. However, elevated mucosal lesions were obviously noted at the transition zone in Figure d. Figures e and f are magnified images of the red borders in Figures a and b, respectively. Compared with Figure e, diffuse mucosal swelling and eosinophilic infiltration were observed in the sinonasal mucosa in Figure f, and eosinophils (cytoplasmic red-dyed) (thin arrow) are evident in Figure h by magnifying Figure f. In addition, in Figure i, polyp-like lesions (arrowheads) can be seen at the junction indicated by the thick arrow in Figure b.
Evolution of cytokines in the sinonasal mucosa
Considering the widespread functions of inflammatory mediators in chronic rhinosinusitis pathogenesis, we then evaluated the levels of a series of proinflammatory cytokines by ELISA. The results showed that the Th2 cytokine (IL-4 and IL-5) levels were remarkably elevated in the OVA combined with or without SEB-treated groups compared to that of the PBS- and SEB-treated groups (p < 0.01). In addition, the SEB combined with OVA group presented higher IL-5 levels than that of OVA alone (p < 0.01) (Figure 7(b) and (c)). However, there were no significant differences in the expression of FN-γ and IL-17A among the PBS-, SEB-, OVA-, and OVA + SEB-treated groups (Figure 7(a) and (d)). The levels of cytokines in the sinonasal mucosa were measured by enzyme-linked immunosorbent assay (ELISA). (a) IFN-γ; (b) IL-4; (c) IL-5; (d) IL-17A. The levels of IL-4 and IL-5 were markedly elevated in Groups C and D compared with Groups A and B (**p < 0.01). In addition, Group D had higher IL-5 levels than those of Group C (**p < 0.01). No difference in the FN-γ and IL-17A levels was observed among Groups A, B, C, and D. PBS indicates Group A; SEB indicates Group B; OVA indicates Group C; SEB + OVA indicates Group D. IFN-γ: interferon-γ; IL: interleukin. OVA: ovalbumin; SEB: staphylococcal enterotoxin B.
Measurement of the STAT levels in sinonasal mucosa
Immunohistochemical staining
Subsequently, we performed immunohistochemical staining to assess the STAT levels in the sinonasal mucosa. The results showed that p-STAT1-, p-STAT3-, and p-STAT6-positive cells mainly infiltrated the sinonasal mucosa to varying degrees in the maxillary sinus and the junction between the olfactory and respiratory epithelia. The p-STAT1, p-STAT3, and p-STAT6 proteins were mainly present in the nucleus. The OVA-treated groups with or without SEB appeared to exhibit stronger positive signals for p-STAT6 than those of the groups treated with PBS or SEB (Figure 8(a)). The OVA combined with the SEB-treated group showed the strongest positive signals and the highest p-STAT6 expression (Figure 8(a)). Namely, the p-STAT6 protein positive staining-cells were widely detectable in the groups treated with OVA with or without SEB, and the results were statistically significant compared with those of the groups treated with PBS or SEB (p < 0.01). Notably, the p-STAT6 levels were significantly increased in the mice treated with both OVA and SEB compared with those treated with OVA alone (p < 0.01). However, the levels of p-STAT1 and p-STAT3 were comparable among the PBS-, SEB-, OVA-, and OVA + SEB-treated groups (Figure 8(b)–(d)). (a) Immunohistochemical staining for p-STAT1, p-STAT3, and p-STAT6. Marked p-STAT6 expression in the nucleus (stained brown-yellow or brown) (thin arrow) was observed in the mice treated with SEB + OVA compared with the mice treated with PBS, SEB, and OVA alone. (b–d) Quantitative analysis of p-STAT1-, p-STAT3-, and p-STAT6-positive cells. Groups C and D appeared to exhibit stronger positive signals for p-STAT6 than those of Groups A and B, and the numbers of p-STAT6-positive cells were significantly different (**p < 0.01). In addition, Group D showed the highest p-STAT6 expression (**p < 0.01). However, no significant differences in the numbers of p-STAT1-and p-STAT3-positive cells were observed among Groups A, B, C, and D. PBS indicates Group A; SEB indicates Group B; OVA indicates Group C; SEB + OVA indicates Group D. p-STAT6: phosphorylated STAT6.
Western blotting analysis
Next, we used western blotting analysis to assess the levels of several STAT proteins, including STAT1, STAT3, STAT6, p-STAT1, p-STAT3, p-STAT6, T-bet, GATA-3, and RORγt. As shown in Figure 9(a), the levels of p-STAT6 and GATA-3 in sinonasal mucosa homogenate in the OVA combined with or without SEB-treated groups were markedly overexpressed compared with those in the PBS- and SEB-treated groups. Of these, the former was more obvious. Subsequently, the relative expression levels of p-STAT1/STAT1, p-STAT3/STAT3, p-STAT6/STAT6, T-bet/GAPDH, GATA-3/GAPDH, and RORγt/GAPDH were calculated (Figure 9(b)–(g)). Compared with the PBS- and SEB-treated groups, the relative levels of p-STAT6/STAT6 and GATA-3/GAPDH were significantly evaluated in the OVA- and OVA combined with SEB-treated groups (p < 0.01); of these, the levels of the combined group were higher than those of just the OVA-induced group (p < 0.01). However, there was no significant difference in the expression of p-STAT1/STAT1 and p-STAT3/STAT3 among the PBS-, SEB-, OVA-, and OVA + SEB-treated groups, as well as T-bet/GAPDH and RORγt/GAPDH. Nasal antigen exposure did not affect the expression of STAT1, STAT3, and STAT6 proteins themselves, and the levels of STAT1, STAT3, and STAT6 were not significantly different in the sinonasal mucosa homogenate among the four groups. The expression levels of the indicated proteins in the sinonasal mucosa were measured by western blotting. (a) Representative western blot images of STAT1, STAT3, STAT6, p-STAT1, p-STAT3, p-STAT6, T-bet, GATA-3, and RORγt. Protein expression of STAT1, STAT3, STAT6, p-STAT1, p-STAT3, p-STAT6, T-bet, GATA-3, and RORγt was quantified based on the density of the bands. GAPDH was used as a loading control. The relative expression levels of p-STAT1/STAT1 (b), p-STAT3/STAT3 (c), p-STAT6/STAT6 (d), T-bet/GAPDH (e), GATA-3/GAPDH (f), and RORγt/GAPDH (g) were calculated. Each column represents the mean ± SEM from five or six different animals, **p < 0.01. PBS indicates Group A; SEB indicates Group B; OVA indicates Group C; SEB + OVA indicates Group D. OVA: ovalbumin; SEB: staphylococcal enterotoxin B.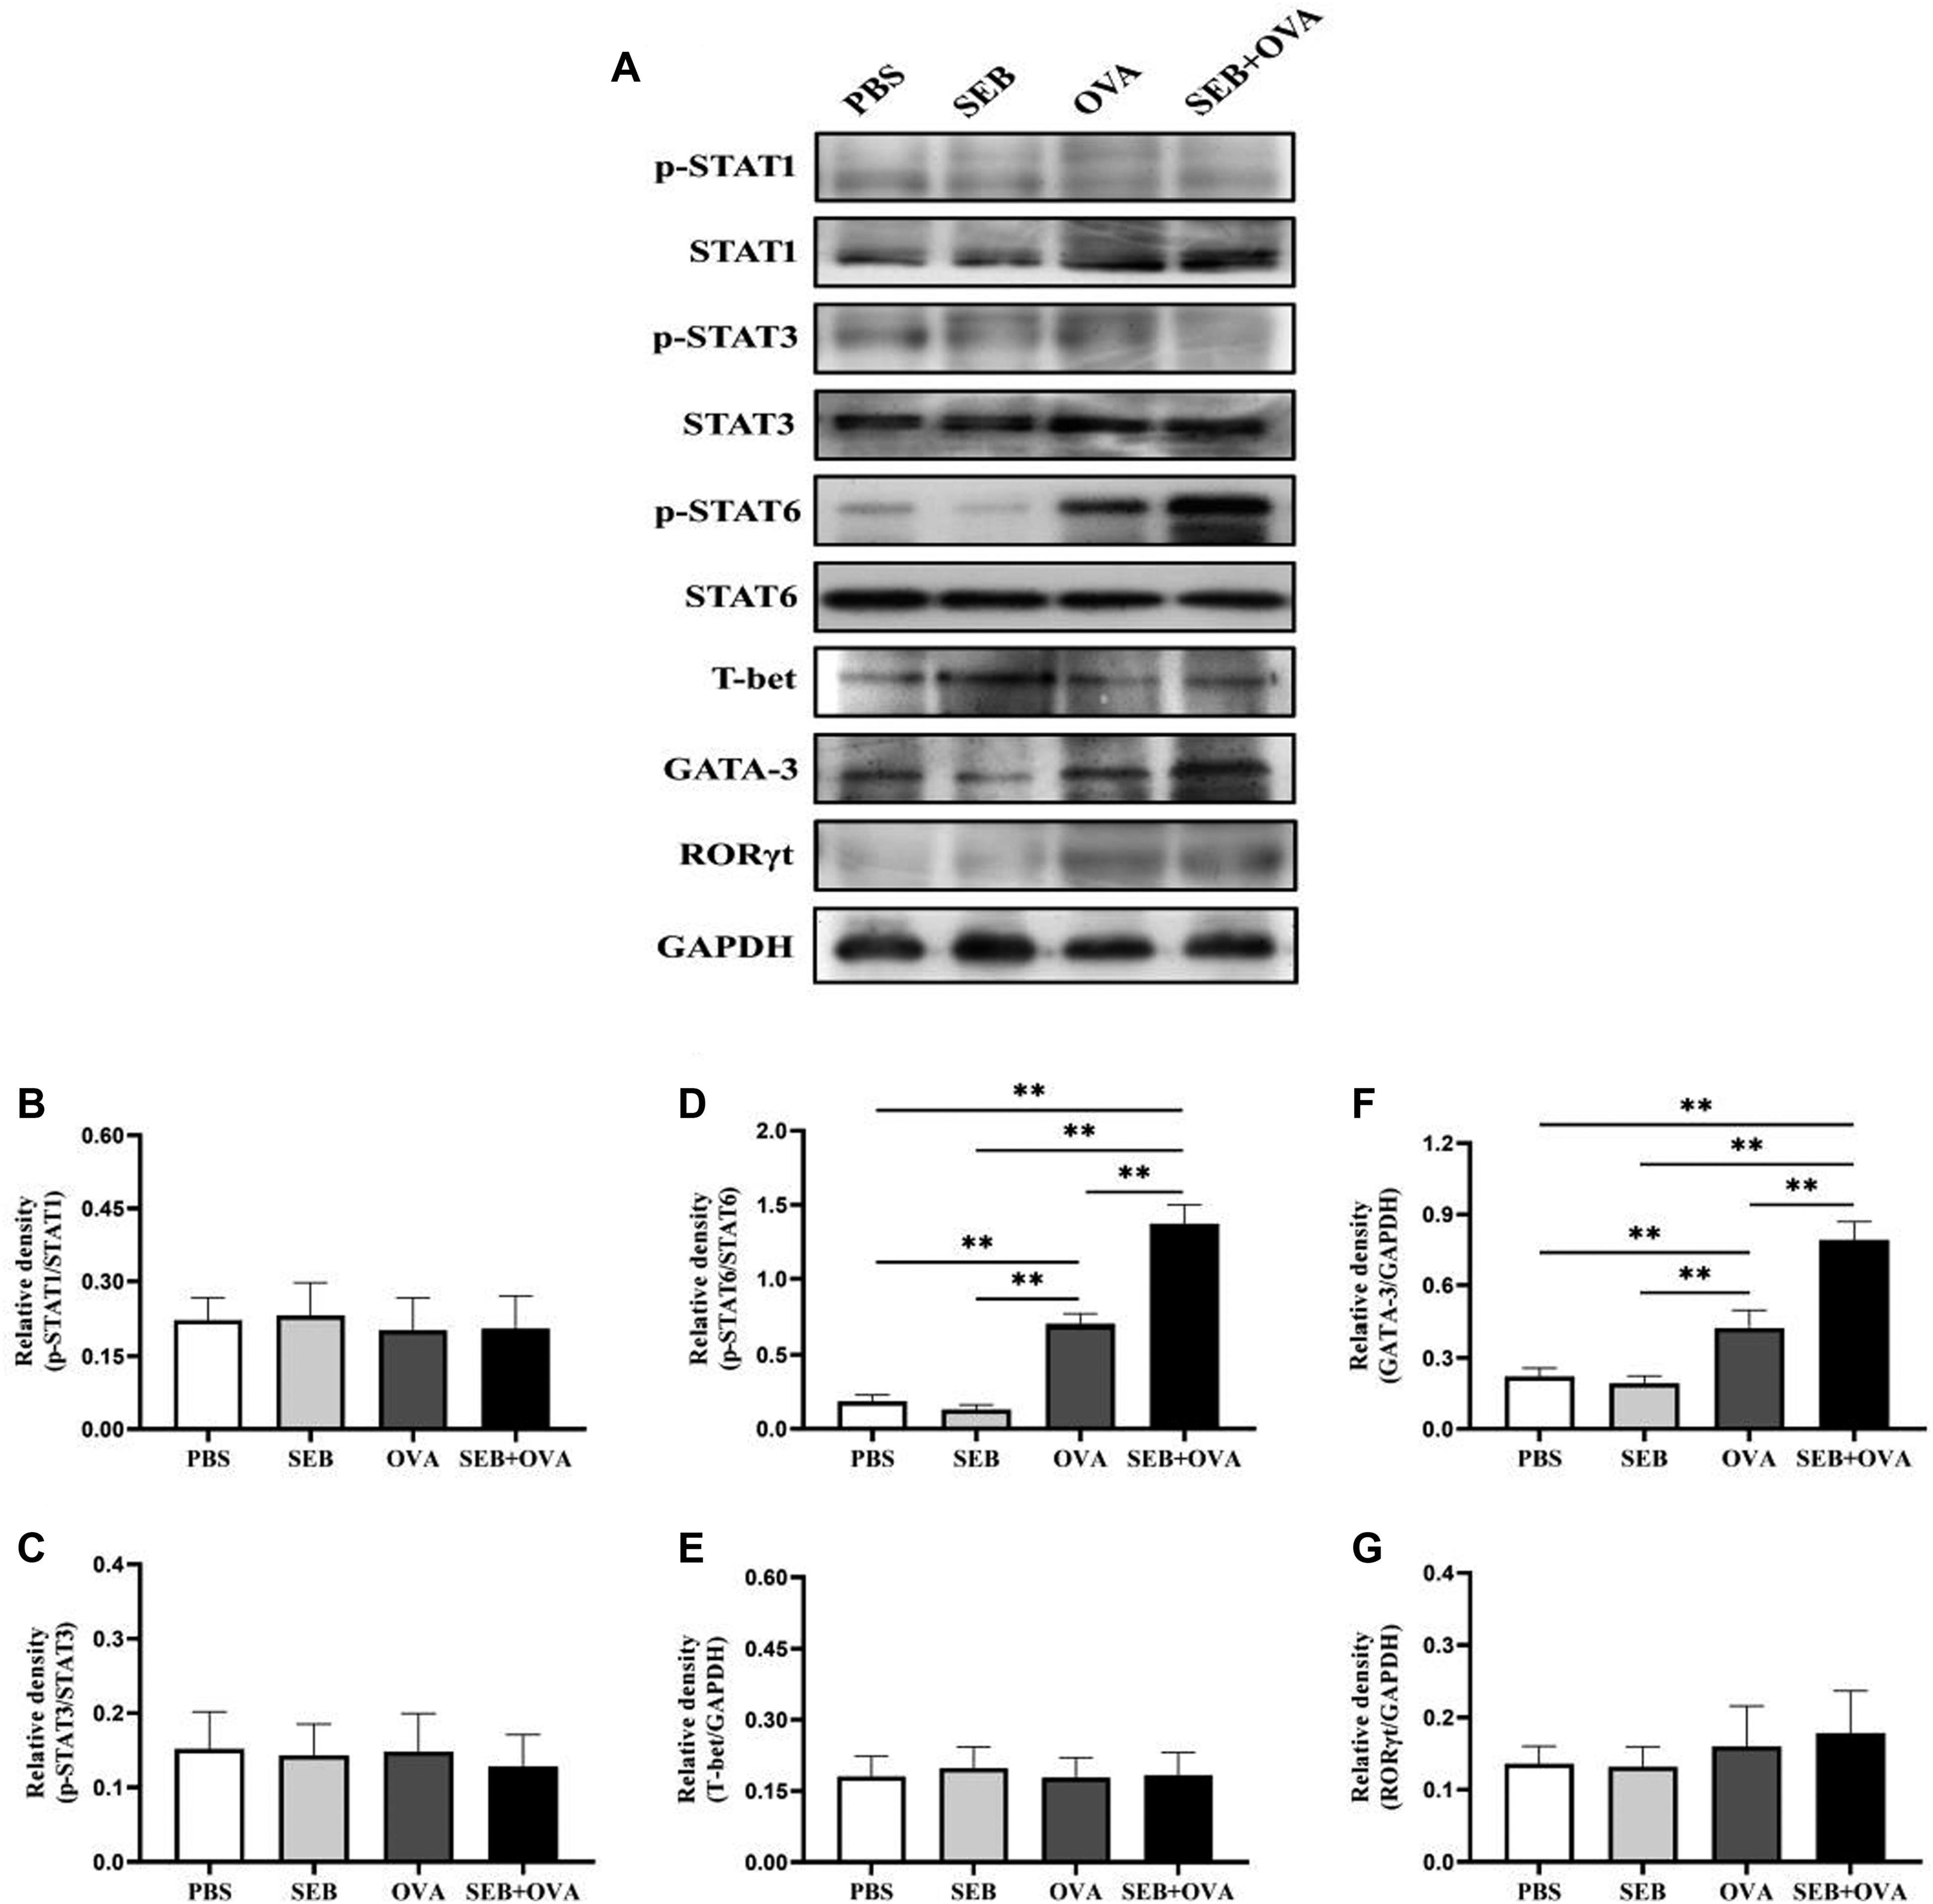
The association between eosinophil count and p-STAT6 level
To explore the association between eosinophil count and p-STAT6 expression levels in ECRS mice induced by SEB plus OVA, we performed Spearman correlation analysis. The results indicated that tissue eosinophil count showed a positive correlation with the number of p-STAT6-positive cells in the sinonasal mucosa (p = 0.0113). Furthermore, the association between blood eosinophil count and the number of p-STAT6-positive cells in the sinonasal mucosa was nearly significant, even though statistical significance was not observed (p = 0.0536) (Figure 10(a) and (b)). However, tissue and blood eosinophil counts were not correlated with the number of p-STAT1-and p-STAT3-positive cells. Spearman rank correlation was applied to explore the relationship between eosinophil count and p-STAT6 expression levels in the sinonasal mucosa of ECRS mice induced by SEB plus OVA. (a) Tissue eosinophil count (cells/HPF) showed a positive correlation with the number of p-STAT6-positive cells (cells/HPF). (b) Although statistical significance was not observed, the association between blood eosinophil count and the number of p-STAT6-positive cells was nearly significant. ECRS: Eosinophilic chronic rhinosinusitis; HPF: high-power field; p-STAT6: phosphorylated STAT6.
Discussion
Eosinophilic chronic rhinosinusitis is a chronic inflammatory disease characterized by Th2-biased eosinophilic inflammation. The definition of ECRS varies among countries and investigators, and the cutoff value for the number of tissue eosinophils per HPF (magnification ×400) ranges from 5 to 350.28–31 The EPOS group in 2020 agreed that ECRS was defined as an eosinophil count of more than 10 per HPF. 32 We have proposed an EPOS 2020 criterion that defines ECRS. In this study, we successfully established a murine ECRS model induced by OVA- and SEB according to the experimental method reported by Kim et al. 23 The results showed that OVA combined with SEB (OVA + SEB) could induce multiple polyp-like lesions in the nasal cavity, accompanied by prominent eosinophilic infiltration in the sinonasal mucosa. The polyp-like lesions were mainly located at the transition zone between the olfactory and respiratory epithelia, consistent with the findings by Dae Woo Kim, S-W Kim, Dong-Yeop Chang, and Yeon-Hee Joo.14,23,25,33 Mucosal edema and inflammatory infiltrated cells rather than polyp-like lesions were observed in the sinus cavity. In addition, the levels of p-STAT6 were markedly increased by OVA + SEB exposure, as well as GATA-3, IL-4 and IL-5, but did not affect STAT6, p-STAT1, p-STAT3, T-bet, RORγt, IFN-γ or IL-17A. Furthermore, eosinophil count in the sinonasal mucosa showed a positive correlation with the levels of p-STAT6 in the ECRS mouse model.
Previously, Kim et al. 23 evaluated the eosinophilic, neutrophilic inflammation patterns and T-cell patterns of mice with CRSwNP induced by OVA + SEB. The results showed that there was more Th2 bias with higher IL-5 levels, as well as more eosinophilic inflammation, which was also confirmed in our research. Interestingly, we observed a thinned olfactory epithelium and decreased epithelial cells in the olfactory mucosa in the upper part of the nasal septum near the roof of the nasal cavity in ECRS mice. This was consistent with Kagoya R’s report. 34 The thinning of the olfactory mucosa and the loss of olfactory cells may lead to hyposmia. However, SEB alone could not significantly induce two cardinal features of ECRS, based on the polyp-like lesions and eosinophilic inflammation accompanied by Th2-type immunity. A possible reason is that SEB-induced ECRS may occur in sensitized animals with latent allergic inflammation. 35 Although OVA alone recruited a large number of eosinophils, the inflammation was not enough to produce nasal polypoid lesions in the sinonasal cavity. Compared with OVA + SEB-treated induction, nasal challenge with OVA alone showed less eosinophil infiltration and lower GATA-3 and IL-5 expression levels, which might partly explain the possible reasons for polyp-like lesions that cannot be induced by OVA alone. Namely, the inflammatory response was insufficient to form polyps. Future studies are needed to clarify the specific mechanism of nasal polypoid lesions induced by OVA + SEB.
In addition, a significantly greater number of peripheral blood eosinophils was observed in the ECRS mice induced by OVA + SEB compared with the control mice treated with PBS, which was consistent with the increase in eosinophil count in the sinonasal tissue. Although this difference was not statistically significant between the OVA-treated and OVA + SEB-treated groups, there was a trend toward a higher blood eosinophil count in the mice treated with OVA + SEB. It has been reported that ECRS can be considered when the peripheral blood eosinophil count of patients is greater than 0.24×10⁹/L and the ratio is greater than 4.27%. 36 Currently, it is recommended to diagnose ECRS by combining eosinophil count or eosinophil percentage in peripheral blood. However, there are some ECRS patients in which the peripheral blood eosinophils do not increase significantly, so the diagnosis of ECRS is mainly based on the number of eosinophils or the percentage of eosinophils in the sinonasal tissue. 32 Therefore, this indirectly suggests that the correlation between p-STAT6-positive cells and tissue eosinophil count was more significant than that between p-STAT6-positive cells and blood eosinophil count. Interestingly, although the blood leucocyte counts in the SEB + OVA-treated group showed an increasing trend compared with that of the other three groups, there was no significant difference, indicating that bacterial infection did not play a major role in ECRS, which also indirectly reflected that this model was driven by antigen and bacterial toxins rather than the bacteria themselves. This is consistent with the absence of a significant increase in leucocyte count from peripheral blood in some ECRS patients. However, in this study, although the total IgE expression level in the SEB + OVA-treated group was slightly higher than that in the OVA-treated group, there was no statistically significant difference, and the difference in serum OVA-specific IgE levels between the two groups was also not statistically significant, suggesting that the addition of SEB on the basis of OVA did not significantly improve the IgE expression level in peripheral blood. It has been reported in previous studies that serum IgE levels do not fully represent the severity of allergic inflammation in the sinonasal tissue.37,38
To define the association between STATs and ECRS, we examined the relationship between STAT1, STAT3, and/or STAT6 and ECRS. The results showed that p-STAT6 levels in the sinonasal mucosa were significantly increased after OVA + SEB stimulation, while p-STAT1 and p-STAT3 levels underwent no significant changes. Thus, it is possible that STAT6, but not STAT1 and STAT3, might be a crucial signal transducer in the development of ECRS. STAT6 is essential for ECRS, as demonstrated by Sun et al. 39 In this article, the authors focused on the functions of STAT6 rather than other STAT family members in ECRS. Another study using JAK inhibitor-treated eosinophilic CRSwNP in a mouse model indicated that by inhibiting STAT6 phosphorylation, the Th2 response and eosinophilic inflammation can be reduced. 14 In addition, increasing evidence has demonstrated that STAT6 activation may contribute to the development of nasal allergic diseases. Recent studies on the therapeutic efficacy of topical STAT6-siRNA suggested that STAT6 might play a critical role in the pathogenesis of Th2-skewed allergen-induced AR. 16 Similar observations were also reported in interfering RNAs against STAT6 17 and the IL-37-repressed STAT6 signaling pathway. 22 The inflammatory endotypes of ECRS and AR all belong to Th2-type eosinophilic inflammation. The above studies suggested that STAT6 plays a critical role in the induction of allergic inflammation, such as ECRS and AR.
Although the levels of p-STAT1 and p-STAT3 were not significantly increased in our ECRS model, STAT1 and STAT3 were also previously considered potential targets for regulating airway inflammation.18–20 STAT1 is critical for Th1 polarization, and its hallmark cytokine is IFN-γ, one of the Th1 cytokines. 40 However, no evidence of elevated IFN-γ levels was reported in AR or ECRS, although a previous study suggested that epithelial STAT1 was activated in asthmatic subjects. 41 Th17 cells eradicate extracellular bacteria, which are neutrophil-enriched inflammatory responses, 42 and the functional role of STAT3 in allergic airway inflammation is controversial. A recent study showed that the levels of p-STAT3 and IL17 in nasal mucosa were elevated in AR patients. 43 Cui et al. 44 reported that elevated expression of STAT3 led to the overexpression of IgE and other inflammatory factors in an OVA-induced AR model. However, Chiba et al. 19 suggested that STAT3 phosphorylation could not be induced by antigens in the lungs of a mouse asthma model. Further studies are needed to define the functional roles of STAT1 and STAT3 in ECRS.
T-bet, GATA-3, and RORγt are Th1-, Th2-, and Th17-specific transcription factors that determine Th-cell differentiation.45–47 In the present study, we characterized the expression of T-bet, GATA-3, RORγt and Th1/Th2/Th17 cytokine patterns in the sinonasal mucosa of ECRS mice. Overexpression of GATA-3 was observed in the ECRS mice induced by OVA + SEB, indicating that GATA-3 is important for allergen-induced ECRS. STAT6 participates in Th2 differentiation, partly by enhancing the expression of GATA-3. 48 GATA-3 is a Th2-specific transcription factor that regulates Th2 cytokine expression. 46 GATA-3 can not only directly bind to the promoters of the IL-5 and IL-13 genes but also participates in the opening of the IL-4 locus. 49 Therefore, the levels of IL-4 and IL-5 were significantly increased in ECRS mice owing to the overexpression of GATA-3.
Ovalbumin can act as a conventional allergen, and SEB should act both as a conventional allergen and superantigen, which are considered to be inducers of Th2 responses and induce the production of Th2 cytokines, such as IL-5. Research has shown that IL-5 can recruit eosinophils. 42 The majority of the activities of IL-5 can be ascribed to the function of GATA-3. Furthermore, GATA-3 is induced through the activation of STAT6, 49 which might partly explain the correlation between p-STAT6 expression and eosinophil infiltration.
Interestingly, the intranasal instillation with OVA + SEB that was presented in this study did not markedly promote T-bet, RORγt, IFN-γ, or IL-17A production. We speculate that one possible reason is that STAT1 and STAT3 were not activated by intranasal allergens in this study. Signal transducer and activator of transcription 1 is critical for T-bet and IFN-γ signaling and is a key factor for Th1 polarization. 40 Signal transducer and activator of transcription 3 is necessary for the induction of RORγt, and STAT3 and RORγt cooperate to induce IL-17A expression. 50 Another possible reason is that the dose of allergen may affect the activation of the STAT family. A previous study showed that STAT1 and STAT3 were involved in the Th1 activation induced by a high dose of SEB challenge. 51 In our previous study, we found that the level of T-bet was increased in response to high-dose SEA challenge in contrast to the overexpression of GATA-3 for low-dose challenge. 52 Given that T-bet, GATA-3, and RORγt are expressed in a manner dependent on STATs,42,53 we speculate that the types of STAT family members activated may contribute to the differentiated response (Th1, Th2 vs. Th17) upon high- or low-dose SEB challenge in sensitized animals. Further studies are still needed to obtain conclusive evidence to support this speculation.
This study underscores the importance of STAT6 for the development of ECRS. We investigated OVA plus SEB-induced ECRS in an in vivo mouse model and evaluated p-STAT1, p-STAT3, and/or p-STAT6 expression in response to allergen challenge. Eosinophil infiltration in the sinonasal mucosa was positively correlated with the level of p-STAT6 but not p-STAT1 or p-STAT3, suggesting that the development of ECRS following exposure to nasal OVA + SEB is associated with the activation of STAT6. OVA and SEB, as Th2-skewed allergens, can induce the release of IL-4. IL-4 binding to its receptor (IL-4R) can induce the phosphorylation of STAT6 via JAK1 and JAK3 kinases. Subsequently, p-STAT6 translocates into the nucleus and drives the overexpression of Th2 cytokines and promotes Th2 responses. 54 Eventually, eosinophilic inflammation was induced in the sinonasal mucosa.
It should be noted that this study involved several limitations. First, the proportion of olfactory mucosa in mice is larger than that in humans. Compared with the respiratory epithelium, the olfactory epithelium mostly occupies the mouse nasal mucosa, and imaging assessment and accurate sampling are relatively difficult due to accomplish to the anatomic characteristics of the mouse sinus. 24 Second, the mouse models induced in this research were derived from specific antigens and bacterial toxins, which cannot represent all risk factors for ECRS. Despite being similar to the immunohistologic characteristics, the gross appearance of mouse polypoid lesions induced by antigens and bacterial toxins is quite different from the appearance of human nasal polypoids, and this result was previously documented by Kim et al. 55 Therefore, the transformation of animal experimental findings for the exploration of human diseases deserves further research, as does a mouse model induced by superantigens to examine the pathogenesis of ECRS. 56 Third, sample power analysis was not performed due to the limited sample size in this study. Although the correlation between p-STAT6-positive cells and infiltrated eosinophils in the sinonasal mucosa was significant, using small sample sizes to assess possible correlations has been questioned. Therefore, further and larger studies are needed to offset these deficiencies.
Conclusion
We discovered that OVA with SEB exhibited nasal polypoid lesions, which were characterized by predominant eosinophil infiltration and Th2-type immunity. Signal transducer and activator of transcription 6, but not STAT1 or STAT3, was activated by nasal antigen challenge in the sinonasal mucosa of sensitized mice. Signal transducer and activator of transcription 6 might be a crucial signal transducer in the development of ECRS.
Footnotes
Acknowledgements
Thanks to Dr. Xiayuan Xu and Zhongsheng Cao for their participation in establishing the animal model.
Author contributions
All authors contributed to data analysis and drafting or revising the article, and all authors gave final approval of the version to be published and agree to be accountable for all aspects of the work.
Declaration of conflicting interests
The author(s) declared no potential conflicts of interest with respect to the research, authorship, and/or publication of this article.
Funding
The author(s) disclosed receipt of the following financial support for the research, authorship, and/or publication of this article: This study was supported by the Fund of Suzhou Science and Technology Planning Project (no. SKJY2021084), Suzhou Youth Science and Technology Project of “Rejuvenating Health through Science and Education” (no. KJXW2012013) and the Key Social Development Fund Project (Clinical Cutting-edge Technology) in Jiangsu (no. BE2019670). The funding agencies had no role in the study design, data collection, analysis, decision to publish, or manuscript preparation.
Ethics approval
This study was approved by the Ethics Committee of Soochow University. Approval number: SUDA20210512A01. Procedures performed involving animals were in accordance with the ethical standards of the institutional and/or national research committee and with the 1964 Helsinki Declaration and its later amendments or comparable ethical standards.
Data Availability
The data that support the findings of this study are available from the corresponding author upon reasonable request.