
Abstract
Systemic sclerosis (SSc) is an autoimmune disease characterized by skin and internal organ fibrosis, caused by microvascular dysfunction. In recent years, the hypothesis that anti-endothelial cell antibodies (AECA) play a key role in microvascular damage seems to be increasingly convincing. In fact, AECA can induce antibody-dependent cellular apoptosis and stimulate the microvasculature to release pro-inflammatory and pro-fibrotic cytokines. Human-microvascular-endothelial-cells (MVECs) were stimulated with SSc sera (with and without AECA) and with sera from healthy donors. The conditioned MVEC culture media were then added to fibroblast cultures obtained from control skin (CTR), non-affected skin of SSc patients (NA), and affected skin of the same sclerodermic (SSc) patients, respectively. AECA contributed to the MVEC increased release of endothelin-1 (ET-1) in the culture medium and to MVEC apoptosis. Fibroblast (CTR, NA, and SSc) proliferation was increased after treatment with AECA-positive conditioned media, compared to AECA-negative and control conditioned media. Furthermore, both AECA-positive (in major contribution) and AECA-negative conditioned media were responsible for alpha-smooth-muscle-actin (αSMA) over-expression in all fibroblast cultures, compared to control conditioned media. Fibroblast type I collagen synthesis was upregulated by both SSc conditioned media (with and without AECA). Finally, the synthesis of fibroblast transforming-growth-factor-beta (TGF-β) was statistically higher in AECA-positive conditioned media, compared to AECA-negative and control conditioned media. These findings support the concept that AECA may mediate the crosstalk between endothelial damage and dermal-fibroblast activation in SSc.
Systemic sclerosis (SSc), also known as scleroderma, is an autoimmune connective tissue disease characterized by cutaneous and visceral fibrosis coupled with widespread vascular pathology. 1 The first symptom occurring in 90–98% of SSc patients is Raynaud’s phenomenon (RP), an abnormal reactivity of digital microvasculature under cold and other stimuli,2,3 that highlights the central role of microvascular damage in the pathogenesis of SSc. 4 In SSc, the imbalance of endothelial signals, such as increased release of vasoconstrictory ET-1, thromboxane, and trombomodulin, and reduction of prostaglandin I2 (PGI2) and nitric oxide (NO), 5 are signs of endothelial injury, a condition which could be also mediated by specific autoantibodies called anti-endothelial cell antibodies (AECA). 6 These specific auto-antibodies have been detected in 30–51% of SSc patients, and high levels of AECA are strictly correlated with higher incidence of digital ischemia and pulmonary arterial hypertension.7,8 Moreover, even if AECA recognize poorly characterized targets, they are considered as disease activity markers. 9 Recently, in vitro studies carried out on endothelial cells from human umbilical vein showed that IgG-AECA significantly increase ET-1 release in the medium. 10 Moreover, the inter-relationship between AECA and ET-1 was evaluated in patients with systemic lupus erythematosus (SLE), where it was demonstrated that IgM-AECA stimulate ET-1 release from endothelial cells, contributing to the onset of vascular injury, pulmonary hypertension, and lupus nephritis. 11 Therefore, it has been hypothesized that endothelial damage mediated by AECA, inducing a loss of normal vasodilatory mediators and increasing the release of ET-1, could also be involved in the beginning of SSc. 12 The excessive ET-1 production, together with other cytokines and soluble factors, might be responsible for fibroblast activation and differentiation, leading to the fibrotic process. Until 10 years ago, research related to AECA was controversial. First of all, there was no agreement on a standardized method for AECA detection, and an inter-laboratory comparison was impossible.13,14 Second, other autoantibodies’ cross-reactivity against endothelial cells has been reported: therefore making it difficult to identify the specificity of the AECA group. 15 Nowadays, the laboratory methods used in detecting AECA are always more accurate and show fewer problems of cross-reactivity. 16 Therefore, at present, research related to AECA can lead to novel insights to better understand the pathogenesis of SSc. In this context, the present work provides in vitro evidence of AECA activity in an endothelium-derived fibroblast activation model.
Materials and methods
Patients and control subjects analysis and screening for serum autoantibodies
Serum samples were collected from 25 female SSc patients (age, 56.2 ± 9.4 years; disease duration, 8.4 ± 2.1 years) who fulfilled the 2013 ACR/EULAR criteria, 17 19 of whom were affected by limited SSc (lSSc) and six by diffuse SSc (dSSc), diagnosed in accordance with LeRoy and colleagues. 18 Table 1 shows the major clinical characteristics of the patients. Anti-nuclear antibodies (ANA) were detected and quanti-fied by titration on HEp-2 cells (Euroimmun-BioAdvance, Emerainville, France), and extractable nuclear antigen (ENA) specificities were established by ELISA (Euroimmun-BioAdvance, Emerainville, France). To determine the presence of AECA in SSc sera, a solid-phase ELISA designed for the quantitative determination of human AECA by microvasculature in serum samples was used (Human Anti-Endothelial Cell Antibody ELISA kit) (MyBioSource Inc, San Diego, CA, USA). Sera from 20 healthy blood donors matched for age and sex were used as controls. All serum samples were stored at −80ºC until use. All patients and control subjects gave fully informed voluntary written consent according to the principles of the Declaration of Helsinki and in compliance with the Ethics Committee of the University of Siena.
Clinical parameters of patients with lSSc and dSSc.

MVECs cultures
MVECs (originated from the digital microvasculature of a healthy 40-year-old female donor) were purchased from Medicyte (Heidelberg, Germany), and cultured at passage 3 in upcyte® MVEC Growth Medium (Medicyte, Heidelberg, Germany), supplemented with 10% fetal calf serum (FCS) (Medicyte, Heidelberg, Germany) onto 75 cm2 flasks (BD Costar Cambridge, MA, USA), and incubated at 37ºC in atmosphere of 5% CO2 95% air, till confluence (1 week). Cells were then passaged twice and left in a serum-free medium for 12 h, before starting the experiments with SSc and control sera.
Fibroblast cultures
We performed skin biopsies by using a 3-mm punch on the mid-forearm of the above-mentioned 25 SSc patients enrolled in the study. Unaffected areas of skin from the same lSSc patients and control skin (site-matched) from 20 gender- and age-matched voluntary healthy subjects were also examined. Therefore, one skin specimen was obtained for dSSc patients and control subjects, while two skin specimens (unaffected and affected skin) were obtained from each lSSc patient. The lSSc patients’ unaffected skin was defined by clinical palpation and graded as zero on the modified Rodnan skin score. 19 Fibroblasts were isolated from skin specimens by enzymatic digestion. Briefly, explants were de-epidermized using a dispase solution (dispase activity 14 U/mL) (Sigma-Aldrich, St. Louis, MO, USA) for 2 h at 37°C and then were dissolved into a collagenase III solution (2.4 U/mL) (Sigma-Aldrich, St. Louis, MO, USA) for 30 min. Fibroblasts obtained from biopsies of SSc patients and control subjects were passaged twice and cultured at density of 1 × 10⁶ cells/flask in DMEM (Sigma-Aldrich, St. Louis, MO, USA) supplemented with penicillin (100 U/mL) (Sigma-Aldrich, St. Louis, MO, USA), streptomycin (100 μg/mL) (Sigma-Aldrich, St. Louis, MO, USA), 0.25 μg/mL amphotericin B (Sigma-Aldrich, St. Louis, MO, USA), 2 mM glutamine (Sigma-Aldrich, St. Louis, MO, USA), and 10% FBS (Sigma-Aldrich, St. Louis, MO, USA) and incubated at 37°C in atmosphere of 5% CO2 95% air, till confluence (1 week) onto 75 cm2 flasks (BD Costar, Cambridge, MA, USA). Viability was estimated by trypan blue (Sigma-Aldrich, St. Louis, MO, USA). Twelve hours before the experiments, cells were harvested in a serum-free medium and cultured onto 75 cm2 flasks (BD Costar, Cambridge, MA, USA).
Preparation of MVECs conditioned media
MVECs were cultured onto 25 cm2 flasks (BD Costar, Cambridge, MA, USA) at a density of 0.5 × 10⁶ cells/flask. Confluent cultures were washed twice with PBS and incubated overnight in upcyte® MVEC Growth Medium supplemented with 2% FCS. Twelve hours before the experiments, MVECs were left in serum-free medium. Then, MVECs were challenged with upcyte® MVEC Growth Medium supplemented with pooled (n = 10, 6 lSSc and 4 dSSc) 10% AECA-positive (AECA+) (ANA/ENA positive) SSc serum, pooled (n = 10, 8 lSSc and 2 dSSc), 10% AECA-negative (AECA–) (ANA/ENA positive) SSc serum and pooled (n = 20) 10% control serum (CTR-S), respectively. After 48 h, culture supernatants were centrifuged at 1500 revolutions per minute for 10 min and either used immediately or stored at −80ºC until use. The experiments were repeated also with IgG fractions of the above-mentioned pooled sera (data not shown).
ET-1 release by MVECs
MVECs were cultured onto 24-multiwell plates (BD Costar, Cambridge, MA, USA) and treated with concentrations of pooled sera previously prepared (SSc AECA+, SSc AECA–, and CTR-S) of 0, 2%, 5%, and 10%, respectively. Supernatant samples (about 100 uL) were collected after 12, 24, and 48 h. ET-1 release in the medium was assessed by Human ET-1 ELISA kit (Abcam, Cambridge, UK). The ET-1 release by MVECs was calculated as the final concentration of ET-1 after each time point of incubation (0, 12, 24, and 48 h), minus the ET-1 concentration of the conditioned media before the incubation containing different percentages of serum (0, 2%, 5%, and 10%). The experiments were repeated three times.
Detection of MVECs apoptosis
Apoptosis of MVECs, used for the preparation of conditioned media, was determined by morphologic analysis after 48 h of incubation with pooled sera. In particular, the characteristic morphologic changes of apoptosis (vacuolization, blebbing, etc.) were counted per high-power field from three separate experiments. Apoptotic morphological analysis was confirmed by terminal deoxynucleotidyl transferase (TdT) dUTP Nick-End Labeling (TUNEL) assay (data not shown).
Fibroblast treatments with conditioned media
Fibroblasts were cultured onto 75 cm2 flasks at a density of 1 × 10⁶ cells/flask. Confluent cultures of control (CTR), not affected sclerodermic (NA), and affected sclerodermic (SSc) fibroblasts (from both lSSc and dSSc patients) were challenged with the three MVECs conditioned media (containing 10% SSc AECA+, 10% SSc AECA–, and 10% CTR serum, respectively) for 48 h.
Fibroblast proliferation
Fibroblast (pooled n = 20 CTR, pooled n = 19 NA, and pooled n = 6 SSc) proliferation rates for each group (no serum, CTR serum, AECA– SSc serum, AECA+ SSc serum) were determined at three experimental time points (12, 24, and 48 h) in triplicate by 3-4,5dimethylthiazol- 2yl-2,5-dipheniltetrazolium bromide (MTT) (Sigma-Aldrich, St. Louis, MO, USA) mitochondrial reduction. For MTT, cells were seeded onto a 96-well plate (BD Costar, Cambridge, MA, USA) at a density of 2 × 10⁴ cells/well. Results of the MTT test are expressed as colorimetric changes (optic density λ = 590 nm). Proliferation values, chosen for statistical analysis, are those recorded after 48 h (end point of the experiment), and are reported as the % increment in respect to CTR untreated fibroblasts (no serum group) considered as 100% proliferative.
Western blotting
On day 2, fibroblasts grown onto 75 cm2 flasks were detached using trypsin-EDTA 0.25% solution (Sigma-Aldrich, St. Louis, MO, USA) for 3 min at 37°C, collected and centrifuged at 1500 rpm for 10 min at room temperature. Pellets were then suspended in PBS buffer and centrifuged at 3000 rpm for 20 min at 4°C. The obtained pellets were then suspended in RIPA buffer containing protease inhibitor cocktail (Sigma-Aldrich, St. Louis, MO, USA) for 40 min in ice and then centrifuged at 15,000 rpm for 30 min at 4ºC. After centrifugation, supernatants were collected and protein concentration was calculated according to Bradford assay. 20 About 20 μg of cell lysate proteins for each lane were resolved in a 12% SDS-PAGE, according to Laemmli. 21 The bands were transferred from the gels to polyvinyl difluoride (PVDF) membranes using iBlot™ Dry Blotting System (Invitrogen, Carlsbad, CA, USA). The incubations with rabbit polyclonal anti-αSMA (diluted 1:2500) (Abcam, Cambridge, UK), rabbit polyclonal anti-type I collagen (diluted 1:2500) (Abcam, Cambridge, UK), and rabbit polyclonal anti-TGF-β (diluted 1:2500) (Abcam, Cambridge, UK) were made using iBlot® Western Detection Kit (Invitrogen, Carlsbad, CA, USA). The load control protein used was beta actin (diluted 1:5000) (Abcam, Cambridge, UK). The bound primary antibodies were detected using anti-rabbit IgG ALP-conjugate (1:5000) (Invitrogen, Carlsbad, CA, USA) and visualized using a Chemidoc™ XRS 170-870 molecular imager (Bio-Rad, Hercules, CA, USA) and quantified by Quantity One software (© 2006, Bio-Rad Laboratories, Inc.).
Immunocytochemistry
On day 2, CTR, NA, and SSc fibroblasts (which received the same treatments of fibroblasts grown onto 75 cm2 flasks) were grown onto Lab-Tak II 8-chamber slides (Sigma-Aldrich, St. Louis, MO, USA) (~5 × 10⁴ cells/chamber) and were fixed in a 4% paraformaldehyde solution (Sigma-Aldrich, St. Louis, MO, USA) for 10 min at room temperature. Then, to permeabilize cell membranes, cells were incubated in Triton-X 100 0.02% solution for 3 min at room temperature. Fibroblasts were washed twice in PBS and incubated at 4ºC overnight with anti-human alpha smooth muscle actin (αSMA) (Abcam, Cambridge, UK), anti-human type I collagen (Abcam, Cambridge, UK), anti-human TGF-β (Abcam, Cambridge, UK) diluted 1:200 in PBS (Sigma-Aldrich, St. Louis, MO, USA) containing 2% bovine serum albumin (BSA) (Sigma-Aldrich, St. Louis, MO, USA). Cells were then washed twice in PBS and incubated for 10 min with DAPI solution (diluted 1:1000) (Abcam, Cambridge, UK). After three washes, cells were incubated with anti-rabbit Alexa Fluor® 488 (Abcam, Cambridge, UK) as secondary antibody for 1 h at room temperature. Finally, the cells were washed twice in PBS and slides were mounted with PVA-DABCO coverslipping solution for immunofluorescence (Sigma-Aldrich, St. Louis, MO, USA). Negative control was performed using PBS buffer instead of primary antibody.
Statistical analysis
GraphPad Prism 5 for Windows was used for statistical analysis. For MVECs ET-1 release, ANOVA with Tukey’s post test was performed in order to evaluate statistical differences at each time point in a specific treatment. For fibroblast proliferation, ANOVA with Tukey’s post test was carried out in order to evaluate statistical differences among the three cell phenotypes (CTR, NA, and SSc) in each group (no serum, CTR serum, AECA– SSc serum, AECA+ SSc serum). Regarding the morphological analysis to screen MVECs apoptosis, the mean apoptosis percentages for each treatment resulted from the count of high-power field from three separate experiments. Finally, for western blotting analysis, ANOVA and Tukey’s post test were performed using GraphPad Prism 5 for Windows.
Results
Characterization of autoantibody profile in serum of SSc patients and healthy donors
Sera from all 25 SSc patients (19 lSSc and 6 dSSc) resulted positive for ANA/ENA and 10 of them also turned positive for AECA (6 lSSc and 4 dSSc) as shown in Table 1. Sera from 20 healthy blood donors were negative for both ANA/ENA and AECA. Examining the clinical findings of the patients, and in particular the presence of digital ulcers (DUs) and/or pulmonary arterial hypertension (PAH), we found that four out of six (66.6%) patients with dSSc (presenting both DUs and PAH) were positive to AECA. On the other hand, six out of 19 (31.5%) patients with lSSc were positive to AECA, and only two out of 19 (10.5%) presented both DUs and PAH; moreover these last two patients were also positive to Scl-70.
ET-1 release by MVECs
ET-1 release by MVECs is shown in Figure 1. MVECs show an increase in ET-1 secretion (Figure 1a) from 12 h to 48 h (P <0.05). When 2% of the condition media (Figure 1b) were added, AECA+ conditioned medium was responsible for ET-1 increased secretion after 48 h (P <0.05) in respect to CTR and AECA– conditioned media. By increasing serum percentages of conditioning media to 5% (Figure 1c) and 10% (Figure 1d), MVECs stimulated with AECA+ conditioned media always showed increased ET-1 secretion over time in culture from 12 h to 48 h. Comparing the absolute values after 48 h, the AECA+ ET-1 release (12 pg/mL) was two times higher than AECA- (6 pg/mL) and CTR ET-1 release (6 pg/mL).

ET-1 release by MVECs stimulated with 0 (
MVECs apoptosis
After 48 h, only MVECs challenged with AECA+ sera showed the classic signs of apoptosis, characterized by vacuolated cytoplasm with disrupted nuclear membranes and a lot of apoptotic blebs (Figure 2). On the other hand, cells treated with CTR-S and AECA– sera showed regular morphology. The mean percentage of apoptotic cells challenged with AECA+ sera was 87% in respect to that recorded in AECA– (9%) and CTR-S sera (5%).
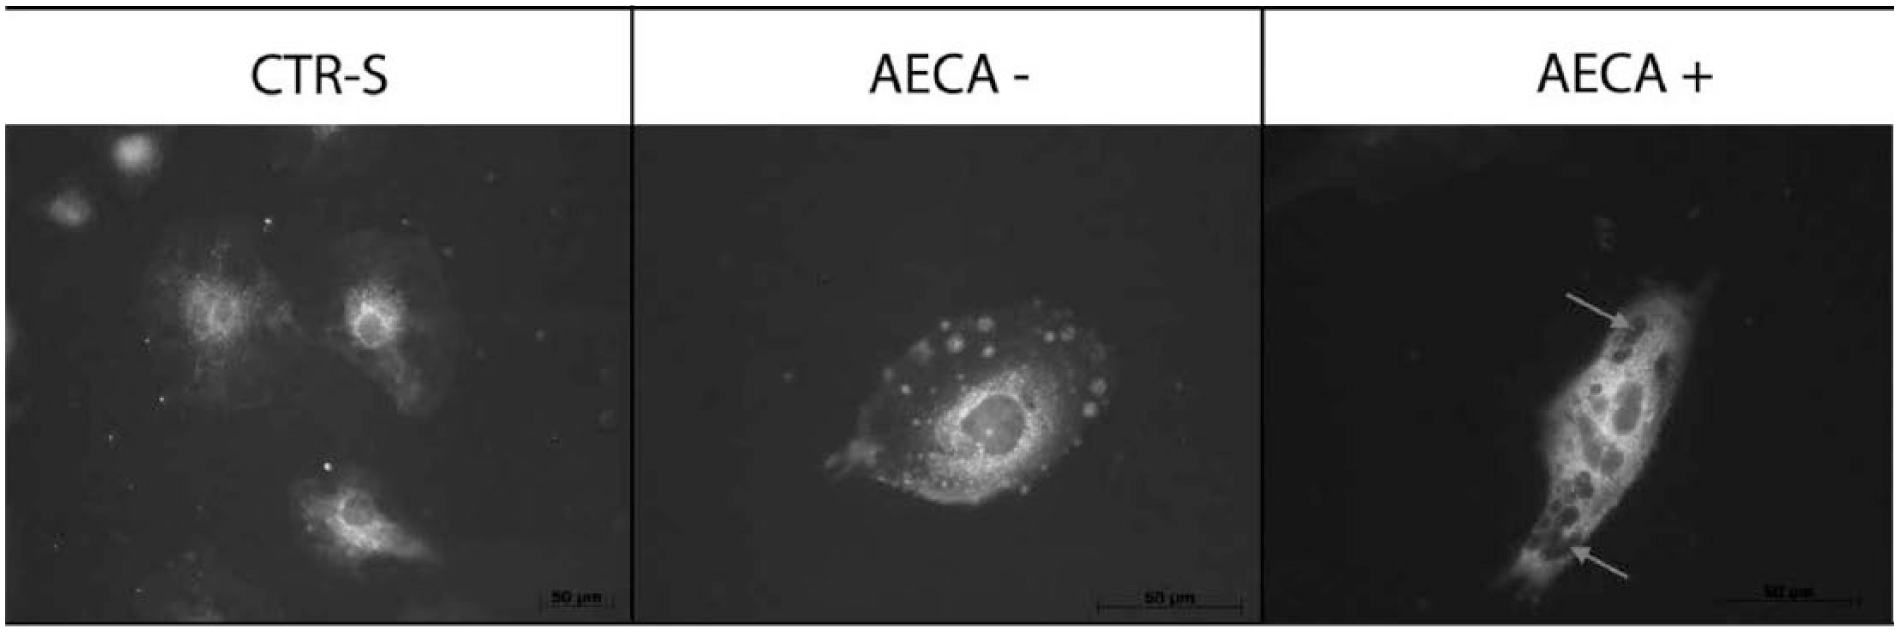
Morphological analysis of MVECs incubated for 48 h with control serum (CTR-S) (left), SSc AECA-negative serum (AECA–) (middle), and SSc AECA-positive serum (AECA+) (right), respectively. No changes in cell morphology were recorded in MVECs treated with control serum and with SSc AECA-negative serum, while MVECs treated with SSc AECA-positive serum showed the typical signs of apoptosis such as nuclear fragmentation and cytoplasmic vacuoles (arrows).
Fibroblast proliferation
In Figure 3, fibroblast (CTR, NA, and SSc) proliferation rates are reported after 48 h of treatment (end point). SSc fibroblasts were always more proliferative than NA and CTR fibroblasts (*P <0.05, **P <0.01). Moreover, comparing the absolute values in each group, fibroblast proliferation rates were always higher in the ‘SSc AECA+ serum’ group in respect to the ‘no serum’ group (P <0.01), to the ‘CTR serum’ group (P <0.01) and to the ‘SSC AECA– serum’ group (P <0.05). NA fibroblasts were also statistically more proliferative than the CTR ones in ‘CTR serum’ and ‘SSc AECA– serum’ groups.
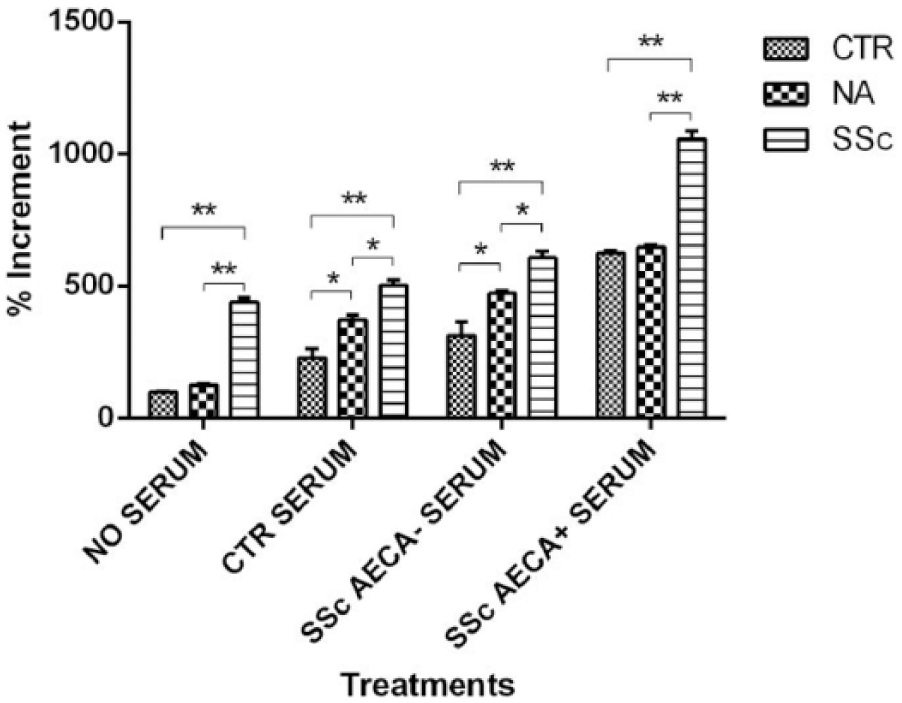
Proliferation rates after 48 h of control fibroblasts (CTR), SSc non-affected-skin fibroblasts (NA), and SSc affected-skin fibroblasts (SSc), respectively. Cells were divided into four groups represented by the MVEC conditioned media (no serum, control serum, SSc AECA– serum, and SSc AECA+ serum). Proliferation rates are represented as the % increment in respect to CTR fibroblasts of the first group incubated in absence of serum (100% proliferative). Statistical analysis (ANOVA and Tukey’s) for each group is represented (*P <0.05, **P <0.01). The experiments were repeated three times.
Western blotting and immunocytochemistry
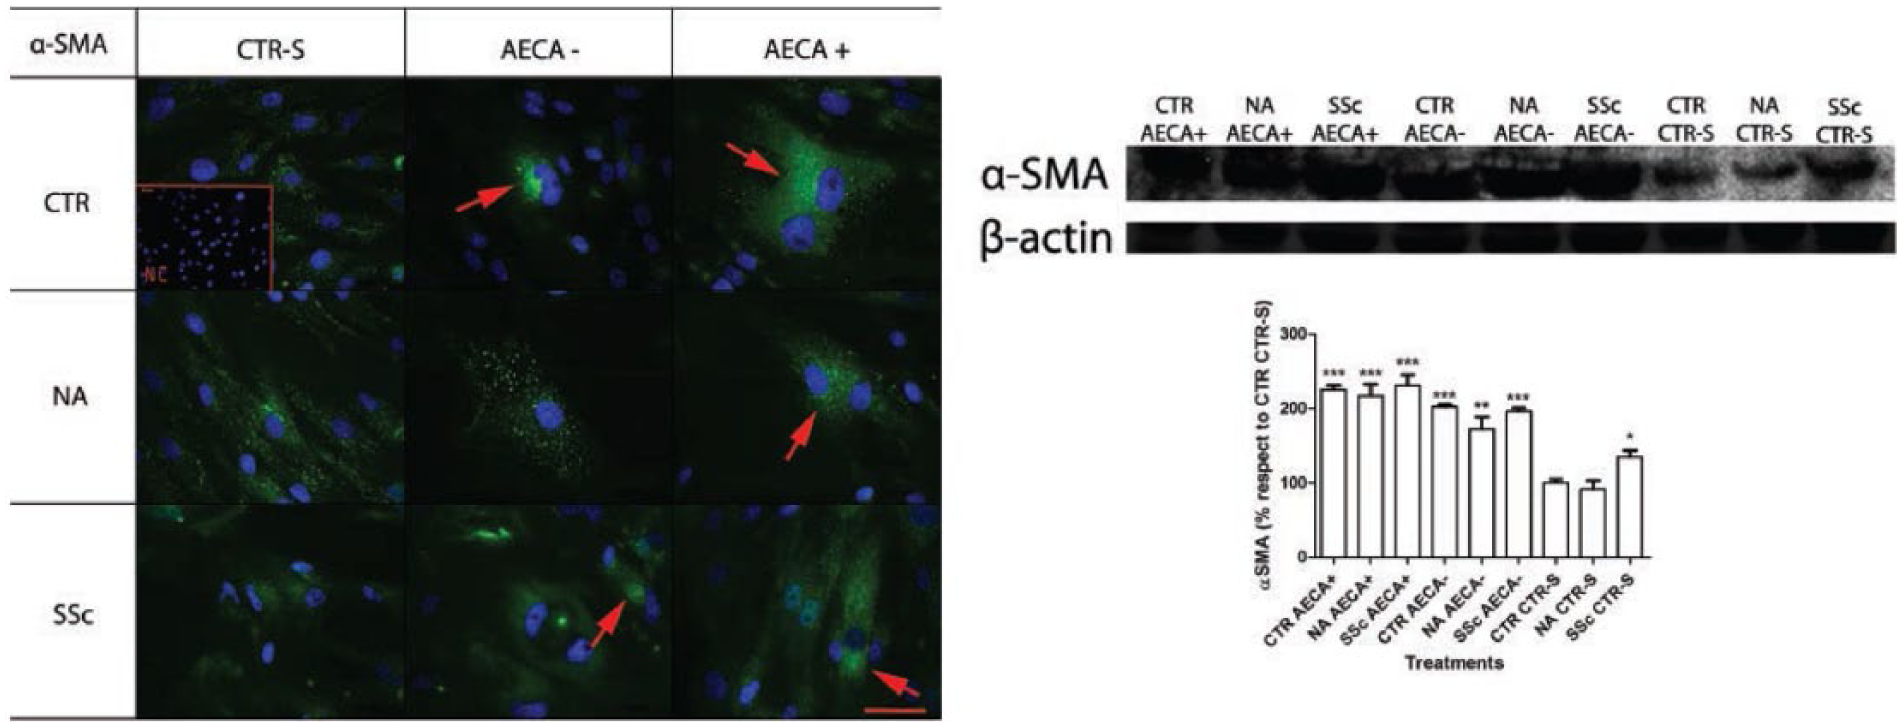
Figure 4 shows the immunocytochemistry (left) and the western blotting analysis (right) with the relative densitometric values for αSMA. αSMA was overexpressed in fibroblasts (CTR, NA, and SSc) treated with conditioned media containing sclerodermic sera (both AECA+ and AECA–), in respect to fibroblasts treated with conditioned media containing control sera (P <0.001). Even if there were no statistically relevant changes between αSMA levels found in fibroblasts treated with AECA+ and AECA– conditioned media, the absolute αSMA values were always higher in fibroblasts treated with AECA+ conditioned media, in respect to those treated with AECA– conditioned media. Type I collagen expression was upregulated by the conditioned media containing sclerodermic sera, in respect to control sera (Figure 5). Finally, Figure. 6 shows the TGF-β expression by immunocytochemistry (left), and western blotting (right) with the relative densitometric values. Fibroblasts (CTR, NA, and SSc) treated with conditioned media containing AECA+ showed TGF-β overexpression, in comparison to fibroblasts treated with conditioned media containing AECA– SSc sera and control sera (P <0.001). Conditioned media without AECA also contributed to slight TGF-β increase, compared to control conditioned media.
Negative control (NC). (

Negative control (NC). (

Negative control (NC). (
Discussion
In our opinion, one of the most important goals in research on SSc would be to find the link between microvascular injury and fibrosis. With this in mind, in the study of AECA, we ventured to investigate the possible inter-relationship between AECA, endothelial dysfunction, and dermal fibrosis. More than three decades ago, AECA were detected in sera from patients with various rheumatic diseases. 22 Nowadays, thanks to a good standardization of the technique (the method most widely used for detection of AECA is ELISA), 23 much more attention is given to AECA in the studies on rheumatic disorders leading to SSc: therefore, by deeply analyzing the presence and role of AECA, in our opinion it is reasonable to hypothesize that AECA could be the ‘culprit’ of fibroblast dysfunction related to SSc microvascular injury. It is important to underline that the use of MVECs is based on the evidence that the onset of SSc vascular lesions is related to the microvasculature, 24 , because these kind of cells are able to release chemotactic factors and mitogen mediators directed to fibroblasts. 24 According to a previous study, 25 we demonstrated that, when MVECs were treated with SSc sera, AECA stimulated MVECs to overproduce ET-1. These findings are relevant because it is known that ET-1 is able to activate the surface expression of intercellular adhesion molecule-1 on fibroblasts; 26 moreover, it stimulates fibroblasts to exhibit potent procontractile properties promoting the formation of highly contractive myofibroblasts.27,28 Some in vitro studies, carried out on patients affected by SLE, demonstrated that ET-1 release increases after incubation of human umbilical vein endothelial cells (HUVECs) with AECA-positive sera.11,29 In our SSc patients, ET-1 levels recorded in MVECs media containing AECA were two times higher than the ones recorded in media without AECA and in control media. After the first step, when MVECs are under stimulation, AECA became responsible for MVEC apoptosis.30,31 This last phenomenon has been reported in literature. In fact, recent studies showed that, after incubation of MVECs with AECA isolated from SSc sera, it was possible to observe the expression of phosphatidylserine on the surface of the cells; moreover, the cellular characteristics of apoptosis became evident.9,32 Another study showed that AECA-induced MVEC apoptosis in SSc is mediated by antibody-dependent cytotoxicity mechanism via CD95.40 The same experiments carried out with AECA-negative SSc serum samples, were negative for apoptosis. 33 We showed that apoptosis occurred in MVECs incubated for 48 h with AECA-positive SSc serum samples. In contrast, no signs of apoptosis were found in MVECs incubated with AECA-negative SSc serum samples or control serum samples. After short-term challenging (48 h), MVEC-conditioned media induced different responses on fibroblasts, in terms of production of three fibrotic mediators: αSMA, type I collagen, and TGF-β. αSMA expression was upregulated in fibroblasts treated with SSc conditioned media both with and without AECA, in comparison to fibroblasts treated with control conditioned media. These findings seem to be important for two reasons. First of all, both AECA-positive and AECA-negative conditioned media contain ANA, ENA, and other serum cytokines: it is possible to hypothesize that the greatest contribution to αSMA regulation should be due to the above-mentioned mediators more than AECA. Second, by analyzing the densitometric values, and comparing AECA-positive and -negative conditioned media, we observed that αSMA levels were always higher in fibroblasts (CTR, NA, and SSc) challenged with AECA-positive conditioned media, more than in fibroblasts challenged with AECA-negative ones. Based on the latter finding, we can hypothesize a cooperation between ANA, ENA, serum cytokines, and AECA in αSMA upregulation. Similar results were found for type I collagen expression. Upregulation of type I collagen was recorded in SSc conditioned media (with and without AECA): this may indicate that AECA are involved in type I collagen synthesis in collaboration with other soluble factors and cytokines. In this regard, Denton et al. showed that soluble factors, released by endothelial cells in co-cultures, modulate fibroblast properties, suggesting that regulation of fibroblast properties related to collagen synthesis is not restricted to cells of endothelial origin.34,35 Finally, in our opinion, the most interesting result concerns TGF-β production. In fact, the TGF-β secretion by fibroblasts seems positively correlated to the presence of AECA. While both αSMA and type I collagen expressions seem not strictly correlated to AECA rather than to other autoantibodies and cytokines in SSc serum, TGF-β synthesis is upregulated mainly by AECA, as shown by the great difference in TGF-β levels between fibroblasts stimulated with SSc AECA-positive and SSc AECA-negative conditioned media. Finally, regarding the differences among the different cell phenotypes, we demonstrated that SSc fibroblasts were always more proliferative than NA and CTR ones; in addition, we showed that cell phenotype differences changed according to different stimulating conditions: αSMA analysis revealed that in basal condition (stimulation with control sera) CTR fibroblasts showed lower αSMA levels than NA and SSc ones, while under AECA– and AECA+ sera stimulation there were no differences between the three cell phenotypes. In conclusion, our study seems to indicate that AECA might play a role in SSc, for the following reasons: (1) AECA are responsible for increased ET-1 secretion by MVECs; (2) AECA can exert effects on upregulation of pro-contractile proteins by fibroblasts (stimulating TGF-β secretion); (3) The above-mentioned effect (point (2)), probably in cooperation with other autoantibodies (ANA) and serum cytokines, is evidenced by αSMA and type I collagen increased synthesis. It follows that AECA are not only an epiphenomenon, but rather factors able to affect the onset and development of SSc, considered by us an ‘endothelium-derived fibroblast disease’.
Footnotes
Declaration of conflicting interests
The author(s) declared no potential conflicts of interest with respect to the research, authorship, and/or publication of this article.
Funding
This research received no specific grant from any funding agency in the public, commercial, or not-for-profit sectors.