
Abstract
Purpose
This study aimed to identify genes associated with sensitivity to anti-programmed death-ligand 1 (PD-L1) immunotherapy in lung squamous cell carcinoma (LUSC) using bioinformatics approaches and to validate their functional relevance through in vitro experiments.
Methods
Transcriptomic datasets from The Cancer Genome Atlas were analyzed to screen candidate genes, and UBE2C was identified as a key target. Functional enrichment analysis (Gene Ontology (GO) and Kyoto Encyclopedia of Genes and Genomes (KEGG) was performed to explore its potential biological roles. To investigate its regulatory effects, UBE2C was overexpressed or silenced in LUSC cells, with or without PD-L1 inhibitor treatment. Real time-quantitative polymerase chain reaction and Western blot were used to assess changes in gene/protein expression and pathway activation. Enzyme-linked immunosorbent assay and lactate dehydrogenase assays were employed to evaluate cytokine secretion (interferon (IFN)-γ, interleukin (IL)-2) and cytotoxicity. Additionally, immunofluorescence was used to examine UBE2C and PD-L1 co-expression in patient tissues stratified by PD-L1 expression levels.
Results
UBE2C expression was significantly higher in PD-L1 high-expression tissues than in low-expression tissues at both messenger RNA and protein levels. Compared with control groups, UBE2C overexpression activated the AKT/PI3 K pathway and increased IFN-γ and IL-2 secretion, whereas knockdown produced the opposite effect. Combined treatment with UBE2C overexpression and a PD-L1 inhibitor further enhanced cytokine release and cytotoxicity relative to PD-L1 inhibitor alone. Immunofluorescence analysis confirmed the co-localization of UBE2C and PD-L1 in tissues with high PD-L1 expression.
Conclusion
UBE2C was identified as a gene associated with increased sensitivity to anti-PD-L1 immunotherapy in LUSC. Functional experiments suggest that UBE2C may enhance anti-tumor immune responses and improve immunotherapy efficacy, providing a potential biomarker and therapeutic target for personalized treatment.
Introduction
Lung squamous cell carcinoma (LUSC) is one of the major subtypes of non-small cell lung cancer, accounting for approximately 25–30% of all lung cancer cases.1,2 According to the 2022 global cancer burden data, there are approximately 2.48 million new cases of lung cancer, accounting for 12.4% of the total number of new cancer cases worldwide, making it the most common cancer type worldwide.3,4 The prognosis of patients with LUSC is poor, with a 5-year survival rate of less than 20%. Traditional treatments such as surgery, chemotherapy, and radiotherapy can partially delay disease progression, but their efficacy is limited and drug resistance is frequent, making it difficult to improve patient prognosis. 5 In recent years, with the clinical application of immune checkpoint inhibitors, especially inhibitors targeting programmed death ligand 1 (PD-L1), the therapeutic prospects of LUSC have gradually improved. These drugs have achieved significant efficacy in some patients by removing immunosuppression in the tumor microenvironment and restoring T-cell function.6,7 However, significant challenges remain in achieving widespread and durable therapeutic effects.
Although anti-PD-L1 immunotherapy has brought clinical benefits to some LUSC patients, its overall effectiveness is still less than 25%. Its limitations mainly include: the heterogeneity of PD-L1 expression limits the accuracy of efficacy prediction; the immunosuppressive state in the tumor microenvironment reduces the reactivity of T cells; the unclear regulatory mechanisms of PD-L1-related downstream signaling pathways further limit therapeutic improvement.8,9 For example, PD-L1 may regulate tumor immune evasion and drug resistance through its downstream signaling proteins, and specific gene regulation may play a key role in this.10,11 Current research shows that the efficacy of immunotherapy not only depends on the expression of PD-L1, but is also affected by the expression of intrinsic genes of tumor cells and the activation of signaling pathways.12,13 However, there are currently few studies on these mechanisms, especially the lack of systematic studies on specific genes in LUSC.
In recent years, with the rapid development of bioinformatics technology, screening key genes through multi-omics data and public databases (such as The Cancer Genome Atlas (TCGA) and Gene Expression Omnibus) has become a research hotspot.14,15 Bioinformatic tools have been used to identify potential genetic markers that may influence the efficacy of immunotherapy. 16 These genes are usually involved in processes such as tumor cell proliferation, migration, and immune microenvironment regulation. For example, some genes affect tumor immune escape by regulating classic signaling pathways such as PI3 K and STAT3.17,18 However, few studies have focused on LUSC, and the regulatory mechanisms linking PD-L1 expression to immunotherapy sensitivity remain poorly understood. In addition, most current research remains at the data analysis stage and lacks systematic verification based on in vivo and in vitro experiments. Therefore, it is of great significance to deeply explore the key genes related to immunotherapy in the context of LUSC and clarify their mechanisms of action.
This study used bioinformatics approaches to identify key genes associated with sensitivity to anti-PD-L1 therapy and validated their roles in LUSC through in vitro experiments. The study further explored the regulatory network related to PD-L1 and analyzed the associations between the candidate genes and critical signaling pathways. This work aims to provide a theoretical basis for optimizing immunotherapy strategies and to identify new potential targets for personalized treatment of patients with LUSC.
Materials and methods
Data extraction
This study obtained transcriptomic data and corresponding clinical survival information for LUSC from TCGA database (https://portal.gdc.cancer.gov/projects/TCGA-LUSC). Both tumor and matched normal control samples were included in the analysis. All data were processed and standardized using R software (version 4.4.0). Genes with low expression levels or excessive missing values were excluded, and transcriptomic data were matched with survival data to ensure completeness and reliability, thus providing a robust foundation for downstream analyses.
Differential expression analysis
Differential expression analysis was performed using the DESeq2 package in the R language, and gene expression differences between cancer and normal groups were analyzed by constructing an expression matrix model. The screening criteria were set as an adjusted P-value < 0.05 (Benjamini–Hochberg correction) and |Log2FC| > 4. The significantly dysregulated genes were subjected to Gene Ontology (GO) and Kyoto Encyclopedia of Genes and Genomes (KEGG) enrichment analyses using the clusterProfiler package, to identify enriched biological processes and signaling pathways, thus facilitating the subsequent selection of key genes.
Identification of key genes
The protein-protein interaction (PPI) network of differentially expressed genes was constructed using the STRING database (https://string-db.org/), and the interaction score threshold was set to 0.9 (high confidence). The PPI network was visualized using Cytoscape software, and clustering with the MCODE plugin was performed to detect densely connected regions. Key genes within these subnetworks were further refined by applying a least absolute shrinkage and selection operator (LASSO) regression model. Candidate genes were then visualized through box plots, and their potential clinical significance was evaluated using Kaplan–Meier survival analysis.
Cell culture and grouping
The human LUSC cell line (NCI-H520) was obtained from the American Type Culture Collection (HTB-182) and cultured in RPMI-1640 medium supplemented with 10% fetal bovine serum at 37°C in a 5% CO₂ incubator. The medium was replaced regularly to maintain viability, and cell vitality was confirmed before each experiment. The following experimental groups were established: (a) Control group: untreated cells; (b) PD-L1 inhibitor group: cells treated with a PD-L1 inhibitor (10 µg/mL) for 24 h; (c) candidate gene overexpression group: cells transfected with the UBE2C overexpression plasmid; (d) candidate gene knockdown group: cells transfected with short hairpin RNA (shRNA) or small interfering RNA (siRNA); (e) overexpression + PD-L1 inhibitor group: cells first transfected with the UBE2C overexpression plasmid, followed by treatment with a PD-L1 inhibitor (10 µg/mL) for 24 h; (f) knockdown + PD-L1 inhibitor group: cells first transfected with shRNA or siRNA, followed by treatment with a PD-L1 inhibitor (10 µg/mL) for 24 h.
Tissue samples and grouping
For tissue analysis, samples were obtained from 20 pathologically confirmed LUSC patients, with 10 patients per group. All patients provided written informed consent, and the study protocol was approved by the institutional ethics committee (Approval No. G-KY2546). Immunohistochemistry was used to assess PD-L1 expression, and samples were classified into high-expression (n = 10, positive cell ratio > 50%) and low-expression (n = 10, ≤ 50%) groups. The high PD-L1 group was used to evaluate the expression profile of candidate genes under PD-L1 overexpression, while the low PD-L1 group served as a comparative baseline.
Reverse transcription-quantitative polymerase chain reaction
Total RNA was extracted from cells using TRIzol reagent (Thermo Fisher Scientific, 15596018), and complementary DNA (cDNA) was synthesized using the SuperScript III reverse transcription kit (Thermo Fisher Scientific, 18080051). Real time-quantitative polymerase chain reaction (RT-qPCR) was performed using the SYBR Green PCR Master Mix on a StepOnePlus™ Real-Time PCR system. The thermal cycling conditions were: 95°C for 10 min (initial denaturation), followed by 40 cycles of 95°C for 15 s and 60°C for 30 s. Each group was tested in triplicate. Gene expression levels were analyzed using the 2-ΔΔCt method, and normalized to GAPDH as the internal reference.
Western blot
Western blot was used to detect the expression of candidate genes and key proteins in their downstream signaling pathways. Total protein was extracted from cells or tissues using RIPA lysis buffer (Guangzhou Yujia Biotechnology Co., Ltd, P0013B, China), and concentrations were determined using the BCA protein assay. Equal amounts of protein were separated via SDS-PAGE and transferred to PVDF membranes (Millipore, Burlington, MA, USA, IPVH00010). Membranes were blocked in 5% non-fat milk for 1 h at room temperature, followed by overnight incubation at 4°C with primary antibodies: Anti-UBE2C (Abcam, Cambridge, UK, ab252940, 1:1000), Anti-AKT (Abcam, ab8805, 1:1000), Anti-PI3 K (Abcam, ab283852, 1:1000), Anti-STAT3 (Abcam, ab68153, 1:1000) and Anti-GAPDH (Abcam, ab8245, 1:5000). After washing, membranes were incubated with HRP-conjugated secondary antibodies (1:5000) for 1 h at room temperature. Protein bands were visualized using ECL substrate (ThermoFisher Scientific, Waltham, MA, USA, 32106) and imaged. Grayscale intensity was quantified using ImageJ software, and normalized to GAPDH levels.
Lactate dehydrogenase cytotoxicity assay
Cytotoxicity was assessed using the lactate dehydrogenase (LDH) cytotoxicity assay kit (Beyotime, Shanghai, China, C0016), following the manufacturer's protocol. After experimental treatments, the culture supernatants were collected and incubated with the detection reagent at 37°C for 30 min. Absorbance was measured at 490 nm with a microplate reader. Each experiment was repeated in triplicate, and cytotoxicity levels were calculated as the average absorbance values.
Enzyme-linked immunosorbent assay
Cell culture supernatants from experimental groups were collected to measure the concentrations of immune cytokines interferon (IFN)-γ and interleukin (IL)-2 using commercial enzyme-linked immunosorbent assay (ELISA) kits (Guangzhou Yujia Biotechnology Co., Ltd, P0205S), according to the manufacturer's instructions. The samples and standards were added to the 96-well plate, incubated for 1 h, washed, and then incubated with biotin-labeled secondary antibodies, followed by HRP-conjugated enzyme and substrate solution. After stopping the reaction, absorbance was measured at 450 nm, and concentrations were calculated using a standard curve.
Immunofluorescence
Tissue sample sections were prepared and dewaxed with xylene (Guangzhou Yujia Biotechnology Co., Ltd, ST975–50 mL), followed by hydration using gradient ethanol. Antigen retrieval was conducted by microwave heating in citrate buffer (pH 6.0), and sections were blocked with 5% bovine albumin for 30 min at room temperature. The primary antibody (specific to the target proteins identified in the study) was applied to the sections and incubated overnight at 4°C. After washing, samples were incubated with fluorophore-conjugated secondary antibodies for 1 h in the dark. DAPI was used to counterstain nuclei, and slides were mounted using an anti-fade medium. Images were captured with a fluorescence microscope, and semi-quantitative analysis of fluorescence intensity and localization was performed.
Statistical analysis
All statistical analyses were performed using GraphPad Prism 8.0.2. Continuous variables are presented as mean ± SD. Differences between two groups were analyzed using Student's t-test, while comparisons among three or more groups were performed using one-way analysis of variance (ANOVA) followed by Tukey's post hoc test. The Kaplan–Meier survival analysis was used to evaluate the correlation between candidate gene expression and overall survival, with significance determined by log-rank test. A two-sided P-value < 0.05 was considered statistically significant.
Results
Screening and functional analysis of differentially expressed genes
Differential expression analysis based on transcriptomic data from 548 LUSC samples in the TCGA database identified 1538 significantly upregulated and 176 downregulated genes (adjusted P-value < 0.05, |Log2FC| > 4) (Figure 1(a)).
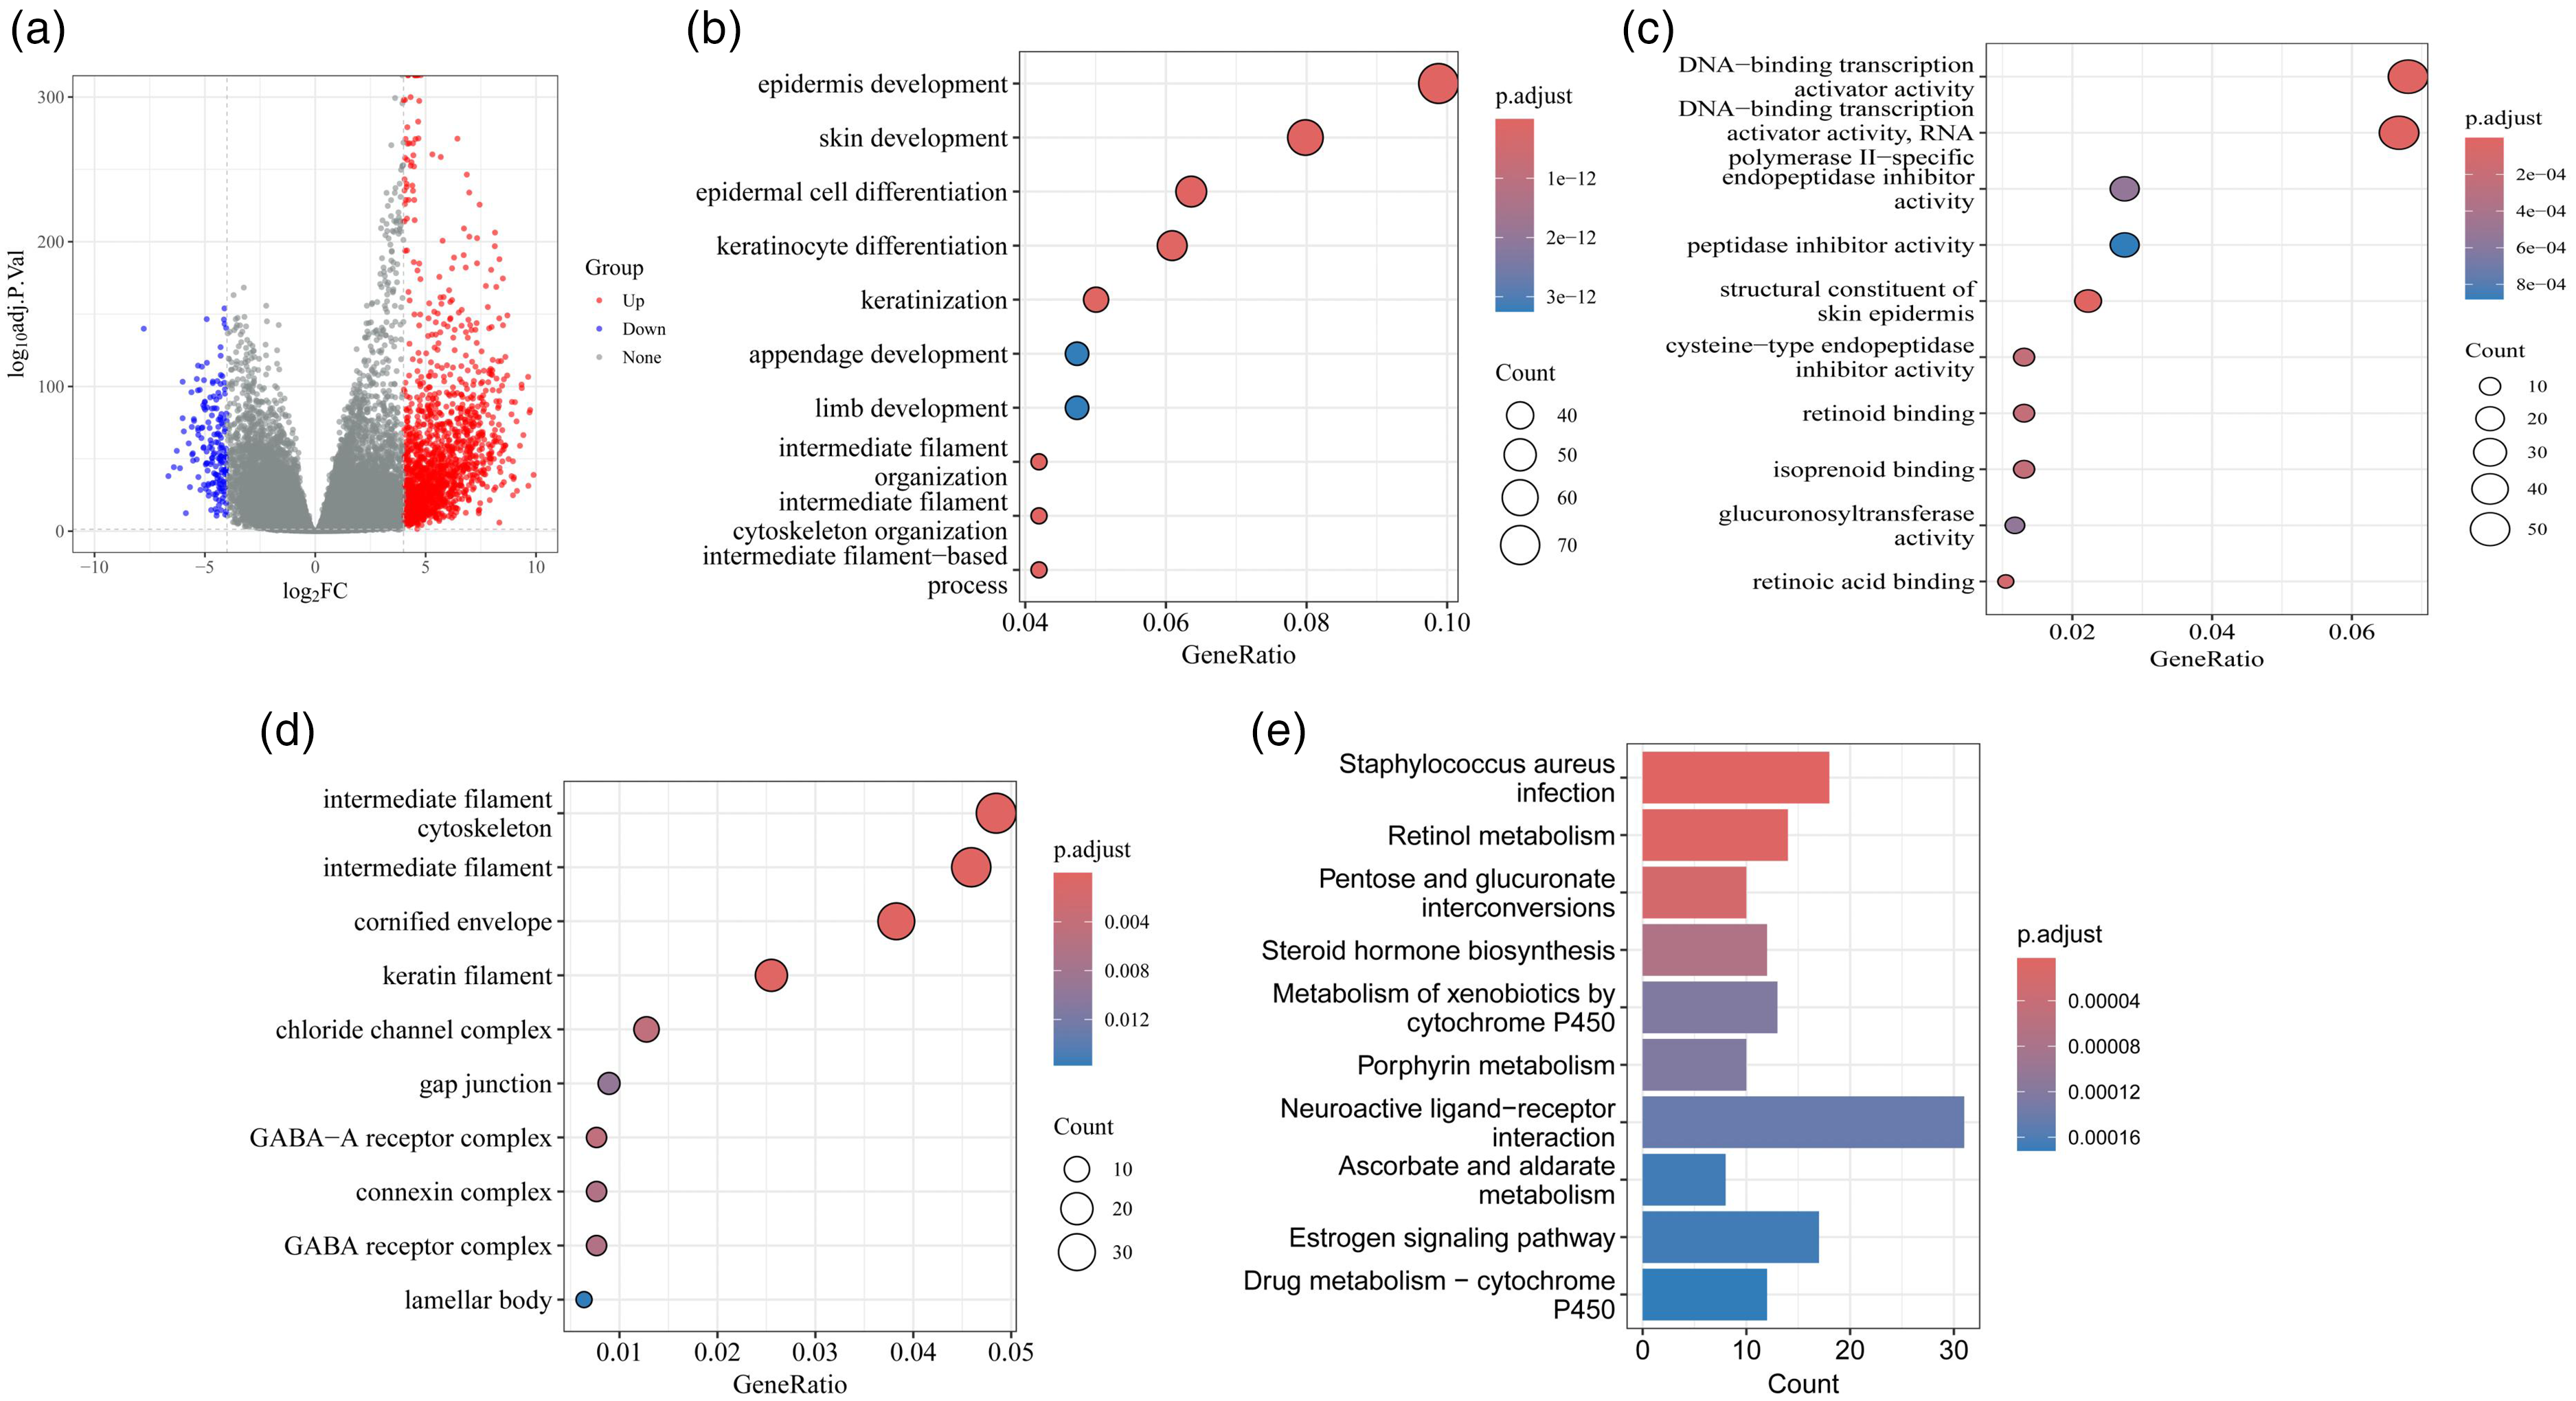
Analysis of differentially expressed genes and enrichment results. (a) Volcano plot showing significantly upregulated (red) and downregulated (blue) genes. (b) GO enrichment analysis for biological processes (BP) of differentially expressed genes. The top enriched terms include cell cycle regulation, DNA replication, and mitotic processes. (c) GO enrichment analysis for cellular components (CC). Differentially expressed genes were predominantly enriched in chromosomes, spindle structures, and nucleosomes. (d) GO enrichment analysis for molecular functions (MF). Key enriched functions include ATP binding, DNA binding, and microtubule binding. (e) KEGG pathway enrichment analysis. Differentially expressed genes were significantly enriched in pathways such as the cell cycle, p53 signaling pathway and DNA replication.
GO enrichment analysis revealed that these genes were primarily involved in biological processes such as epidermal development, keratinocyte differentiation, and mitotic cell cycle regulation (Figure 1(b)), suggesting a potential role in tumor proliferation and keratinization. In terms of cellular components, they were significantly enriched in intermediate filaments, cornified envelopes, and keratin structures (Figure 1(c)), reflecting structural changes characteristic of squamous differentiation. For molecular functions, enrichment was observed in DNA binding, adenosine triphosphate binding, and microtubule-related functions (Figure 1(d)), which are associated with cell cycle progression and cytoskeletal remodeling. KEGG pathway analysis revealed demonstrated significant enrichment in key oncogenic pathways, including the cell cycle, p53 signaling pathway, and DNA replication (Figure 1(e)). These findings highlight the molecular hallmarks of LUSC, particularly enhanced proliferation and impaired genome stability.
Key gene screening and expression analysis
A PPI network of differential genes was constructed through the STRING database, and the most densely connected subnetwork was identified via the MCODE plugin in Cytoscape, comprising 42 genes with high interaction confidence (Figure 2(a)). To refine key targets, a LASSO regression model was applied to the subnetwork genes, and E2F7, KIF2C, and UBE2C were selected based on the optimal λ value (Figure 2(b)). Expression analysis revealed that all three genes were significantly upregulated in LUSC tumor tissues compared with normal tissues (P < 0.0001, Figure 2(c)), indicating potential roles in LUSC tumorigenesis. Kaplan–Meier survival analysis further demonstrated that high expression levels of each gene were associated with significantly poorer overall survival, with UBE2C exhibiting the most pronounced prognostic value (Figure 2(d) to (f); P = 0.0034, P = 0.002, and P = 0.00051, respectively).
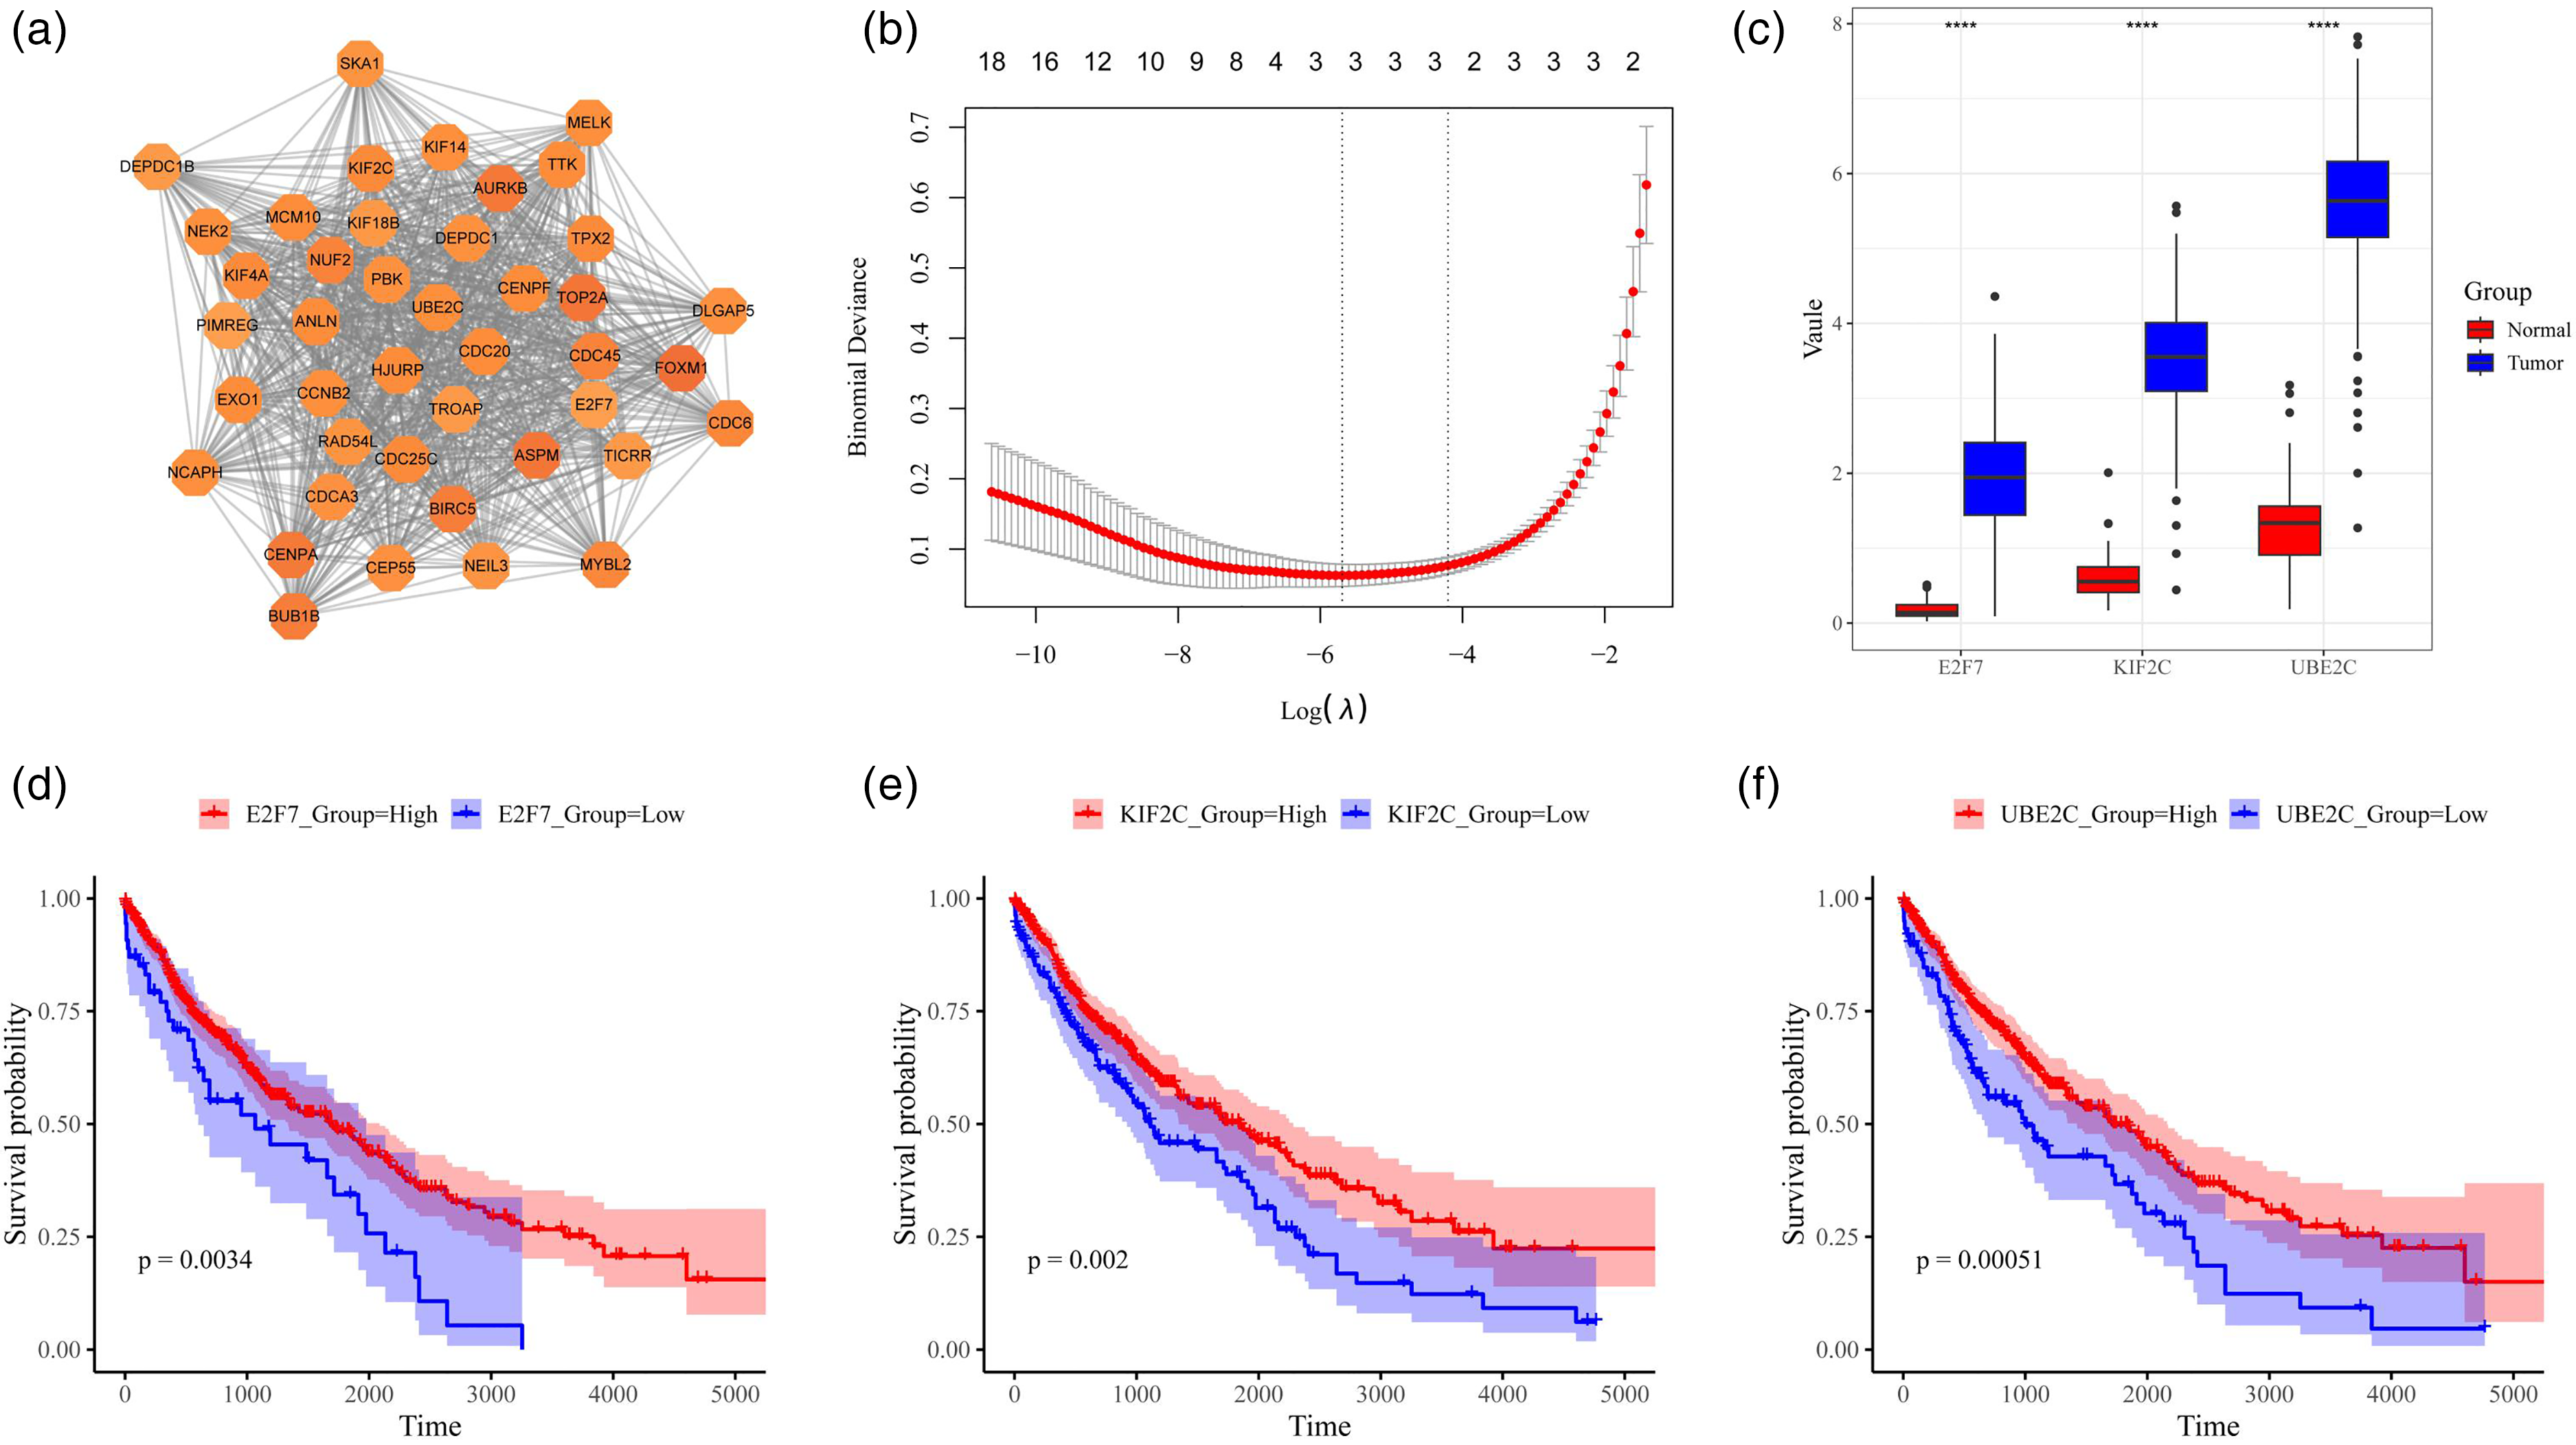
Identification and validation of key genes in LUSC. (a) PPI subnetwork of differentially expressed genes constructed using STRING and visualized in Cytoscape, with 42 core genes identified via MCODE clustering. (b) LASSO regression analysis showing the relationship between log(λ) and binomial deviance, with E2F7, KIF2C, and UBE2C selected at the optimal λ. (c) Expression levels of the three genes in tumor (n = 10) and normal tissues (n = 10). (d) to (f) Kaplan–Meier survival curves for E2F7, KIF2C, and UBE2C.
Expression characteristics of UBE2C in LUSC and its co-expression relationship with PD-L1
To explore the expression characteristics of UBE2C in LUSC cells and tissues, this study used RT-qPCR, Western blot, and immunofluorescence techniques to systematically analyze its expression levels in cell lines and patient tissues and its relationship with PD-L1. As shown in Figure 3(a), UBE2C messenger RNA (mRNA) levels were significantly elevated in the high PD-L1 expression group compared to the low PD-L1 group (P < 0.01). Consistently, Western blot analysis (Figure 3(b)) demonstrated increased protein levels of UBE2C, AKT, PI3 K, and STAT3 in high PD-L1 samples (all P < 0.01).
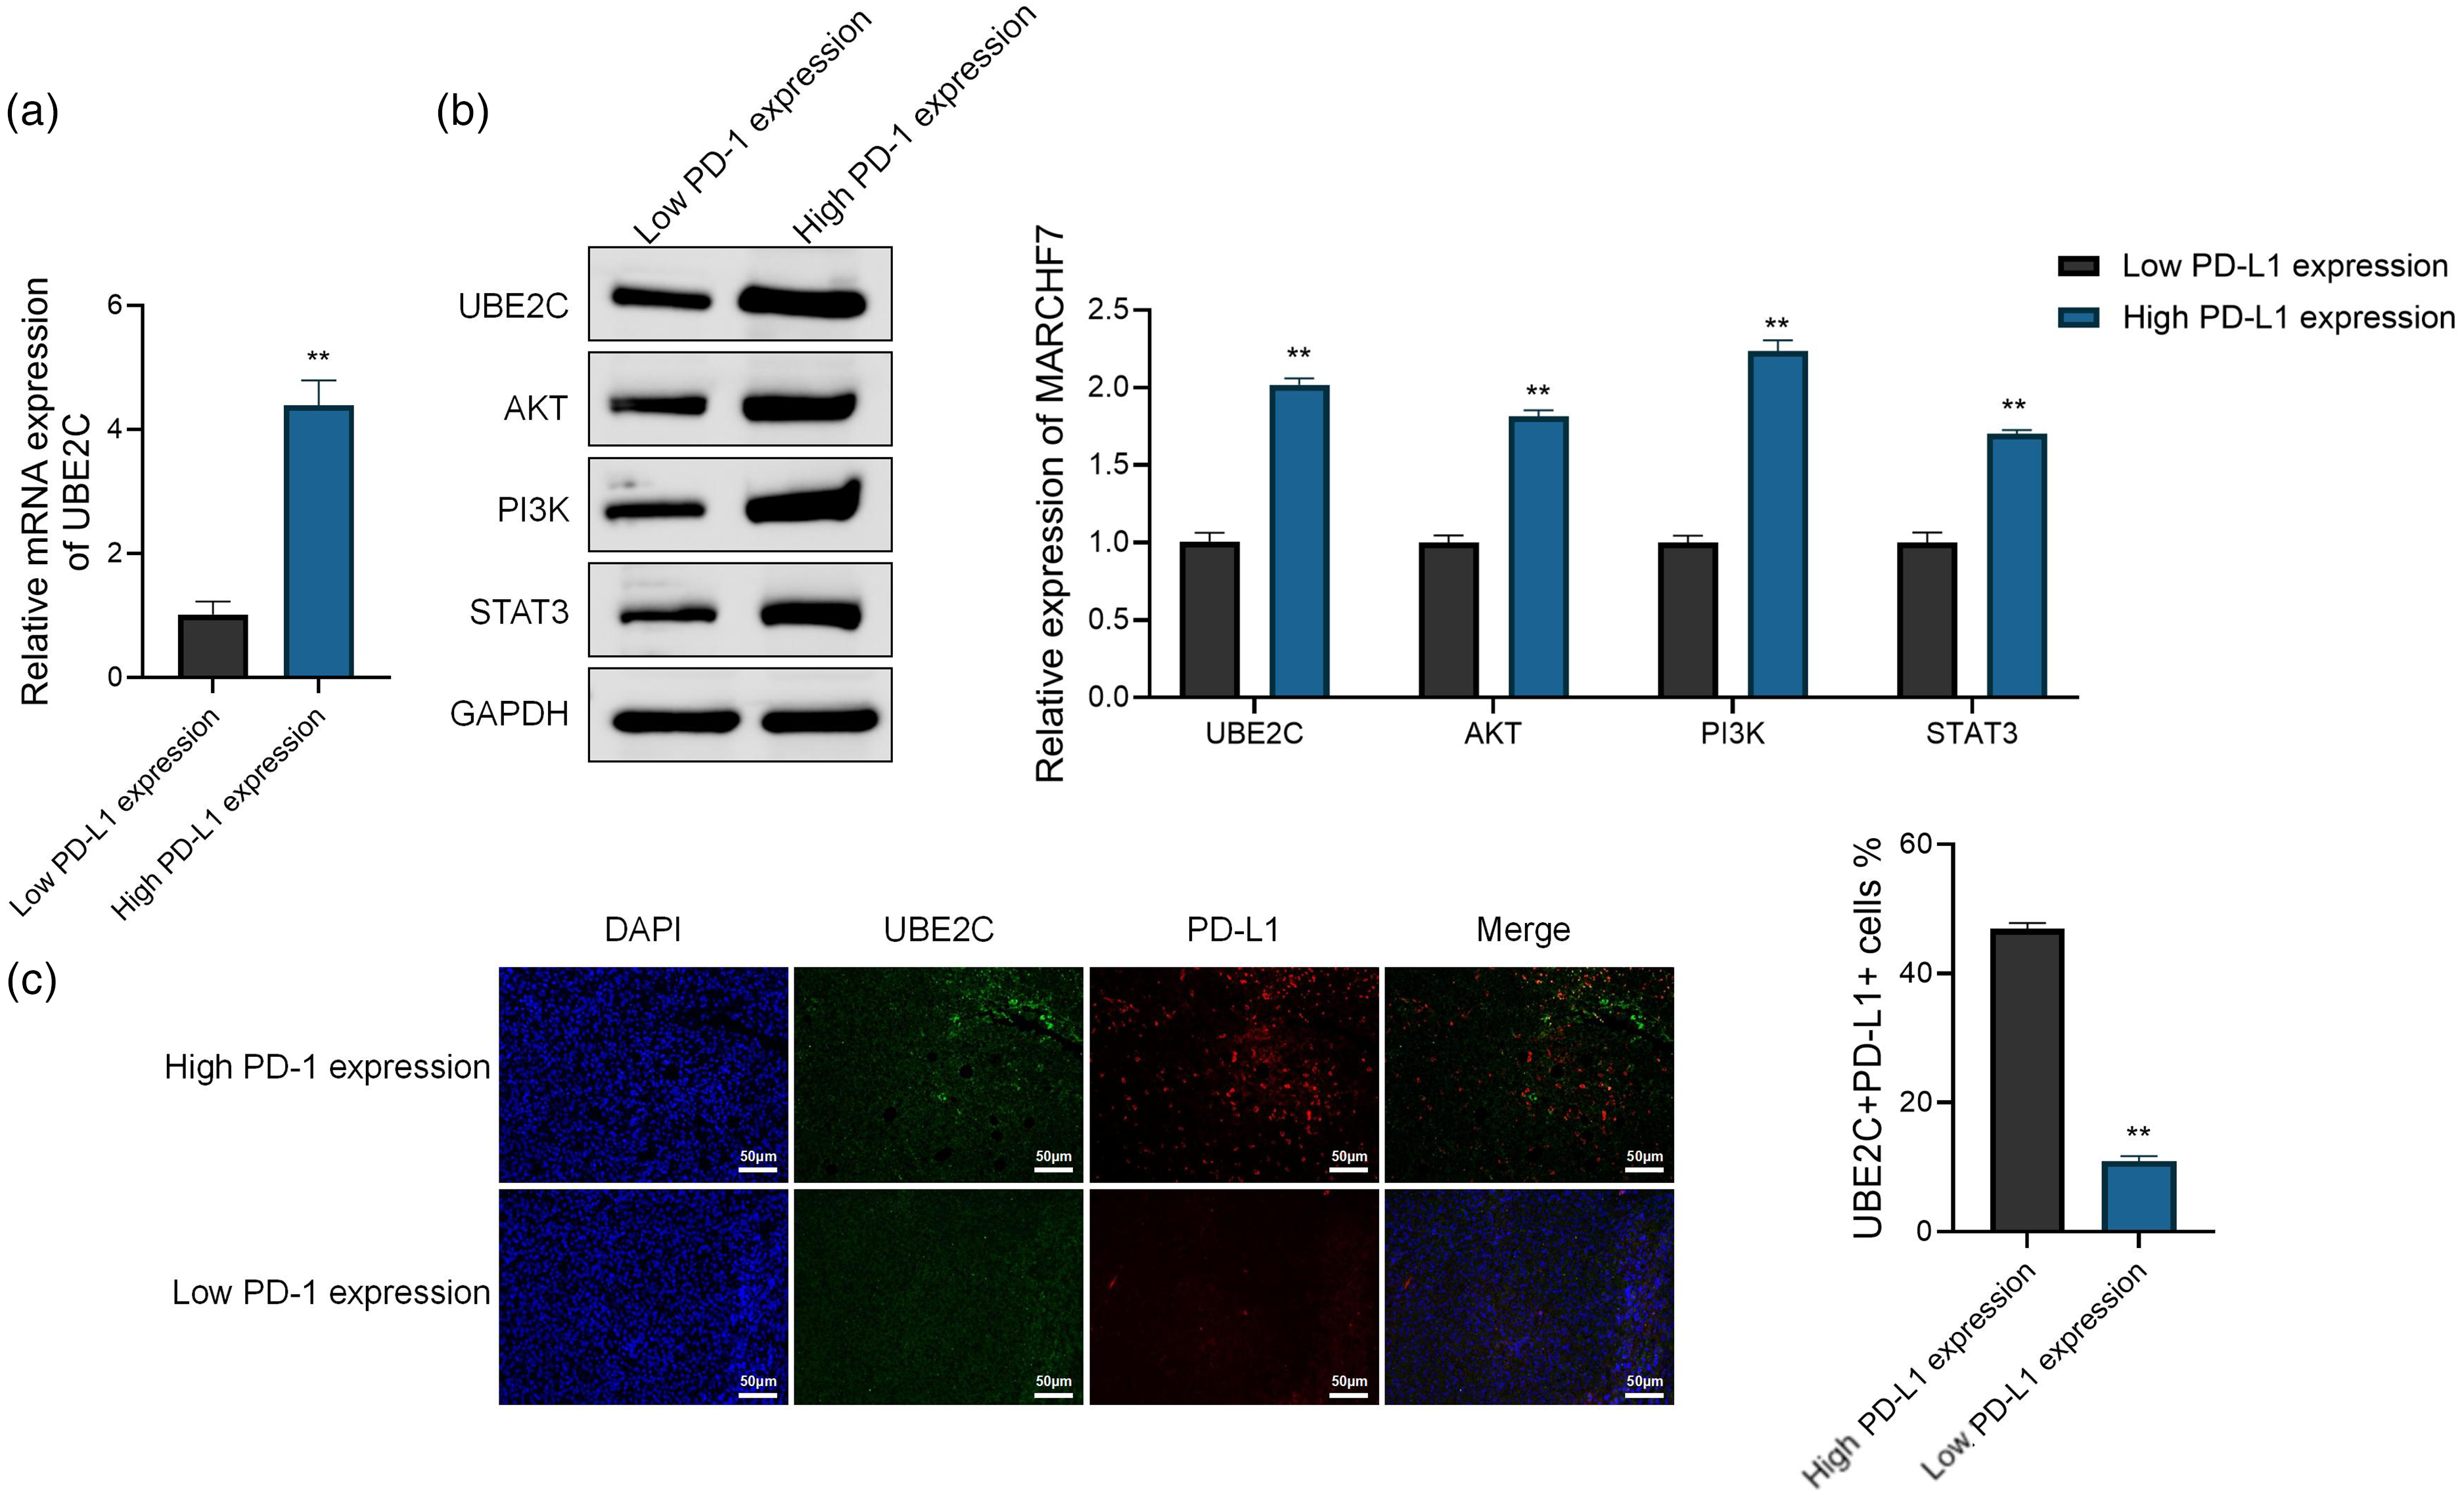
Expression profile of UBE2C and its co-localization with PD-L1 in LUSC. (a) RT-qPCR analysis of UBE2C mRNA levels in tissues with different PD-L1 expression. (b) Western blot analysis of UBE2C, AKT, PI3 K, and STAT3 protein levels in high and low PD-L1 groups. (c) Immunofluorescence images showing co-localization of UBE2C (green) and PD-L1 (red) in LUSC tissues. DAPI stains nuclei (blue); scale bars, 50 μm. Data represent the mean ± SD of three independent technical replicates. **P < 0.01 vs. low PD-L1 expression.
Furthermore, immunofluorescence analysis (Figure 3(c)) revealed spatial co-localization of UBE2C and PD-L1 in tissues with high PD-L1 expression. The proportion of UBE2C+/PD-L1+ double-positive cells was significantly higher in this group (P < 0.01), further indicating a potential functional association between these two molecules. Collectively, these findings suggest that UBE2C is upregulated in PD-L1-high LUSC tissues and may be functionally linked to PD-L1 expression.
Effect of UBE2C on phosphorylation levels of AKT/PI3 K and STAT3 signaling pathways
The AKT/PI3 K and STAT3 pathways are critical regulators of tumor cell proliferation and immune modulation.19,20 To assess the role of UBE2C, we examined its effects under different treatment conditions.
As shown in Figure 4(a), relative to the control, either PD-L1 inhibition or UBE2C overexpression significantly increased UBE2C mRNA levels (P < 0.01). When UBE2C overexpression was combined with PD-L1 inhibition, the levels increased further (P < 0.01), whereas UBE2C knockdown markedly reduced UBE2C mRNA (P < 0.01), and addition of a PD-L1 inhibitor under knockdown conditions did not significantly rescue expression.
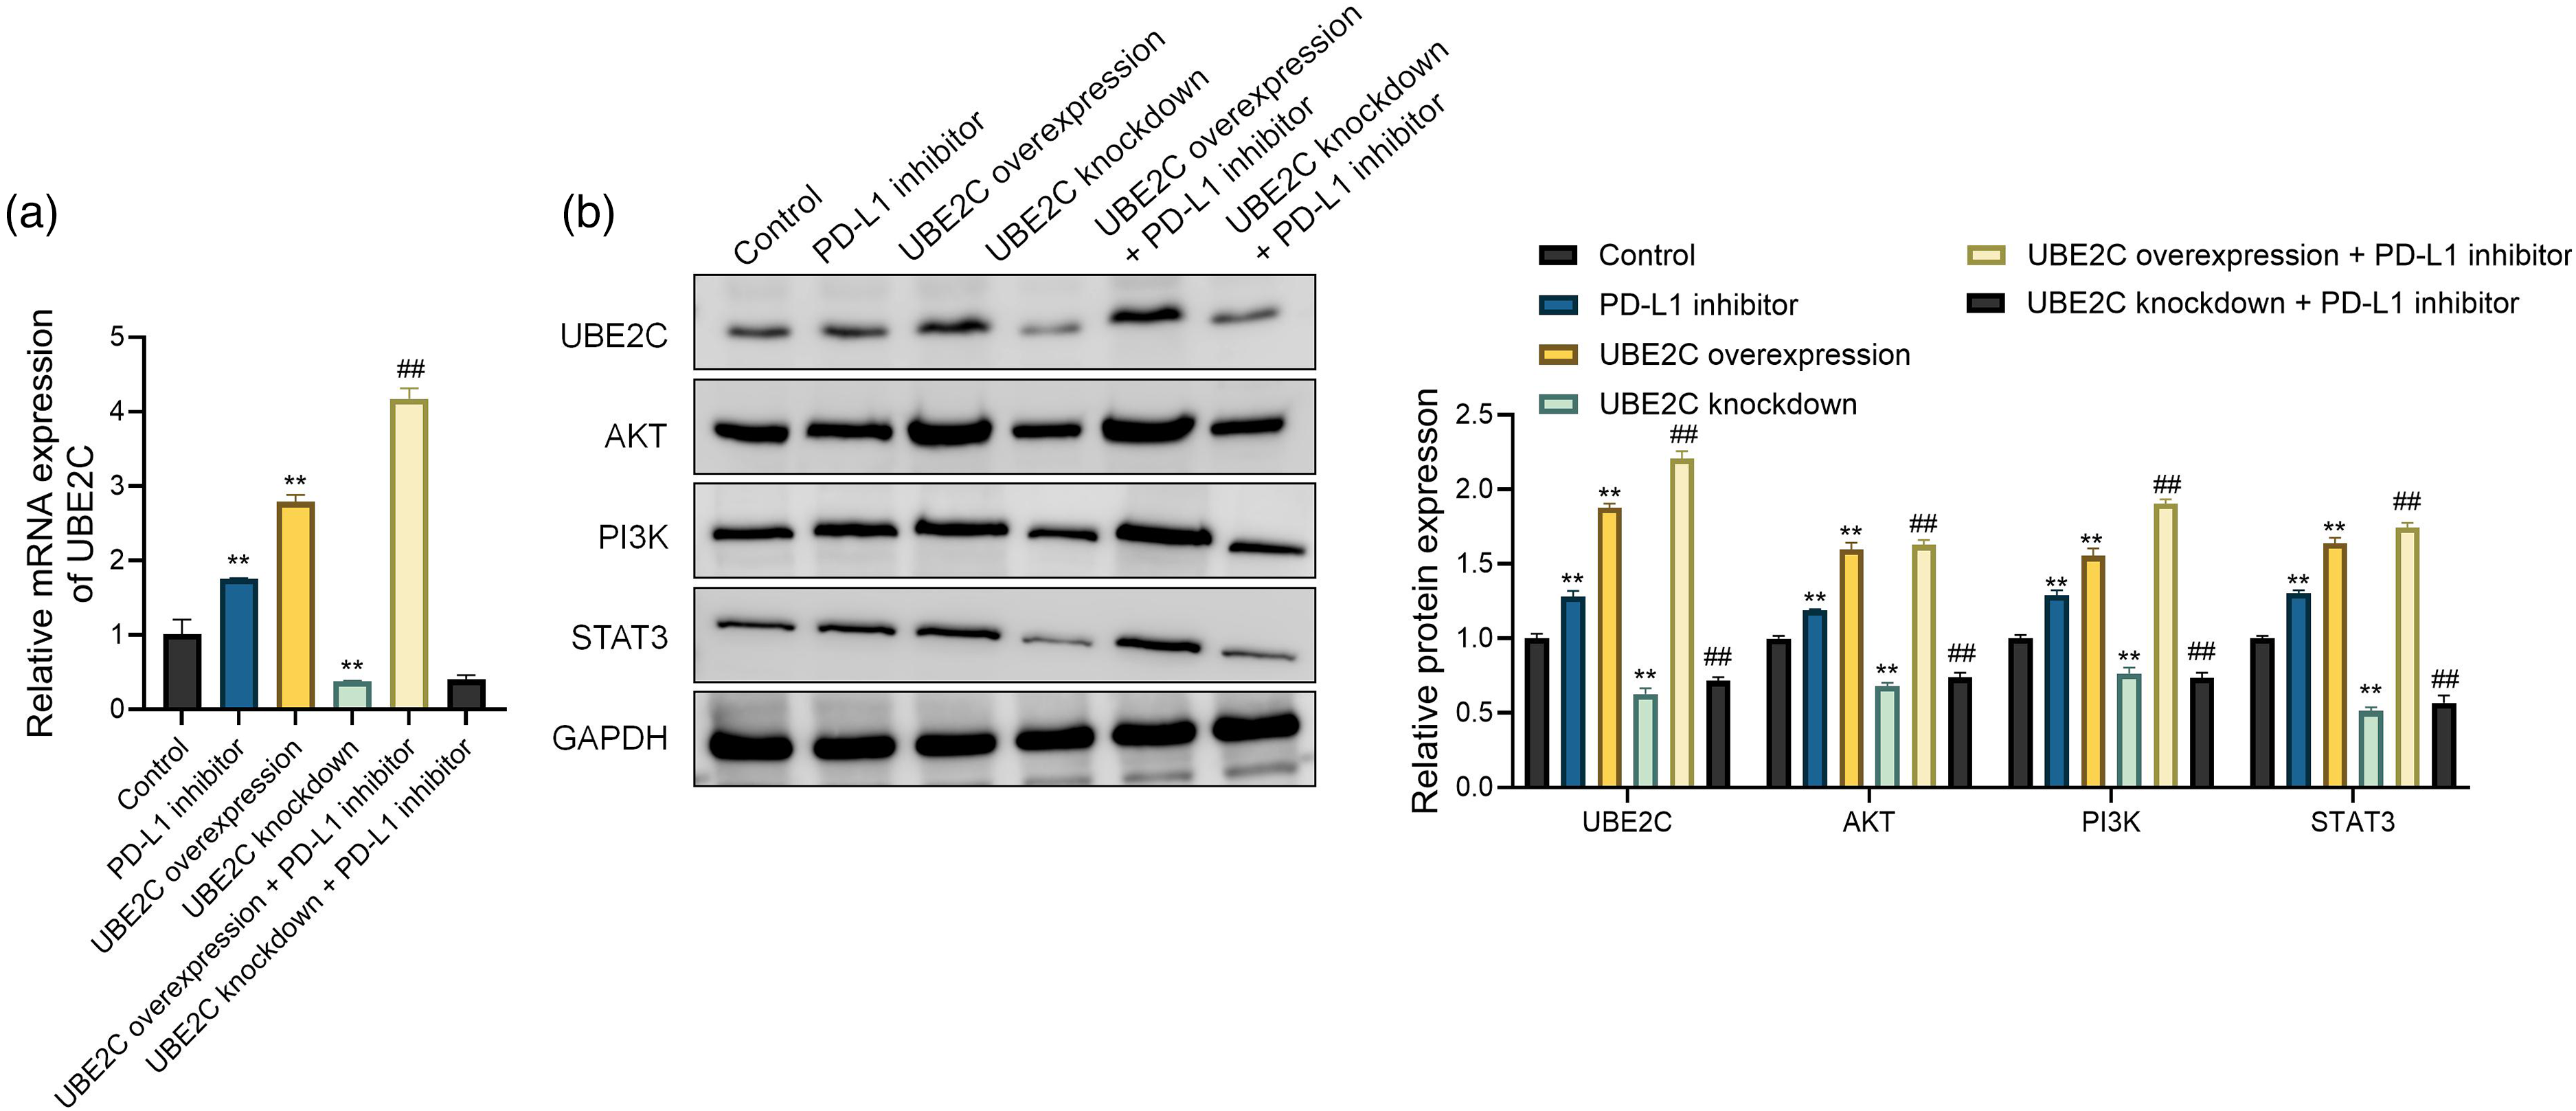
UBE2C modulates AKT/PI3 K and STAT3 signaling under different treatment conditions. (a) Relative mRNA expression levels of UBE2C in different experimental groups as determined by RT-qPCR. (b) Western blot a and quantitative analysis of UBE2C, AKT, PI3 K, and STAT3 protein levels. Data represent the mean ± SD of three independent technical replicates. **P < 0.01 vs control; ##P < 0.01 vs. PD-L1 inhibitor.
Western blot analysis (Figure 4(b)) confirmed that UBE2C overexpression enhanced the protein levels of AKT, PI3 K, and STAT3, while UBE2C knockdown significantly suppressed their expression (P < 0.01). Moreover, co-treatment with UBE2C overexpression and PD-L1 inhibitor resulted in further elevation of these protein levels, suggesting a potential synergistic effect. In contrast, UBE2C knockdown abolished the enhancing effects of PD-L1 inhibition on these pathways.
Collectively, these findings suggest that UBE2C may be involved in the regulation of AKT/PI3 K and STAT3 signaling pathways, which could contribute to enhanced immune responses and increased sensitivity of LUSC cells to PD-L1 blockade.
Function verification of UBE2C on cell proliferation and immune regulation
As shown in Figure 5(a), either PD-L1 inhibition or UBE2C overexpression alone significantly increased LDH release, while their combination further enhanced this effect, reaching the highest level. Under knockdown conditions, co-treatment with PD-L1 inhibitor resulted in levels that remained lower than those observed with PD-L1 inhibitor alone. IFN-γ and IL-2 exhibited trends consistent with those of LDH (Figure 5(b) and (c)).
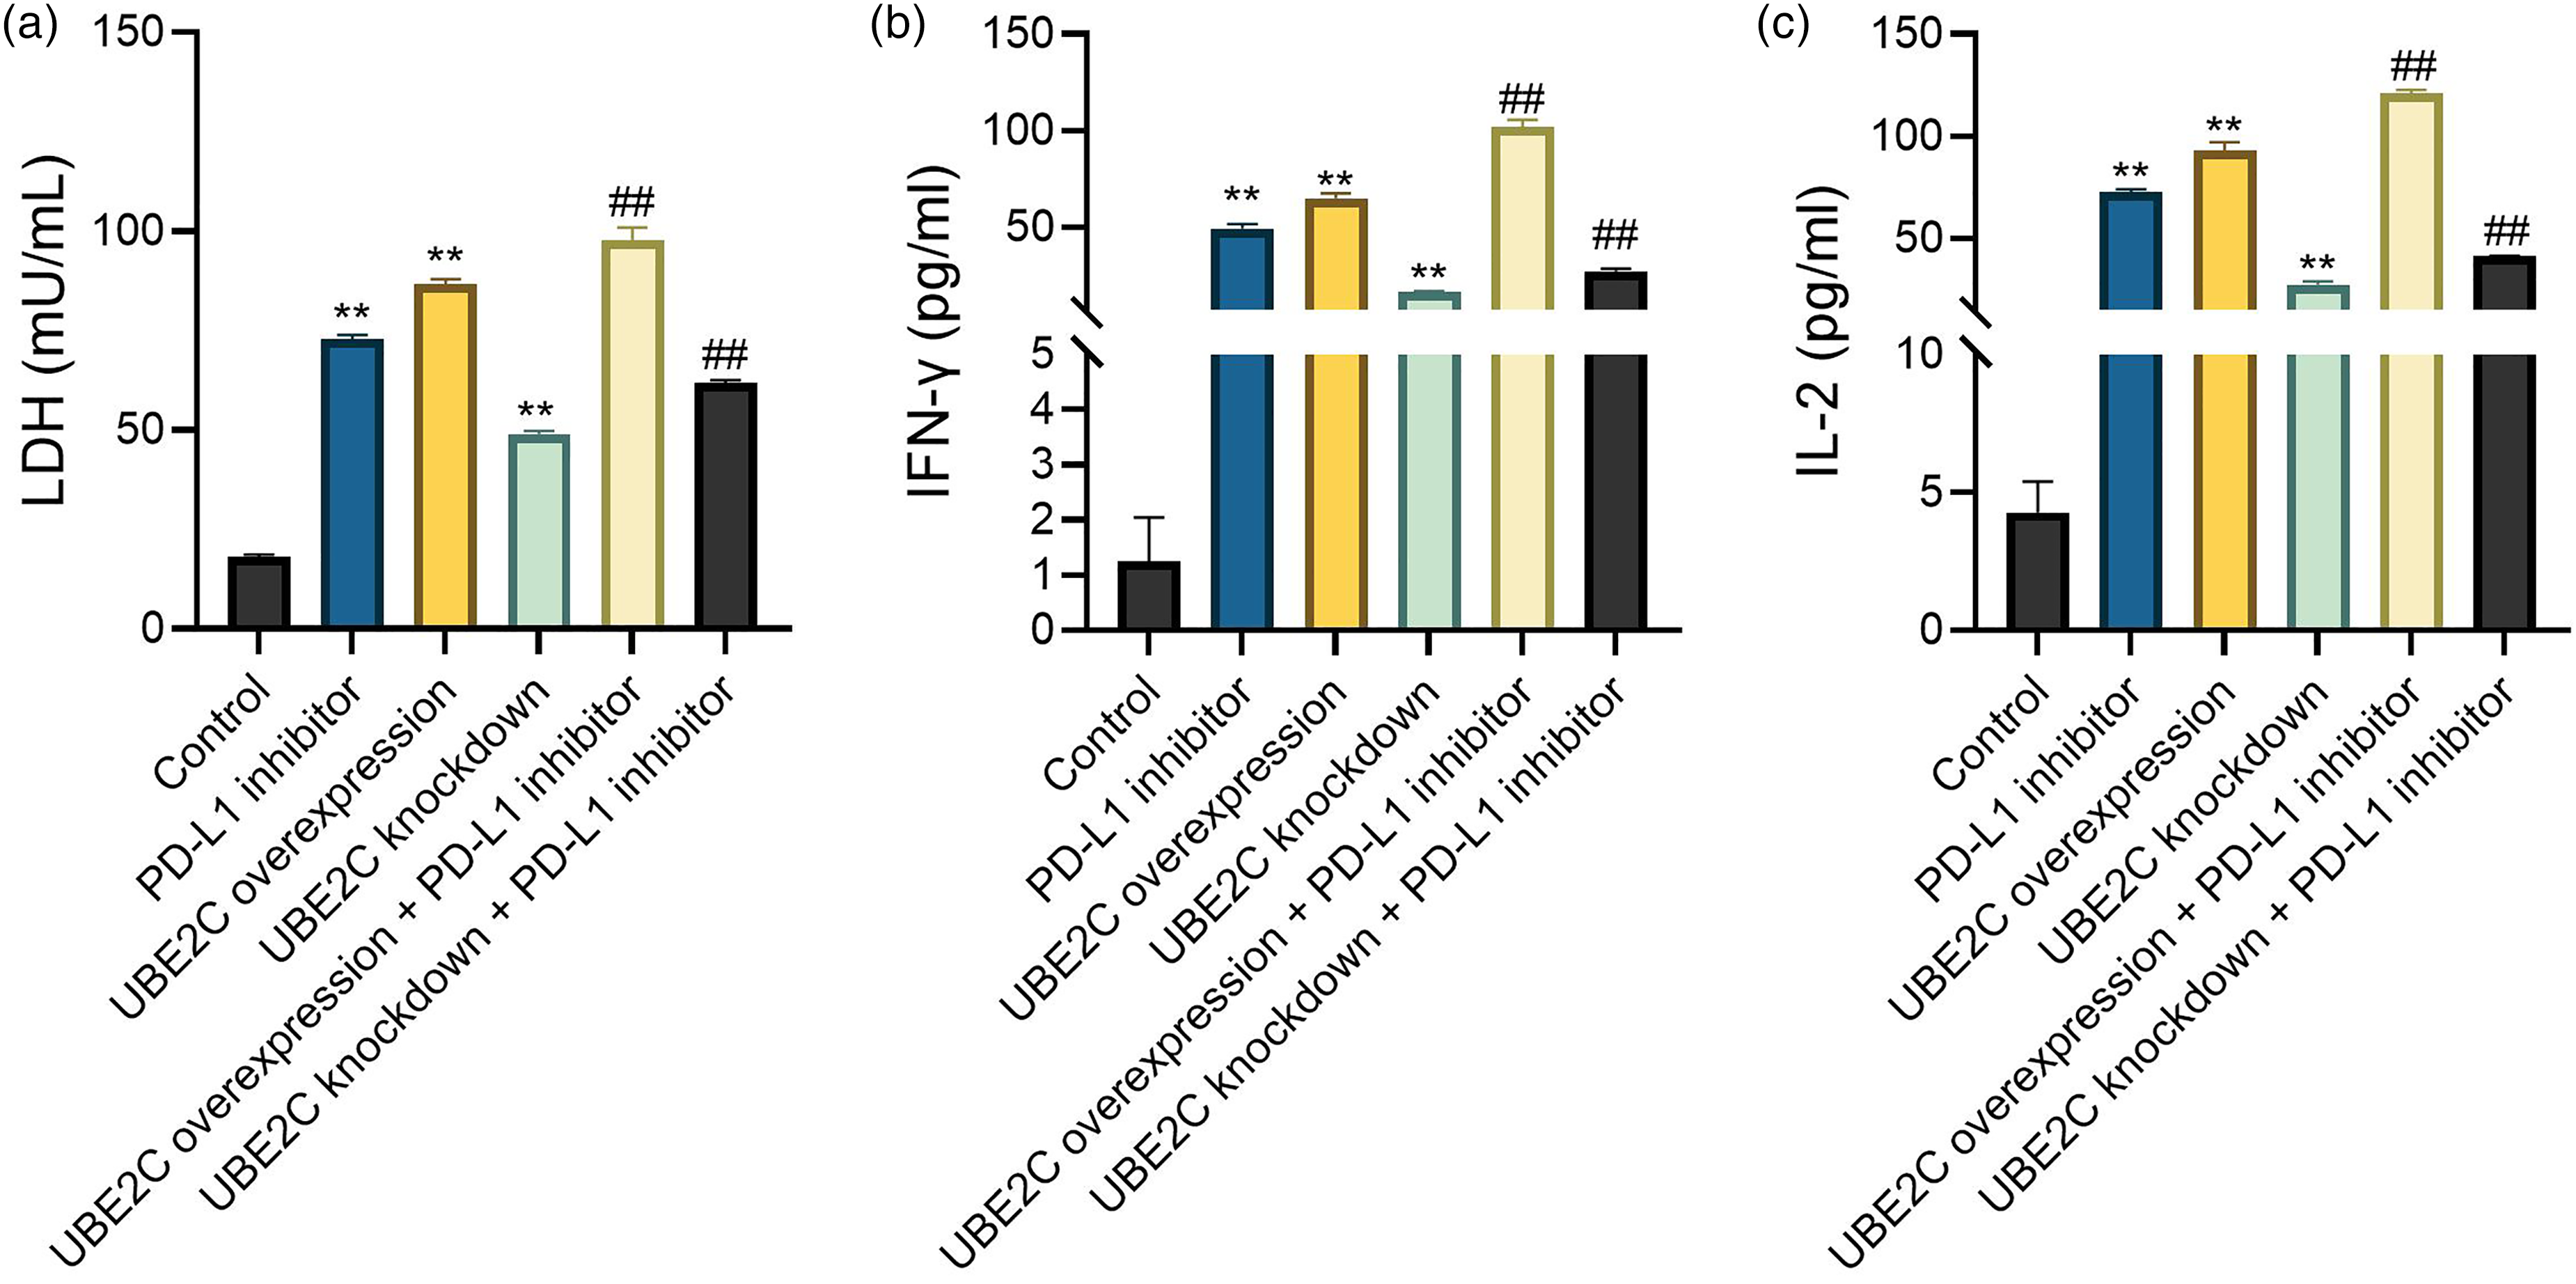
UBE2C promotes cytotoxicity and cytokine secretion in LUSC cells. (a) LDH release assay showing cytotoxicity across treatment groups. (b) and (c) ELISA detection of IFN-γ (b) and IL-2 (c) levels in cell supernatants. Data represent the mean ± SD of three independent technical replicates. **P < 0.01 vs control; ##P < 0.01 vs. PD-L1 inhibitor.
Discussion
This study combined bioinformatics analysis with in vitro and tissue-level validation to systematically evaluate the association between UBE2C and the sensitivity of LUSC to anti-PD-L1 immunotherapy. The results demonstrated that UBE2C expression was elevated in PD-L1 high-expression tissues. In in vitro models, UBE2C overexpression was associated with increased activation of the AKT/PI3 K and STAT3 pathways, accompanied by enhanced IFN-γ and IL-2 secretion and increased cytotoxicity, whereas UBE2C knockdown showed opposite trends. These findings suggest that UBE2C may modulate the tumor immune microenvironment and act synergistically with PD-L1 inhibition. Overall, UBE2C may serve as a candidate molecular marker of sensitivity to anti-PD-L1 therapy and as a prospective therapeutic target in LUSC.
Previous studies have reported that UBE2C is overexpressed in multiple tumors, where it is associated with dysregulation of the cell cycle, DNA replication, and the p53 signaling pathway, and correlates with poor prognosis.21,22 Consistently, our TCGA data analysis revealed that high UBE2C expression was enriched in cell cycle and DNA replication pathways and was associated with reduced overall survival in patients. In addition, immunofluorescence analysis demonstrated spatial co-localization of UBE2C and PD-L1 in LUSC tissues, supporting the hypothesis that UBE2C may be involved in immune evasion. Furthermore, the AKT/PI3 K and STAT3 signaling pathways play crucial roles in tumor immune regulation, including modulation of T-cell function, cytokine secretion, and mechanisms of tumor immune escape.23,24 The observed association between UBE2C expression and the activation of these pathways in this study may partially explain its relationship with sensitivity to immunotherapy.
In terms of immune function, this study found that UBE2C overexpression was associated with increased cytotoxicity and elevated levels of key effector cytokines, including IFN-γ and IL-2, whereas UBE2C knockdown exhibited the opposite trends. These findings suggest that UBE2C may enhance the anti-tumor efficacy of PD-L1 inhibitors by promoting effector immune responses. From a translational perspective, UBE2C holds potential as a candidate molecular marker for predicting the responsiveness of LUSC patients to PD-L1 inhibitors and as a potential target for combination immunotherapy. However, this hypothesis requires further validation in larger clinical cohorts and animal models to clarify its predictive value and therapeutic significance across different PD-L1 expression contexts.
This study has certain limitations. First, functional validation was primarily conducted in vitro, lacking support from in vivo experiments. Second, direct molecular interactions between UBE2C and key components of the AKT/PI3 K and STAT3 signaling pathways have not been confirmed using methods such as co-immunoprecipitation. Third, the role of UBE2C in other immunosuppressive mechanisms within the tumor immune microenvironment remains unclear. Future studies should incorporate animal models and clinical cohorts to further investigate the mechanistic role of UBE2C and its potential clinical applications in immune checkpoint therapy.
Conclusion
This study identified UBE2C as a gene associated with increased sensitivity to anti-PD-L1 immunotherapy in LUSC. Its expression was correlated with activation of the AKT/PI3 K and STAT3 signaling pathways. These findings suggest that UBE2C may influence the tumor immune microenvironment and enhance the efficacy of PD-L1 inhibitors. Together, these results provide a rationale for further mechanistic and clinical studies to confirm its role and evaluate its value as a biomarker for personalized immunotherapy.
Footnotes
Acknowledgements
Not applicable.
Ethics approval and consent to participate
All patients signed informed consent, and the experimental design was approved by the hospital(the First Affiliated Hospital of Guangzhou University of Chinese Medicine) ethics committee(Approval No. G-KY2546).The study was conducted in accordance with the Declaration of Helsinki.
Consent for publication
Not applicable.
Authors’ contributions
Study concept and design: XZ, HH; analysis and interpretation of data: HL, ZC; drafting of the manuscript: XZ, HL; critical revision of the manuscript for important intellectual content: ZC, HH; statistical analysis: ZC, HH; study supervision: all authors. All authors have read and approved the manuscript.
Funding
The authors received no financial support for the research, authorship, and/or publication of this article.
Declaration of conflicting interests
The authors declared no potential conflicts of interest with respect to the research, authorship, and/or publication of this article.
Data availability statement
The data used to support the findings of this study are available from the corresponding author upon request.
Clinical trial numbers
Not applicable.