
Abstract
Background
Early identification and therapy can significantly improve the outcome for gastric cancer. However, there is still no perfect biomarker available for the detection of early gastric cancer. This study aimed to investigate the alterations in the plasma metabolites of early gastric cancer using metabolomics and lipidomics based on high-performance liquid chromatography-mass spectrometry (HPLC-MS), which detected potential biomarkers that could be used for clinical diagnosis.
Methods
To investigate the changes in metabolomics and lipidomics, a total of 30 plasma samples were collected, consisting of 15 patients with early gastric cancer and 15 healthy controls. Extensive HPLC-MS-based untargeted metabolomic and lipidomic investigations were conducted. Differential metabolites and metabolic pathways were uncovered through the utilization of statistical analysis and bioinformatics analysis. Candidate biomarker screening was performed using support vector machine-based multivariate receiver operating characteristic analysis.
Results
A disturbance was observed in a combined total of 19 metabolites and 67 lipids of the early gastric cancer patients. The analysis of KEGG pathways showed that the early gastric cancer patients experienced disruptions in the arginine biosynthesis pathway, the pathway for alanine, aspartate, and glutamate metabolism, as well as the pathway for glyoxylate and dicarboxylate metabolism. Plasma metabolomics and lipidomics have identified multiple biomarker panels that can effectively differentiate early gastric cancer patients from healthy controls, exhibiting an area under the curve exceeding 0.9.
Conclusion
These metabolites and lipids could potentially serve as biomarkers for the screening of early gastric cancer, thereby optimizing the strategy for the detection of early gastric cancer. The disrupted pathways implicated in early gastric cancer provide new clues for additional understanding of gastric cancer's pathogenesis. Nonetheless, large-scale clinical data are required to prove our findings.
Introduction
Gastric cancer (GC), a malignant tumor affecting the digestive system, has a worldwide prevalence and a low 5-year overall survival rate of less than 25%. 1 Early detection has a direct impact on the progression and prognosis of GC. However, early detection remains challenging due to the lack of typical clinical symptoms. Regardless of lymph node metastasis, early gastric cancer (EGC) is limited to the mucosa or submucosa. It is important to mention that undergoing surgery for EGC can result in a 5-year overall survival rate exceeding 90%, in contrast to a rate of under 5% if it advances to stage IV.2,3 Early detection and management of GC can significantly improve the prognosis and decrease the fatality rate associated with GC. Furthermore, due to the minimal chance of lymph node spread, EGC can be successfully treated using endoscopic surgery, which is associated with lower risks and discomfort compared to laparoscopic surgery or laparotomy.
Blood-based tumor markers are extensively utilized for the screening and surveillance of tumors. Currently, there are serum tumor markers such as carcinoembryonic antigen (CEA), carbohydrate antigen 125 (CA125), and carbohydrate antigen 19-9 (CA19-9) that can be used for GC screening. 4 Nevertheless, these conventional tumor indicators fail to fulfill practical clinical requirements because of their limited sensitivity and specificity, which hampers the diagnosis of EGC. 5 Furthermore, serum pepsinogen (PG) has been employed for the purpose of detecting gastric mucosa atrophy to identify individuals with a high risk of GC. However, an analysis of multiple studies found that the overall sensitivity and specificity of GC screening, using the serum PG ratio, is below 80%. 6 Meanwhile, some studies on the representative metabolites in GC are showing progress. New method based on 3-DP-NHS derivatization in plasma coupled with UHPLC-Q-TOF/MS and UHPLC-MS/MS analyses was reported to exhibit a strong discriminative diagnosis ability of GC out of healthy people. 7 According to Xu et al., a metabolic panel consisting of 21 metabolites was constructed and identified for GC diagnosis with areas under the curve (AUCs) of 0.921–0.971 and 0.907–0.940 by a multicenter study based on the plasma metabolic information. 8 Urine metabolomics, L-alanine, L-isoleucine, L-serine, L-threonine, L-proline, and L-methionine, were found with satisfactory diagnostic values by liquid chromatography-mass spectrometry (LC-MS). 9 Moreover, the serum metabolites (trimethylamine N-oxide, rhamnose, beta-D-fucose and cis-aconitic acid) between GC and non-atrophic gastritis were also confirmed with diagnostic potential value. 10 Nevertheless, there are currently no hematological biomarkers that are both highly sensitive and specific for EGC, and further research is required to identify ideal biomarkers.
The metabolome refers to the entire collection of small molecular metabolites found in cells or tissues, representing the outcome of metabolism. Metabolomics, in contrast to genomics, transcriptome, or proteomics, provides a more precise depiction of the body's present metabolic condition. 11 Metabolomics research primarily relies on nuclear magnetic resonance, gas chromatography-mass spectrometry, and LC-MS for detection. Because of the benefits of comprehensive metabolite detection and dependable analytical capability,12,13 high performance liquid chromatography-mass spectrometry (HPLC-MS)-based metabolomics and lipidomics have become extensively utilized in biological investigations and biomarker identification.14,15 As far as we know, there have been no reported studies on the plasma metabolome related to EGC. Studying the systematic metabolic disturbance in EGC is of the utmost importance.
The HPLC-MS platform was used to analyze the metabolomics and lipidomics of both EGC patients and healthy controls to examine potential metabolites and lipids for EGC screening. Our findings provide new insights into novel biomarker development of EGC. The use of these new plasma biomarkers could be seen as an additional tool for pre-gastroscopy assessment, optimizing the strategy for detection of EGC and improving EGC screening initiatives.
Materials and methods
Clinical samples and study design
Plasma specimens were collected from 15 individuals diagnosed with EGC, specifically limited to the mucosa or submucosa irrespective of lymph node metastasis. This includes cases of high-grade intraepithelial neoplasia (HGIN). After undergoing endoscopic submucosal dissection (ESD) at Peking University First Hospital, all the participants were diagnosed with EGC through pathological examination. EDTA tubes were used to collect fasting blood samples before ESD and these samples were placed at 4 °C less than 6 h. Plasma was separated by centrifugation at 3000 g for 10 min at 4 °C, and then stored at −80 °C for later use. Conventional cancer markers (CEA and CA19-9) were negative in all the EGC plasma. Plasma from 15 sex- and age-matched healthy people was collected as healthy controls. All the healthy controls underwent an endoscopy to eliminate GC. In accordance with the Ethics Committee of the First Hospital of Peking University, the study was granted approval, and all participants were provided with informed consent. Specifically, the healthy control group was selected based on the following criteria: (a) absence of medical history of conditions like hypertension, heart disease, diabetes, and tumors; (b) no functional abnormalities of key organs and systems; and (c) no use of health products or medications affecting stomach function within a month prior to sampling. Criteria for disqualifying EGC group included: (a) non-compliance with necessary blood collection; (b) females experiencing menstruation, pregnancy, or lactation; (c) metabolic disorders and various digestive issues; (d) the use of health products or medications affecting stomach function within a month prior to sampling; and (e) patients diagnosed with other tumors. Supplementary Tables 1 and 2 contain the baseline characteristics and clinical parameters for the metabolomics analysis.
Preparation of samples for analysis
Metabolite extraction was performed on all plasma samples, including 15 EGC and 15 healthy controls, in the same batch. To summarize, metabolites and lipids were extracted from the plasma samples (100 μL/sample) by utilizing a solution of cold chloroform and methanol (with a volume ratio of 2:1) at a ratio of 1:4. Following the use of a vortex and centrifuge, the hydrophilic metabolites, which constitute the upper aqueous phase, and the hydrophobic metabolites, which form the lower organic phase, were collected separately. Subsequently, both phases were evaporated under vacuum. The desiccated pellets were kept in the ultra-low temperature fridge at −80 °C until the HPLC-MS examination.
Liquid chromatography and mass spectrometry
The Ultimate 3000 UHPLC system, in conjunction with a Q-Exactive mass spectrometer (ThermoFisher, Lenexa, KS, USA), was utilized to examine metabolites and lipids. Acquity BEH amide columns (100 × 2.1 mm, 2.5 μm, Waters) were utilized for conducting metabolomics assays, while reverse-phase Acquity CSH C18 columns (100 × 2.1 mm i.d, 2.5 μm, Waters) were employed for lipidomics assays involving chromatographic separation. For the metabolomic analysis, the mobile phase A consisted of 5 mM ammonium acetate in water with 5% acetonitrile, and the mobile phase B was acetonitrile. The gradient elution (0 min, 95% B; 3 min, 95% B; 13 min, 40% B; 15 min, 40% B; 15.1 min, 95% B; 17 min, 95% B) was carried out at a flow rate of 0.3 mL/min and a column temperature of 30°C. Samples of hydrophilic metabolites were suspended with 100 μL of acetonitrile:water (1:1, v/v). The injection volume was 10 μL. For the lipidomic analysis, both the mobile phase A (acetonitrile:water, 3:2, v/v) and B (isopropanol:acetonitrile, 9:1, v/v) consisted of 10 mM ammonium acetate and 0.1% formic acid. The gradient program (0 min, 40% B; 2 min, 40% B; 12 min, 60% B; 12.1 min, 75% B; 18 min, 99% B; 20 min, 99% B; 20.5 min, 40% B; 23 min, 40% B) was carried out at a flow rate of 0.3 mL/min and a column temperature of 50°C. Samples of lipids were suspended with 100 μL of chloroform:methanol (1:1, v/v) and then diluted threefold with isopropanol:acetonitrile:water (2:1:1, v/v/v). The injection volume was also 10 μL.
MS detection was conducted by the Q-Exactive mass spectrometer with a heated electrospray ionization source. Top 10 data-dependent acquisition (DDA) experiments were performed in a positive-negative ion switching mode to acquire mass spectrometric data. Specific parameters of the detection were referenced in our previous study. 16 The scan parameters were set as follows: mass range for the hydrophilic metabolites, 60–900 m/z; mass range for the lipids, 300–1200 m/z; full MS scan resolution, 70,000; MS/MS scan resolution, 13,500; automatic gain control target, 5 × 10⁶; maximum injection time, 100 ms; high-energy collisional dissociation mode, stepped normalized collision energy of 15, 30, and 45; dynamic exclusion, 8 s. The following parameters were used for the ion source: spray voltage for positive ion mode, 3.3 kV; spray voltage for negative ion mode, 3.0 kV; sheath gas flow rate, 40 arb; aux gas flow rate, 10 arb; capillary temperature, 320 °C; probe heater temperature, 300 °C; S-lens radio frequency level, 55. The analysis was conducted on a random order of 30 samples. During the entire HPLC-MS analytical sequence, quality control (QC) samples were created by combining equal amounts of all study samples and were examined after every 10 samples.
Data processing
To process raw data collected from the data-dependent acquisition (DDA)-MS database according to the user guidelines, we utilized version 4.24 of the MS-DIAL software available at http://prime.psc.riken.jp/compms/msdial/main.html. The initial MS data were converted to Reifycs Inc.'s standard file format by utilizing the Reifycs ABF converter found at http://www.reifycs.com/AbfConverter/index.html. Following the conversion of the data, the MS-DIAL software was utilized to characterize the samples, perform spectral deconvolution, identify metabolites, and align peaks. Specific parameters of the data processing were referenced in our previous study. 16 Briefly, the MS2 spectra-based compound identification was performed in MS-DIAL by matching the experimental MS2 spectra against mass spectral libraries such as MassBank database provided in MS-DIAL website, containing MS1 and MS/MS information of metabolites (8068 records in positive ion mode and 4782 records in negative ion mode), or software's internal in silico LipidBlast database of common lipid species (81 class, 377,313 molecules in positive ion mode and 94 class, 356,477 molecules in negative ion mode). The tolerances of MS1 and MS2 for centroid were set to 0.01 Da and 0.05 Da separately. For peak alignment and identification, the retention time tolerance was set to 0.2 min, and the accurate mass tolerance of MS1 was set to 0.01 Da. The identification score cut off was set to 70%. Other parameters used in MS-DIAL were set as default. After data processing, the raw data matrix tables were exported from MS-DIAL. The peaks without true MS/MS matched metabolite names were removed from the tables and were not included in the following statistical analyses. The detailed validation information of identified metabolites and lipids obtained from MS-DIAL are listed in Supplementary Tables 3 and 4.
Statistical analyses
The statistical analyses (such as principle component analysis (PCA), orthogonal partial least squares-discriminant analysis (OPLS-DA), partial least squares-discriminant analysis (PLS-DA), two-tailed Student t-test, one-way analysis of variance (ANOVA), and hierarchical clustering analysis) and bioinformatics (pathway enrichment analysis) were conducted using the MetaboAnalyst Web Services (https://www.metaboanalyst.ca/). Total sum normalization and auto scaling procedures were used for data pretreatment. The analysis of variance indicated that P-values adjusted for false discovery rate less than 0.05 were considered significant, and the Fisher's least significant difference test was conducted as a post hoc test. By utilizing differentially expressed metabolites as input, the pathway enrichment analysis demonstrated a P-value of less than 0.01 when compared to the KEGG and SMP databases. The MetaboAnalyst web service was utilized to conduct multivariate receiver operating characteristic (ROC) curve analyses. 17 The study relied on algorithms of support vector machine (SVM). Balanced sub-sampling was employed in Monte-Carlo cross-validation (MCCV) to generate ROC curves, which illustrate the results of multivariate modeling. The importance of the features was assessed using two-thirds of each MCCV sample. Classification models were built using the most significant features, including the top 5, 10, 15, 25, 50, and 100. These models were validated on a subset of samples that were not included in the training set. The model's performance and confidence intervals were calculated by repeating this process multiple times. The support vector machine algorithms were configured to use the “built-in” sorting method for optimization.
Results
Patient characteristics and baseline information
Our study collected a total of 15 plasma samples from patients with EGC and an equal number of plasma samples from the matched healthy volunteers as controls. Supplementary Tables 1, 2 and Supplementary Figure 1 provide a summary of the demographic and clinical details. In the EGC group, there were 13 instances of adenocarcinoma and 2 instances of HGIN that were diagnosed. The adenocarcinomas exhibited either well differentiation or moderate differentiation, with infiltration depth primarily confined to the mucosa.
Metabolomics revealed dysregulated metabolites in EGC
We performed global profiling of the metabolites in the plasma samples to identify altered metabolites in the EGC patients by untargeted metabolomics. The analytical robustness of HPLC-MS QC samples was repeatedly analyzed during the profiling. PCA was used to provide a comprehensive overview of the metabolomic profile. The reliability of the metabolomics data is demonstrated by the effective clustering of the QC group in both positive- (Figure 1(a)) and negative- (Figure 1(b)) ion modes, as shown in the PCA score plots of all groups. Consequently, there was no implementation of QC-based drift correction or data cleaning. In both ion modes, the healthy control group showed distinct separation trends from the EGC group. Furthermore, both the EGC and healthy control groups were effectively grouped together in the OPLS-DA model, as depicted in Figure 1(c) and (d). After aligning the peaks and eliminating missing values, a total of 560 peaks were successfully identified in positive-ion mode and 504 peaks in negative-ion mode through reliable comparison of MS/MS spectra. Supplementary Table 5 presents the findings of additional statistical analysis, which revealed a total of 19 metabolites that were dysregulated between EGC and the healthy controls. These metabolites were identified based on criteria such as variable influence on projection (VIP) score greater than 1 and a P-value less than 0.05 in the student t-test. The heat map displays dysregulated metabolites in positive- (Figure 1(e)) and negative- (Figure 1(f)) ion modes. According to the patient characteristics, we further divided the 13 patients of adenocarcinoma into two subgroups based on the infiltration depth of tumor invasion, including M-EGC group (8 patients, mucosal) and SM-EGC group (5 patients, submucosal). The PLS-DA score plots in both positive- and negative-ion modes also showed a good separation trend among the two EGC subgroups and the healthy control group (Supplementary Figure 2). As shown in Supplementary Table 6, 14 metabolites contributed most to the separation between the sample groups were identified based on criteria such as VIP score greater than 2 and an adjusted P-value less than 0.05 in one-way ANOVA analysis. To further illustrate the trends of these features, the grouped scatter plots presenting levels of each feature were shown in Supplementary Figure 3.
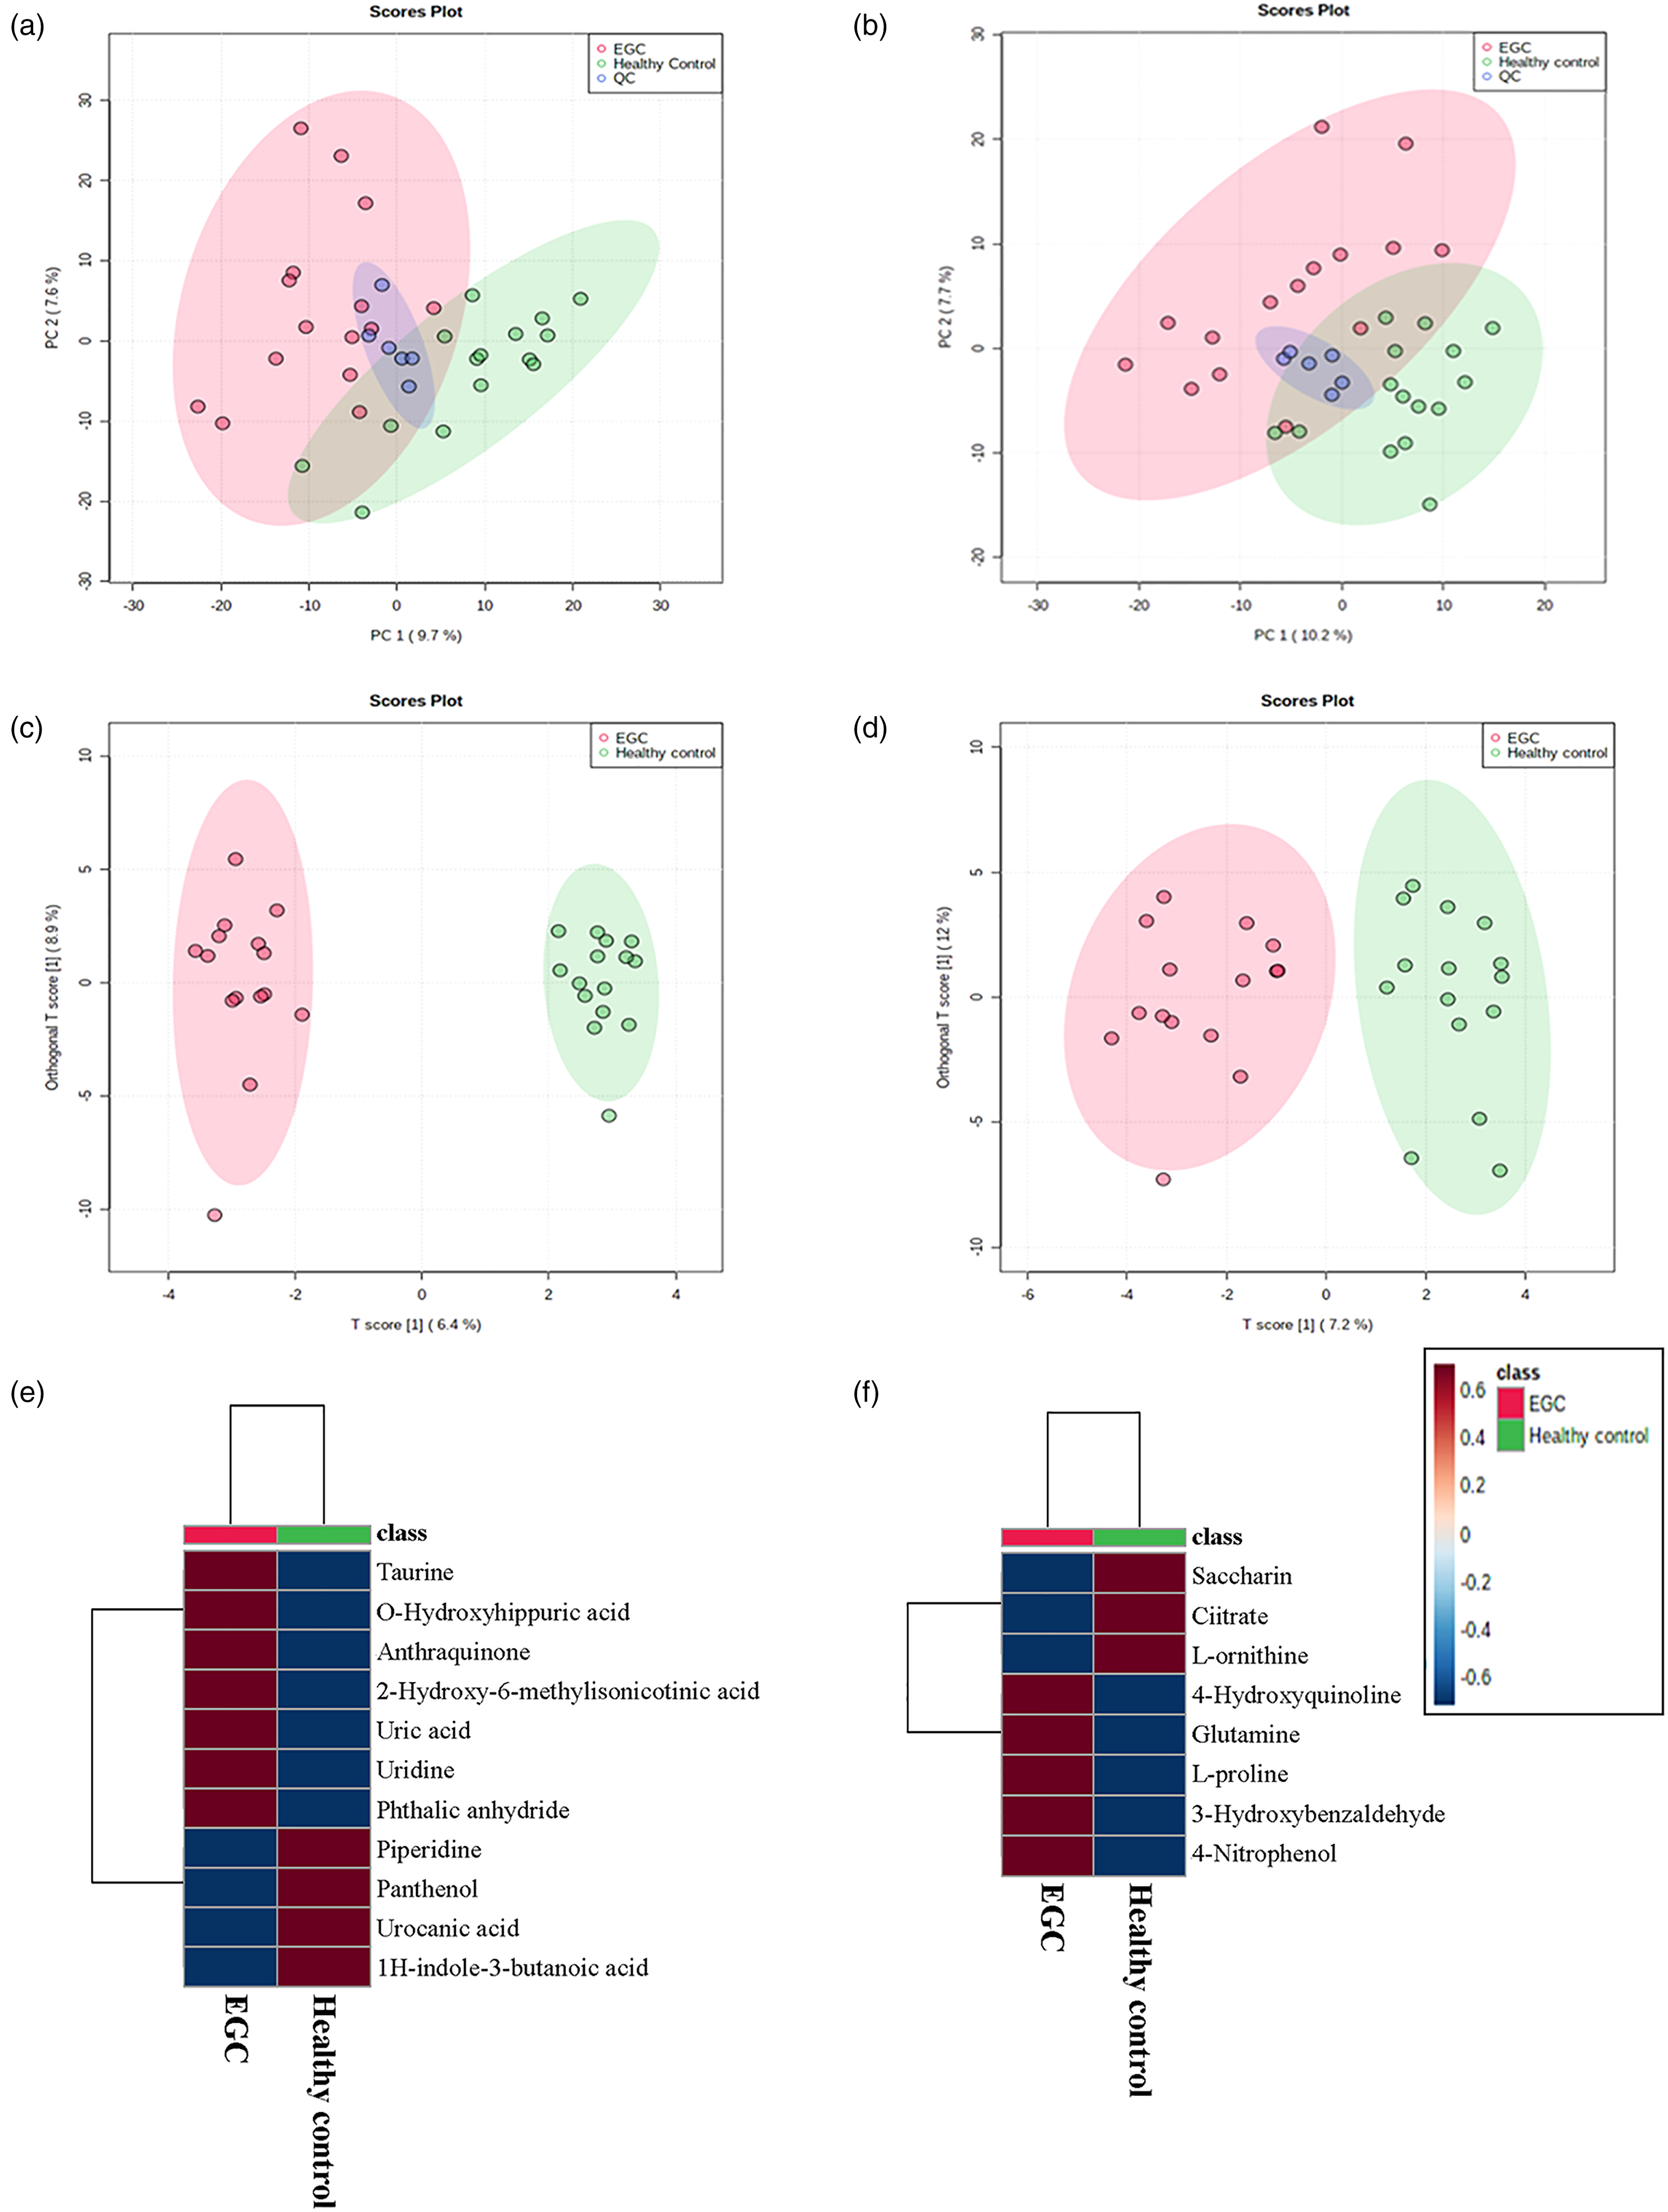
Dysregulated metabolites revealed by metabolomics. The positive-(a) and negative-(b) ion modes depict the PCA score plots for all samples. Groups are labeled with different colors (healthy control, green; EGC, red; QC, dark blue). The positive-(c) and negative-(d) ion modes depict the OPLS-DA score plots for all samples. Various colors are used to display different groups (healthy control, green; EGC, red). The heat map displays dysregulated metabolites in positive-(e) and negative-(f) ion modes.
Lipidomics revealed dysregulated metabolites in EGC
PCA and OPLS-DA programs were employed, similar to the approach used for analyzing metabolite characteristics, to produce a summary of lipid expression patterns across all samples (Figure 2). In both positive- and negative-ion modes, the PCA score plots showed a close gathering of lipid QC samples, similar to the analysis of metabolomics biography. MS/MS spectra comparison accurately identified 1176 features in positive-ion mode and 516 in negative-ion mode. The statistical analysis revealed that the EGC group had 67 lipids that were disturbed, with a VIP score >1 and a P-value <0.05 in the Student t-test, compared to the healthy controls. Supplementary Table 7 displays the top 30 most dysregulated lipids in the EGC group, specifically referring to VIP in both positive-ion mode and negative-ion mode. The PLS-DA analyses were also applied to distinguish among the M-ECG, SM-EGC and healthy control groups. Supplementary Figure 2 showed the PLS-DA score plots in both positive and negative ion modes with a good separation trend among these three groups. Supplementary Table 8 and Supplementary Figure 4 exhibited the 26 lipids identified as differently expressed features based on the same criteria as metabolomics analysis.
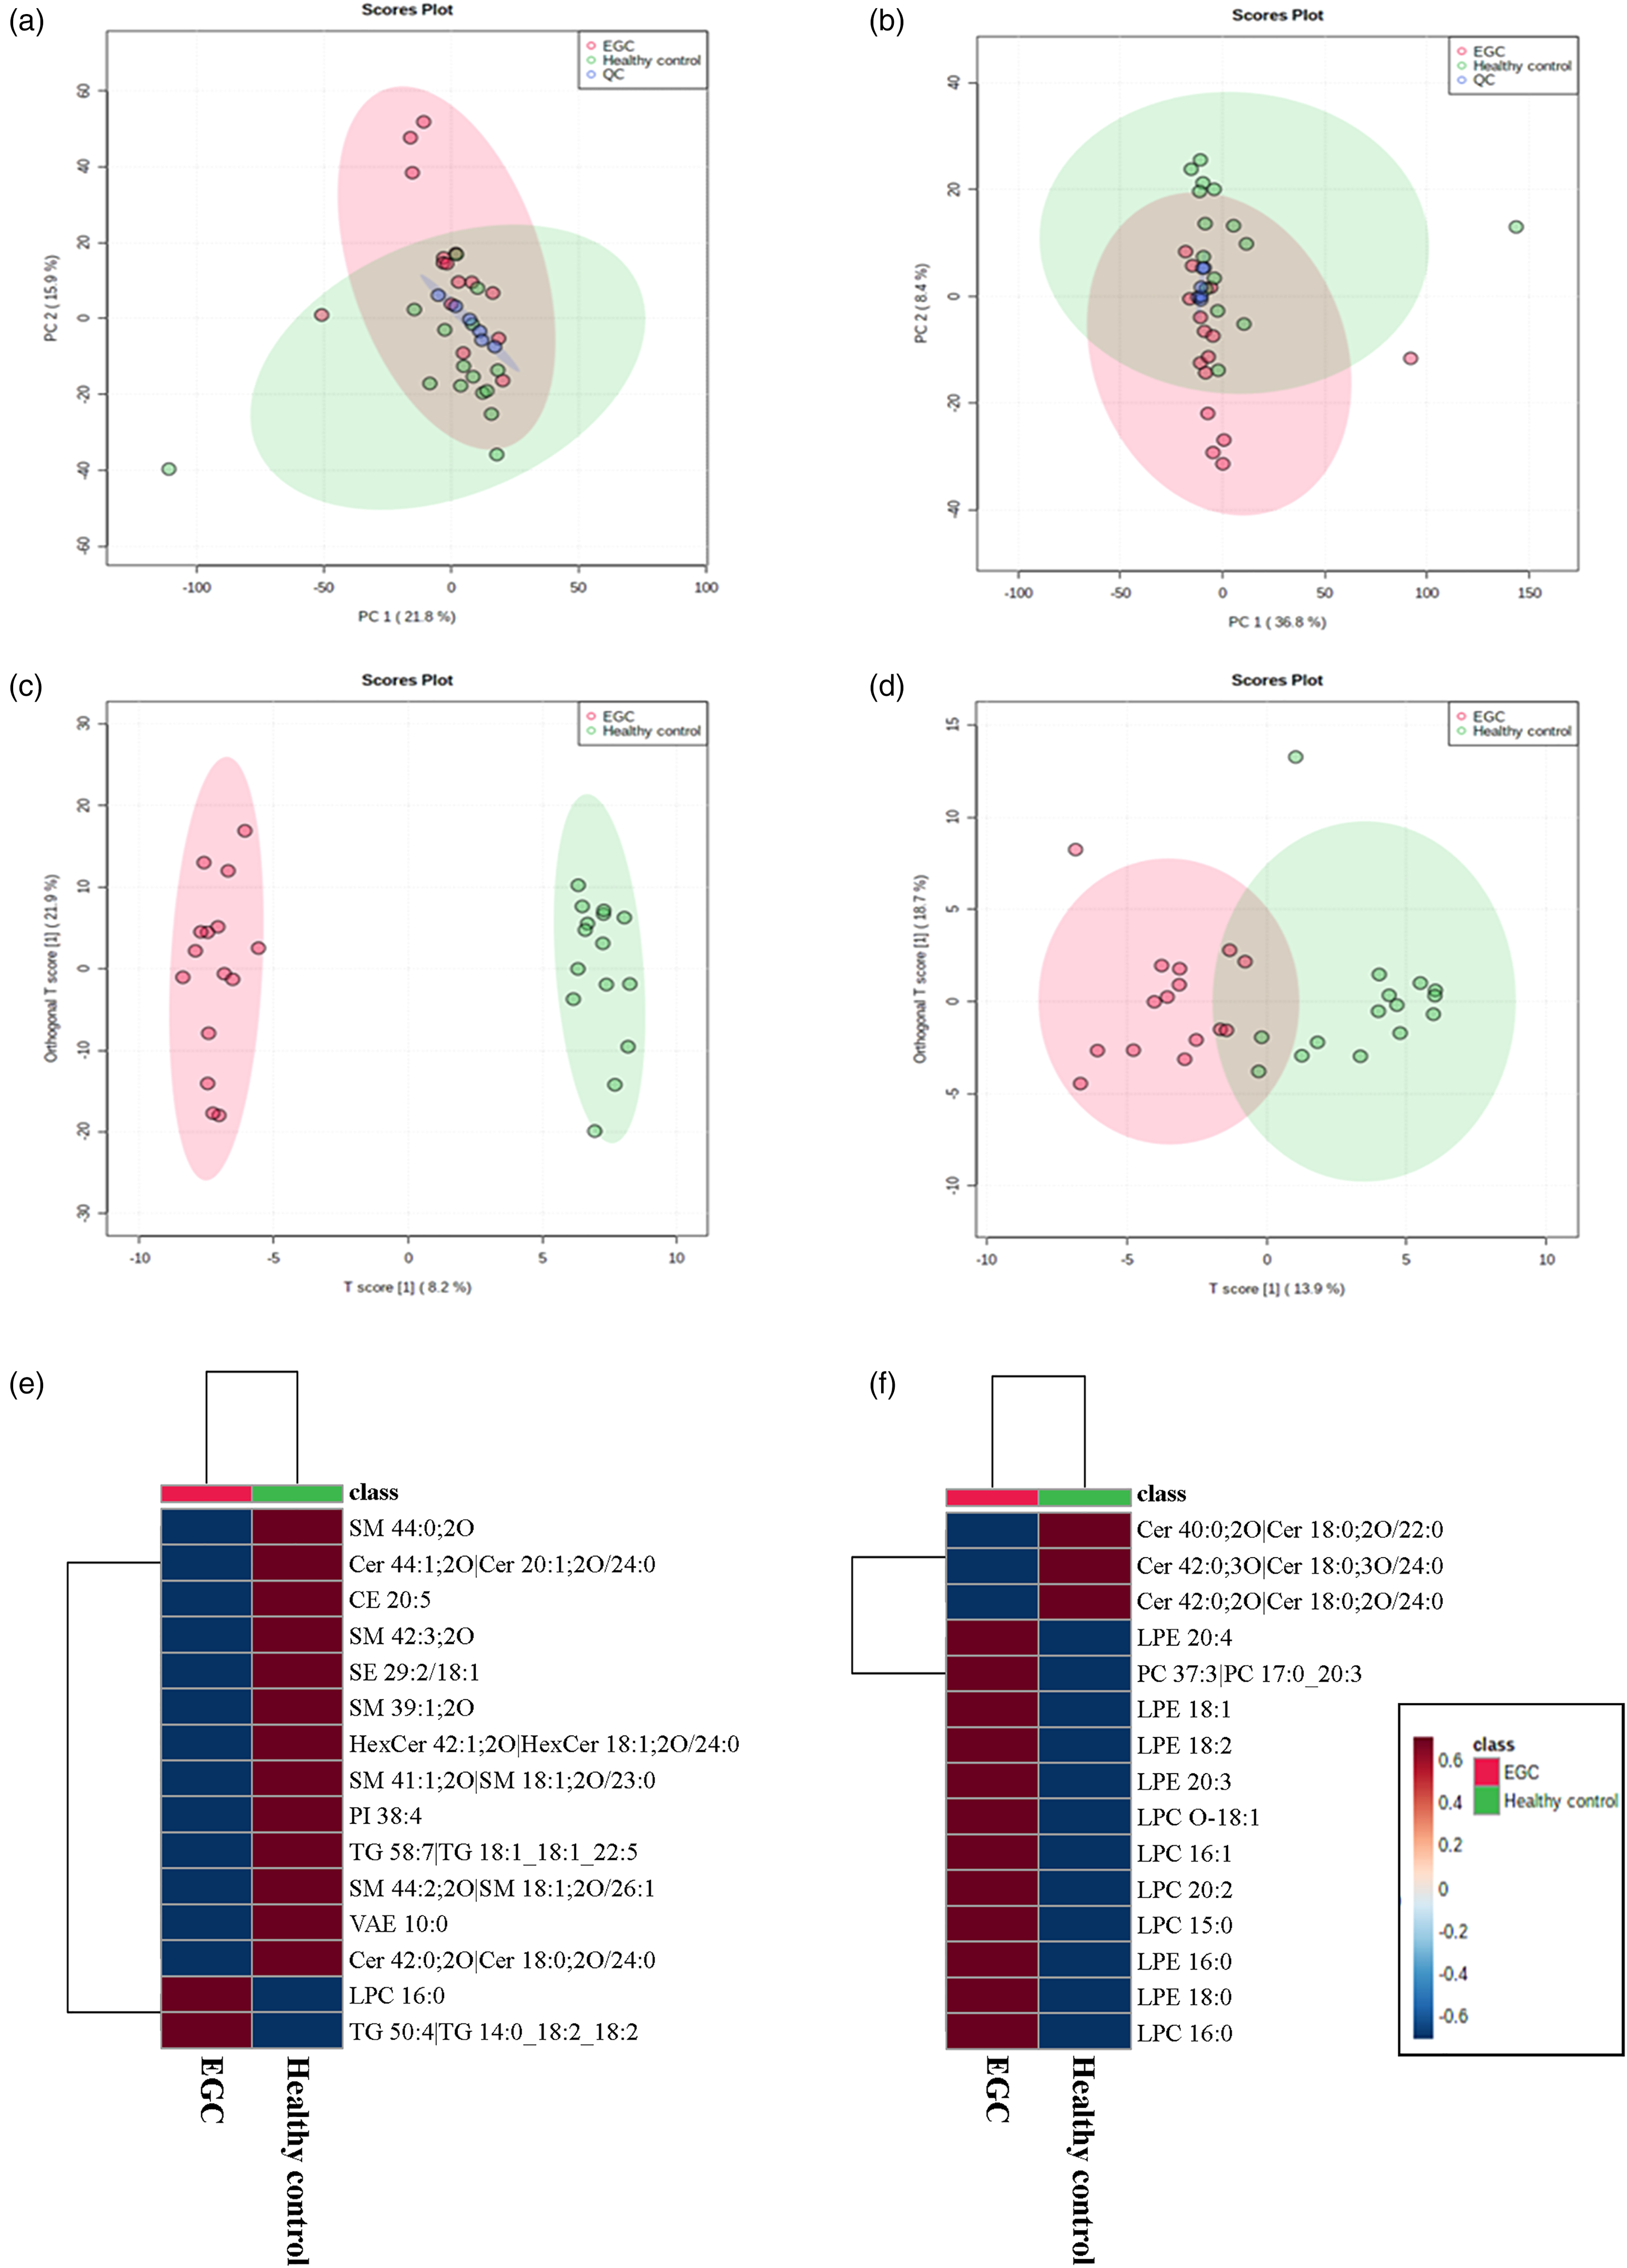
Dysregulated lipids revealed by lipidomics. The positive-(a) and negative-(b) ion modes depict the PCA score plots for all samples. Groups are labeled with different colors (healthy control, green; EGC, red; QC, dark blue). The positive-(c) and negative-(d) ion modes depict the OPLS-DA score plots for all samples. Various colors are used to display different groups (healthy control, green; EGC, red). The heat map displays dysregulated lipids in positive-(e) and negative-(f) ion modes.
KEGG pathway enrichment disclosed the dysregulated metabolic pathways in EGC
To examine the metabolic pathways associated with EGC, we conducted a KEGG pathway enrichment analysis using all the disordered metabolites as inputs. As shown in Figure 3, the arginine biosynthesis pathway, the alanine, aspartate, and glutamate metabolism pathway, and the glyoxylate and dicarboxylate metabolism pathway were found to have significant enrichment (P<0.05) of all the differentially expressed metabolites.
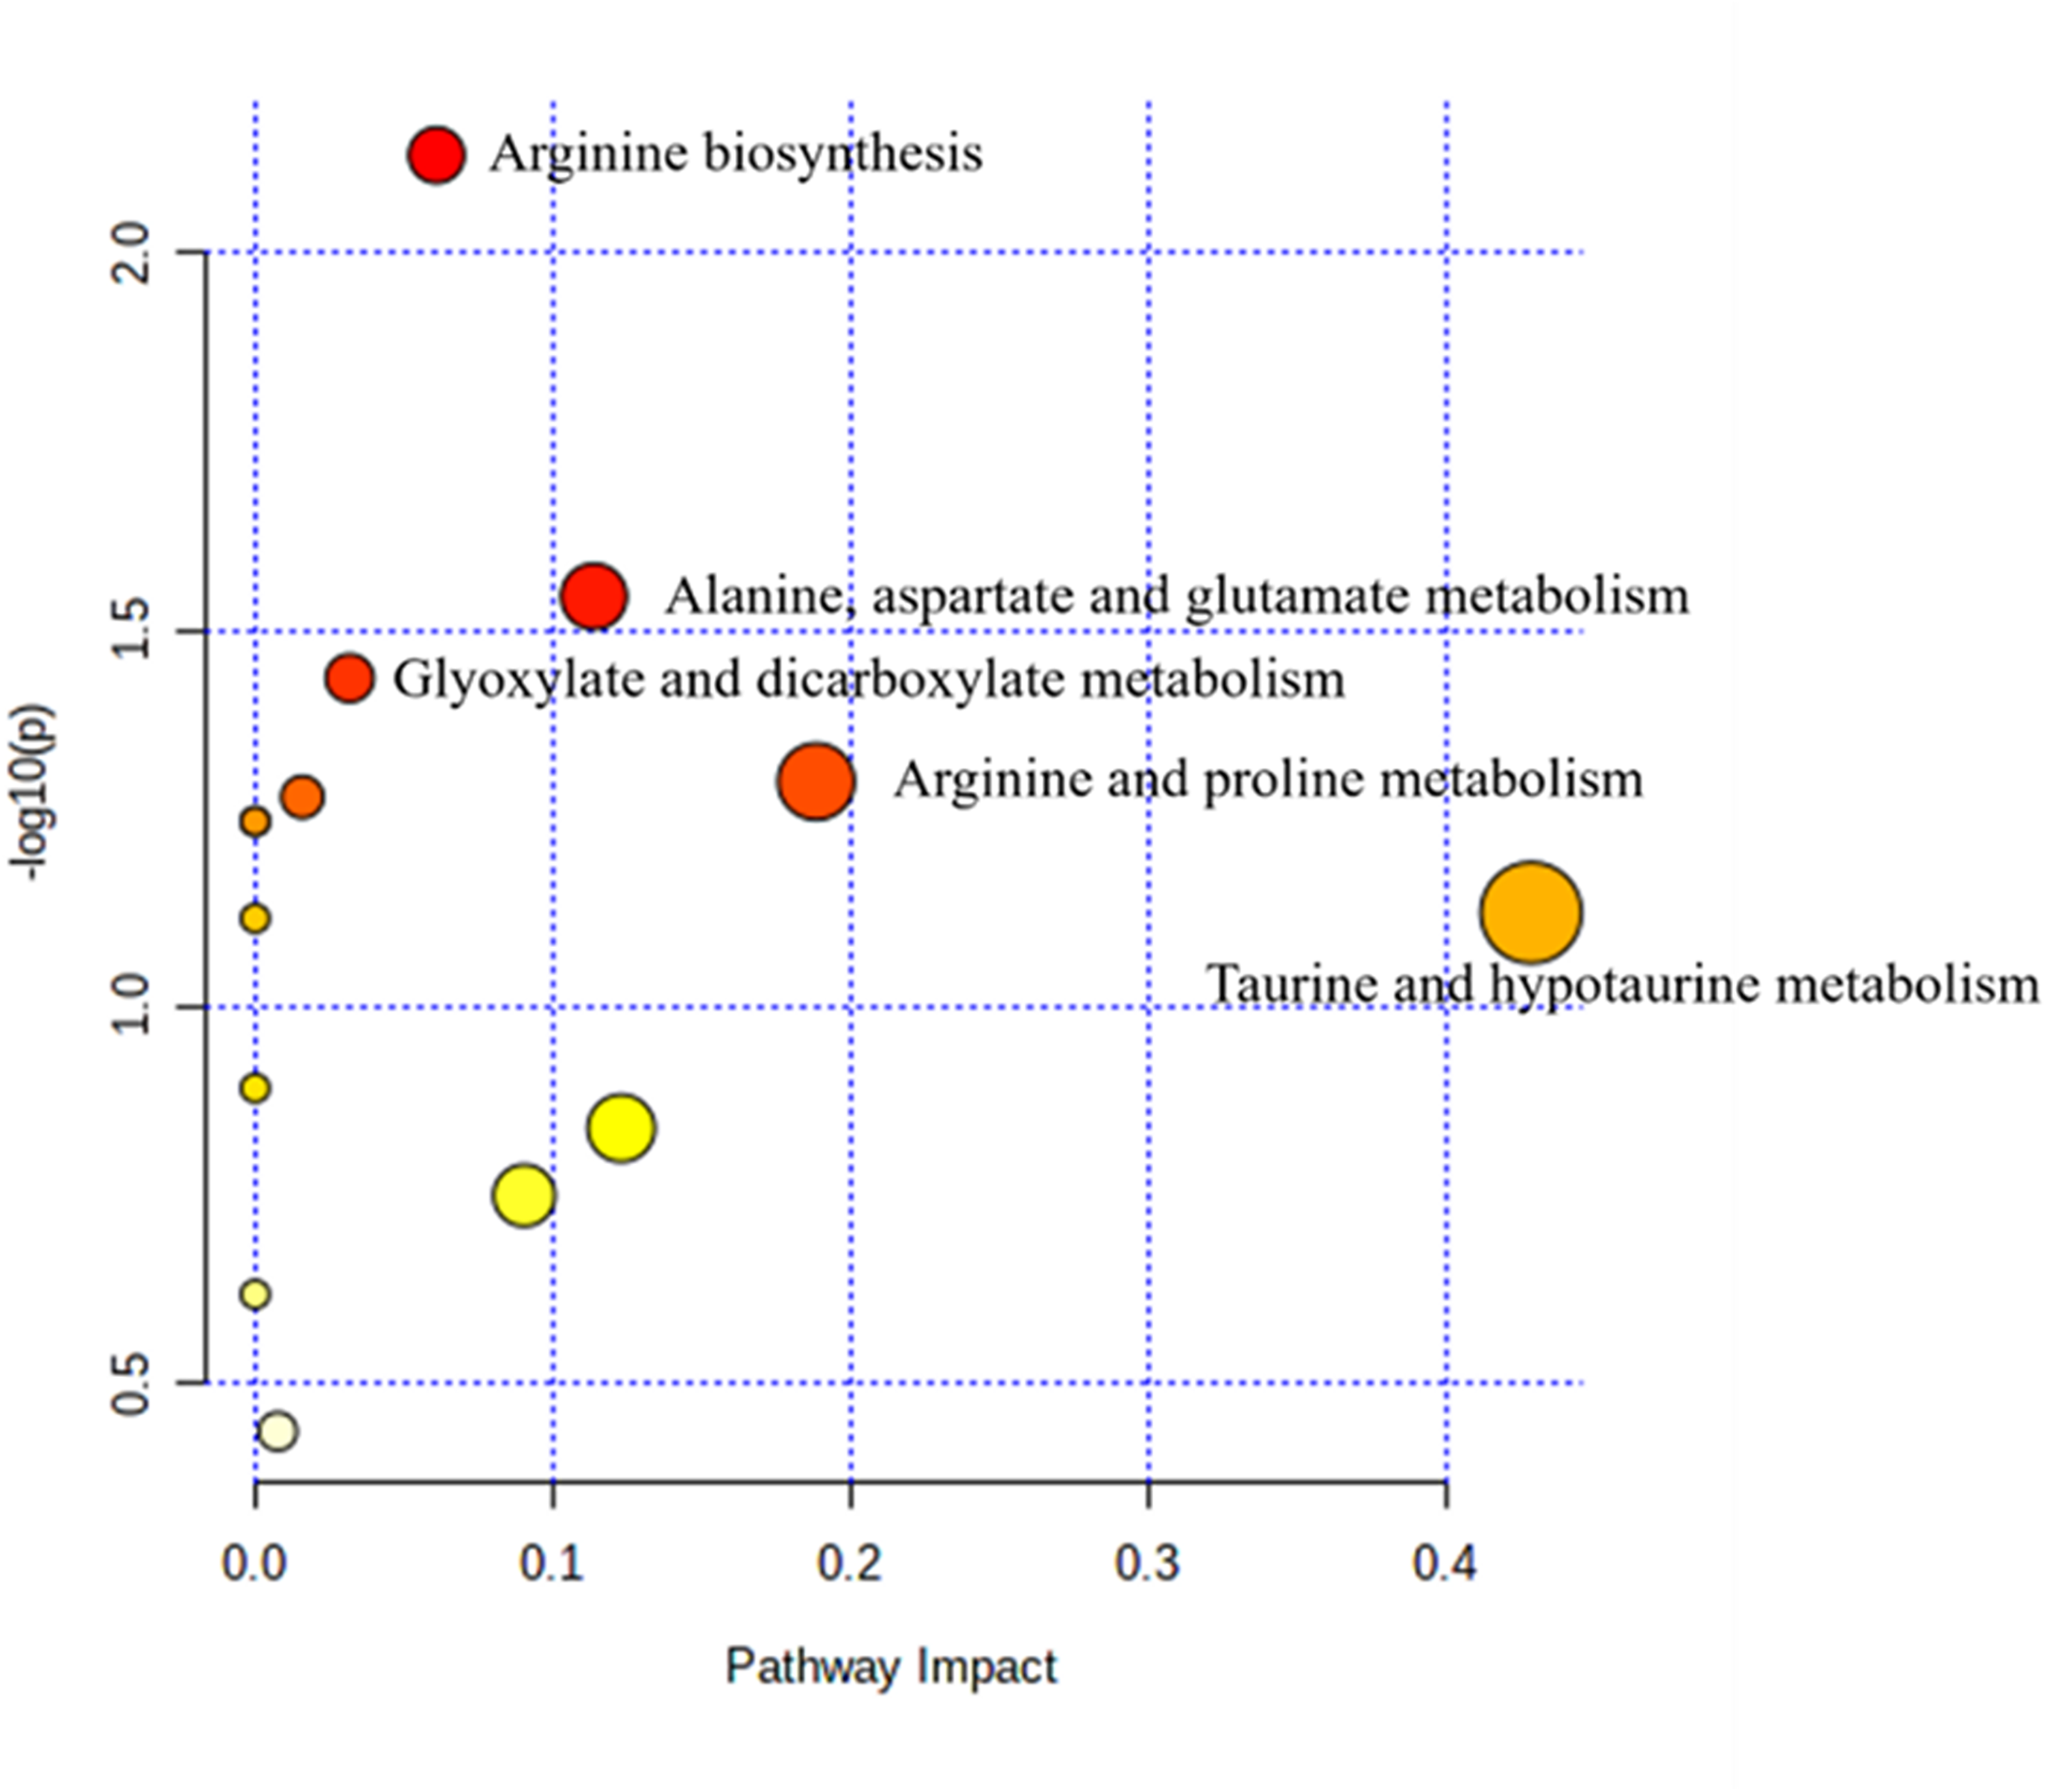
Metabolic pathways implicated in EGC. Enriched metabolic pathways were depicted in various scattered diagrams. The pathway's significance was represented by a color gradient on the y-axis, with yellow indicating a higher P-value and red indicating a lower P-value. Additionally, the pathway impact score was indicated by the size of the circle on the x-axis, with larger circles representing a higher impact score. Names were assigned to pathways that had a high impact score and a low P-value, indicating significant effects.
Evaluation of EGC candidate biomarkers based on ROC analysis
Using SVM algorithms, we conducted multivariate ROC curve analyses to identify metabolite features or lipid features that differentiate patients with EGC from healthy controls. These features could potentially serve as biomarkers for the onset of EGC. MCCV introduced ROC curves through the utilization of balanced sub-sampling. We utilized the linear SVM and the built-in SVM techniques for both classification and feature ranking purposes. Figure 4(a) and (d) display multivariate ROC curves generated using 5-100 metabolites or lipids. The AUC values were highest for the models containing either 15 metabolites (Uridine, (2E)-3-(4-hydroxy-3-methoxyphenyl)-2-propenoic acid, Glycyl-L-proline, α,β-Dihydroresveratrol, Cysteine S-sulfate, Curvularin, PFCA-H, 7-hydroxy-3-phenyl-4H-chromen-4-one, Ectoine, Uracil, Ecgonine, Phthalic anhydride, N-Acetylaspartic acid, Cimifugin, 4-Nitrophenol) or 5 lipids (DG35:2, VAE 10:0, PI 40:4, NAE 17:0 and PC36:3). Figure 4(b) and (e) display the predicted probabilities of the class (averaged from cross-validation) for each sample using either the 15-metabolite or 5-lipid models. Notably, the EGC group exhibited significant separation from the healthy control. Figure 4(c) and (f) display the mean importance measure rankings of the top 15 metabolites or 5 lipids in the prediction model. The importance- and rank-frequency values of features identified by the SVM-based model are shown in Supplementary Tables 9 and 10. Boxplots of relative concentrations for these features were shown in Supplementary Figure 5 and 6. Finally, to highlight the dysregulated metabolites and lipids we identified in this study, we further simplified them into a table compared with some previous reports (Supplementary Table 11). Notably, most previous research was focused on the differences between GC and the healthy volunteers, which may provide relative references to some degree.
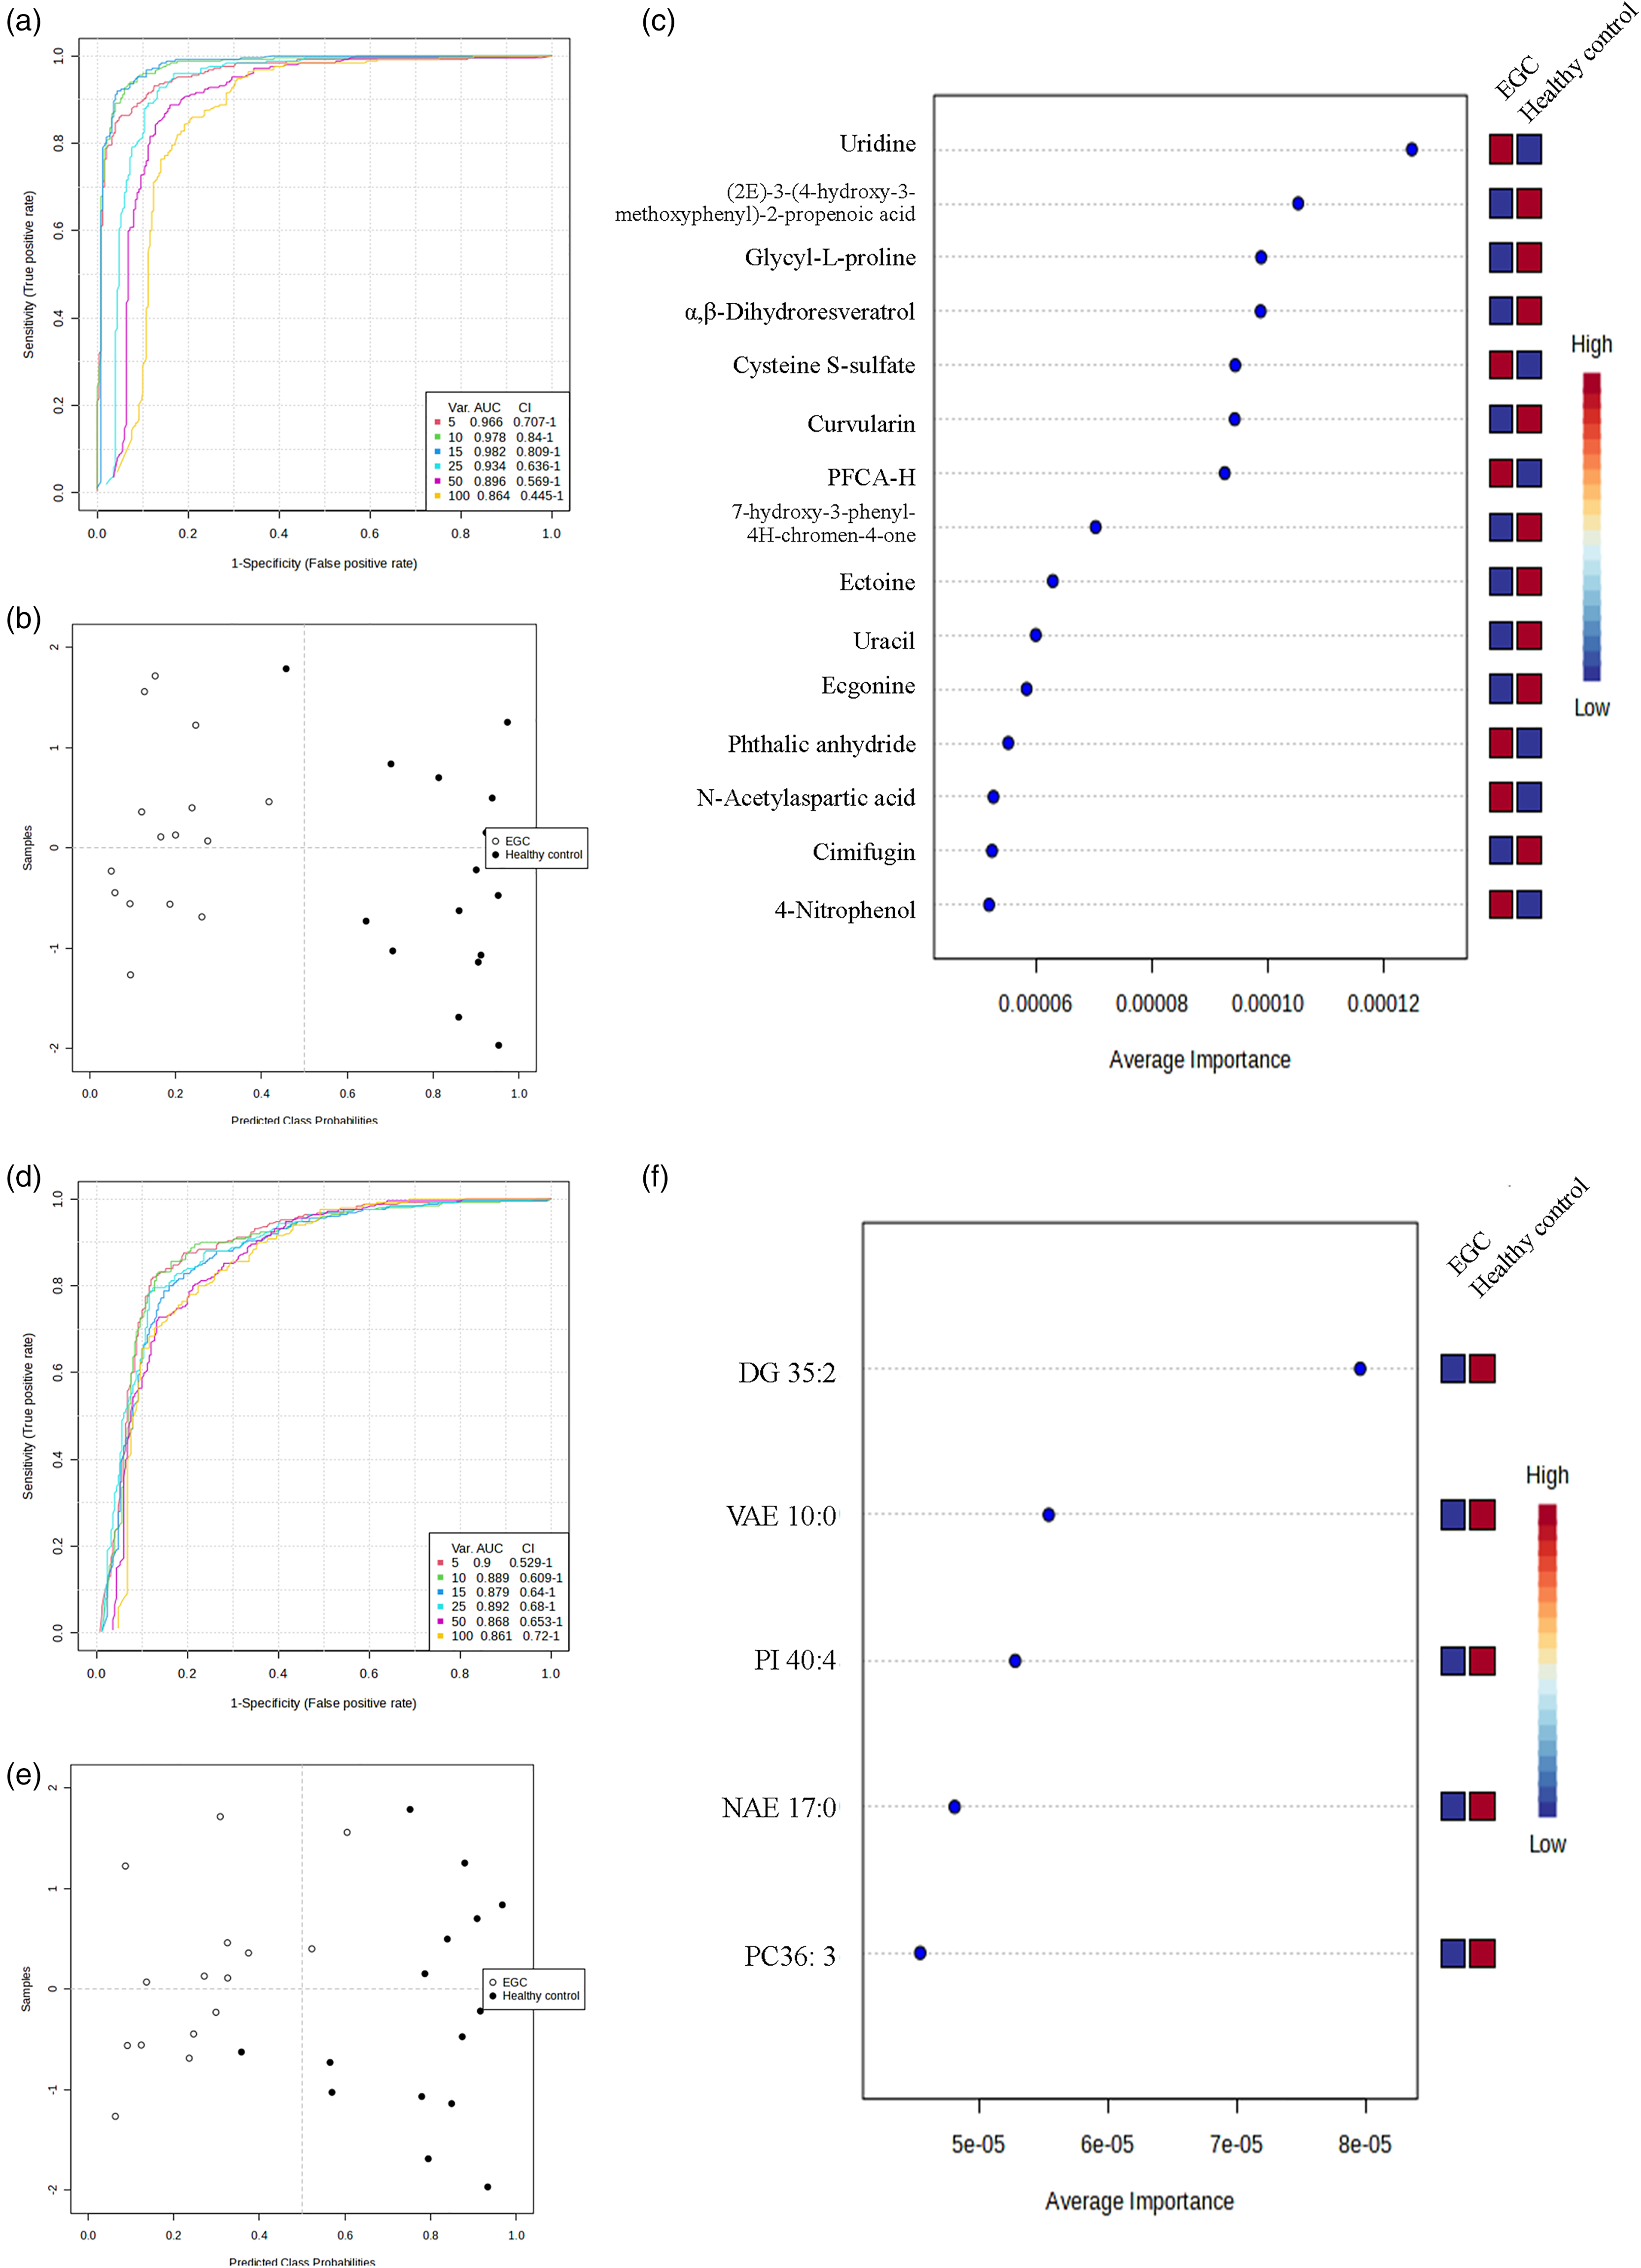
The EGC screening program revealed the potential biomarkers for identifying candidates. The performance of cross-validation (CV) was evaluated by establishing a multivariate ROC curve with a range of 5–100 metabolites (a) or lipids (d). The 15-feature model of metabolites (b) or the 5-feature model of lipids (e) represented the predicted class probabilities, which were obtained by averaging the results of cross-validation for each sample. The prediction model was ranked based on the mean importance measure of the top 15 metabolites (c) or 5 lipids (f), with their corresponding expression levels listed alongside in different colors (red indicating high and blue indicating low).
Discussion
Tumor characteristics often involve the reprogramming of metabolites. The advancement of tumors, along with altered metabolic pathways, necessitates a high requirement for adenosine triphosphate, the carbon structure, and various other compounds. 18 Numerous investigations have concentrated on alterations in metabolism within cells, tissues, or bodily fluids of GC, presenting a few that hold promise as biomarkers for GC.19,20 Therefore, metabolomics is anticipated to emerge as a hopeful instrument for investigating the causes and identifying biomarkers of GC. However, the effective hematological biomarkers for EGC screening are still lacking. In this study, a comparison was made between the metabolites and lipids found in the plasma of EGC patients and healthy volunteers. The findings provide valuable evidence for investigating the underlying mechanisms of the disease and developing new diagnostic biomarkers. This is the first investigation to concentrate on EGC plasma by utilizing metabolomic and lipidomic measurements to discover new biomarkers.
Due to no obvious clinical manifestation, the diagnosis of EGC worldwide currently relies on endoscopy and tissue biopsy. Due to screening conditions, population acceptance, cost, limited number of endoscopy specialists, and the large population, the utilization of endoscopic screening in China has been limited. In China, the current rate of diagnosing and treating EGC is below 10%, which is significantly lower compared to Japan (70%) and South Korea (50%). The exceptional potential for developing biomarkers for early-stage cancer diagnosis lies in the specific metabolic reprogramming observed in precancerous lesions. Metabolomics profiling has been progressively utilized to characterize the functional phenotypes induced by cancer metabolic changes comprehensively. Utilizing metabolomics for EGC screening in the general population and employing gastroscopy pathology for the suspected population presents a viable and cost-effective approach to enhance the detection rate and prognosis of EGC.
Using liquid chromatography-tandem mass spectrometry (LC-MS/MS) in combination with tandem mass tags labeling, our team previously unveiled the proteomic traits of EGC. 21 This study focused on investigating the distinct metabolites and lipids associated with EGC dysregulation and the metabolic characteristics of liposomes in plasma. Our investigation revealed that EGC patients exhibit metabolic abnormalities, specifically an elevation in nucleotide metabolism. Additionally, there is an accumulation of end products resulting from nucleotide breakdown, leading to higher levels of uric acid. This suggests that tumor cells are undergoing rapid proliferation and differentiation. 22 Additionally, it was observed that the EGC group exhibited a substantial rise in plasma concentrations of uridine. Uridine, deemed safe, 23 serves as the organic source for uridine-phosphate, the natural nucleoside precursor in the organism. Nevertheless, certain studies suggest that an imbalance in uridine homeostasis may have some carcinogenic effects.24,25 Hence, the disruption of uridine balance in the blood of individuals with EGC might be a contributing factor to the development of GC, necessitating additional investigation.
Furthermore, in line with the discoveries made by Liu et al., 26 this investigation revealed that LPE, lysophosphatidylcholine (LPC), phosphatidylcholine (PC), CE, Cer, PI, and sphingomyelin (SM) were the main disrupted lipid metabolites in EGC, indicating the distinctive features of lipid metabolism in GC cells. However, the triglyceride-glucose index, which is a recently discovered biomarker representing patients’ metabolism in vivo, 27 was utilized by Kim et al. 28 to forecast the risk of GC. In our study, we also investigated the levels of triglyceride (TG) metabolism but found no significant distinction in most TGs between the EGC and healthy control groups. Nevertheless, it exhibited specific metabolic imbalance (TG 58:7|TG 18:1_18:1_22:5, decreased; TG 50:4|TG 14:0_18:2_18:2, increased). Due to the limited number of 15 EGC patients involved in the study, additional measures such as expanding the sample size and implementing exclusion criteria were necessary to investigate the triglyceride TG levels within the EGC patient group. PhospholipaseA2 can catalyze the production of LPC, or lysophosphatidylcholine acyltransferase 1 (LPCAT1) can convert it to PC. 29 A persistent increase of LPCAT1 leads to a high level of PC accumulation. 30 Unlike the previous study that indicated a continuous decrease in LPCs and PCs in cases of laryngeal cancer 25 or esophageal squamous cell carcinoma (ESCC), 31 our study discovered a notable increase in LPCs and PCs among patients with EGC. In accordance with ESCC, the EGC group also exhibited simultaneous up-regulation of LPEs. Hence, the altitude of LPC and PC could be a distinct feature of lipid processing in EGC. The metabolites serve as the foundation for the formation of membrane glyceride phospholipids, indicating that the heightened metabolic requirement for lipid production in early GC cells could be linked to amplified proliferation and division within cancerous cells. Furthermore, SM plays a crucial role in lipid rafts, which are essential for regulating the function of transmembrane proteins. These lipid rafts can undergo transformation into ceramides, hemolytic phospholipids, and glycolipids through the action of enzymes. 29 Consequently, SM plays a crucial role in controlling numerous biological functions, including cellular inflammation, apoptosis, and growth. This study discovered a potential negative correlation between the declining occurrence of long-chain SMs (SM 44:2, SM 42:3, and SM 44:0) in patients with EGC and the regulation of CD1a and the T-cell receptor binding blockade, 32 suggesting the activation of immune response in individuals with EGC. 33
The study found that the EGC group showed significant up-regulation of metabolites like 2-hydroxy-6-methylisonicotinic acid, anthraquinone, and glutamine, suggesting a potential link between EGC and microbial anaerobic metabolic pathways. In the meantime, the KEGG examination indicated a notable enrichment of the alanine, aspartate, and glutamate metabolic pathway, along with the glyoxylate and dicarboxylate metabolic pathway, in the EGC group. This suggests that early GC cells in this group display energy synthesis through glycolysis, which is based on the metabolism of glutamate. 34 It is worth mentioning that previous research has indicated that the majority of cancerous cells do not possess arginosuccinate synthase 1 (ASS1), resulting in a deficiency of arginine within these cells. 35 Hence, arginine is a cost-effective adjunctive medication for enhancing radiation sensitivity in cancer therapy. 36 Our study revealed that the EGC group exhibited irregularities in the regulation of the arginine biosynthesis pathway, indicating that abnormal arginine synthesis could also be a distinguishing feature of EGC.
In this study, we also applied PLS-DA to identify several metabolites and lipids potentially related to the separation of GC subgroup patients and healthy controls. Some of these features were identical to the dysregulated metabolites and lipids discovered from OPLS-DA models, such as uridine, citrate, VAE 10:0, PI 38:4, LPC 16:1, LPE 16:0, LPE 18:0, and LPE 20:3, suggesting these changes of levels might not only correlate to the occurrence of GC but also the severity. However, the limited sample size hindered the reliability of these results, therefore further validation needs to be done.
Finally, to provide new biomarkers for diagnosis, we describe the metabolic landscape and heterogeneity of EGC using this metabolic data set. The diagnosis of EGC is particularly challenging due to the limitations of traditional GC biomarkers, including CEA, CA72-4, CA19-9, and CA24-2.37–40 Several studies have attempted to enhance these indicators by combining two or more markers through the modification of the thresholds,41–44 yet yielding minimal clinical advantages. Data analysis is utilized in machine learning (ML), a significant field of artificial intelligence, to construct suitable and efficient models for detection or validation purposes. The support vector machine (SVM) is a highly efficient method for classifying data analysis. The integration of machine learning and metabolomics analysis shows significant potential in clinical diagnostics, offering a crucial contribution to the detection and evaluation of EGC. Figure 4 illustrates that numerous imbalanced metabolites and lipids as biomarker panels displayed remarkable discriminatory ability. The SVM-based discriminative mode successfully differentiated EGC patients from the healthy control group using several biomarker panels with an AUC greater than 0.9. In our study, the conventional tumor indicators (CEA and CA19-9) were negative in all 15 patients with EGC as well as the healthy controls. On the other hand, the novel EGC metabolite and lipid biomarkers panels, offered greater specificity and selectivity. These potential indicators offer an alternative option for the advancement of biomarkers in the diagnosis of EGC. It is worth mentioning that plasma metabolomics techniques could be used for screening EGC instead of diagnosing GC, a task that should be carried out by experienced pathologists. Due to the ease and noninvasive nature of plasma analysis, this technique proves to be more convenient for the general population.
There are several constraints that need to be considered in our study. First, both supervised multivariate analysis like OPLS-DA and machine learning algorithms such as SVM are commonly employed in metabolomic studies to determine differences between groups and build predictive models. In this case, the metabolites and lipids identified by the SVM-based model as candidate biomarkers for EGC only partially correspond to those identified as significantly perturbed in the OPLS-DA analysis, possibly partially due to the small sample size. Some researchers also found that the ordering of the metabolites is different in both PLS-DA and SVMs. 45 Moreover, the PLS-DA based method may have missed some important distinguishing factors, implying the significance of using several classification models and selecting the best results. Although we provide the internal validation information of the identified metabolites and lipids including the MS2 spectra matching with references and the peak alignment results obtained from the data processing software in Supplementary Tables 3 and 4 to strengthen the validity and reliability of our findings, further work needs to be done to validate these biomarkers in a larger cohort by targeted methods. Second, our study identified predictive indicators for diagnosing EGC, which were derived from noninvasive plasma samples. Because patients have unique variations, the metabolic candidates obtained might require a more extensive evaluation and should be sampled and tested in a larger group of patients in a clinical setting. Furthermore, this study did not investigate the extent of Helicobacter pylori contamination in individuals with EGC. The growing concern lies in the impact of microorganisms on metabolites. GC development can be influenced by disorders in the composition or function of the gastrointestinal microbiota, such as Helicobacter pylori, as demonstrated in studies.46,47 Therefore, the existence of Helicobacter pylori might clarify alterations in certain metabolites, like pyrimidine nucleotides, in cases of GC. Hence, it is justifiable to contemplate the inclusion of gut microbiota in future investigations on metabolic abnormalities associated with GC. Last, despite the method provided in this study demonstrating high screening performance, it fails to establish a robust correlation between changes in metabolites and the progression of EGC, and it does not identify a singular marker metabolite that accurately represents the distinctive metabolic traits of EGC.
Conclusions
In summary, the current investigation utilized HPLC-MS to examine the plasma metabolomics and lipidomics in EGC patients and healthy controls, providing a comprehensive perspective on the altered plasma metabolites and lipids. In the EGC group, there were disruptions in three metabolic pathways, and a total of 19 metabolites and 67 lipids were perturbed. Through SVM-based multivariate ROC analysis, we discovered multiple prospective biomarker panels for EGC screening, and the models with 15 metabolites (uridine, (2E)-3-(4-hydroxy-3-methoxyphenyl)-2-propenoic acid, glycyl-L-proline, α,β-dihydroresveratrol, cysteine S-sulfate, curvularin, PFCA-H, 7-hydroxy-3-phenyl-4H-chromen-4-one, ectoine, uracil, ecgonine, phthalic anhydride, N-acetylaspartic acid, cimifugin, 4-nitrophenol) or 5 lipids (DG 35:2, VAE 10:0, PI 40:4, NAE 17:0, and PC 36:3) had the best AUC values. Our study could offer novel perspectives for future pathological investigations in GC.
Supplemental Material
sj-docx-1-jbm-10.1177_03936155241258780 - Supplemental material for Plasma metabolomics and lipidomics reveal potential novel biomarkers in early gastric cancer: An explorative study
Supplemental material, sj-docx-1-jbm-10.1177_03936155241258780 for Plasma metabolomics and lipidomics reveal potential novel biomarkers in early gastric cancer: An explorative study by Feng Wang, Ruifang Pang, Xudong Zhao, Bin Zhou, Yuan Tian, Yongchen Ma and Long Rong in The International Journal of Biological Markers
Supplemental Material
sj-docx-2-jbm-10.1177_03936155241258780 - Supplemental material for Plasma metabolomics and lipidomics reveal potential novel biomarkers in early gastric cancer: An explorative study
Supplemental material, sj-docx-2-jbm-10.1177_03936155241258780 for Plasma metabolomics and lipidomics reveal potential novel biomarkers in early gastric cancer: An explorative study by Feng Wang, Ruifang Pang, Xudong Zhao, Bin Zhou, Yuan Tian, Yongchen Ma and Long Rong in The International Journal of Biological Markers
Supplemental Material
sj-docx-3-jbm-10.1177_03936155241258780 - Supplemental material for Plasma metabolomics and lipidomics reveal potential novel biomarkers in early gastric cancer: An explorative study
Supplemental material, sj-docx-3-jbm-10.1177_03936155241258780 for Plasma metabolomics and lipidomics reveal potential novel biomarkers in early gastric cancer: An explorative study by Feng Wang, Ruifang Pang, Xudong Zhao, Bin Zhou, Yuan Tian, Yongchen Ma and Long Rong in The International Journal of Biological Markers
Supplemental Material
sj-docx-4-jbm-10.1177_03936155241258780 - Supplemental material for Plasma metabolomics and lipidomics reveal potential novel biomarkers in early gastric cancer: An explorative study
Supplemental material, sj-docx-4-jbm-10.1177_03936155241258780 for Plasma metabolomics and lipidomics reveal potential novel biomarkers in early gastric cancer: An explorative study by Feng Wang, Ruifang Pang, Xudong Zhao, Bin Zhou, Yuan Tian, Yongchen Ma and Long Rong in The International Journal of Biological Markers
Supplemental Material
sj-docx-5-jbm-10.1177_03936155241258780 - Supplemental material for Plasma metabolomics and lipidomics reveal potential novel biomarkers in early gastric cancer: An explorative study
Supplemental material, sj-docx-5-jbm-10.1177_03936155241258780 for Plasma metabolomics and lipidomics reveal potential novel biomarkers in early gastric cancer: An explorative study by Feng Wang, Ruifang Pang, Xudong Zhao, Bin Zhou, Yuan Tian, Yongchen Ma and Long Rong in The International Journal of Biological Markers
Supplemental Material
sj-docx-6-jbm-10.1177_03936155241258780 - Supplemental material for Plasma metabolomics and lipidomics reveal potential novel biomarkers in early gastric cancer: An explorative study
Supplemental material, sj-docx-6-jbm-10.1177_03936155241258780 for Plasma metabolomics and lipidomics reveal potential novel biomarkers in early gastric cancer: An explorative study by Feng Wang, Ruifang Pang, Xudong Zhao, Bin Zhou, Yuan Tian, Yongchen Ma and Long Rong in The International Journal of Biological Markers
Supplemental Material
sj-docx-7-jbm-10.1177_03936155241258780 - Supplemental material for Plasma metabolomics and lipidomics reveal potential novel biomarkers in early gastric cancer: An explorative study
Supplemental material, sj-docx-7-jbm-10.1177_03936155241258780 for Plasma metabolomics and lipidomics reveal potential novel biomarkers in early gastric cancer: An explorative study by Feng Wang, Ruifang Pang, Xudong Zhao, Bin Zhou, Yuan Tian, Yongchen Ma and Long Rong in The International Journal of Biological Markers
Supplemental Material
sj-docx-8-jbm-10.1177_03936155241258780 - Supplemental material for Plasma metabolomics and lipidomics reveal potential novel biomarkers in early gastric cancer: An explorative study
Supplemental material, sj-docx-8-jbm-10.1177_03936155241258780 for Plasma metabolomics and lipidomics reveal potential novel biomarkers in early gastric cancer: An explorative study by Feng Wang, Ruifang Pang, Xudong Zhao, Bin Zhou, Yuan Tian, Yongchen Ma and Long Rong in The International Journal of Biological Markers
Supplemental Material
sj-docx-9-jbm-10.1177_03936155241258780 - Supplemental material for Plasma metabolomics and lipidomics reveal potential novel biomarkers in early gastric cancer: An explorative study
Supplemental material, sj-docx-9-jbm-10.1177_03936155241258780 for Plasma metabolomics and lipidomics reveal potential novel biomarkers in early gastric cancer: An explorative study by Feng Wang, Ruifang Pang, Xudong Zhao, Bin Zhou, Yuan Tian, Yongchen Ma and Long Rong in The International Journal of Biological Markers
Supplemental Material
sj-docx-10-jbm-10.1177_03936155241258780 - Supplemental material for Plasma metabolomics and lipidomics reveal potential novel biomarkers in early gastric cancer: An explorative study
Supplemental material, sj-docx-10-jbm-10.1177_03936155241258780 for Plasma metabolomics and lipidomics reveal potential novel biomarkers in early gastric cancer: An explorative study by Feng Wang, Ruifang Pang, Xudong Zhao, Bin Zhou, Yuan Tian, Yongchen Ma and Long Rong in The International Journal of Biological Markers
Supplemental Material
sj-docx-11-jbm-10.1177_03936155241258780 - Supplemental material for Plasma metabolomics and lipidomics reveal potential novel biomarkers in early gastric cancer: An explorative study
Supplemental material, sj-docx-11-jbm-10.1177_03936155241258780 for Plasma metabolomics and lipidomics reveal potential novel biomarkers in early gastric cancer: An explorative study by Feng Wang, Ruifang Pang, Xudong Zhao, Bin Zhou, Yuan Tian, Yongchen Ma and Long Rong in The International Journal of Biological Markers
Supplemental Material
sj-docx-12-jbm-10.1177_03936155241258780 - Supplemental material for Plasma metabolomics and lipidomics reveal potential novel biomarkers in early gastric cancer: An explorative study
Supplemental material, sj-docx-12-jbm-10.1177_03936155241258780 for Plasma metabolomics and lipidomics reveal potential novel biomarkers in early gastric cancer: An explorative study by Feng Wang, Ruifang Pang, Xudong Zhao, Bin Zhou, Yuan Tian, Yongchen Ma and Long Rong in The International Journal of Biological Markers
Supplemental Material
sj-docx-13-jbm-10.1177_03936155241258780 - Supplemental material for Plasma metabolomics and lipidomics reveal potential novel biomarkers in early gastric cancer: An explorative study
Supplemental material, sj-docx-13-jbm-10.1177_03936155241258780 for Plasma metabolomics and lipidomics reveal potential novel biomarkers in early gastric cancer: An explorative study by Feng Wang, Ruifang Pang, Xudong Zhao, Bin Zhou, Yuan Tian, Yongchen Ma and Long Rong in The International Journal of Biological Markers
Supplemental Material
sj-docx-14-jbm-10.1177_03936155241258780 - Supplemental material for Plasma metabolomics and lipidomics reveal potential novel biomarkers in early gastric cancer: An explorative study
Supplemental material, sj-docx-14-jbm-10.1177_03936155241258780 for Plasma metabolomics and lipidomics reveal potential novel biomarkers in early gastric cancer: An explorative study by Feng Wang, Ruifang Pang, Xudong Zhao, Bin Zhou, Yuan Tian, Yongchen Ma and Long Rong in The International Journal of Biological Markers
Supplemental Material
sj-docx-15-jbm-10.1177_03936155241258780 - Supplemental material for Plasma metabolomics and lipidomics reveal potential novel biomarkers in early gastric cancer: An explorative study
Supplemental material, sj-docx-15-jbm-10.1177_03936155241258780 for Plasma metabolomics and lipidomics reveal potential novel biomarkers in early gastric cancer: An explorative study by Feng Wang, Ruifang Pang, Xudong Zhao, Bin Zhou, Yuan Tian, Yongchen Ma and Long Rong in The International Journal of Biological Markers
Supplemental Material
sj-docx-16-jbm-10.1177_03936155241258780 - Supplemental material for Plasma metabolomics and lipidomics reveal potential novel biomarkers in early gastric cancer: An explorative study
Supplemental material, sj-docx-16-jbm-10.1177_03936155241258780 for Plasma metabolomics and lipidomics reveal potential novel biomarkers in early gastric cancer: An explorative study by Feng Wang, Ruifang Pang, Xudong Zhao, Bin Zhou, Yuan Tian, Yongchen Ma and Long Rong in The International Journal of Biological Markers
Supplemental Material
sj-docx-17-jbm-10.1177_03936155241258780 - Supplemental material for Plasma metabolomics and lipidomics reveal potential novel biomarkers in early gastric cancer: An explorative study
Supplemental material, sj-docx-17-jbm-10.1177_03936155241258780 for Plasma metabolomics and lipidomics reveal potential novel biomarkers in early gastric cancer: An explorative study by Feng Wang, Ruifang Pang, Xudong Zhao, Bin Zhou, Yuan Tian, Yongchen Ma and Long Rong in The International Journal of Biological Markers
Footnotes
Author contributions
FW and RP wrote the manuscript and conducted the experiments; XZ, BZ, and YT conducted samples acquisition and management; FW, RP, and YM analyzed data; LR was responsible for research program leadership and resourcing and designed the study. FW and RP contributed equally to this work. All authors have read and agreed to the published version of the manuscript.
Declaration of conflicting interests
The authors declared no potential conflicts of interest with respect to the research, authorship, and/or publication of this article.
Funding
The authors disclosed receipt of the following financial support for the research, authorship, and/or publication of this article: This research was supported by the Peking University Medicine Seed Fund for Interdisciplinary Research supported by “the Fundamental Research Funds for the Central Universities” (No. BMU2023YFJHMX011), the Beijing Natural Science Foundation of China (No. 7214259) and the Youth Clinical Research Project of Peking University First Hospital (No. 2021CR06).
Institutional review board statement
The study was conducted in accordance with the Declaration of Helsinki and approved by the Ethics Committee of Peking University First Hospital for studies involving humans.
Supplemental material
Supplemental material for this article is available online.
References
Supplementary Material
Please find the following supplemental material available below.
For Open Access articles published under a Creative Commons License, all supplemental material carries the same license as the article it is associated with.
For non-Open Access articles published, all supplemental material carries a non-exclusive license, and permission requests for re-use of supplemental material or any part of supplemental material shall be sent directly to the copyright owner as specified in the copyright notice associated with the article.