
Abstract
Background
The correlation of the expression of ankyrin repeat domain (ANKRD) family members with renal cell carcinoma prognosis was investigated.
Methods
The GEPIA2, GEO2R, UALCAN, GDC, OncoLnc, TIMER, PanglaoDB, CancerSEA, and Tabula Muris databases were used. Twelve ANKRD family members were identified as having overexpressed renal cell carcinoma samples. The ANKRD13D was identified as a renal cell carcinoma-specific target by cross-referencing the multiple survival databases. To clarify the role of ANKRD13D, the expression of NAKRD13D was analyzed at the single-cell level.
Results
ANKRD13D was mainly expressed in immune cells and positively correlated with Treg cell infiltration. The expression of ANKRD13D was also positively correlated with PDCD1, CTLA4, LAG3, TNFSF14, and ISG20. The overexpression of ANKRD13D in Treg was confirmed using reverse transcription-quantitative polymerase chain reaction. The structure of ANKRD13D was predicted using AlphaFold.
Conclusion
In conclusion, we identified ANKRD13D as a key immune regulator, and targeting ANKRD13D with immune checkpoints blockade may be a promoting strategy for renal cell carcinoma immunotherapy.
Introduction
Renal cell carcinoma (RCC) is the most common clinically malignant kidney tumor. The most frequent histological subtypes of RCC include clear cell renal cell carcinomas (ccRCC, or KIRC), papillary renal cell carcinomas (pRCC, or KIRP), and chromophobe renal cell carcinomas (crRCC, or KICH). 1 The most typical subtype is ccRCC/KIRC), which accounts for ∼70%–75%. 2 Despite significant advancements in understanding the molecular mechanisms and therapy approaches for RCC, the prognosis for RCC patients remains discouraging. 3 Consequently, it is urgent to explore novel prognostic target genes.
Ankyrin repeat domain (ANKRD) is a special motif identified mainly in the C-terminal of ANKRD family members.4,5 The ANKRD region usually forms a β-hairpin–α-helix–loop–α-helix (β2α2) secondary structure. 4 Another characteristic motif of ANKRD family members is the N-terminal 30-residue motif (named KN motif). In addition to the characteristic features, the Ub-interacting motif (UIM) specifically binding to ubiquitin is also identified in some ANKRD family proteins. 6 Several ANKRD proteins have been found to be positively or negatively correlated with cancer patients’ prognoses. High ANKRD29 was found to correlate with better clinical outcomes in lung cancer. 7 However, ANKRD22 was found to promote cancer progression by up-regulating the expression of E2F1. 8 The ANKRD22 enhanced breast cancer cell malignancy in a Wnt/β-catenin pathway. 9 Inhibition of ANKRD1 increases the sensitivity of the human ovarian cancer cells to apoptosis induced by cisplatin.10,11 Hundreds of ANRKRD family members are identified in eukaryotes, but we know little about the roles of ANKRD family proteins in clinical cancer diagnosis and therapy.
In our present study, we used the GEPIA2, GEO2R, UALCAN, GDC, OncoLnc, TIMER, PanglaoDB, CancerSEA, and Tabula Muris databases to explore the correlation of ANKRD family members with RCC. According to the flowchart in Figure 1(a), we explored the expression of ANKRD family members in RCC tissues and the correlation of ANKRD expression with survival time. ANKRD13D was identified and confirmed at the single-cell level. ANKRD13D is mainly expressed in immune cells and positively correlated with Treg cell infiltration. The expression of ANKRD13D was also positively correlated with the expression of PDCD1, CTLA4, LAG3, TNFSF14, and ISG20. Furthermore, we found that the expression of ANKRD13D was higher in Treg cells (CD4 + CD25 + CD127 - FOXP3 +) than that in CD4 + CD25 - CD127 - FOXP3- T cells, which were collected from the peripheral blood of the volunteers using flow cytometry. In conclusion, we identified ANKRD13d as a key immune regulator in the tumor microenvironment. An AI-based study targeting ANKRD13D small molecule screening is in progress.
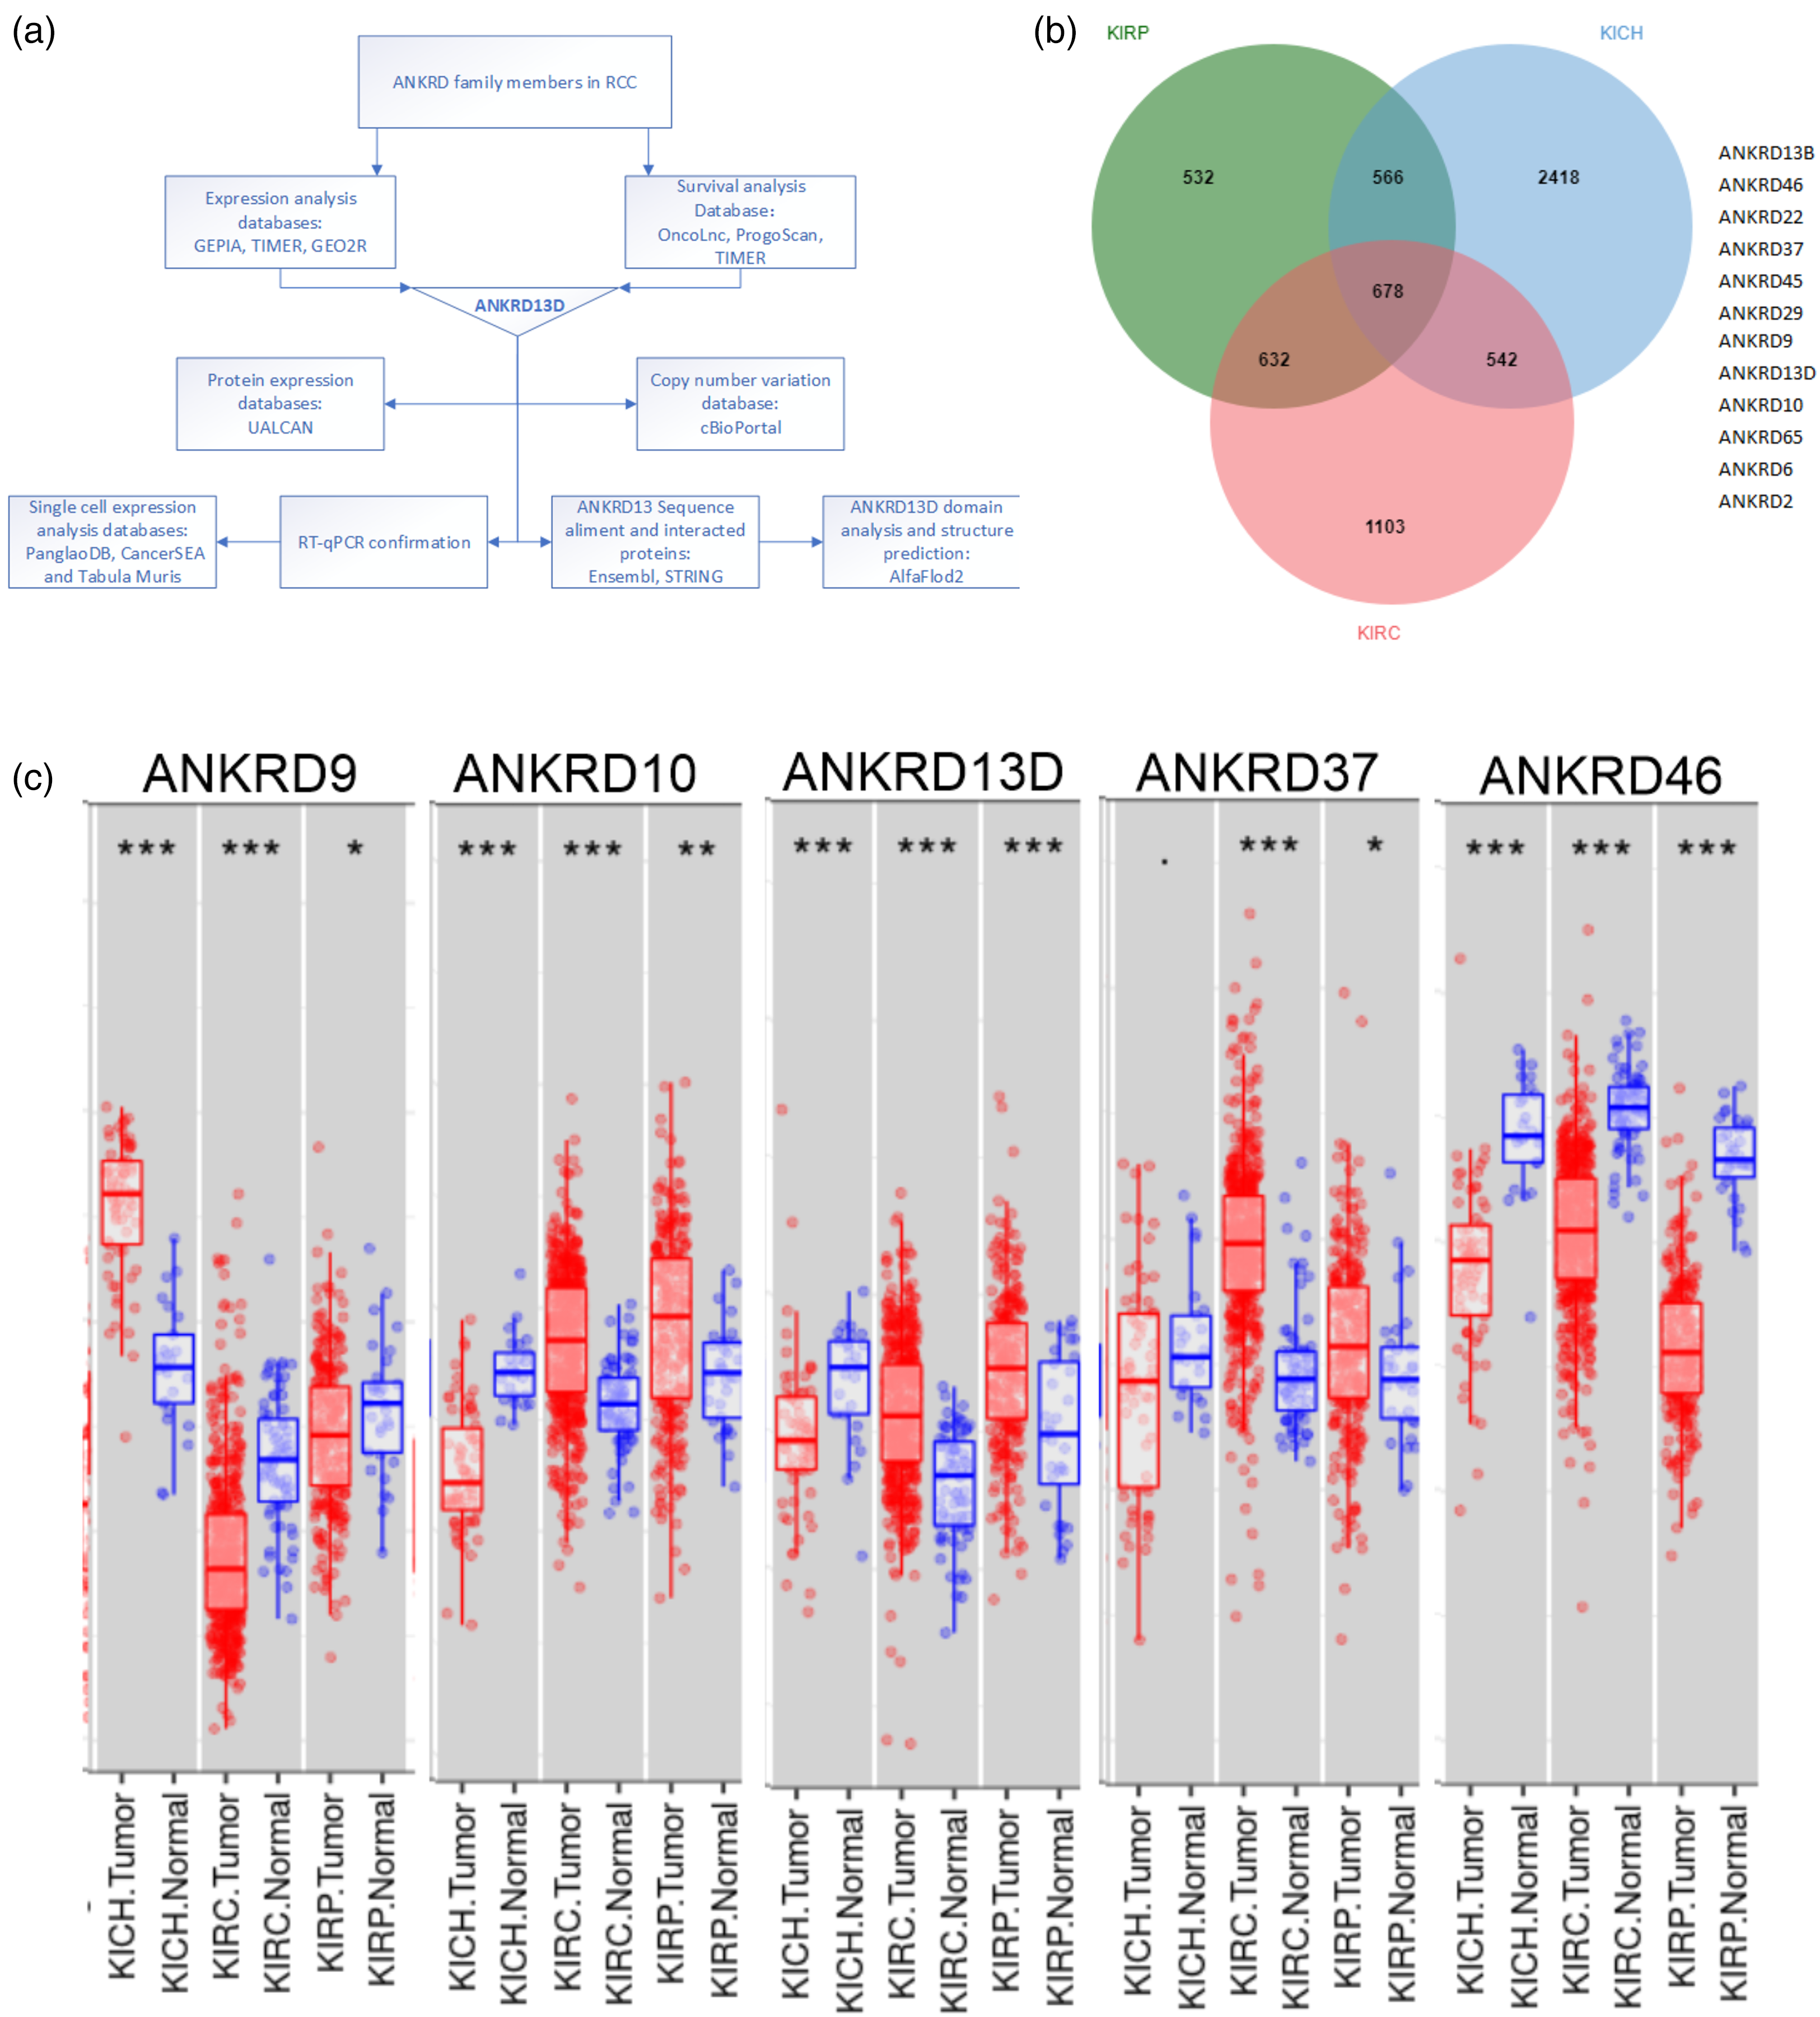
Identification of genes changed in Pan-RCC. (a) The analysis flow chart. (b) Venn diagram of genes in RCC (DESeq2, FDR < 0.05). (c) The expression of selected genes confirmed using TIMER in RCC subtypes.
Materials and methods
Identification of DEGs
GEO2R, GEPIA2, and TIMER were used to analyze the ANKRD family members’ DEGs in RCC samples (ccRCC/KIRC, pRCC/KIRP, crRCC/KICH) according to the manufacturers’ instructions.12–14 The DEGs data were elevated and compared across multiple databases. The volcano plot and Venn diagram of DEGs were created using the data selected.
Survival analysis
The expression of ANKRD family members with survival time was examined across GEPIA2, OncoLnc, ProgoScan, and TIMER databases according to the manufacturer instructions.12,13,15,16 The P < 0.05 suggested significance. UALCAN is a comprehensive and interactive website for analyzing databases according to the TCGA project. 17 UALCAN was used to validate the correlation of target genes’ protein expression with survival time.
Immune cell infiltration analysis
To investigate the association between the expression of ANKRD13D and immune infiltration in RCC patients, the immune infiltration profile was identified via the TIMER. The correlation of ANKRD13D with immune checkpoints (PDCD1, CTLA4, LAG3, TNFSF14, and ISG20) was evaluated using the TIMER database.16,18
Single-Cell RNA-Seq analysis
We use the PanglaoDB, CancerSEA, and Tabula Muris databases to analyze the ANKRD13D expression both in humans and mice according to the manufacturer instructions.19–21 The ANKRD13D expression was analyzed in the PanglaoDB database normal human (SRA645804) and Tabula Muris database mouse tissues. The function analysis of ANKRD13D and expression at the single-cell level was analyzed in RCC patient-derived xenografts tumor samples using the CancerSEA database.
Treg cell isolation and ANKRD13D expression detection
The peripheral blood was collected from volunteers and approved by The Institutional Ethics Review Committee of Zhoushan Hospital (Approval Number: 2020-003). Informed consent was obtained from each individual in accordance with the Helsinki Declaration. The CD4+ CD25+ FOXP3+ Treg cell and CD4+ CD25- FOXP3- T cells were sorted using CytoFLEX SRT Cell Sorter. PE-conjugated FOXP3, PC5.5-conjugated CD4 and PC7-conjugated CD25 were purchased from BD (Becton, Dickinson and Company, Franklin Lakes, NJ, USA). 22 Reverse transcription polymerase chain reaction (RT-qPCR) was performed by One-step SYBR® PrimeScript™ Kit II (TaKaRa Dalian Biotechnology Co., Ltd Dalian, China) on Bio-Rad iQ5 Real-Time PCR Detection System. The primers were acquired from primer bank (Primer Bank ID 269315851c3). 23
Results
Transcript expression of ANKRD family members in Pan-RCC
To analyze the prognostic and therapy value of ANKRD family members in Pan-RCC (ccRCC/KIRC, pRCC/KIRP, crRCC/KICH), we designed a flow chart Figure 1(a). First, the GEPIA2 database was used. There are 678 gene expression changes in all the three RCC cancer types. Further analysis found that 12 ANKRD family numbers were changed in RCC (Figure 1(b) and Tables S1 to S3). Second, we evaluated the expression of the 12 ANKRD genes through the database TIMER. According to the expression threshold and the Gene-DEC in TIMER, 5 genes (ANKRD9, ANKRD10, ANKRD13D, ANKRD37, and ANKRD46) were selected (Figure 1(c)). The changed expression of these five genes in RCC were further confirmed using the GEO (GSE68784) database.
Survival analysis of selected genes in Pan-RCC
To further assess the association between the candidate genes and survival time, we took advantage of the strengths of all four databases, OncoLnc, ProgoScan, UALCA and TIMER. ccRCC/KIRC, one of the RCC subtypes, with the highest proportion has aroused great interest among clinicians and scientists. In the current analysis, ANKRD9, ANKRD10, ANKRD13D, ANKRD37, and ANKRD46 were evaluated in 1017 ccRCC/KIRC samples. We found that the higher expression of ANKRD9, ANKRD10, and ANKRD13D was associated with poor prognosis (Figure 2(a) to (c)). However, the higher expression of ANKRD46 predicted good prognosis (Figure 2(d)). The ANKRD37 was not correlated with the mortality risk (Figure 2(e)). We further analyzed the survival data across the four databases, and found that the survival curves of OncoLnc and UALCA are from the same RCC data set. The ProgoScan database does not distinguish subtypes of RCC and is not easy for precision target discovery. The expression and survival time receiver operating characteristic (ROC) were generated using the online software Bioinformatics (Figure 2(f) and (g)).
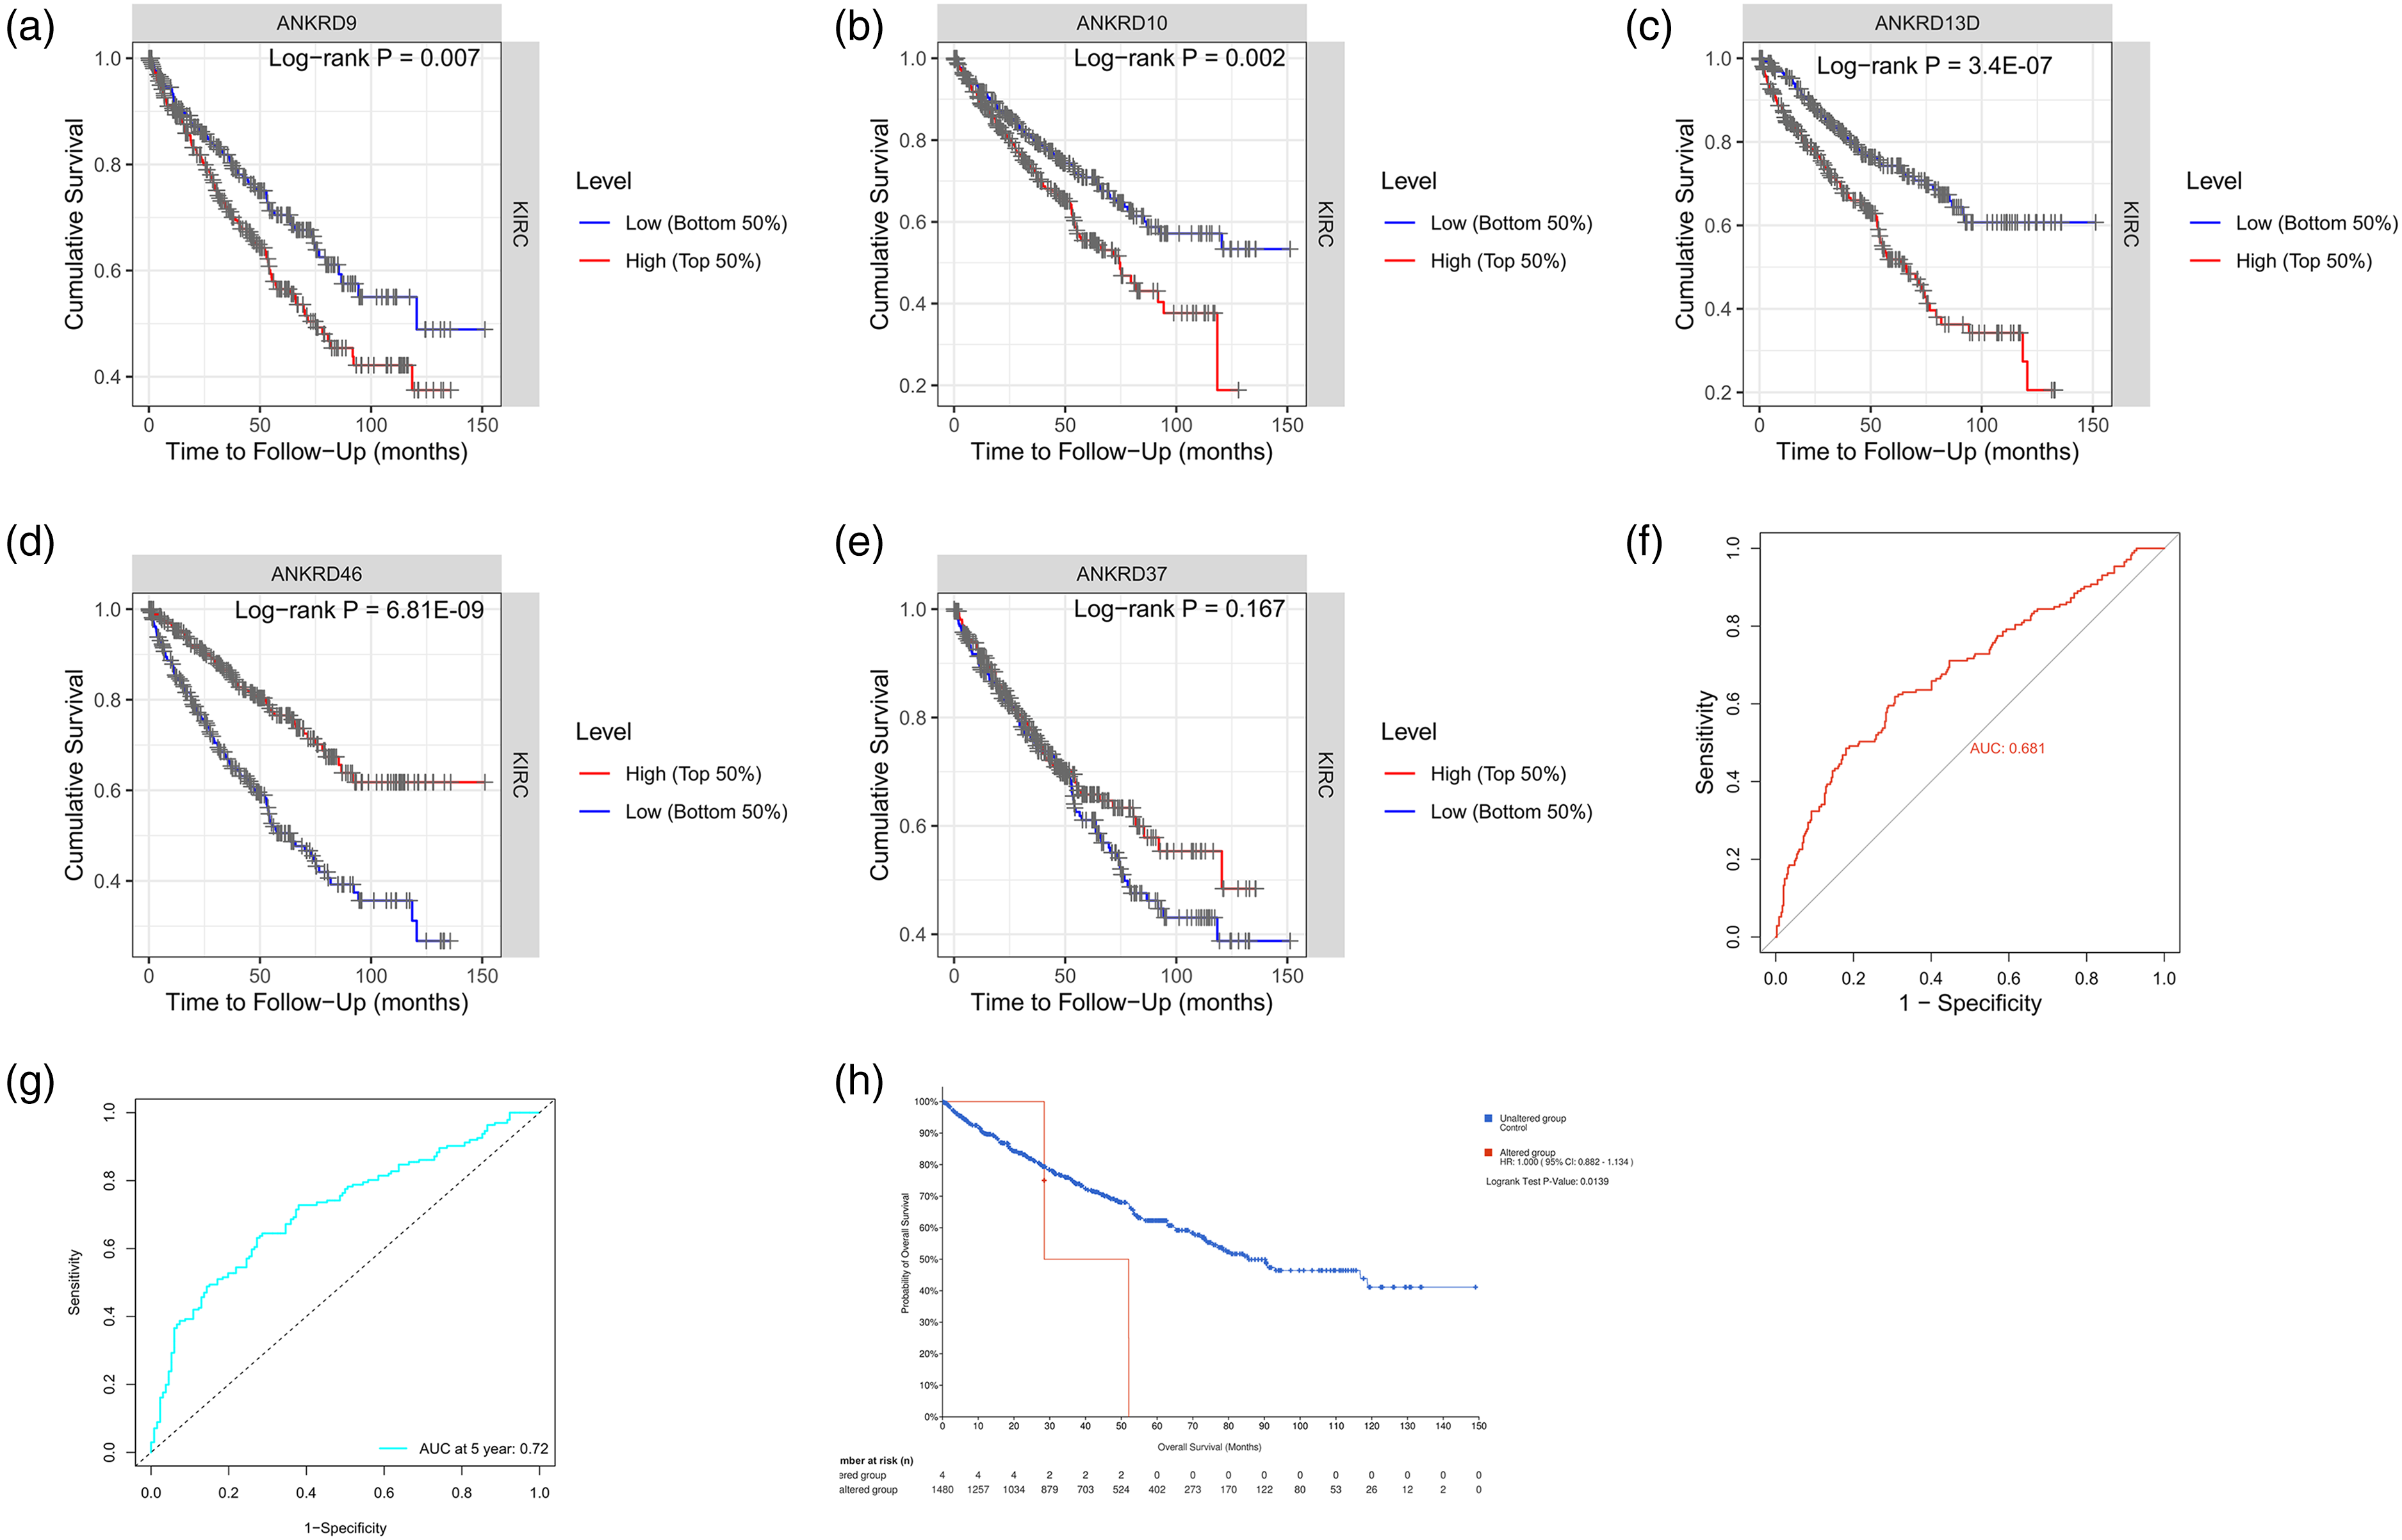
The survival analysis of the five genes using TIMER, OncoLnc, ProgoScan, and UALCA. The survival cure of the ANKRD9 (a), ANKRD10 (b), ANKRD13D (c), ANKRD46 (d), and ANKRD37 (e) generated in TIMER shown. The expression ROC (f) and survival time ROC (g) of ANKRD13D. (h) The survival curve of patients with ANKRD13D copy number variation.
The copy number of genes affects the mRNA expression. The cBioPortal was used to analyze the correlation between the copy number and the survival time. We found that the copy number of the three genes (ANKRD9, ANKRD10, and ANKRD13D) had changed, and the ANKRD13D altered group showed a poor prognosis (Figure 2(h)).
Protein expression of selected genes in Pan-RCC
To confirm the protein expression of these three selected genes, we used the UALCAN database, the data of which were collected from the Clinical Proteomic Tumor Analysis Consortium (CPTAC) and the International Cancer Proteogenome Consortium (ICPC) datasets. The protein expression of ANKRD9 was not identified in the UALCAN database. The protein expression of ANKRD10 had no significant difference between normal and tumor samples (Figure 3(a)). The protein expression of ANKRD13D had significantly changed, which was consistent with the mRNA expression level (Figure 3(b)). Furthermore, the ANKRD13D protein expression was compared in different RCC stages. The protein expression in the normal group was lower than that in all the RCC stages; however, there was no difference among patients with different RCC stages (Figure 3(c)). These results indicated that ANKRD13D cannot be used to distinguish different RCC stages. The ANKRD13D protein expression in the normal group was significantly decreased compared with different tumor grades. All the data above suggested that ANKRD13D is a potential candidate target for cancer therapy and diagnosis.
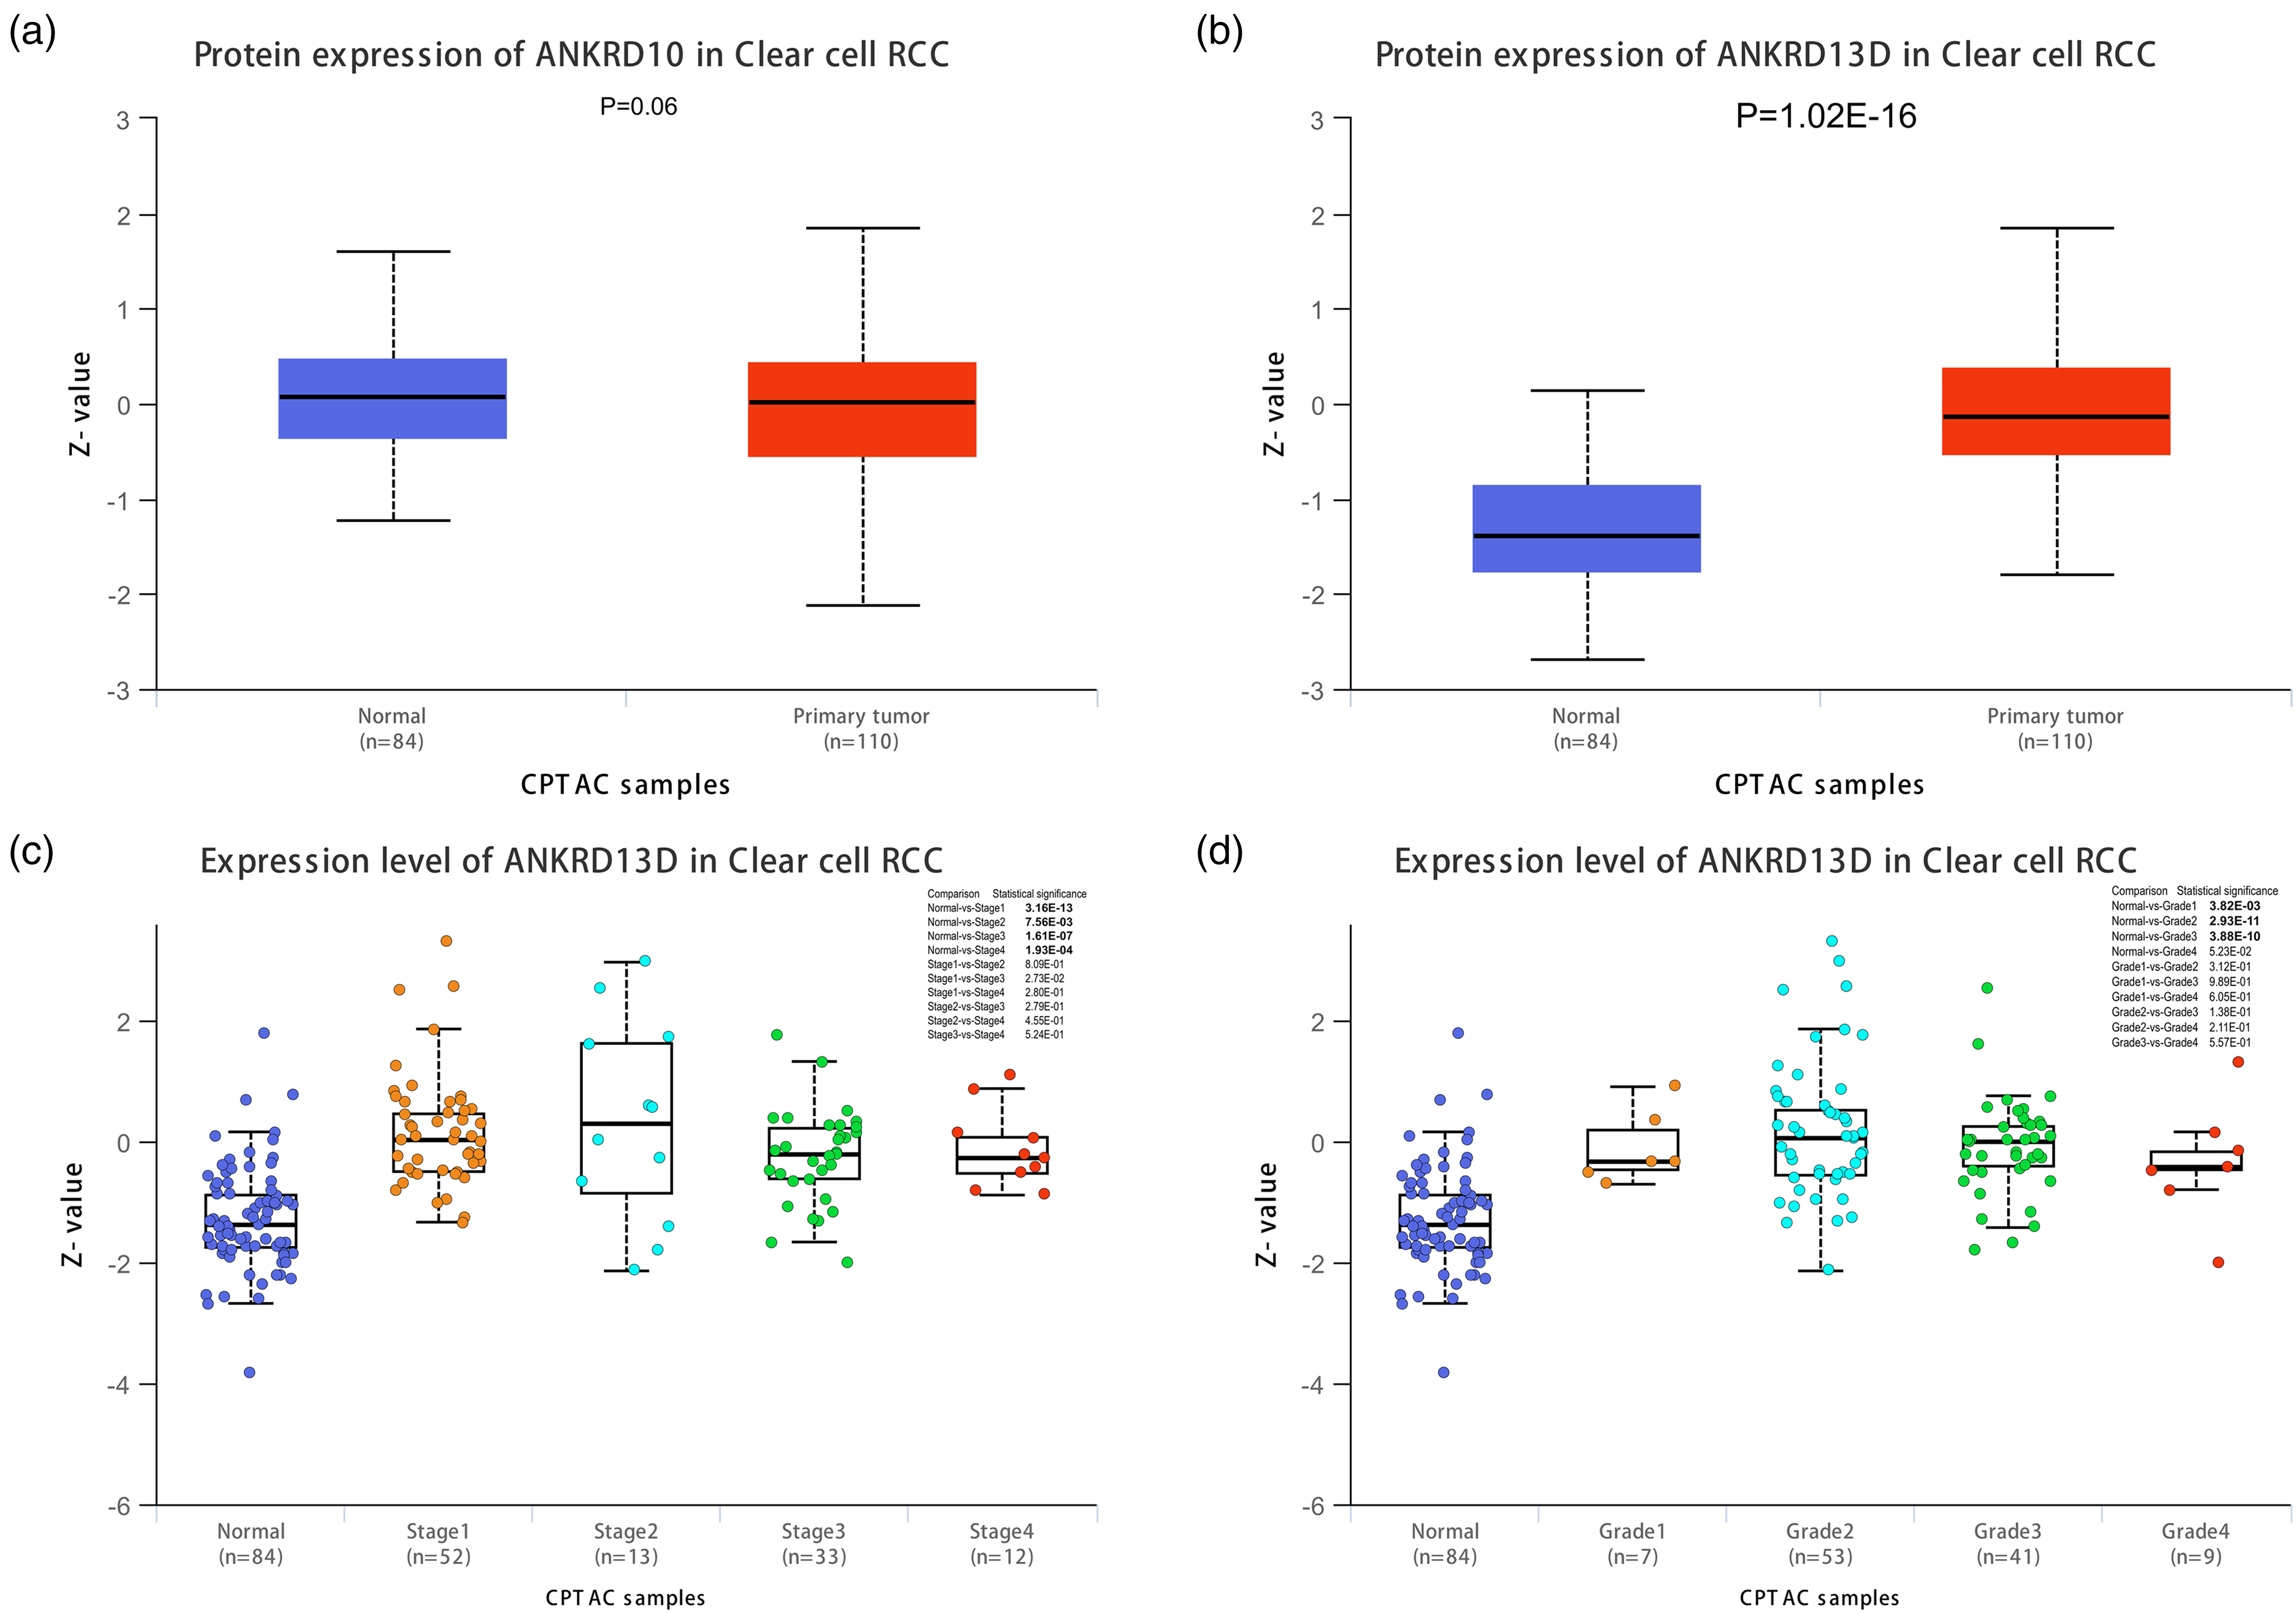
The protein expression of ANKRD10 and ANKRD13D. (a) The protein expression of ANKRD10 in normal and tumor samples. (b) The protein expression of ANKRD13D in normal and tumor samples. (c) The protein expression of ANKRD13D at different clinical stage. (d) The protein expression of ANKRD at different grade. P < 0.05 means statistically significant.
ANKRD13D expression at the single-cell level
Single-cell sequencing method provides cell-specific genetic information and helps reveal the detailed function and role of target genes. We used the PanglaoDB, CancerSEA, and Tabula Muris databases to analyze the ANKRD13D expression in different cell types both in human and mouse testis samples. The ANKRD13D was expressed in human endothelial cells (n = 102/4574), germ cells (n = 4105/4574), peritubular myoid cells (n = 46/4574), and smooth muscle cells (n = 94/4574) (Figure 4(a) and (b)). ANKRD13D was expressed in endothelial cells, epithelial cells of proximal tubule, kidney collecting duct epithelial cells, macrophages, and natural killer cells in mouse kidney samples (Figure 4(c) and (d)). We further explored the correlations between ANKRD13D and functional states in different cancers using the Cancer SEA database and found that the ANKRD13D was significantly related to angiogenesis, apoptosis, cell cycle, differentiation, DNA damage, DNA repair, EMT, hypoxia, inflammation, invasion, metastasis, proliferation, quiescence, and stemness (Figure 4(e)). The level of ANKRD13D expression in different cells was evaluated and revealed that ANKRD13D was mainly associated with stemness in RCC patient-derived xenografts tumor samples (Figure 4(f)). The expression of ANKRD13D at the single-cell level was checked in the HPA database. The ANKRD13D is mainly expressed in the immune cells, indicating that the ANKRD13D may also participate in the regulation of RCC immune microenvironments.
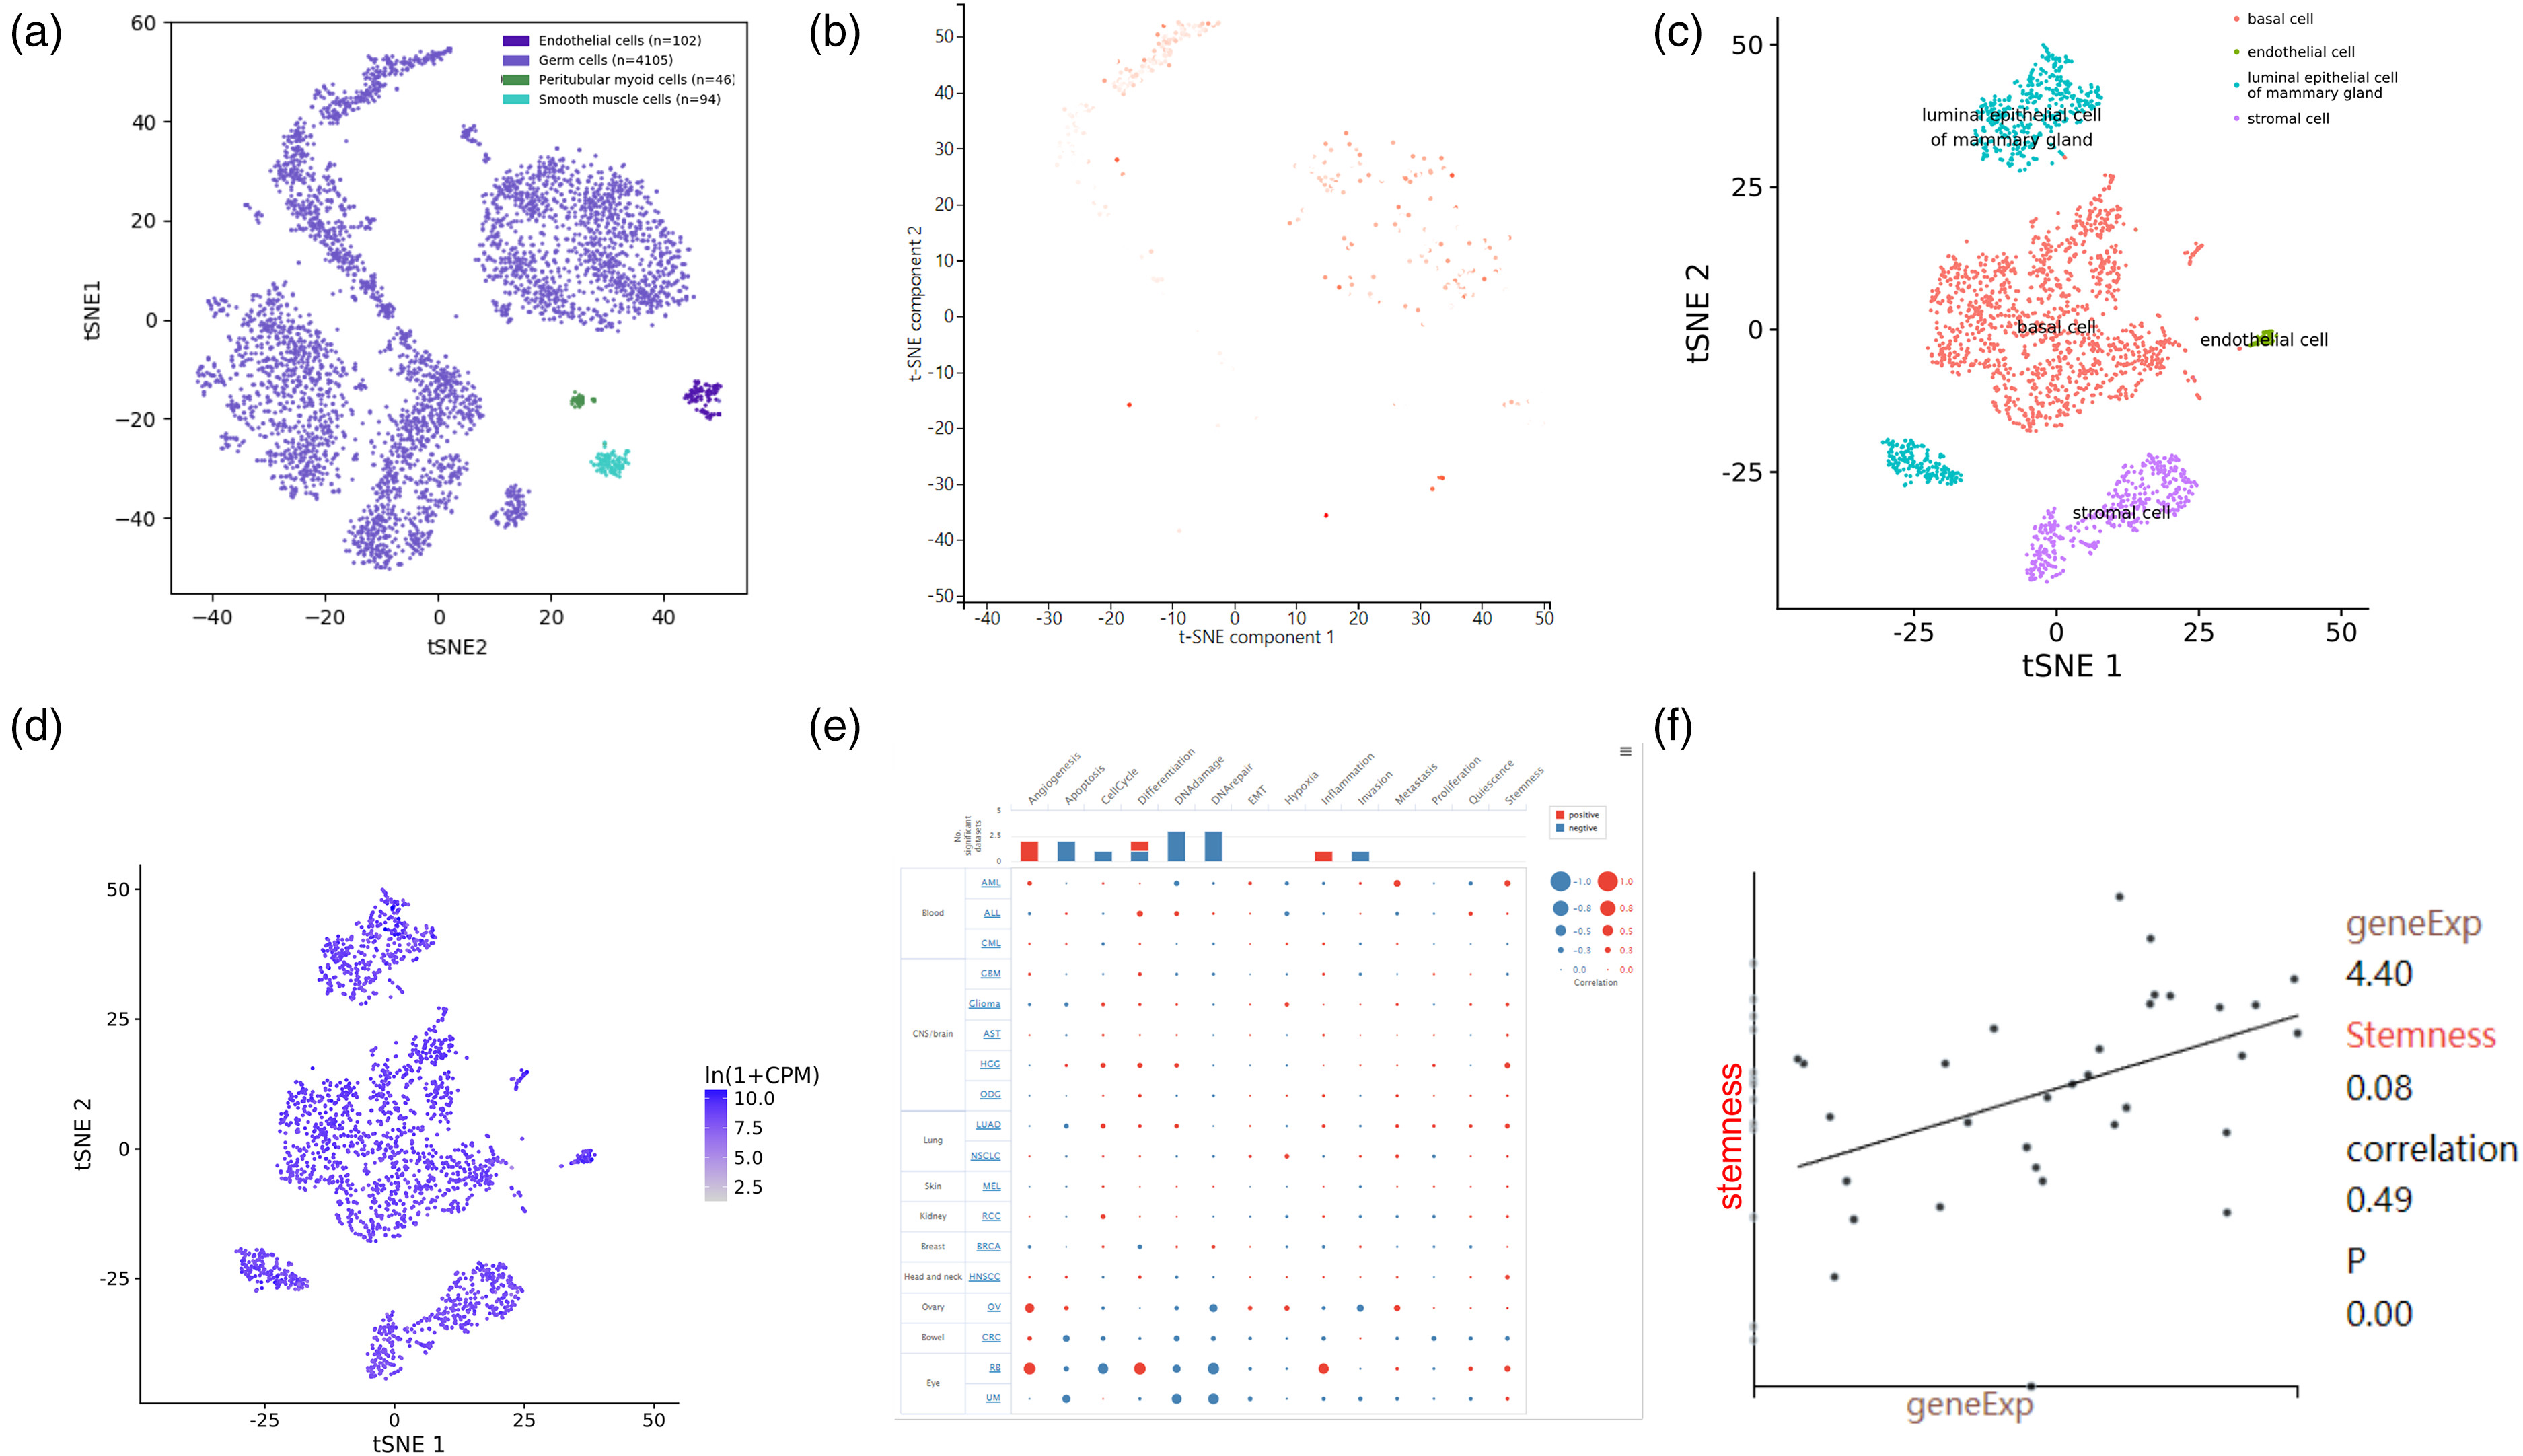
Single-cell RNA-Seq analysis. (a) Spectral t-SNE plots of all cells analyzed from human testis. (b) The ANKRD13D expressed cell types. (c) Spectral t-SNE plots of all cells analyzed from mouse kidney. (d) ANKRD13D expressed cell types. (e) The ANKRD113D functional correlation of all cancer types in the PanglaoDB database. (f) The correlation between stemness and ANKRD13D expression. Partial.cor > 3 and P < 0.05 means the results were statistically significant.
Correlation of ANKRD13D with immune checkpoint gene expression and immune cell infiltration
ANKRD13D was expressed in immune cells, and the function analysis predicted that ANKRD expression was associated with inflammation response (Figure 4(e)). We further analyzed the correlation of the ANKRD13D expression with immune checkpoint gene expression and immune cell infiltration in RCC using TIMER databases. The ANKRD13D expression was positively correlated with the expression PDCD1, CTLA4, LAG3, TNFSF14, and ISG20 (cor > 3, P < 0.05) (Figure 5(a)). Targeting immune checkpoints has been proved to be a potential strategy for cancer therapy, and antibodies targeting PD-1 and CTLA4 have been approved by the US Food and Drug Administration. According to the data shown in ClinicalTrials.gov, antibodies targeting LAG3 and TNFSF14 clinical trials are currently underway. To classify which cell type is affected, we analyzed the correlation between ANKRD13D expression and immune cell infiltration. The ANKRD13D expression is correlated with CD4 + T cell infiltration (cor > 3, P < 0.05) (Figure 5(b)). Furthermore, the expression of ANKRD13D in Treg cells from volunteers was confirmed to be higher than that in CD4+ CD25- FOXP3- T cells using RT-qPCR (Figure 5(c)). Regulatory T cells (CD4+ CD25− CD127− FOXP3+, Tregs) are specialized T-cell subpopulations that inhibit immune response. We analyzed the correlation of ANKRD 13D expression with FOXP3 expression, and found that the two genes are positively correlated (Figure 5(a)). These data suggest that ANKRD13D may promote Treg cell infiltration to enhance tumor malignancy.
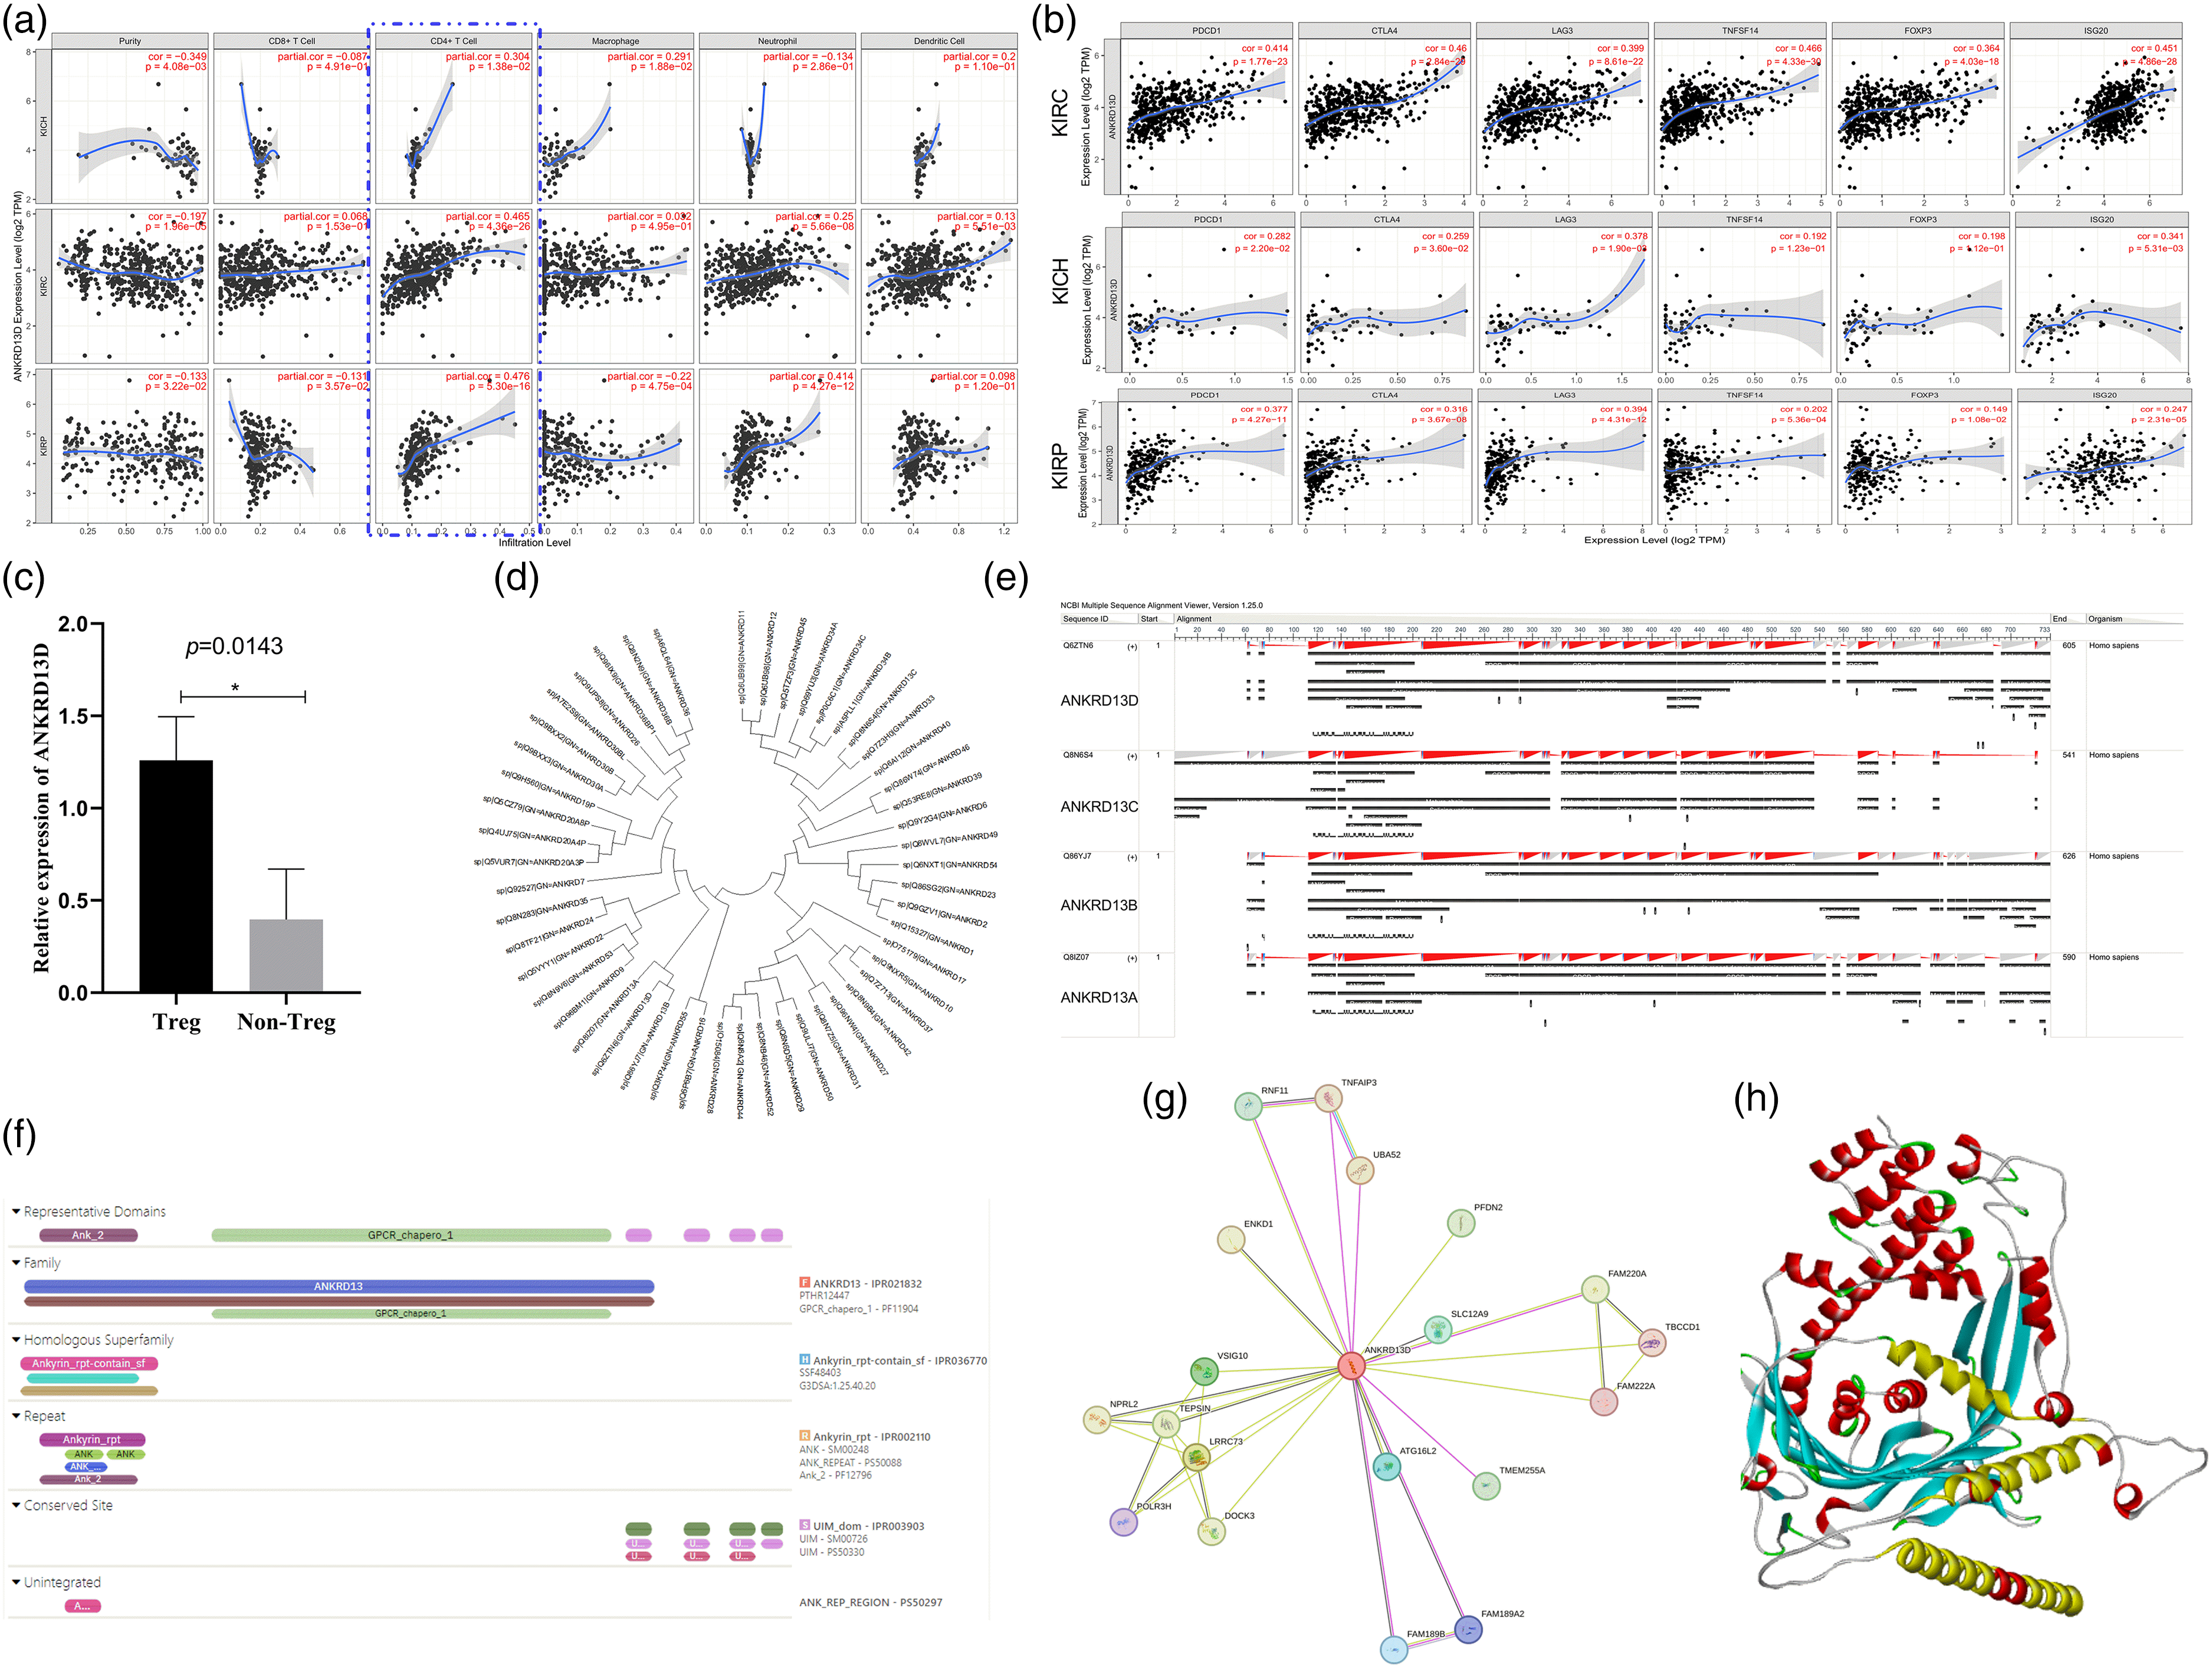
Correlation analysis of ANKRD13D, and ANKRD13D protein sequence analysis and structure prediction. (a) The correlation of ANKRD13D with PDCD1, CTLA4, LAG3, TNFSF14, ISG20, and FOXP3 at mRNA level. (b) The correlation of different immune cells infiltration with the abundance of ANKRD13D in tumors. (c) The expression of ANKRD in Treg was higher than that in CD4+ CD25- FOXP3- T cells. Partial.cor > 3, P < 0.05 means statistically significant. (d) The phylogenetic species tree of ANKRD family members. (e) The protein sequence alignment of ANKRD13 family members. (f) The domains of ANKRD13D predicted using InterPro. (g) PPI networks of ANKRD13D using STRING (Top 20). (h) ANKRD13D structure predicted using AlphaFold (Red: Alpha-Helix, Yellow: UIM domain in Alpha-Helix, cyan-blue: Beta-Sheet).
ANKRD13D sequence analysis and structure prediction
The information of the phylogenetic species tree is critical for the analysis of evolutionary relationships among domains of interested genes. We explored OMA Standalone to compute orthology relations for the ANKRD family members in the homo species (Figure 5(d)). The ANKRD13D belongs to the ANKRD13 family. The COBALT was used to align the ANKRD13A, ANKRD13B, ANKRD13C, and ANKRD13D protein sequences (Figure 5(e)). Almost all the ANKRD13 family members have the UIM, ANKRD13A (4), ANKRD13B (3), ANKRD13D (4), indicating that they may have a similar function in RCC progression and development. In further study, ANKRD13B and ANKRD13A should be considered in RCC. The ANKRD13D has three domains: ANK, GPCR, and UIM (Figure 5(f)). The known and predicted proteins interacted with ANKRD13D were searched using STRING (Figure 5(g)). We also predicted the structure of ANKRD13D using AlphaFold, and results showed that the secondary structure of UIM only includes α-helix (Figure 5(h)). The ANKRD13D is mainly located in the cell endosome. The clarification of the ANKRD13D protein structure will promote the development of small-molecule drugs.
Discussion
Bioinformatics, as an interdisciplinary field of science, develops new methods for data mining. The bioinformatics online software and databases make it easier for scientists to reuse the accumulated clinical data and share their findings. 24 There are thousands of scientists who focus on the development of bioinformatics methods. Due to the difference in database development strategy, we compared the overexpression of ANKRD family members and the survival results of multiple databases. Although all the ANKRD family members have ankyrin repeat, the ANK motif does not determine the positive correlation, negative correlation, or no correlation with RCC. There are 12 ANKRD family members’ expressions identified that were associated with RCC prognosis. The survival analysis suggested that the overexpression of ANKRD46 was correlated with good prognosis (Figure 2(d)). However, the overexpression of ANKRD9, ANKRD10, and ANKRD13D were correlated with poor prognosis (Figure 2(a) to (c)). The expression levels of ANKRD9 and ANKRD10 were low in both normal and cancer tissues; therefore, ANKRD13D was selected as a potential target.
ANKRD13D belongs to the ANKRD13 family. We analyzed the sequence of all the ANKRD family members and predicted the structure using AlphaFold (Figure 5(f)). Ubiquitination is one of the posttranslational modifications and has regulates signal transduction in both innate and adaptive immune response. 25 Ubiquitin is a 76-amino acid small protein and it can be conjugated to a target protein with the help of ubiquitin-associated enzymes (E1, E2, E3). 26 UIM contains approximately 20 residues and is usually identified in multidomain proteins.26,27 The UIM binds not only the ubiquitin, but also other proteins. 28 The special UIM in ANKRD13D may be directly correlated with the poor prognosis of RCC.
Single cell sequencing is a powerful technology for the detection and quantitative study of mRNA at the single-cell level. 29 There are several immune checkpoints; PDCD1, CTLA4, LAG3, TNFSF14, and ISG20 have been identified and used in cancer therapy.30,31 In our present analysis, we found that ANKRD13D was correlated positively with PDCD1, CTLA4, LAG3, TNFSF14, and ISG20 (Figure 5(a)). Treg cells express the transcription factor FOXP3, and are usually found in the tumor microenvironment.32,33 The targeting of Treg cells has been developed for cancer immunotherapy. 34 Our analysis result suggested that the overexpression of ANKRD13D was associated with the high-level infiltration of Treg cells in tumors (Figure 5(b)). Further analysis confirmed that the expression of ANKRD13D was correlated with FOXP3 (Figure 5(a)), indicating that ANKRD13D suppresses the immune environment through increasing Treg infiltration in tumors.
Although we used multiple databases to explore the correlation of ANKRND family members with prognosis in RCC, the role and function of ANKRD13D were analyzed and confirmed using multiple databases at the single-cell level. Bioinformatics analysis provided clues to accelerate drug development. Further study should focus on how ANKRD13D regulates Treg function and immune checkpoint expression, and the effect of ANKRD13D blockade with antibodies or small molecules. The combination of ANKRD13D inhibition and immune checkpoint blockade may achieve a better performance in future clinical trials.
Conclusions
In summary, we identified a potential molecule that was correlated with prognosis and immunotherapy for RCC. Our findings improve our understanding of the function of ANKRD family members in RCC, and provide the indication of targeting both ANKRD13D and immune checkpoints in RCC therapy.
Footnotes
Declaration of conflicting interests
The authors declared no potential conflicts of interest with respect to the research, authorship, and/or publication of this article.
Funding
The authors disclosed receipt of the following financial support for the research, authorship, and/or publication of this article: This work was supported by the National Natural Science Foundation of China, (grant number Grant No. 82170696).