
Abstract
Objectives
Development and validation of a predictive model including serum vitamin concentration to estimate the risk of chemotherapy-induced grade 3/4 neutropenia in esophageal cancer, gastric cancer, or colorectal cancer patients who receive the first cycle of chemotherapy.
Methods
Data from 535 patients treated at the Affiliated Fuyang People's Hospital of Anhui Medical University from January 1, 2020, to March 2, 2022, were used to derive the predictive model. Least absolute shrinkage and selection operator regression analysis was performed to screen potential risk characteristics, and multivariate logistic regression was utilized to investigate efficient factors associated with chemotherapy-induced neutropenia. A nomogram was constructed using this logistic model. This nomogram was then tested on a temporal validation cohort containing 212 consecutive patients.
Results
In the cohort of all 747 eligible patients, grade 3/4 neutropenia incidence was 45.2%. Age, Eastern Cooperative Oncology Group-performance status, neutrophil count, serum albumin, and hemoglobin data were entered into the final model. The performance of the final predictive nomogram was assessed by the area under the receiver operating characteristic curve in both the development and validation datasets. The calibration curves indicated that the estimated risks were accurate. Decision curve analysis for the predictive model exhibited improved clinical practicality.
Conclusion
In the present study, we established an accessible risk predictive model and identified valuable serum vitamin concentration parameters associated with chemotherapy-induced neutropenia. The predictive model may improve the grade 3/4 neutropenia risk prediction in patients with gastrointestinal malignancies who receive oxaliplatin- and fluoropyrimidine-based chemotherapy and help physicians make appropriate decisions for disease management.
Introduction
Chemotherapy-induced neutropenia is a critical dose-limiting toxicity in solid tumor chemotherapy. Neutropenia may lead to a delay in treatment and a reduction of the chemotherapeutic dose, and it may decrease the efficacy of chemotherapeutic drugs, increase the economic burden, and even lead to serious infection or death. 1 Most severe neutropenia occurs in the initial cycle of treatment.2-4 Oxaliplatin- and fluoropyrimidine-based chemotherapy is widely used in digestive tract cancer.5-7 The risk of grade 3/4 neutropenia has been reported to range from 6.3% to 58%,8-11 making it difficult to estimate the individual risk of neutropenia.
Several models of neutropenia have been published, such as the Talcott model, Multinational Association for Supportive Care in Cancer model (MASCC), and Clinical Index of Stable Febrile Neutropenia model (CISNE). 12 These models focus on risk stratification of neutropenia complications or adverse clinical outcomes by grouping patients who have had febrile neutropenia into different prognostic categories rather than predicting the risk of developing severe neutropenia. Attention has recently shifted toward creating risk models to predict the likelihood of individual neutropenia risk rather than predicting the risk of serious medical consequences in patients with established severe neutropenia, as such models are more helpful in guiding the use of granulocyte-colony stimulating factor (G-CSF) prophylaxis. 13 Although many models have been developed, to our knowledge there is no consensus predictive model for assessing the risk of neutropenia.14,15
Nutritional status has been shown to be associated with disease-free survival (DFS) or even overall survival (OS) and is a potentially useful biomarker in the incidence of greater chemotherapy-associated toxicity16,17; however, most current predictive models include prediction of various heterogeneous tumor types treated with different regimens and without consideration of patient nutrition status. Compared to those models, a model focused on fewer tumor types and specific chemotherapy regimens may be more accurate and make the associated factors easy to explain. In our study, we developed and validated a predictive model including serum vitamin concentration factors. To our knowledge, the present study is the first model involving serum vitamin concentration factors and focus on specific chemotherapy regimens. It may improve grade 3/4 neutropenia risk prediction in gastrointestinal malignancy patients who receive the first cycle of chemotherapy and assist physicians in making appropriate decisions for disease management.
Materials and methods
Development and validation cohorts
This study was approved by the ethics committee of the Affiliated Fuyang People's Hospital of Anhui Medical University (approval number: 2022158). No personally identifying information was collected, and the data were anonymous. A total of 535 patients with a diagnosis of malignant digestive tract tumors in the Affiliated Fuyang People's Hospital of Anhui Medical University between January 1, 2020 and March 2, 2022, who met the following criteria were entered into the study and formed the development cohort. A temporal validation cohort containing 212 consecutive patients from March 3, 2022 to March 31, 2023 was collected with the same standards we used for the development cohort. The inclusion criteria were patients who were diagnosed with pathologically confirmed gastric cancer, esophageal cancer, colon cancer, or rectal cancer and received their first cycle of oxaliplatin- and fluoropyrimidine-based chemotherapy. The exclusion criteria were as follows: (i) gastrointestinal stromal tumors or neuroendocrine tumors; (ii) vitamin supplement use in 3 months; (iii) preexisting hematological disorders; (iv) dose reduction more than 20% in chemotherapy regiment administration; (v) prophylactic use of myeloid growth factors (MGFs); and (vi) previous or concurrent radiation therapy.
Demographic, clinicopathological, and nutritional data collection
Demographic, clinicopathological, and nutritional data were collected, including weight, height, body mass index (BMI), age, sex, location of tumor, clinical stage, Eastern Cooperative Oncology Group performance status (ECOG PS), albumin (ALB), prealbumin, hemoglobin (Hb), absolute neutrophil count (ANC), lymphocytes, platelets (PLT), vitamin A, vitamin D2, vitamin D3, total vitamin D, vitamin K1, vitamin E, vitamin B1, vitamin B2, niacin, niacinamide, vitamin B5, vitamin B6, vitamin B9, and Onodera's Prognostic Nutritional Index (PNI). 18 The calculation formula of PNI was ALB (g/L) + 5 × lymphocytes (10e9/L). All laboratory tests above were performed within 1 week prior to the first cycle of chemotherapy. Serum vitamin concentrations were determined by liquid chromatography-tandem mass spectrometry (LC‒MS/MS). After chemotherapy drug delivery, the patient's complete blood count (CBC) was monitored every 2–3 days to detect potential hematological toxicity. Grade 3/4 neutropenia was defined as ANC less than 1.0 × 10e9/L, followed by the National Cancer Institute's Common Terminology Criteria for Adverse Events, Ver 5.0 (CTCAE), in which severity of Adverse Events (AE) is divided into five grades. Grade 3 was regarded as severe AE, while grade 4 was regarded as life-threatening AE. Patients were staged with the American Joint Committee on Cancer staging system 8th edition.
Statistical analysis
Normally distributed continuous variables were reported with their means and standard deviations and compared by Student's t test, while non-normally distributed continuous variables were described by their medians and interquartile ranges (IQR) and compared by the Mann‒Whitney U test. Categorical variables are reported as frequencies and respective percentages, and Pearson's Chi-squared test was used to analyze these variables.
In the development cohort, we used least absolute shrinkage and selection operator (LASSO) regression to explore potential risk factors, while the penalty parameter lambda was selected by applying tenfold cross-validation. Independent variables were determined according to lambda.1se, and multivariate logistic regression was applied to investigate factors screened by LASSO regression with the stepwise backward method. A nomogram based on the logistic regression model was generated. Model discriminative ability was assessed by the area under the receiver operating characteristic (ROC) curve, which ranged from 0.5 to 1.0, indicating no discrimination to perfect discrimination. Model calibration was performed using the Hosmer‒Lemeshow goodness-of-fit test and a visual calibration plot by contrasting the actual and predicted probability (1000 bootstrap resamples). 19 Decision curve analysis was performed to estimate a net benefit threshold for the predict model and the López-Pousa model. 20 P values < 0.05 were considered statistically significant. Statistical analyses were conducted based on R software, version 4.1.2 (R Foundation for Statistical Computing, Vienna, Austria).
Results
Patient characteristics
Among all 747 patients, 338 (45.2%) experienced grade 3/4 neutropenia, with a mean age of 66.1 (11.4). Of all the patients, the average age was 63.3 (11.6) years, 261 (34.9%) were female, and 148 (19.8%) had a smoking history. The mean age was 63.5 (11.4) years in the training dataset versus 62.7 (12.1) years in the validation dataset. The mean niacinamide concentration was 20.6 (15.4) ng/mL in the training dataset and 24.7 (18.5) ng/mL in the validation dataset. The mean vitamin B2 level was 8.5 (5.3) ng/mL in the training dataset and 9.4 (5.7) ng/mL in the validation dataset. There were no significant differences in age, height, weight, sex, BMI, ECOG PS, clinical stage, ALB, prealbumin, Hb, ANC, PNI, lymphocytes, PLT, vitamin A, vitamin D2, vitamin D3, total vitamin D, vitamin E, vitamin K1, vitamin B1, niacin, vitamin B5, vitamin B6, and vitamin B9 between the training dataset and the validation dataset, except for the location of the tumor, niacinamide, and vitamin B2. Between the training and validation sets, there was no significant difference in the incidence of grade 3/4 neutropenia. Table 1 summarizes the characteristics of the training and validation datasets.
Demographic, clinicopathological, and nutritional characteristics of the development cohort and validation cohort.
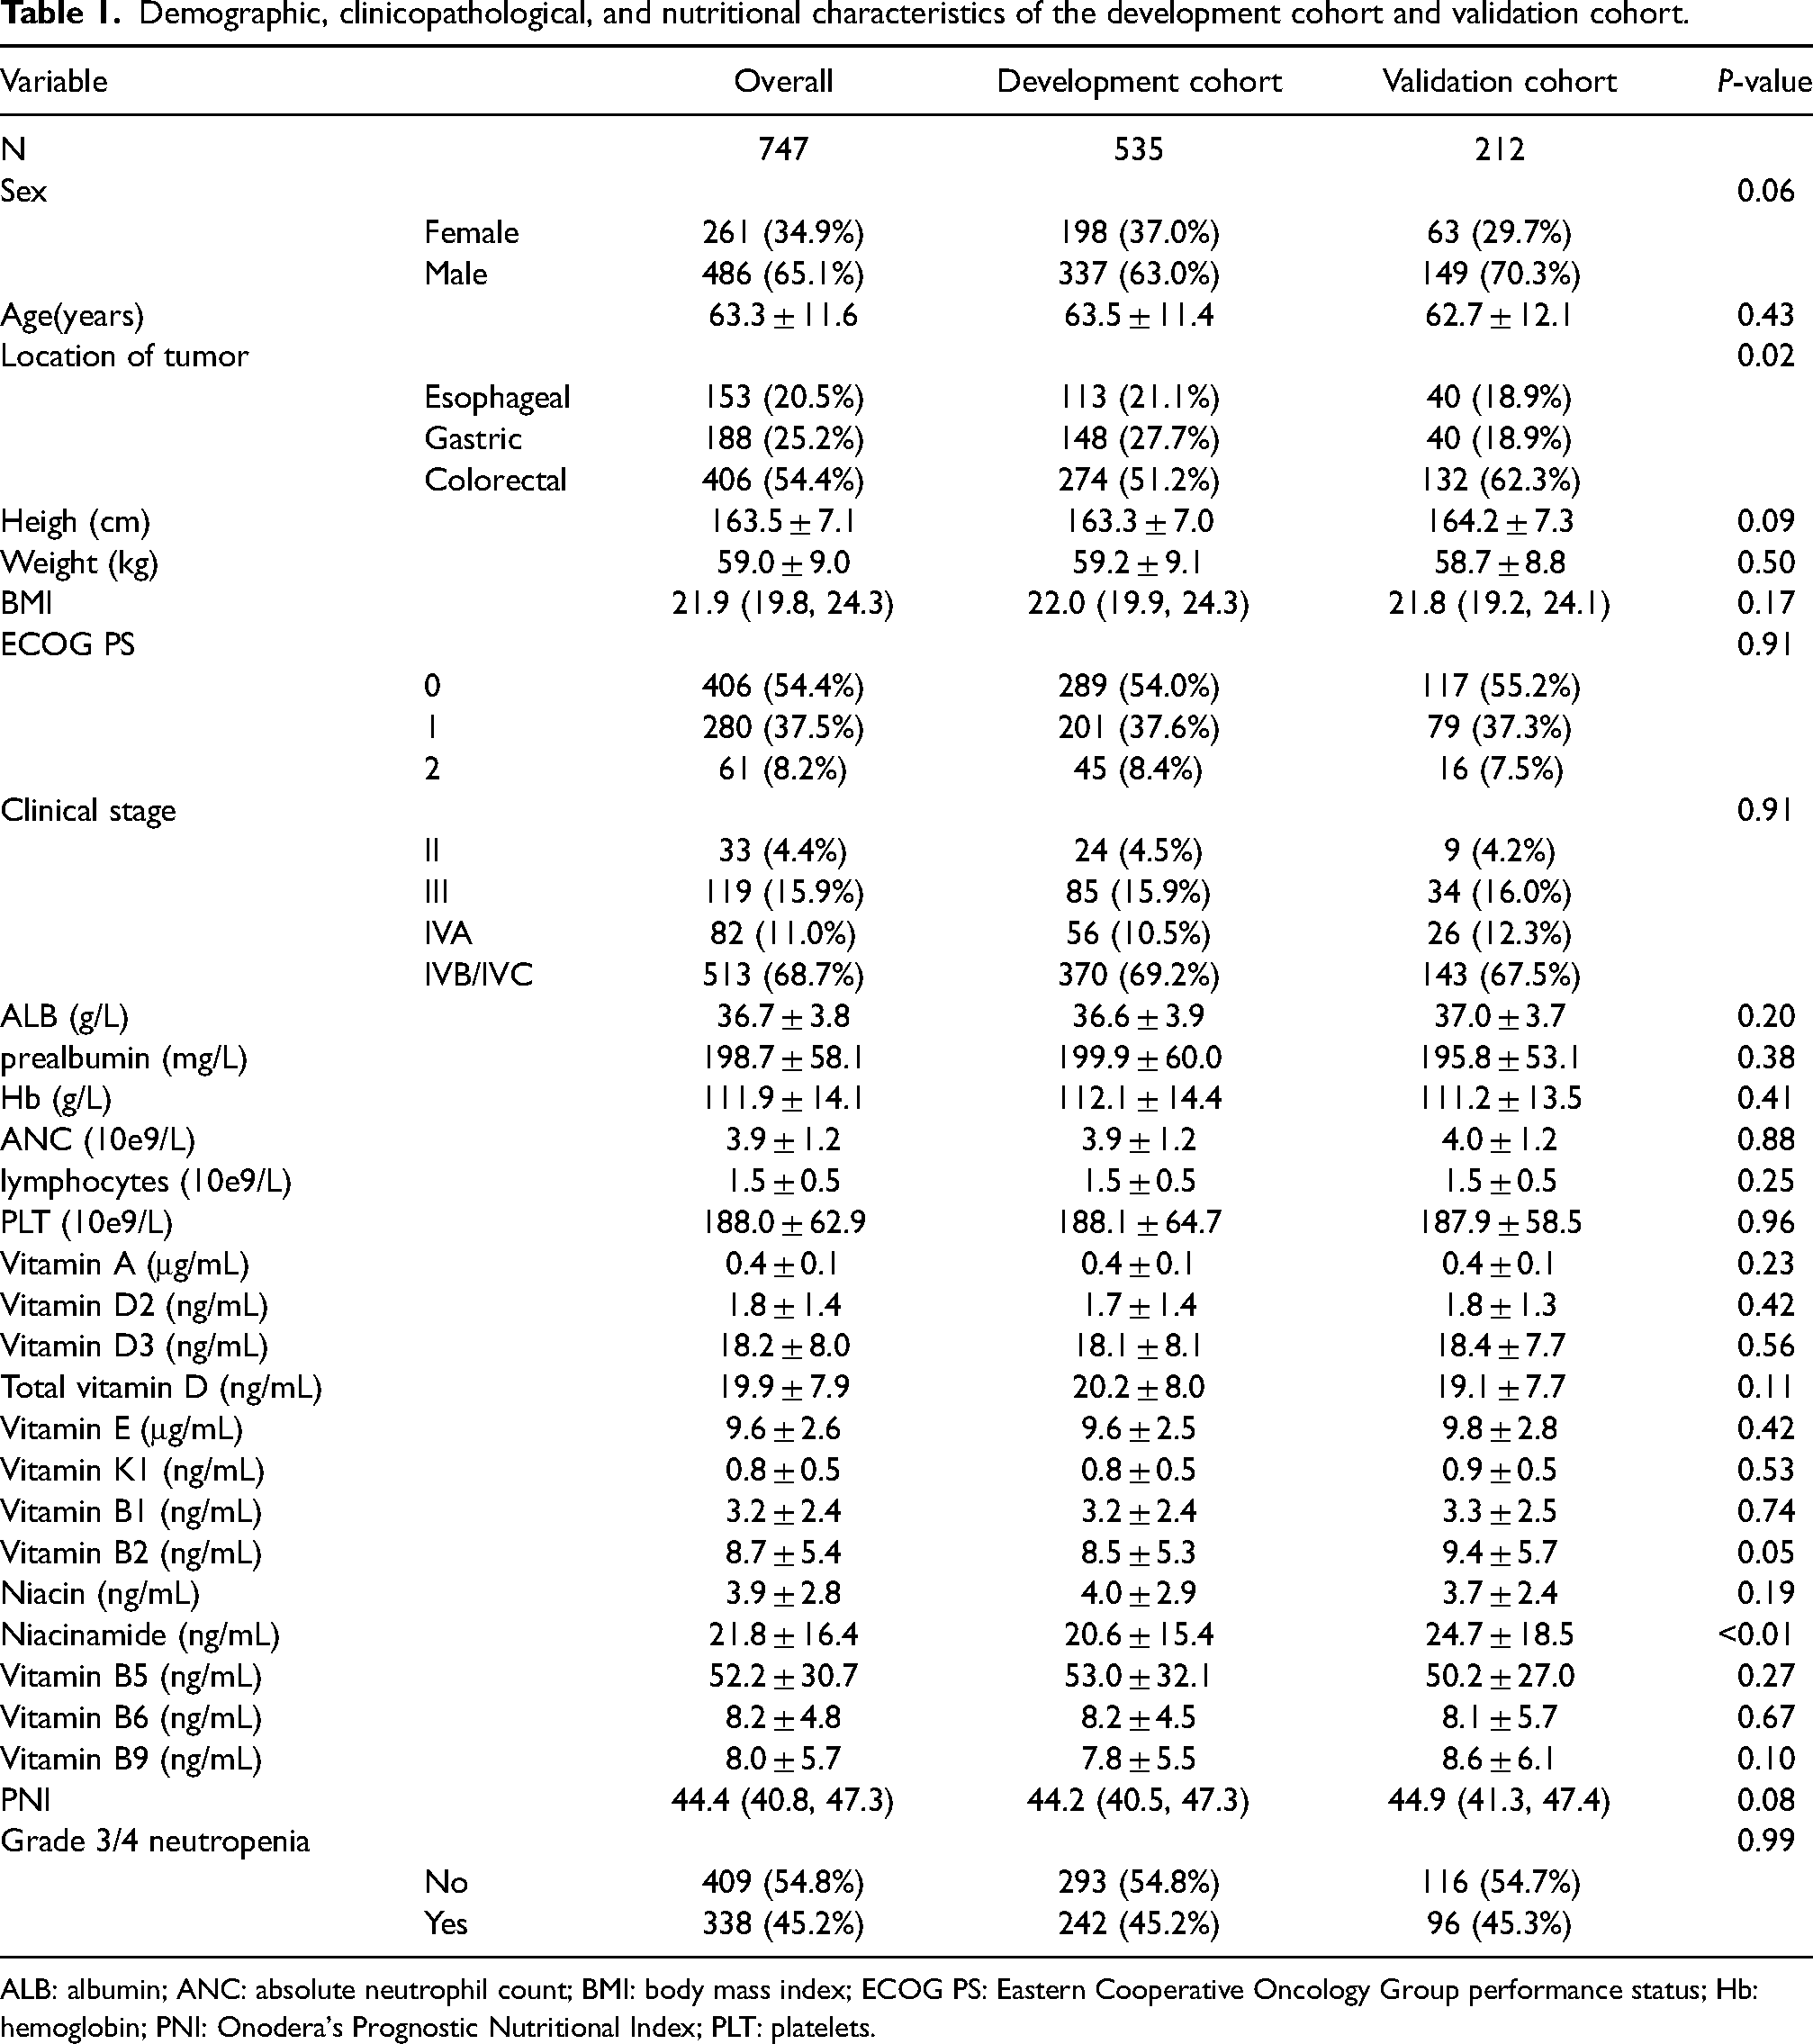
ALB: albumin; ANC: absolute neutrophil count; BMI: body mass index; ECOG PS: Eastern Cooperative Oncology Group performance status; Hb: hemoglobin; PNI: Onodera's Prognostic Nutritional Index; PLT: platelets.
Predictive model factor selection and nomogram construction
Twenty-eight variables were contained in the initial model and were subsequently refined to seven potential predictive factors by applying the LASSO regression model. A coefficient profile plot was then constructed in Figure 1(a). Figure 1(b) shows a cross-validated error plot of the LASSO regression model. As shown by the vertical dashed line in Figure 1(b), the lambda of the minimum mean cross-validated error (lambda.min) was 0.010, and the lambda of the error within 1 standard error of the minimum mean cross-validated error (lambda.1se) was 0.026. The most parsimonious model was chosen according to lambda.1se, including the following potential variables: age, ECOG PS 1, (ECOG PS 2), Hb, ANC, ALB, total vitamin D, and vitamin E. These potential predictors were then further evaluated by the backward stepwise regression selection method by utilizing Akaike's information criterion (AIC). No further shrinkage of factors was made in stepwise regression, and the AIC of the final model was 474.19. A nomogram was created based on the logistic regression model with these variables (Figure 2).
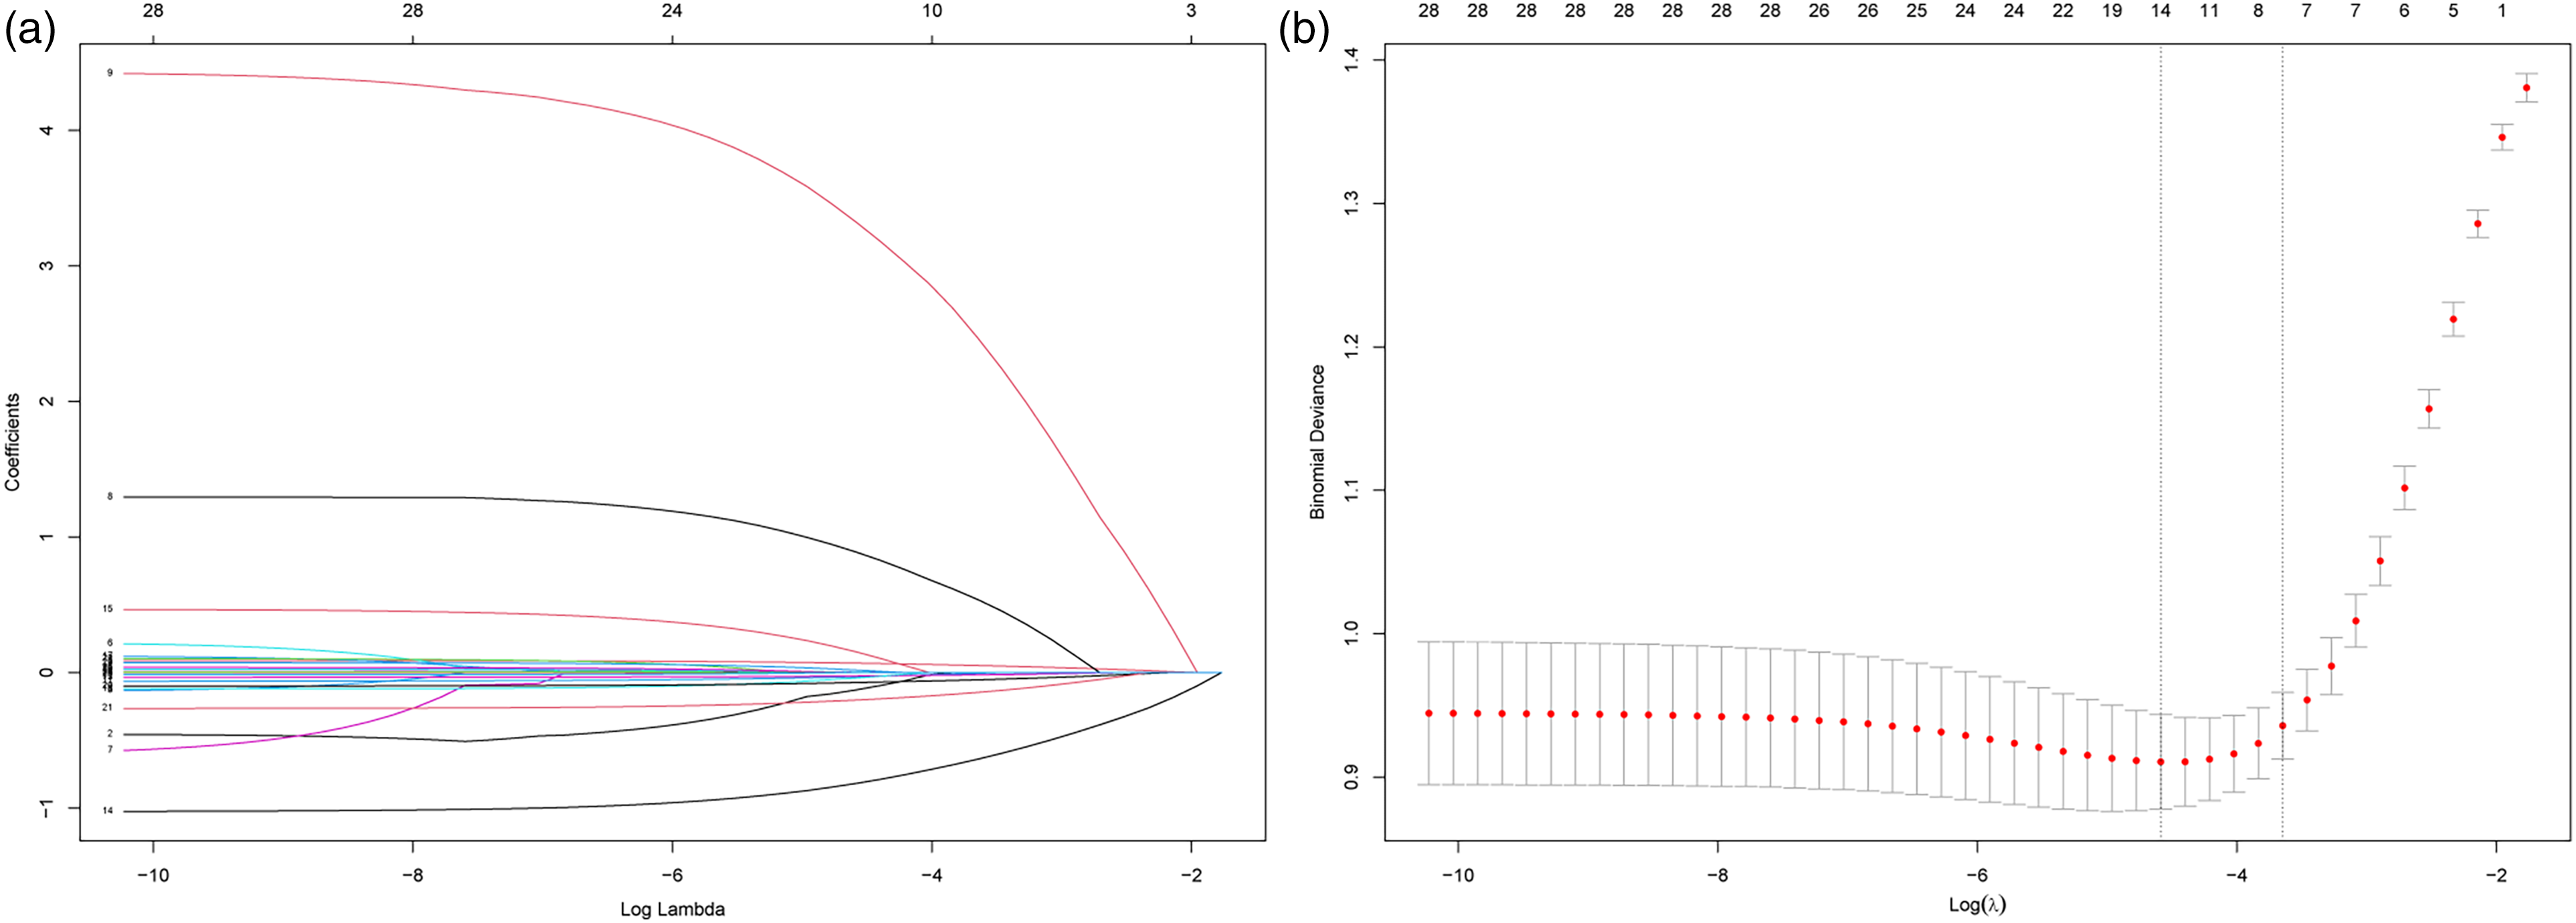
Identification of variables using LASSO regression. Numbers above graphs represent the number of variables involved in the LASSO model. (a) LASSO coefficient profile plot of all variables. (b) Selecting the optimal tuning parameter λ in the LASSO model. The partial likelihood deviance is plotted against log (λ). Tenfold cross-validation was used, and the dotted vertical lines are drawn at the value selected using the minimum and 1se criteria.
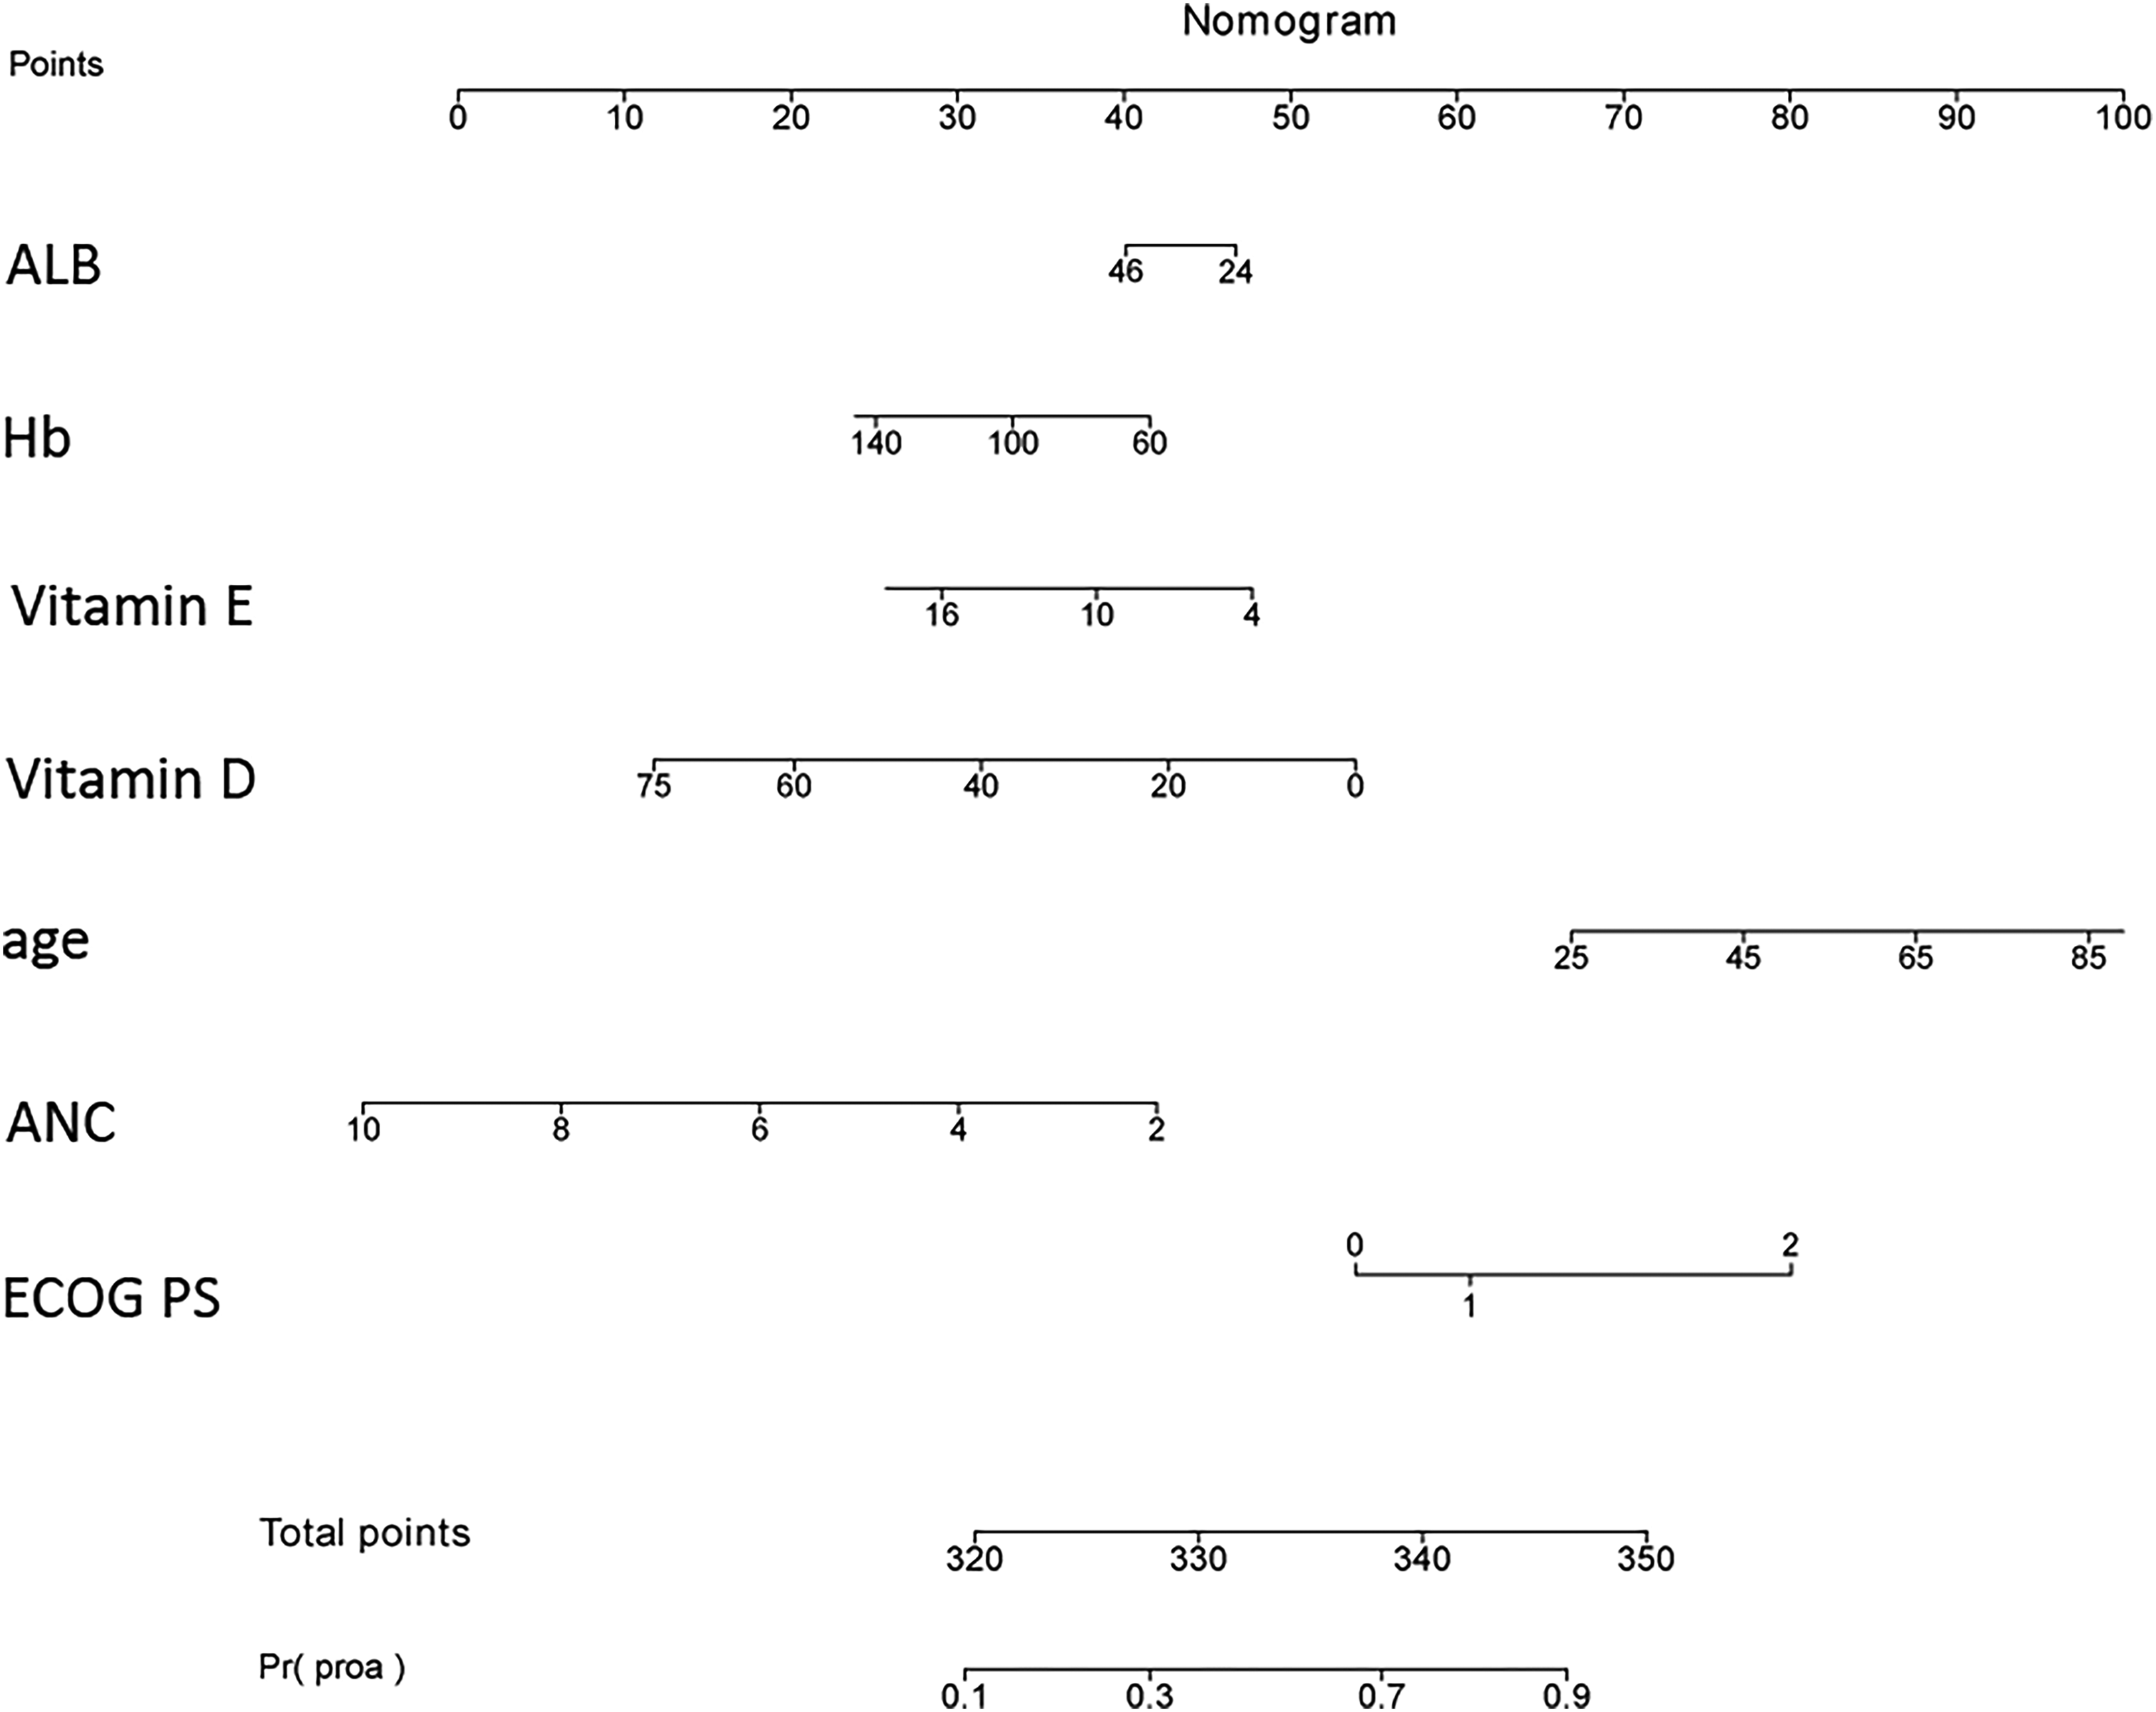
Nomogram for predicting grade 3/4 neutropenia. To calculate the predicted probability of the nomogram, draw a vertical line to the points axis to determine how many points are assigned to each variable value, sum the points for all variables, and locate the sum on the total points line to obtain the individual risk.
Predictive model performance
To evaluate the discrimination of the predictive model, the area under the curve (AUC) for the predictive model was calculated; in the validation dataset, it was 0.871 (0.824–0.918), and in the development dataset, it was 0.884 (0.856–0.913) (Figure 3), indicating satisfactory discrimination of this model in predicting the risk of grade 3/4 neutropenia. The corresponding ROC curves are presented in Figure 3. The calibration plot of the model is adjacent to the ideal line, indicating a good correlation between actual and predicted grade 3/4 neutropenia incidence (Figure 4). The P values of the Hosmer‒Lemeshow test in the development dataset and validation dataset were 0.24 and 0.77, respectively. Decision curve analysis (DCA) shows more net benefit than considering either no patients or all patients for intervention schemes at the threshold probability, and it shows more net benefit than the López-Pousa model, which suggests that the predictive model is clinically useful (Supplemental Figure S1).
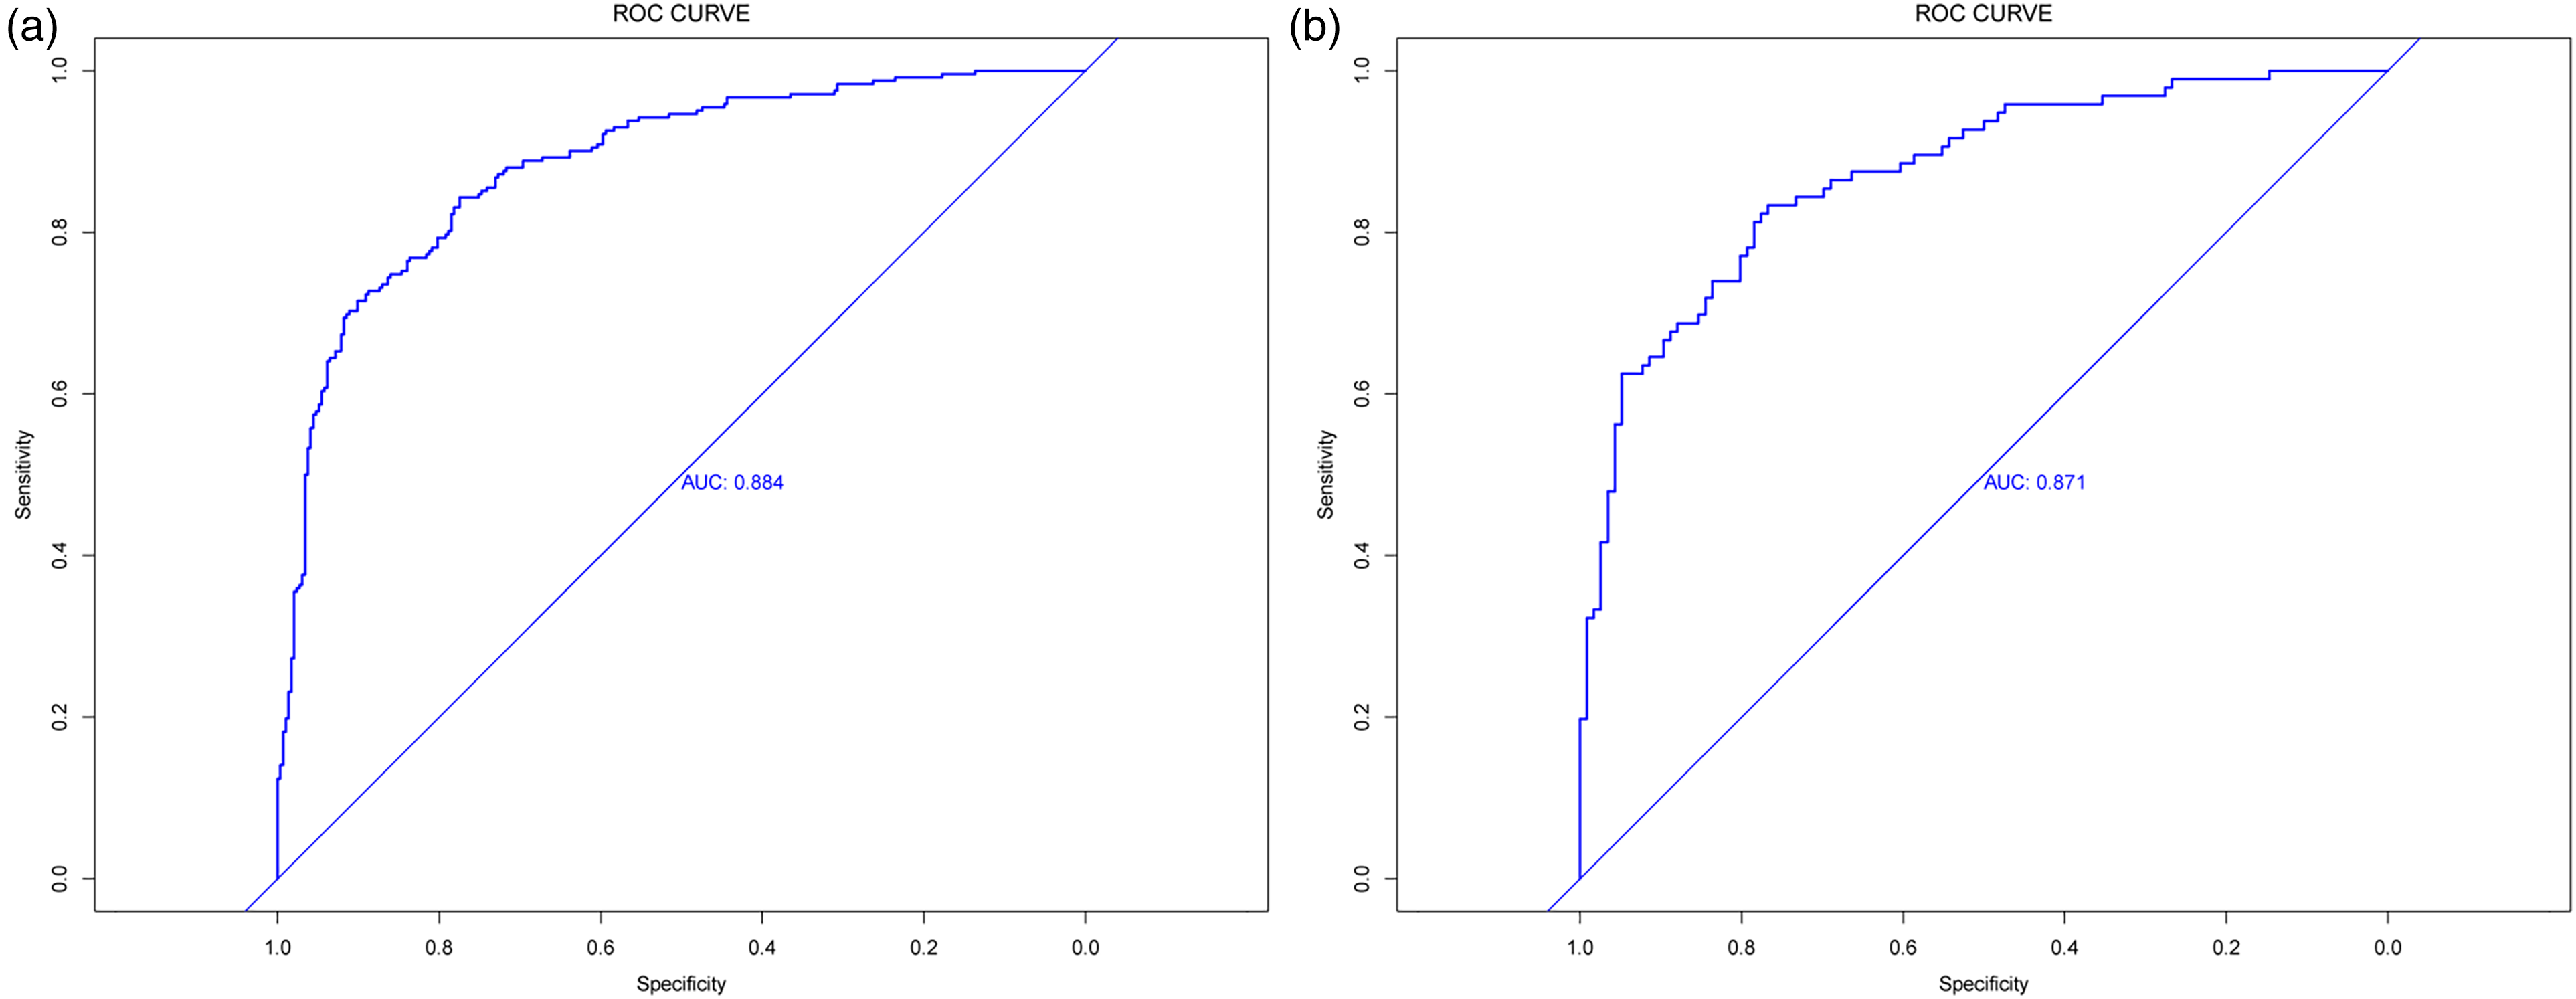
ROC curves of the (a) training cohort and (b) validation cohort.
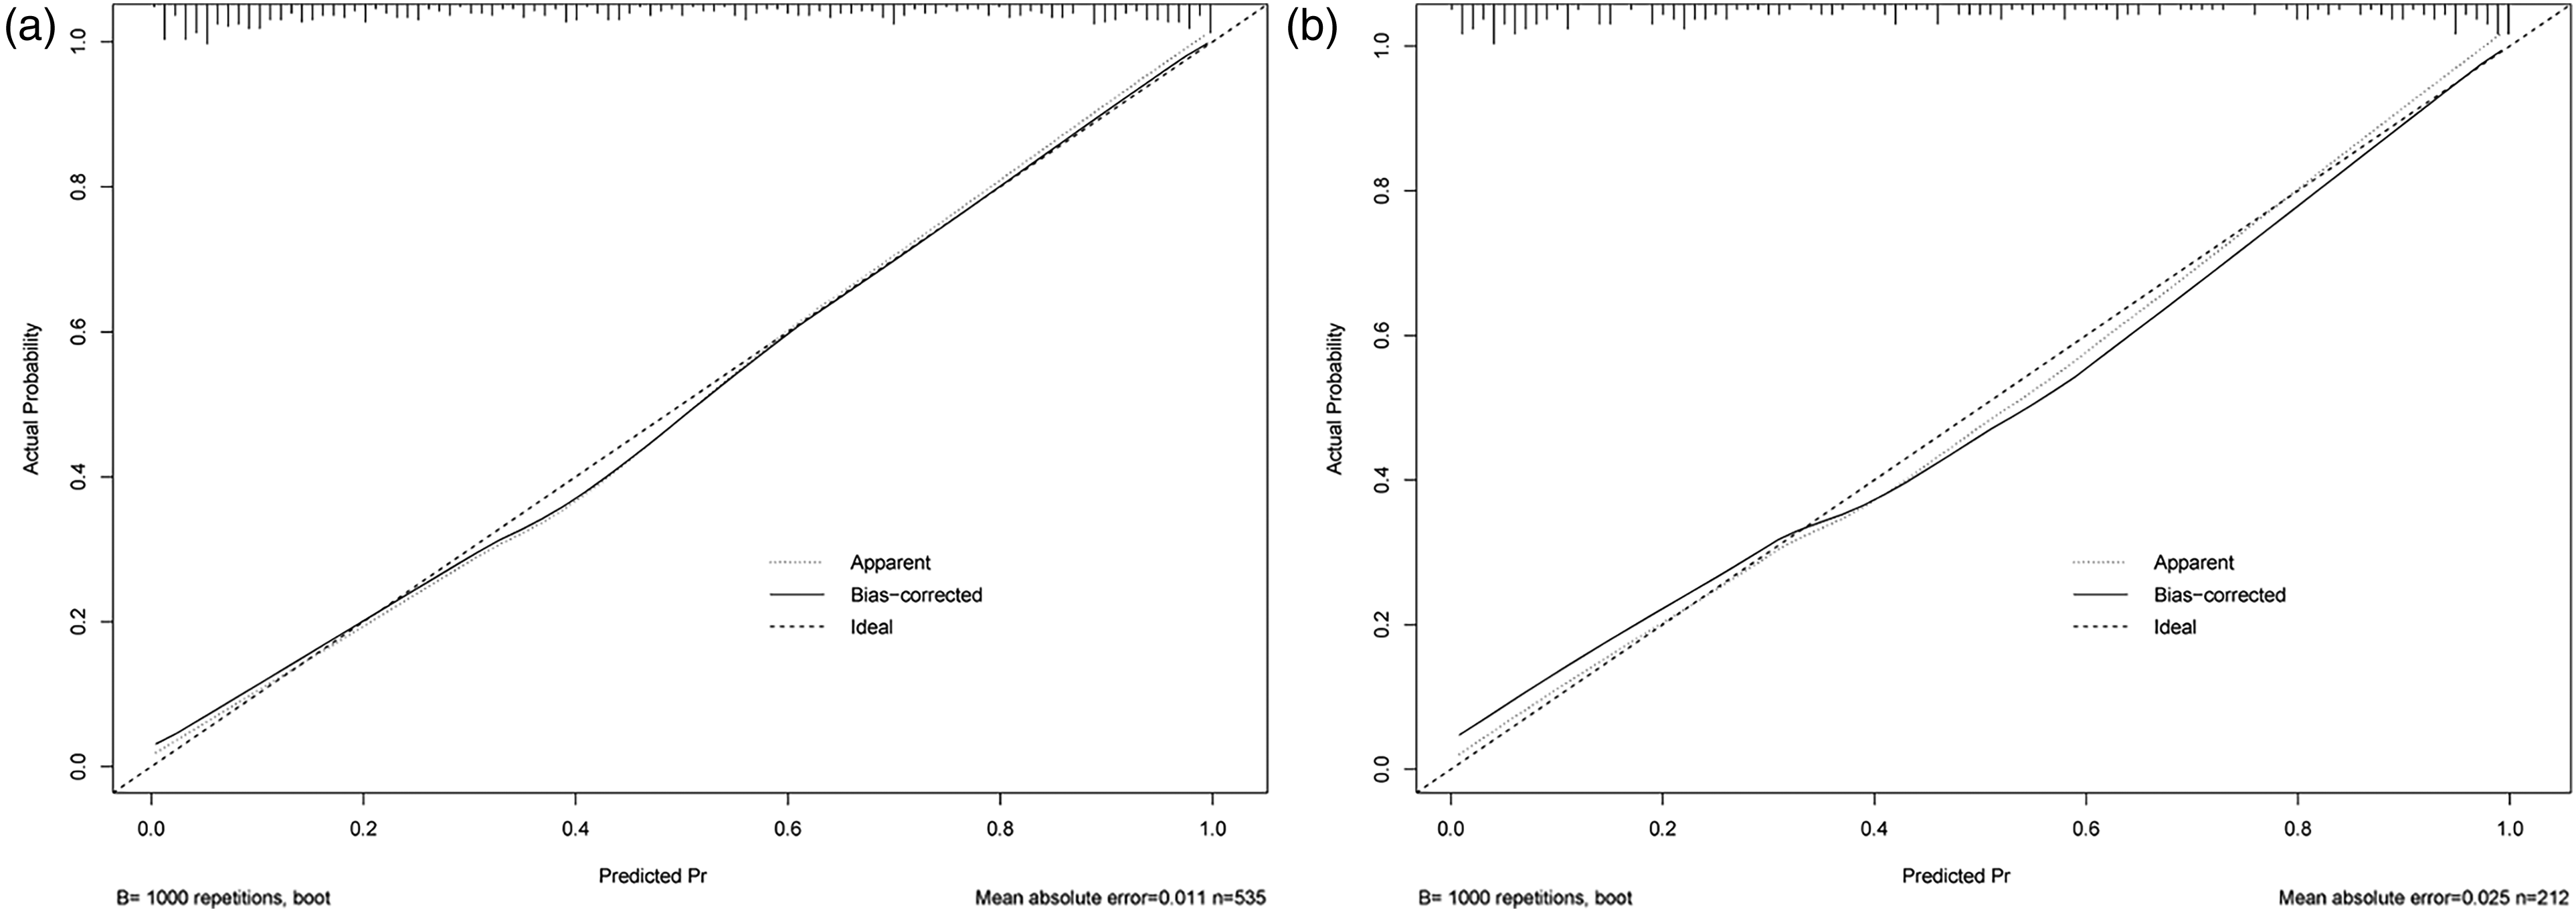
Calibration plot for the nomogram in the (a) development and (b) validation cohorts. The x-axis represents the predicted probability of grade 3/4 neutropenia, and the y-axis represents the observed probability of grade 3/4 neutropenia. The ideal line represents perfect prediction. Estimated points below the ideal line indicate overprediction, while points above the ideal line indicate underprediction. The frequency distribution of the predicted probabilities is shown by the vertical lines on top of the graph.
Discussion
Esophageal cancer and gastrointestinal cancer account for nearly 20% of new global cancer cases, 21 and oxaliplatin- and fluoropyrimidine-based chemotherapy are still regarded as fundamental regimens, although several targeted therapies and immunotherapies have been applied. 22 The adverse effects of the treatment, including persistent peripheral sensory neuropathy and hematological adverse events, are inevitable and cannot be ignored. Grade 3 or higher neutropenia may lead to decreased quality of life, delays in treatment administration, dose reductions, or even lethal infections. Precisely identifying patients at risk of neutropenia is crucial for early intervention. In the present study, we explored the demographic, laboratory, and serum vitamin concentrations of 747 patients and developed an easy-to-use nomogram, which may help healthcare providers make personalized decisions, thus improving the management of neutropenia in esophageal and gastrointestinal cancer patients who receive oxaliplatin- and fluoropyrimidine-based chemotherapy.
There is considerable diversity in the reported rates for various types of cancer and chemotherapy regimens,8-11 making it difficult to estimate the individual risk of neutropenia for specific chemotherapy regimens. Several chemotherapy-induced neutropenia predictive models for individual risk prediction were reported; however, most of these models included multiple cancer types and various treatment strategies, which may increase the bias of prediction. 23 Our model may be more targeted by focusing on oxaliplatin- and fluoropyrimidine-based chemotherapy for malignant digestive tract tumors. Additionally, predictive models developed in many early studies involved cohorts that included patients in both the first and following cycles of chemotherapy. 24 The model developed in our study was focused on neutropenia risk in the first cycle as it has a major impact on follow-up assessments of risk and treatment decisions.
The commonly used Lyman model was originally developed for colorectal cancer, lung cancer, ovarian cancer, breast cancer, or lymphoma patients who started a new chemotherapy regimen 25 ; however, esophageal and gastric cancer patients were not evaluated in the Lyman model. Because the cancer type was a predictor in the Lyman model, this model is not available for esophageal and gastric cancer patients. Another commonly used model was the López–Pousa model, 20 which is developed based on cohorts from the DELFOS study, including patients diagnosed with breast cancer, lung cancer, colorectal cancer, ovary cancer, gastric cancer, and other tumors. The López–Pousa model included following predictors: sex, base line lymphocyte count, treatment intention, the interaction of sex and treatment intention, ECOG PS and baseline neutrophil count; the cancer type was not included as a predictor in the final model. We explored the net benefit of both the López–Pousa model and our model by using a DCA curve. The curve indicates that our models have more net benefit in predicting the risk of neutropenia.
Nutritional status is reported to be correlated with digestive tract cancer patients’ treatment-related adverse events, quality of life, disease-free survival, and OS.15,16,26 There are several ways to assess patients’ nutritional status; however, using laboratory biochemical tests is a more objective, accurate, and easy-to-use approach than the questionnaire-based assessments and physical assessment methods, as dietary intake assessment may be influenced by recall bias and tedious physical measurements; also, the use of long food-frequency questionnaires may suffer from a lack of compliance by patients. 27 Few studies have included nutritional factors in a neutropenia predictive model. In the present study, we included several potential factors that might give information about the patient's nutritional status in model development. By using LASSO regression, total vitamin D and vitamin E were entered into the final model. To our knowledge, our predictive model is the first to use serum vitamin concentration in addition to clinical and pathological characteristics to predict the probability of neutropenia occurrence.
Our results revealed that patients with a higher risk of developing neutropenia were characterized by older age as well as decreased physical status, ALB, Hb, total vitamin D, vitamin E, and ANC. The value of age as a predictive factor for neutropenia in patients being treated with chemotherapy has been demonstrated in numerous studies. 28 Decreased ANC has also been reported as an informative risk predictive factor in a variety of chemotherapy regimens. 29 Although some studies have shown that BMI could be used as a predictive factor,30,31 it was not included in the final model in our study. One possible reason may be that the dose received by patients was calculated based on BMI. As a result, patients with lower BMI were exposed to fewer cytotoxic regimens; thus, BMI did not show a higher risk predictive ability than other factors that were included in the final model.
Two different lambda values (lambda.min and lambda.1se) are often investigated in LASSO regression. Correlation values can be better in the LASSO model based on lambda.min, as this minimizes the cross-validation error. In our study, the LASSO model based on lambda.min included more than 11 predictors, while the model based on lambda.1se included 7 predictors, as shown in Figure 1(b). The numbers across the top of the plot indicate how many predictors are included in the corresponding lambda value, which decreases as lambda increases. Fewer predictors may increase the interpretability and ease of use of the model in clinical practice. In this study, we developed a model based on lambda.1se, which is more parsimonious with fewer included variables, and its error is no more than one standard error above the error of the best model. 32
Our model generates reasonably good discrimination performance in a separate temporal validation cohort. Although some targeted therapy regimens are used in combination with oxaliplatin- and fluoropyrimidine-based chemotherapy, our model may still provide helpful information for physicians as the risk of combined therapy should at least be higher than our estimates.
In this study, there are also a few shortcomings that should be noted. First, the present study was a single-center study, and potential bias is inevitable. Although temporal validation showed that this nomogram yielded good discrimination and calibration, multicenter studies with more sample sizes may be used to further refine this model. Second, the potential mechanism underlying the predictive factors of the nomogram was not very clear; therefore, further research is needed for a better understanding of the role of these factors in neutropenia.
Conclusion
In the present study, we developed and validated a predictive model for the risk of grade 3/4 neutropenia. To our knowledge, this is the first model to use serum vitamin concentrations as predictive biomarkers alongside clinical and pathological characteristics in predicting the probability of neutropenia occurrence. We expect that the nomogram may improve the grade 3/4 neutropenia risk prediction in patients with gastric, esophageal, or colorectal cancer who receive the first cycle of chemotherapy and help physicians make appropriate decisions for disease management.
Supplemental Material
sj-docx-1-jbm-10.1177_03936155241228304 - Supplemental material for Nomogram for predicting neutropenia in patients with esophageal, gastric, or colorectal cancer treated by chemotherapy in the first cycle
Supplemental material, sj-docx-1-jbm-10.1177_03936155241228304 for Nomogram for predicting neutropenia in patients with esophageal, gastric, or colorectal cancer treated by chemotherapy in the first cycle by Tian Tian, Wenjun Hu and Jiqing Hao in The International Journal of Biological Markers
Footnotes
Declaration of conflicting interests
The authors declared no potential conflicts of interest with respect to the research, authorship, and/or publication of this article.
Funding
The author(s) disclosed receipt of the following financial support for the research, authorship, and/or publication of this article: This study was funded by Anhui Medical University (grant number: 2022xkj088).
Supplemental material
Supplemental material for this article is available online.
References
Supplementary Material
Please find the following supplemental material available below.
For Open Access articles published under a Creative Commons License, all supplemental material carries the same license as the article it is associated with.
For non-Open Access articles published, all supplemental material carries a non-exclusive license, and permission requests for re-use of supplemental material or any part of supplemental material shall be sent directly to the copyright owner as specified in the copyright notice associated with the article.