
Abstract
Background
Upstream stimulatory factors (USFs) are members of the basic helix-loop-helix leucine zipper transcription factor family, including USF1, USF2, and USF3. The first two members have been well studied compared to the third member, USF3, which has received scarce attention in cancer research to date. Despite a recently reported association of its alteration with thyroid carcinoma, its expression has not been previously analyzed.
Methods
We comprehensively analyzed differential levels of USFs expression, genomic alteration, DNA methylation, and their prognostic value across different cancer types and the possible correlation with tumor-infiltrating immune cells and drug response by using different bioinformatics tools.
Results
Our findings established that USFs play an important role in cancers related to the urinary system and justify the necessity for further investigation. We implemented and offer a useful ShinyApp to facilitate researchers’ efforts to inquire about any other gene of interest and to perform the analysis of drug response in a user-friendly fashion at http://zzdlab.com:3838/Drugdiscovery/.
Introduction
Upstream stimulatory factors (USFs), are a family of ubiquitous transcription factors that contain highly conserved basic helix-loop-helix leucine zipper DNA binding domains. There are three members of this family, namely USF1, USF2, and USF3 (KIAA2018). The first two family members, USF1 and USF2, are commonly recognized as USFs and have been extensively studied. Both USF1 and USF2 are ubiquitously expressed and appear to play major roles as transcriptional factors. USF1 has functional roles in metabolism, circadian rhythm, plus tanning and immune responses.1,2 Furthermore, USF1 is reported to be involved in regulating the development and progression of various types of tumors, such as oral mucosal cancer, 3 colorectal cancer 4 and gliomas,5,6 whereas USF2 appears to be crucial for the control of embryonic development, brain function, metabolism, iron homeostasis, fertility, and growth. Depending on the regulatory mechanism, USF2 can act as either the tumor-suppressor or tumor-promoter in different types of cancer. 7 Phosphorylation of USF2 is shown to regulate cellular growth and migration processes in prostate, hepatocellular, and breast cancer cells. 7 The third family member, USF3, is rarely studied compared to the other two members. It has been reported that USF3 aids inter-protein cross-linking and interacts with the peripheral surface of the nucleosome to promote the interaction between DNA and the H3–H4 tetramer. 8 Moreover, a recent study has implicated the role of USF3 in the progression of childhood disintegrative disorder. 9
A previous study has systematically demonstrated a role for USF3 alterations in phosphatase and tensin homolog (PTEN)-mutation-negative Cowden syndrome (CS) family with papillary thyroid cancer. 10 CS is an autosomal dominant disorder related to epithelial cancers, such as breast, thyroid, and skin.11–13 According to the International Cowden Consortium criteria, 85% of CS patients harbor a germline mutation in PTEN, 14 a tumor suppressor gene. However, another cohort study revealed that only 25% of CS patients harbored germline PTEN mutations. 15 A subsequent study by Yu et al.13 identified a predisposition for PTEN-mutation-negative individuals exhibiting CS/CS-like symptoms to also harbor a heterozygous polyglutamine deletion in USF3 and is involved in sporadic epithelial thyroid cancer. Moreover, they found that USF3 levels in normal human tissues were the highest in the cerebellum and skeletal muscle and lower in thyroid cancer, with identified roles in mediating mitogen-activated protein kinase activity, epithelial-to-mesenchymal transition, and increased cancer-cell migration. Furthermore, they associated USF3 dysfunction with abnormal mitochondrial ultrastructure and compromised respiratory capability.
Despite its putative role in thyroid cancer, USF3 has not been studied in other cancer types. To better understand its genetic and epigenetic role together with the other two family members, USF1 and USF2, in this work we comprehensively analyzed USFs expressions and alterations across different cancer types using the data from multiple resources including the Tumor Immune Estimation Resource (TIMER; https://cistrome.shinyapps.io/timer/), the Metabolic gEne RApid Visualizer (MERAV), The Cancer Genome Atlas (TCGA), and the cancer cell line encyclopedia (CCLE). Additionally, we determined the prognostic significance of USFs levels and other clinicopathological factors, including patient age, tumor stage, and tumor purity, in 11 tumor types using regression analysis and evaluating the relationships between USFs levels and tumor-infiltrating lymphocytes.16,17 We also assessed its potential therapeutic value using the Cancer Therapeutic Response Portal (CTRP 18 ). Furthermore, we identified the USFs’ interaction network to better understand their molecular function.
Methods
USF expression comparative analysis
To analyze differential levels of USF transcription across 4202 arrays, we downloaded the normalized array data from the MERAV website (http://merav.wi.mit.edu/). These included 726 normal tissue arrays, 2016 cancer cell line arrays, and 1460 primary tumor arrays. 19 All arrays were normalized together to avoid a batch effect and provided a means of consistent comparison. USF expression data were downloaded and compared by performing the Kruskal–Wallis test. Meanwhile, the TCGA data was also used to identify differential USFs expression between tumor and adjacent normal tissues and incorporating 10,897 data samples across 38 cancer types through TIMER (https://cistrome.shinyapps.io/timer/). 20 Distribution of the USFs expression levels were visualized using box plots, with P < 0.01 considered as statistically significant according to the Wilcoxon signed-rank test.
Comparison of genetic and epigenetic alterations of USFs
Genetic and epigenetic alterations in USFs (e.g., amplification, deep deletion, and missense mutations) were queried in the cBioportal database, 21 which is an open-access resource for cancer genomic data. Additionally, we downloaded the methylation data of USFs from UCSC Xena (http://xena.ucsc.edu) and preprocessed according to. 22 After removing the “NA” data, methylation data for 27 tumor types were retained for follow-up analysis. The Kruskal–Wallis test was then utilized to investigate their different methylation levels in different cancer types and visualized the obtained results as box plots.
USFs survival analysis
Association analysis between USFs expression and overall survival (OS) in different cancers was performed using a Cox regression model to evaluate the prognostic significance of age, tumor stage, gender, and tumor purity in various cancer types in TIMER. 20 Forest plots were used to visualize the number of patients, hazard ratios, and 95% confidence intervals of the results. Kaplan–Meier survival curves were subsequently used to compare the high and low expressions of USFs in different types of cancer.
The potential of USFs as therapeutic targets and drug response ShinyApp development
We investigated the potential of USFs as therapeutic targets through studying the association between USFs and drug response as well as the abundance of immune infiltrates. The CTRP database (https://portals.broadinstitute.org/ctrp.v2.1/) includes drug response data along with response profiles for 481 compounds in 860 cell lines, as well as RNA-seq data. We used these databases to identify differential USFs expression among different cell lines and calculated the Pearson's correlation coefficients according to the drug-response area under the curve (AUC) accordingly, with P < 0.05 considered as statistically significant. The results were presented as the percentages of drugs showing significant positive and negative correlations with USF expressions. The analysis to investigate the relationship between drug response and USFs was conducted in R (v.3.6.1; https://www.r-project.org/) and accomplished by our user-friendly ShinyApp GRD (gene-related drugs). TIMER data were also used to analyze the correlations between USF expressions and the abundance of immune infiltrates, including B cells, CD4+, CD8+ T cells, neutrophils, macrophages, and dendritic cells. We further studied the relationship between USFs and immune cell markers, which were obtained from. 23 Partial correlation analysis was performed after adjusting the tumor purity.
Construction of the protein–protein interaction networks of USFs
The Search Tool for the Retrieval of Interacting Genes (STRING) (http://string-db.org/), 24 a database of known and predicted protein interactions, was used to determine interacting proteins using USF1, USF2, and USF3 as the query. The corresponding protein–protein interaction networks of USFs were then constructed with a confidence score >0.9. We further imported those proteins into Cytoscape 3.4.0 25 to perform clustering analysis by MCODE plugin. 26 KEGG pathway enrichment analysis of the obtained clusters was performed using the Database for Annotation, Visualization, and Integrated Discovery (DAVID). 27
Results
Differential USFs expression in tumors, cell lines and normal tissues
In general, USF2 had the highest expression levels, whereas USF3 had the lowest expression in the USF family in cell lines, primary normal samples, and tumor tissues (Figure 1). In addition, using RNA-seq data from TCGA, we found that all USFs exhibited significant differential expressions in tumors from 11 cancer types compared with adjacent normal tissues. In particular, seven tumor types existed that had both increased USF1 and USF2 expression but decreased USF3 expression. Three other tumor types had increased USF1 expression but decreased USF2 and USF3 expression. Interestingly, only one tumor type; that is, chromophobe renal cell carcinoma (kidney chromophobe; KICH), was quite different from the others and was featured by the increased USF2 and USF3 expression but decreased USF1 expression. Additionally, all USFs were highly expressed in human papilloma virus (HPV)-positive head and neck squamous cell carcinoma relative to HPV-negative head and neck squamous cell carcinoma, but were lower expressed in skin cutaneous melanoma (SKCM) compared to metastasis SKCM (Figure 2(a) to (c)).
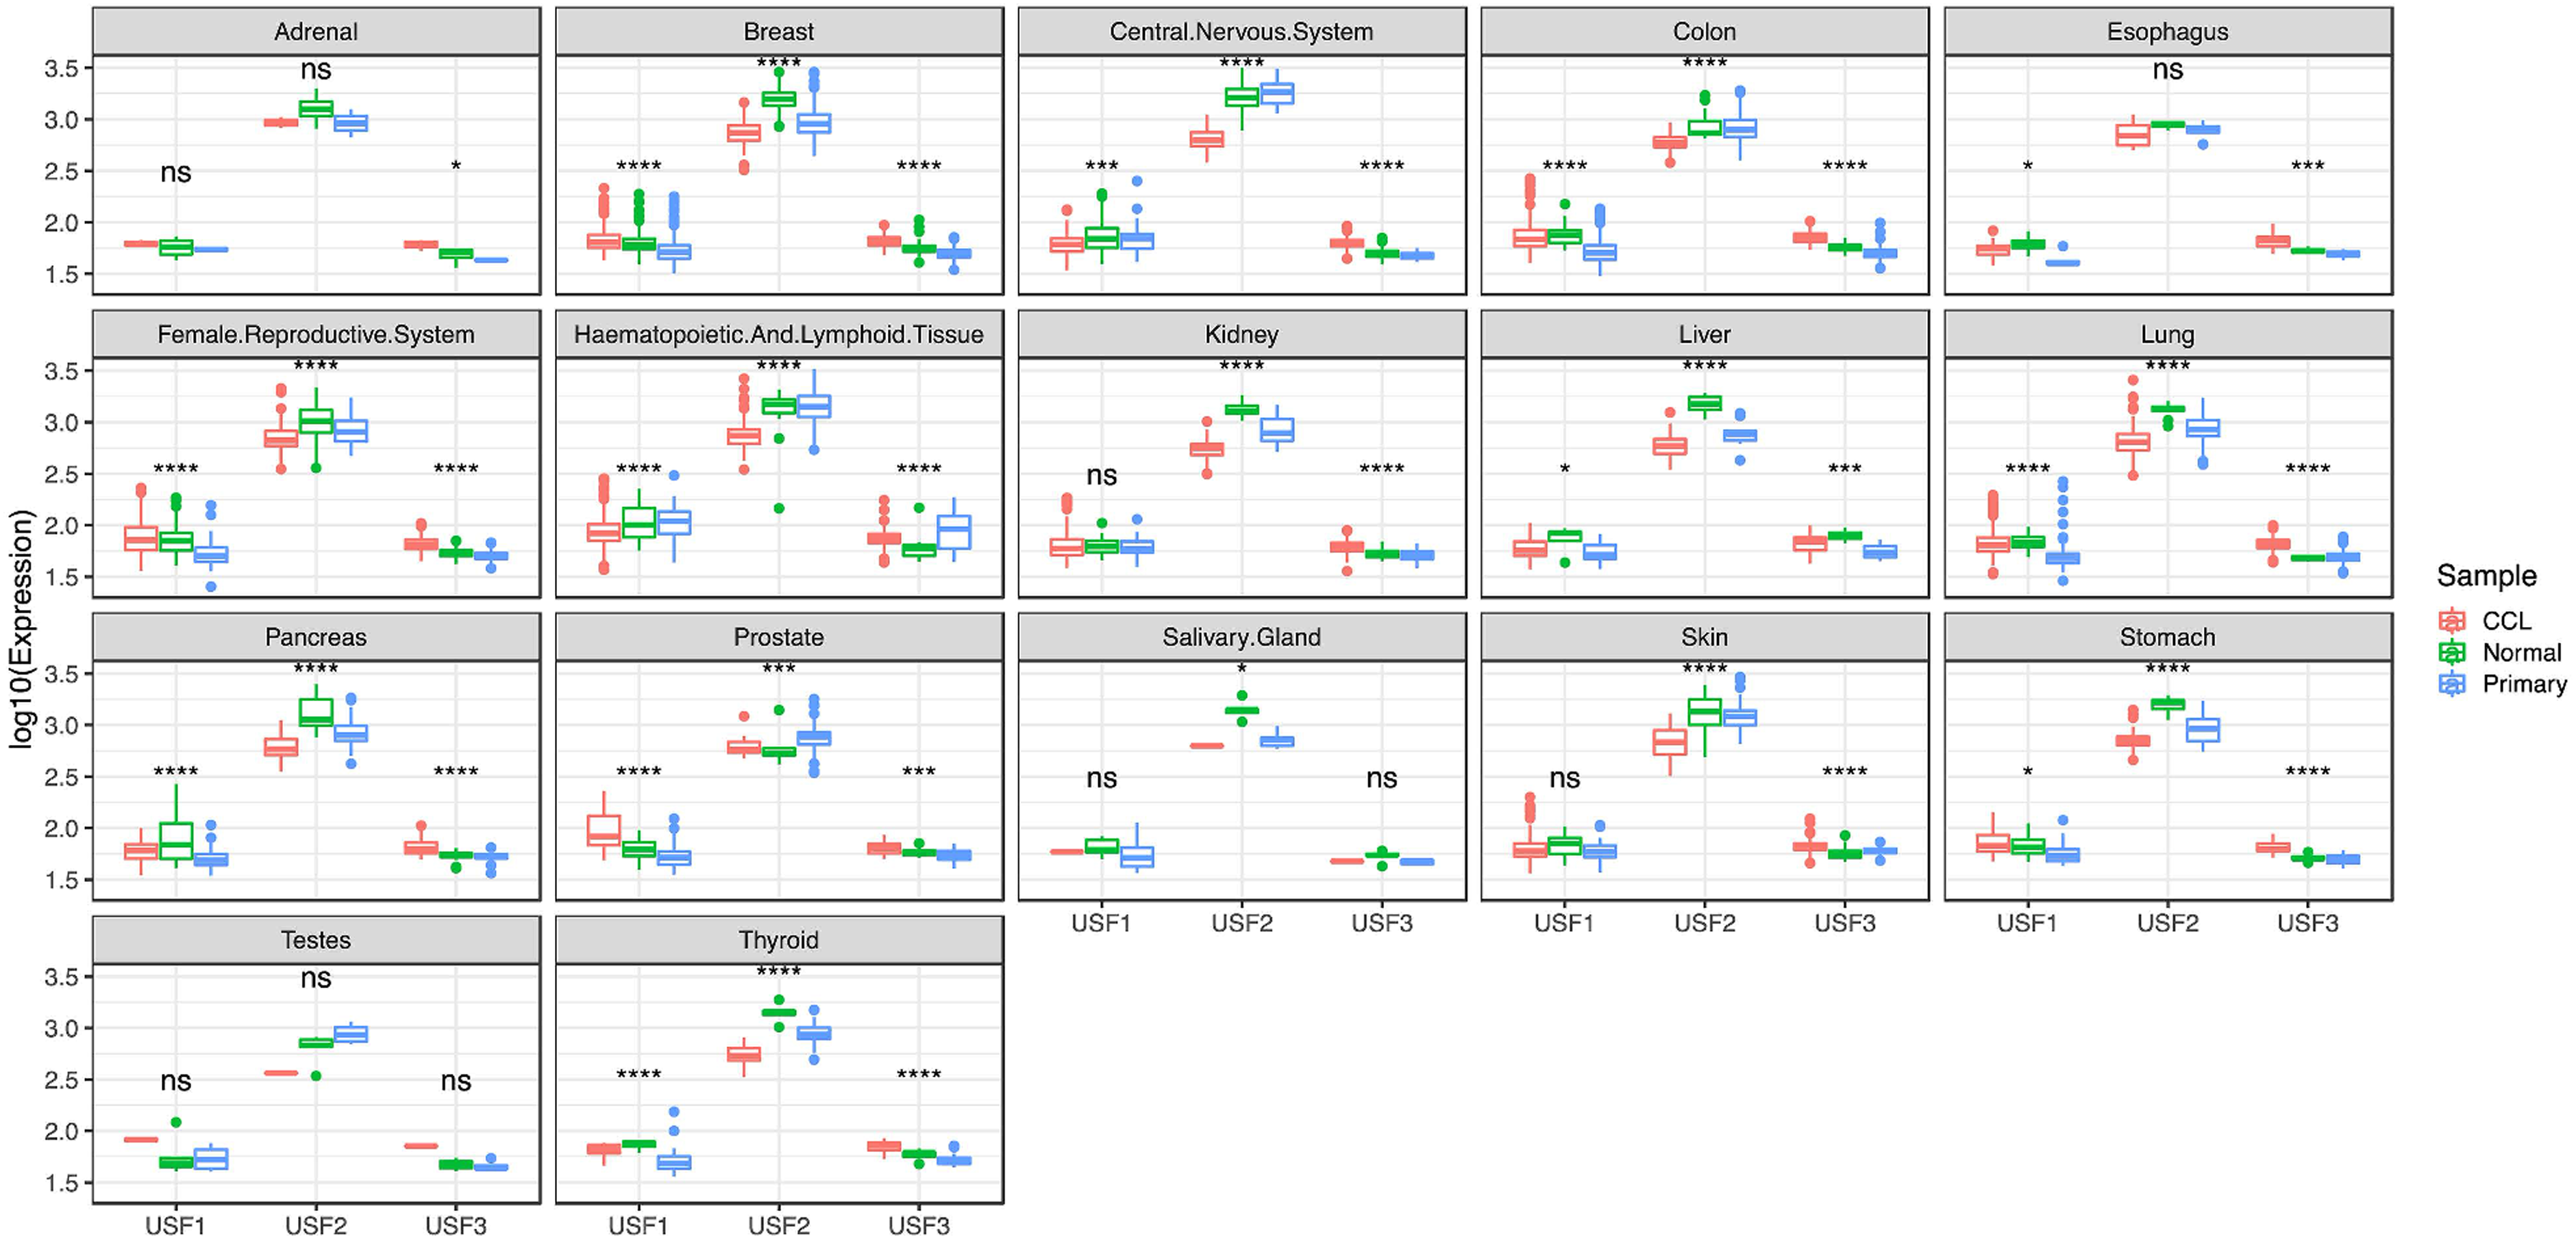
Comparison of USFs expression in tumor, cell line and normal tissues by querying against the MERAV database. The expression levels across all tissues were log10 transformed.
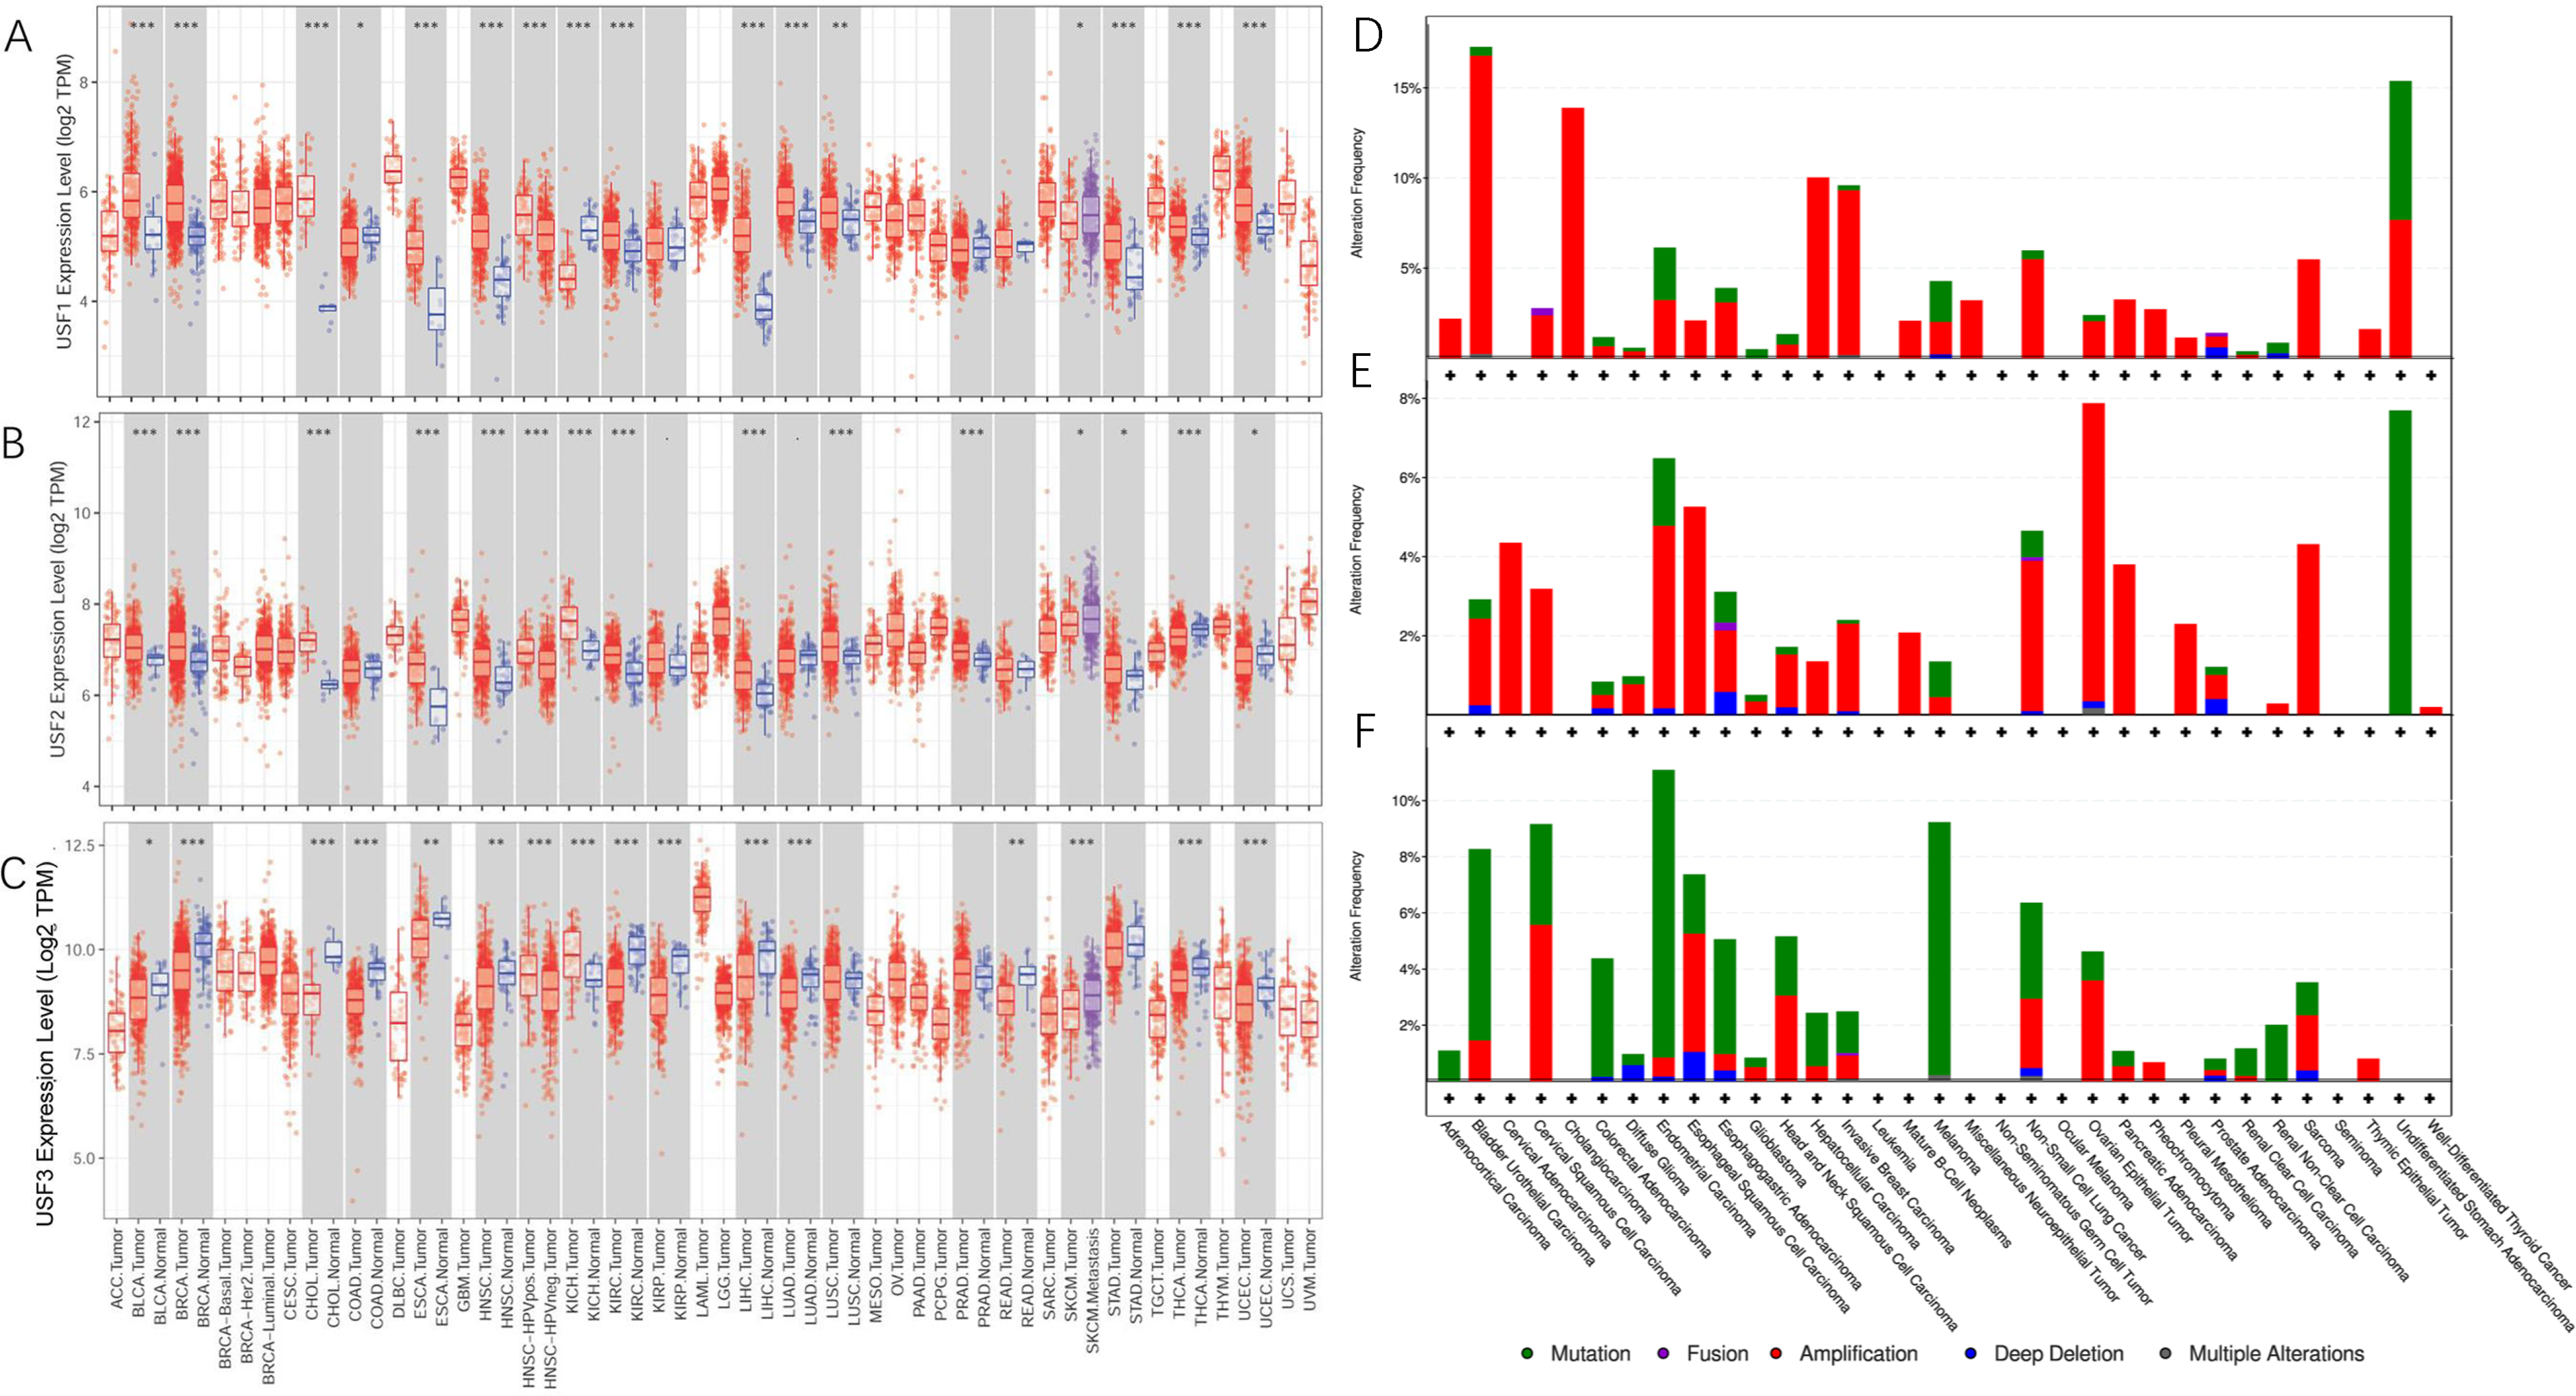
Differential USFs expression between tumors and adjacent normal tissues across all TCGA data were determined by TIMER and comparison of USFs alterations across different types of cancer. *: P < 0.05; **: P < 0.01; ***: P < 0.001. (a) USF1 expression. (b) USF2 expression. (c) USF3 expression. (d) Distribution of USF1 alterations. (e) Distribution of USF2 alterations. (f) Distribution of USF3 alterations.
Comparison of alteration, methylation, and amplification of USFs
The changes in other genetic and epigenetic factors for USF family were analyzed by cBioportal. 21 We also downloaded methylation data from the CCLE database for a further comparison. Figure 2(d) to (f) shows that USF3 had the most extensive mutations within the USFs family. In addition, amplification appeared to be a dominant genetic alteration for both USF1 and USF2. Interestingly, USF2 had the lowest methylation across all cancer types, whereas USF1 and USF3 had a higher promoter methylation level ( Supplementary Figure 1 ), indicating a strong correlation between the expression of USFs and their promoter DNA methylation.
Prognostic value of USF3 expression across different types of cancers
To assess the potential prognostic value of USFs expression in different cancers, the prognostic significance of USF expressions, as well as other clinicopathological factors, including patient age, tumor stage, and tumor purity, were evaluated in 11 tumor types using the univariable and multivariable Cox proportional hazard model (Table 1). Kaplan–Meier survival curves were then generated for USFs by comparing the patient with high and low expression for these tumors. The Forest plot and Kaplan–Meier plot that evaluated the prognostic value of USF3 expression are displayed in Figure 3. Taken together, increased USF1 correlated with better survival in bladder urothelial carcinoma (BLCA) but worse survival in kidney renal clear cell carcinoma (KIRC). Higher expression of USF2 was associated with worse prognosis in BLCA and KICH. As for USF3, its expression was positively correlated with the overall survival in KIRC.
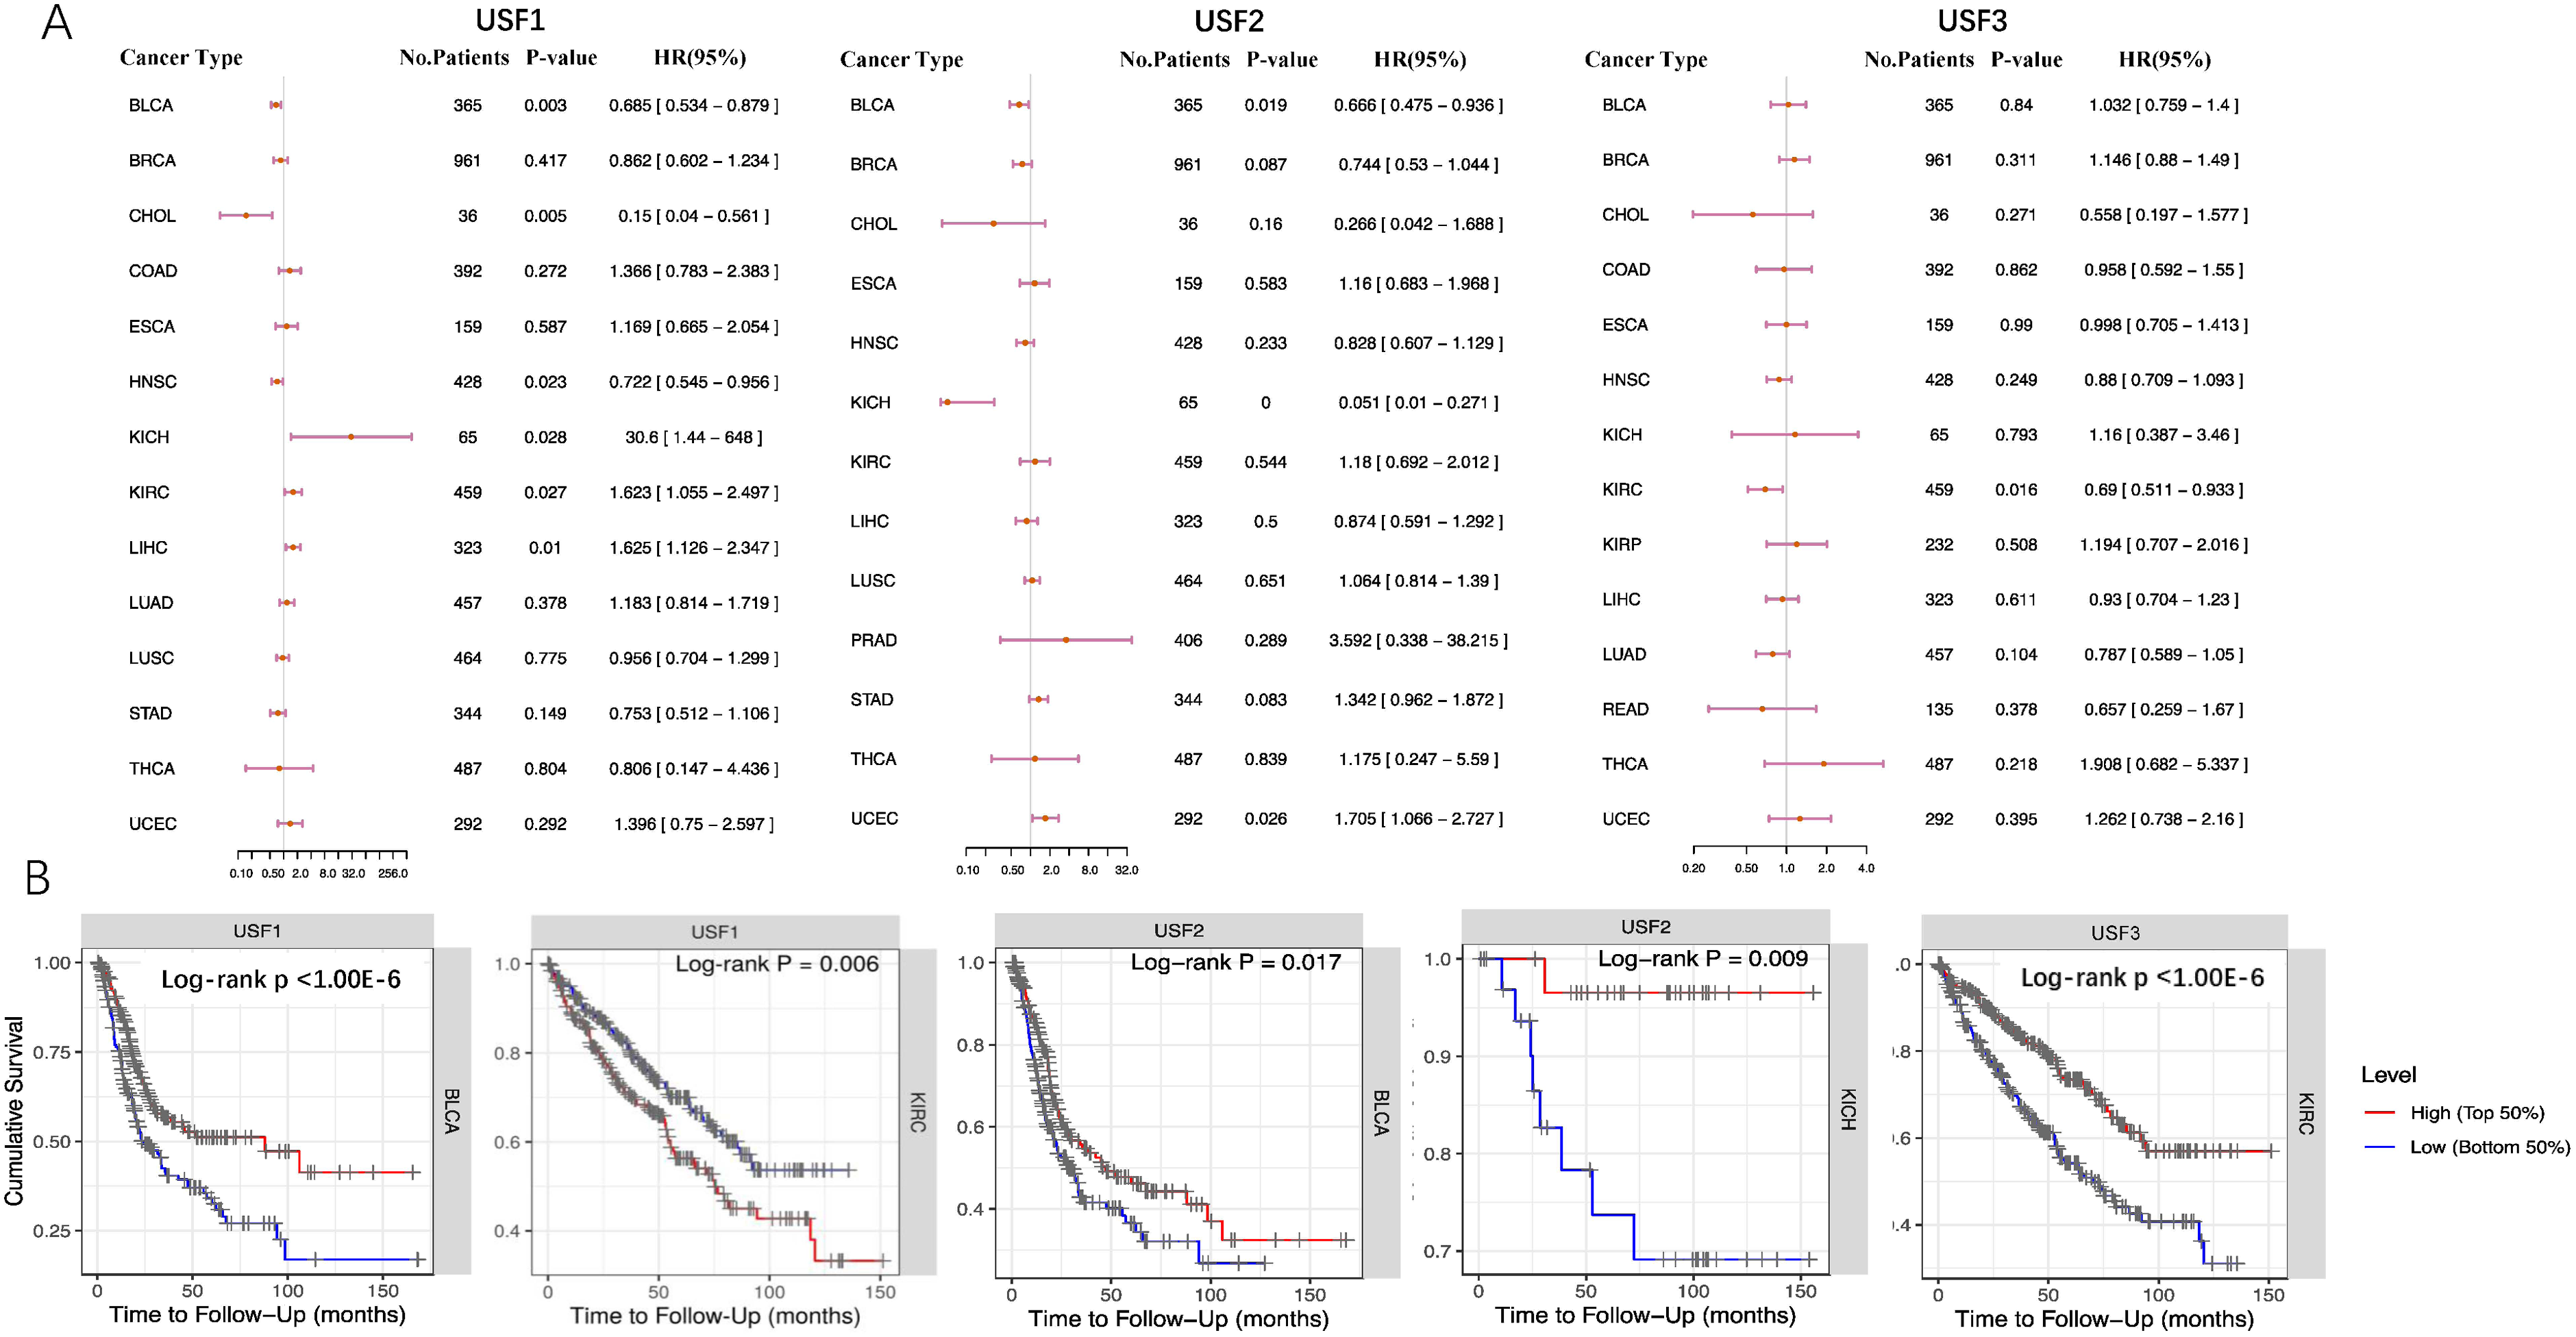
Forest plot and Kaplan–Meier plot evaluating the prognostic role of USFs expression. (a) Forest plot for survival association of different cancer. (b) Overall survival time for USFs high expression group and USFs low expression group in different cancers.
Univariate and multivariate Cox regression analysis of OS-related risk factors for USFs.
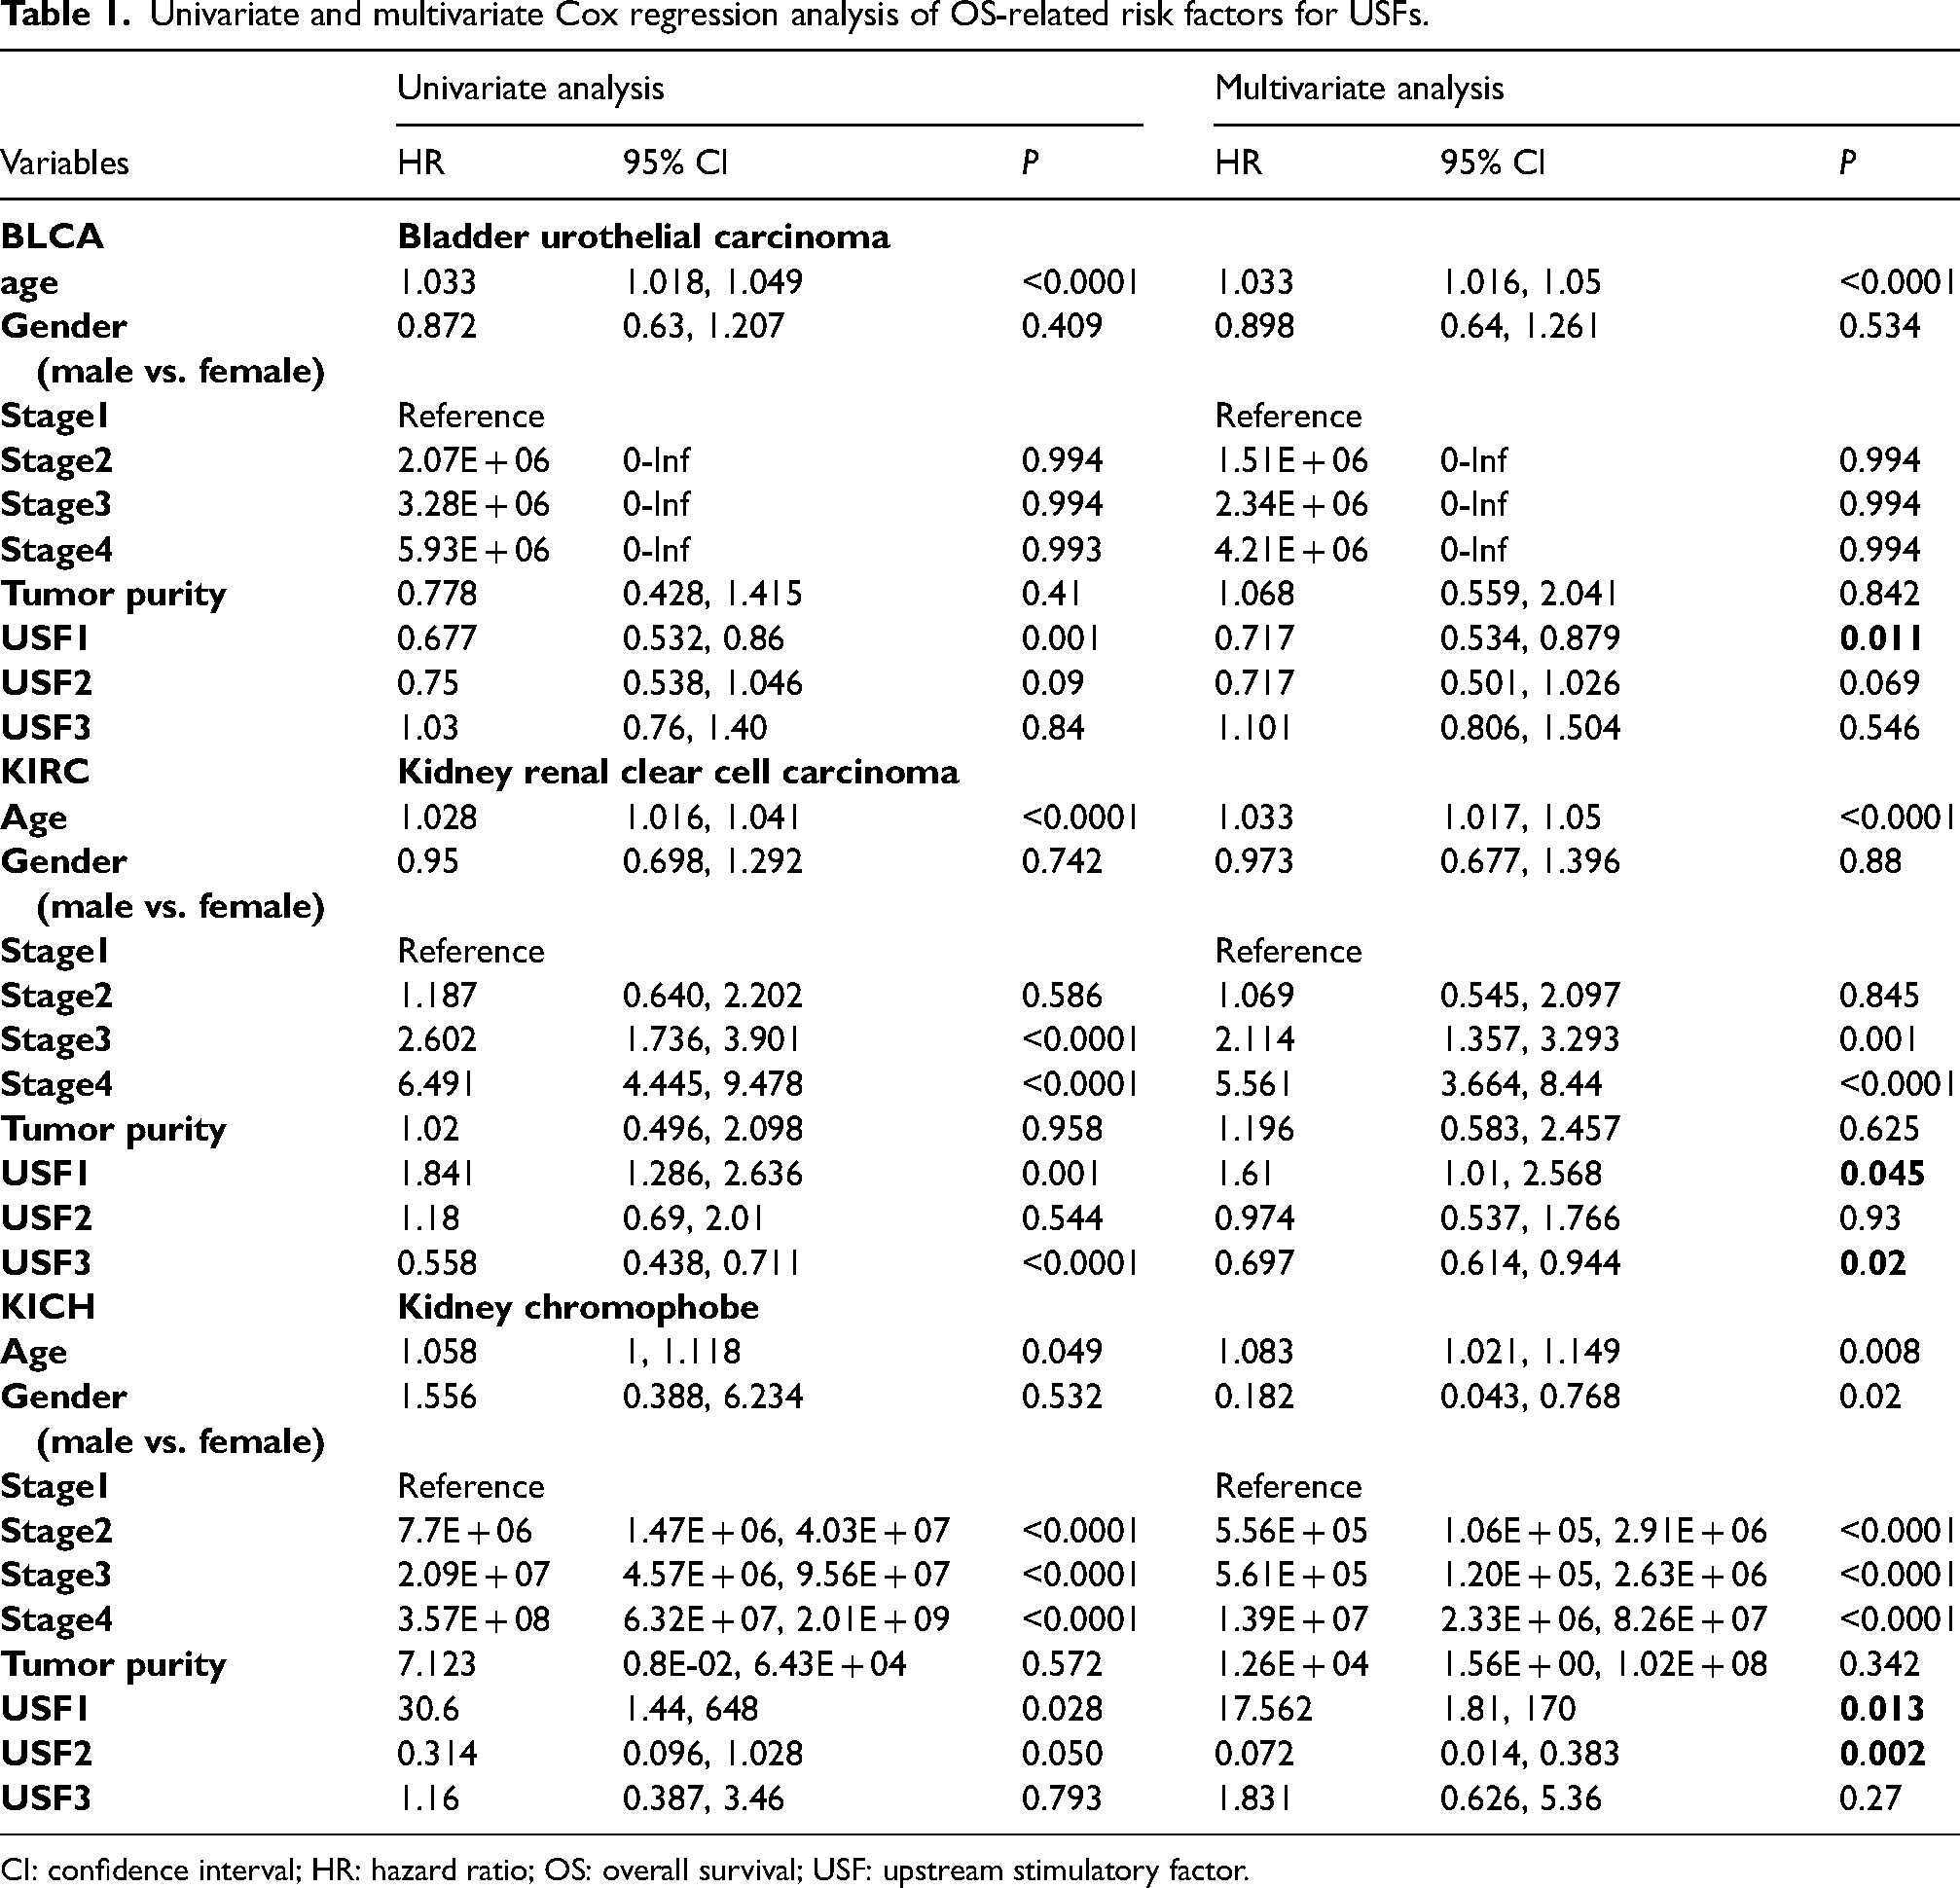
CI: confidence interval; HR: hazard ratio; OS: overall survival; USF: upstream stimulatory factor.
Association between USFs expression and immune-cell infiltration
Using cancer types in which USFs expression was significantly associated with OS, we generated scatter plots to show significant positive correlations between USF1 expression and infiltrating levels of CD4+ T cells, neutrophils, and dendritic cells in KIRC ( Supplementary Figure 2 ). Similarly, there were positive correlations with infiltrating levels of CD4+ T cells, neutrophils, macrophages, and dendritic cells in KIRC for USF3. In contrast, there was no significant association found between USF2 expression and any immune infiltration level in BLCA and KICH.
Association analysis between USF expressions and immune marker sets
To further investigate the potential role of immunotherapy for USFs in BLCA, KICH, and KIRC, we explored their relationship with genetic markers of immune infiltrating cells. In
Development of drug response ShinyApp GRD
To facilitate the acquisition of any GRDs of interest in the CTRP database, 18 we have developed a ShinyApp, which is freely accessible at http://zzdlab.com:3838/Drugdiscovery/ (Figure 4(a)). It was implemented using R language running the Shiny server. The ShinyApp has three subpages:
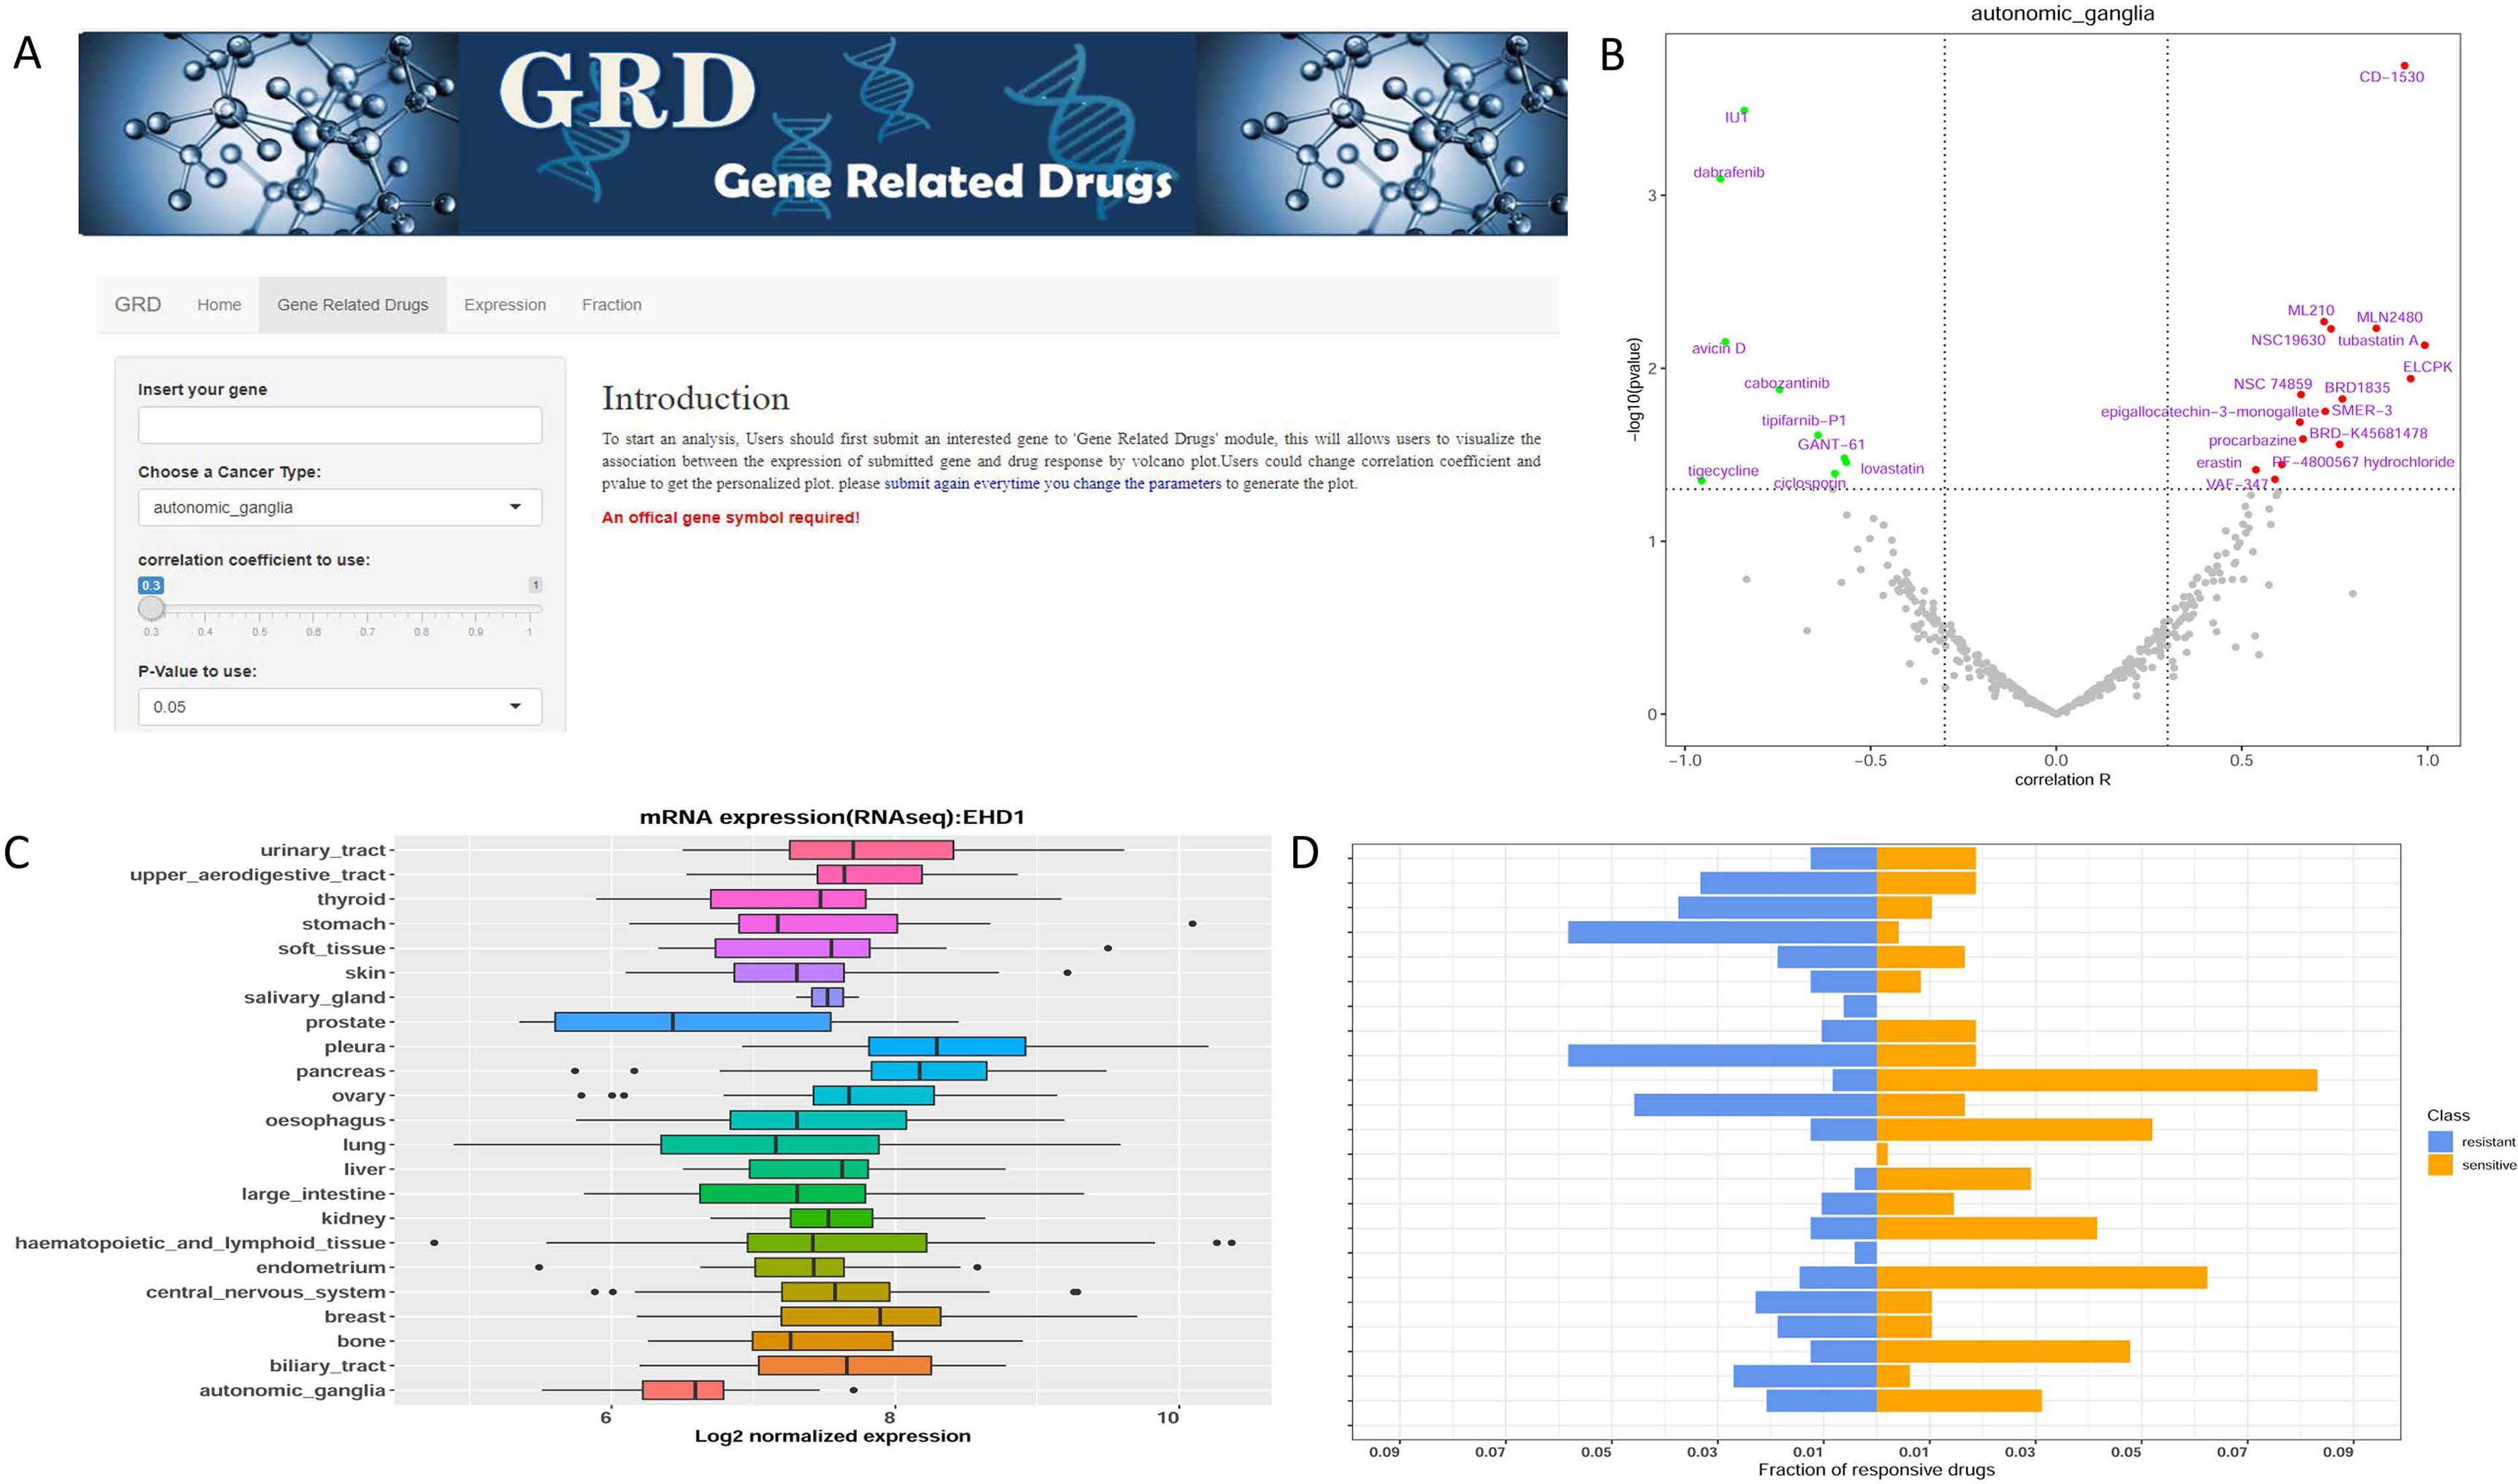
Overview of the developed GRD ShinyApp for association analysis between any gene of interest and the corresponding drug response. (a) The interface of GRD ShinyApp. (b) Volcano plot of correlation coefficient and –log10 P-value between interested gene expression in all cell lines and 481 compounds. (c) Boxplot of interested gene expression across all cell lines in CTRP database. (d) Fraction of resistant and sensitive drugs in different cell line types.
1. The “Gene-Related Drugs” subpage allows users to visualize the association between the expression of the gene of interest and drug response using volcano plots (Figure 4(b)).
2. The “Expression” subpage displays the expression level for any gene of interest across all tumor cell lines in CTRP (Figure 4(c)).
3. The “Fraction” subpage visualizes the proportion of responsive drugs by calculating the ratio of drugs with absolute correlation coefficient greater than 0.3 and a P value <0.05 in different cell lines (Figure 4(d)).
This server could aid researchers in finding candidate drugs to regulate interested gene expression so they can design an experiment to study its biological function in vitro.
Association between USF expressions and drug response
It is of particular interest to note that all USF proteins had a significant association with kidney cancer despite the different subtypes (
Identification of known and predicted protein interactions essential for the USF family
We first constructed the USF protein–protein interaction networks to better understand their molecular functions. After clustering analysis by Cytoscape, USF1 and USF2 were clustered together whereas USF3 was localized in another cluster (
Discussion
The role of the USF protein family in cancer has not been systematically studied, especially the third family member: USF3. Here, we comprehensively investigated USF expressions and alterations in different tumors, normal tissues, and cancer cell lines. Additionally, we analyzed its correlation with OS, tumor-infiltrating immune cells and drug response. Furthermore, we identified the USF protein interaction networks to interpret their biological functions.
In general, USF2 had the highest expression no matter whether it was in normal tissue, tumors, or cancer cell lines, whereas USF3 had the lowest expression. We found that USF1 and USF2 tended to have amplifications while USF3 had the most extensive mutations. It is well-known that gene amplification can often cause enhanced gene expression and that mutation causes reduced gene expression. In addition, methylation is commonly recognized to repress gene transcription thereby causing gene under-expression. In our study, USF2 was lowly methylated and highly expressed in cancer compared to the other two members, suggesting the consistent inverse correlation between DNA methylation of the USFs and gene expression across cancers. In addition, USF3 is generally expressed at lower levels in tumors compared with normal tissue, with the only exception of KICH. Unlike renal clear cell carcinoma and renal papillary cell carcinoma, KICH shows elevated USF3 expression in TCGA tissue samples relative to normal kidney cell lines, which display low USF3 expression.
We have applied multivariate Cox regression and Kaplan–Meier analysis to evaluate the prognostic role for USF proteins. It is noteworthy that the expression of all these members correlated with certain type of renal cancer and two of them correlated with BLCA. This is very interesting because the two types of cancer are related to the urinary system. Hence, we further evaluated the potential of USFs as therapeutic targets for kidney cancer and BLCA. For this purpose, we first investigated the relationship between USFs and the diverse immune infiltrating cells. We found a strong association between USF1 and USF3 expression and tumor-infiltrating immune cells in KIRC but not in BLCA. In fact, USF1 has been previously reported to promote the immune response by stimulating the expression of immunoglobulin light chain genes.28,29 A previous study reported that USF3 expression was highly correlated with tumor-infiltrating neutrophils and affected the prognosis and efficacy of chemotherapy and immunotherapy in gastric cancer patients. 30 Taken together, USF1 and USF3 should play important roles in immunotherapy for KIRC. These findings require validation in independent and larger patient cohorts studies in the future.
Second, we identified the relationship between USF expressions and drug responses. By querying the CTRP dataset, drugs that correlated with USF expressions in kidney and the urinary tract were identified. In kidney cell lines, the compound BRD-K96431673 was found to be negatively correlated with USF1 and USF2 expression. However, the currently available information regarding this compound is very limited. The other drug, OSI-027, which is positively correlated with both USF1 and USF2 expression, is an inhibitor of mTOR. mTOR plays an important role downstream in the PI3 K/Akt/mTOR signaling pathway, which is regulated by many genes and miRNAs to affect the metastasis of renal carcinoma.30–32 OSI-027 has been used in clinical trials focusing on the treatment of advanced solid tumors. 33 Our results suggested that USF1 and USF2 might be therapeutic targets of OSI-27 for treating kidney cancer via the mTOR signaling pathway. As for the urinary tract cell line, three drugs, AZD1480, cediranib, and MK-0752, were all negatively correlated with the expression of USF1 and USF2. Amongst them, AZD1480 is an inhibitor of Janus kinases 1 and 2, and has been used in clinical trials studying the treatment of solid malignancies, post-polycythemia vera, primary myelofibrosis (PMF), and essential thrombocythemia myelofibrosis. Cediranib, an inhibitor of VEGFRs, has been used in a variety of clinical trials in cancer treatment such as rectal, 34 ovarian, 35 prostate, 36 and others. However, no trial has been found for treating bladder urothelial cancer. MK-0752, as an inhibitor of gamma-secretase, was also utilized in several trials for pancreatic ductal adenocarcinoma, 37 ovarian cancer, 38 and other solid tumors. 39 Other than USF1 and USF2, the expression of USF3 was correlated with fewer compounds in kidney cell lines. Amongst these, the strongest negatively correlated compound was tipifanib-P2, which is an inhibitor of farnesyltransferase. This inhibitor has been primarily used in clinical trials for breast cancer.40–42
Another important aspect of our study is that the expression of USFs is correlated with genetic markers of immune infiltrating cells in BLCA, KICH, and KIRC, suggesting their potential role in tumor immunomodulatory regulation. The strong correlation between USF3 expression and the expression of Th2, Th17, and Treg gene markers including STAT6, STAT3, and STAT5B. STAT6 and STAT3 is critical in the differentiation and development of T helper cells.43,44 And STAT5B is a T-cell depletion marker, which is a key factor in T-cell development. 45 In addition, USF3 is strongly correlated with CD4+ T cell, macrophage, neutrophil and dendritic cells in KIRC. Taken together, we conclude that USF3 should play an important role in the regulation of immune infiltrating cells and immune response, especially in KIRC.
There are several limitations of the current study: First, although we revealed significant correlations between USF2 expression and KICH, the sample size for KICH was relatively small (n = 65). Second, there are 860 cell lines in the CTRP database; however, classification of those cell lines according to the cancer type led to a significant reduction in that number (e.g., prostate cancer has only 6 cell lines, and thyroid cancer has only 12). Furthermore, it was difficult to match the cancer types in CTRP and tumor tissues in TCGA, making it impossible to cross-check the corresponding drugs for KIRC, KICH, and BLCA. In addition, tumor heterogeneity is a common issue associated with cancer study, which has further confounded the analysis. To resolve this, we utilized 2016 cancer cell line arrays to compare the differential expression of USF1, USF2, and USF3 along with the primary tumor and normal tissue. The final limitation of this study is that some analyses were carried out on different data due to the incompleteness of publicly available online data.
Although the results obtained from our study are observational and not sufficient for immediate clinical application, some results are very interesting and worth follow-up validation. In our future work we plan to perform wetlab validation experiments on kidney and urinary cell lines to interrogate the function of the USF family as well as exploring their potential as drug targets. It is possible that we could reveal the underlying molecular-level mechanism of how USFs affect kidney and urinary tumors in the future.
In summary, we have comprehensively and systematically investigated a variety of genetic and epigenetic factors of USFs across different cancer types and, as a result, we found that they were not alike in many aspects. USF2 has the highest expression with dominating amplification, whereas USF3 has the lowest expression with the most extensive mutations. All the three members are correlated with OS in kidney cancer to some extent. However, only USF1 and USF2 are correlated with OS in BLCA. USF1 and USF2 share some common drugs for kidney and urinary tract cell lines and are in the same functional cluster. Furthermore, the association between USF1 and USF3 with tumor-infiltrating immune cells and the drug response for each of them might open potential opportunities for future therapeutic applications.
Supplemental Material
sj-docx-1-jbm-10.1177_03936155231206135 - Supplemental material for Systematic analysis reveals distinct roles of USF family proteins in various cancer types
Supplemental material, sj-docx-1-jbm-10.1177_03936155231206135 for Systematic analysis reveals distinct roles of USF family proteins in various cancer types by Xia Liu, Zhuo-Zhi Wang, Shuai Meng, Fenglin Zang, Huilai Zhang, Ju Wang and Yong-Zi Chen in The International Journal of Biological Markers
Supplemental Material
sj-xlsx-2-jbm-10.1177_03936155231206135 - Supplemental material for Systematic analysis reveals distinct roles of USF family proteins in various cancer types
Supplemental material, sj-xlsx-2-jbm-10.1177_03936155231206135 for Systematic analysis reveals distinct roles of USF family proteins in various cancer types by Xia Liu, Zhuo-Zhi Wang, Shuai Meng, Fenglin Zang, Huilai Zhang, Ju Wang and Yong-Zi Chen in The International Journal of Biological Markers
Footnotes
Acknowledgments
The authors thank Dr. Wubin Ding (East China Normal University) for his kind help on methylation data collection.
Author contributions
Yong-Zi Chen and Ju Wang conceived and designed the study; Xia Liu and Zhuo-Zhi Wang conceived the data collection and performed most of the analysis, and wrote the manuscript. Fenglin Zang and Huilai Zhang participated in writing and revised the manuscript draft. Shuai Meng tested the ShinyApp. Xia Liu and Zhuo-Zhi Wang, contributed equally to this work. All authors read, commented, and approved the final version of the manuscript.
Declaration of conflicting interests
The authors declared no potential conflicts of interest with respect to the research, authorship, and/or publication of this article.
Funding
The authors disclosed receipt of the following financial support for the research, authorship, and/or publication of this article: This work was supported by the National Natural Science Foundation of China, Tianjin Municipal Education Commission Foundation, Tianjin Municipal Science and Technology Project, (grant number No. 82200208, Grant 2019KJ187, Grant 20JCYBJC00110).
Ethics approval and consent to participate
This study was not required to obtain an approval as it was based on de-identified retrospective patient data published in public domains.
Availability of data and material
Supplemental material
Supplemental material for this article is available online.
References
Supplementary Material
Please find the following supplemental material available below.
For Open Access articles published under a Creative Commons License, all supplemental material carries the same license as the article it is associated with.
For non-Open Access articles published, all supplemental material carries a non-exclusive license, and permission requests for re-use of supplemental material or any part of supplemental material shall be sent directly to the copyright owner as specified in the copyright notice associated with the article.