
Abstract
Introduction
Complement C5a is an important component of the innate immune system. An increasing number of reports have revealed the relevance of C5a in tumor progression; however, its exact role in metastatic renal cell carcinoma (mRCC) remains unknown.
Methods
We evaluated C5a expression in tumor tissue microarrays of 231 mRCC patients and analyzed the relationship between C5a levels and clinical outcomes, and the expression of epithelial-mesenchymal transition (EMT)-related proteins, programmed cell death protein 1 (PD-1), and programmed cell death-ligand 1 (PD-L1). In-vitro functional experiments using exogenous C5a stimulation and C5a silencing in renal cell carcinoma cells were used to validate the tissue findings.
Results
High C5a expression was associated with poor therapeutic responses, poor overall and progression-free survival, and high expression of EMT-related proteins and PD-1/PD-L1 in mRCC patients. Exogenous C5a promoted proliferation, migration, and invasion of renal cell carcinoma cells, and induced the expression of EMT-related proteins and PD-1/PD-L1. Conversely, C5a silencing inhibited migration and invasion of renal cell carcinoma cells and decreased the expression of EMT-related proteins and PD-1/PD-L1.
Conclusions
Our findings indicate that elevated C5a expression is associated with poor outcomes in patients with mRCC, and this effect may be partly attributed to the ability of C5a to promote EMT and PD-1/PD-L1 expression. C5a may be a potential novel target for the treatment of mRCC.
Keywords
Introduction
Partial nephrectomy and radical nephrectomy are the preferred treatment options for localized renal cell carcinoma (RCC); however, approximately 30% of patients eventually advance to metastatic disease, with their 5-year survival rate being greatly reduced.1–3 In the past, tyrosine kinase inhibitors (TKI) were the first treatment choice for metastatic renal cancer; TKIs such as sorafenib, sunitinib, pazopanib, or cabozantinib have significantly contributed to prolonging the survival of patients with metastatic RCC (mRCC).4–8 However, with the development and progress of targeted immunotherapy, mRCC treatment has gradually entered the era of TKI and immune checkpoint inhibitor combinations. Attainment of complete response in mRCC patients is rare, and significant improvements in overall survival (OS) are still limited.9–11 Therefore, possible mechanisms underlying the progression and eventually the metastasis of RCC cells need to be further explored to develop better therapeutic approaches.
Programmed cell death protein 1 (PD-1) is an inhibitory receptor on T cells, and its stimulation and downstream signaling inhibit the activation of T cells, thereby preventing them from mediating their cytotoxic effects. 12 The interaction of PD-1 with programmed cell death-ligand 1 (PD-L1) on the surface of T cells in the tumor microenvironment inhibits T cell function and blocks anti-tumor immune responses. Therefore, the inhibition of the PD-1‒PD-L1 interaction can facilitate T cell cytotoxic functions and anti-tumor immune response.
Complement 5a (C5a) is an N-terminal 74 amino acid fragment derived from complement fifth component (C5). 13 Several studies in lung, gastric, and colon cancer, have found that complement components, especially C5a, in the tumor microenvironment can lead to tumor progression.14–16 In addition, Kaida et al. 17 reported that the C5a receptor can promote invasion of gastric cancer by activating RhoA.
However, the exact role of C5a in the progression of mRCC has not been evaluated. Here we investigated the expression of C5a in tissue microarrays from mRCC patients by immunohistochemical staining, evaluated the relationship between C5a expression and mRCC prognosis, and further explored the underlying functional mechanisms by which C5a exerts its effects on RCC cells.
Materials and methods
Patients and tissue samples
RCC tissue samples were retrospectively collected from 231 patients in Zhongshan Hospital from June 2007 to June 2017. All patients received TKI therapy (sorafenib or sunitinib) after a diagnosis of metastatic disease. Clinicopathological data were obtained from medical records. The study protocol was approved by the Ethical Committee of the Institution. All patients signed informed consent. Tumor stage was assessed according to the tumor/node/metastasis (TNM) classification (6th edition) of The Union for International Cancer Control. Pathological classification was based on World Health Organization criteria. OS was evaluated from the introduction of systemic therapy to the date of death or the last follow-up. Progression-free survival (PFS) was evaluated from the introduction of systemic therapy to the date of progression. Most tissue samples originated from surgery of the kidney tumors. A few tissue samples originated from biopsy of lung or bone metastatic lesions. All tissue samples were obtained prior to TKI treatment.
Immunohistochemistry
Paraffin-embedded tissue sections with a 4-μm thickness were prepared, deparaffinized in xylene, and rehydrated through a series of graded ethanol.18,19 Antigen retrieval was performed using a microwave oven, and the tissue sections were blocked with 0.3% H2O2 for 15 min. The sections were then incubated with a primary antibody (rabbit anti-human C5a (ab281923, Abcam (Waltham, MA, USA)), rabbit anti-human vimentin (ab92547, Abcam), rabbit anti-human Ki-67 (ab15580, Abcam), mouse anti-human PD-1 (ab52587, Abcam), rabbit anti-human PD-L1 (ab205921, Abcam), rabbit anti-human E-Cadherin (3195, Cell Signaling (Danvers, MA, USA)), and rabbit anti-human MMP9 (13667, Cell Signaling)) overnight at 4 °C. After incubation with streptavidin horseradish peroxidase, the reaction product was developed using the diaminobenzidine kit. The specimen slides were evaluated by two investigators blinded to any relevant clinical information. To determine the optimum H-score cutoff point, we used the X tile software (3.6.1) and selected the cutoff value based on the rule of “minimum P value.” Immunohistochemical staining intensity was classified as negative for 0 points, weakly positive for 1 point, positive for 2 points, and strongly positive for 3 points. The PD-L1 expression on both stromal (sPD-L1) and tumor (tPD-L1) cells was measured, and the staining intensity score was multiplied by the percentage of positive cells to calculate the final PD-L1 H-score. Vimentin, E-cadherin, and MMP9 expression was evaluated using a similar semiquantitative H-score method as the one used for PD-L1. 20 Five independent areas were examined to calculate the counts of PD-1+ tumor-infiltrating cells and Ki-67+ tumor cells.
Cell lines and cell culture
The 786-O and 769-P renal cancer cell lines were obtained from the Chinese Academy of Sciences (Shanghai, China). Both cell lines were cultured in Dulbecco's Modified Eagle Medium (DMEM) supplemented with 10% heat-inactivated fetal bovine serum (Gibco, Waltham, MA, USA) at 37 °C in a 5% CO2 incubator.
Lentiviral transfection of cells
Before infection, cells were cultured in antibiotic-free complete medium, with 2 mL of medium being added to each well to keep the cell density at 80%. Cells were then divided into two groups, the 786-O C5 shRNA and 786-O control shRNA infection groups: cells in the logarithmic growth phase were trypsinized, seeded in six-well plates according to the multiplicity of infection target value, and the appropriate amount of transduction-ready lentiviral particles (C5 shRNA or control shRNA lentivirus (sc-42848-V; Santa Cruz)) was added. The infected cells were then selected using puromycin-containing media, and the stably infected cell lines were used for extracting proteins for downstream analyses. For stimulating RCC cells with recombinant human C5a (2037-C5-025; R&D Corporation), the recombinant C5a protein was diluted according to the manufacturer's instructions, and 50 ng/mL were used for cell stimulation. After 24 h, the C5a-stimulated cells were harvested for extracting proteins and RNA for downstream analyses.
Cell counting kit-8 assay
Cells were seeded in 96-well plates at a density of 1 × 10⁴ cells per well and cultured in complete DMEM for 0, 12, 24, 48, and 72 h. At each time point, 10 μL of cell counting kit-8 (CCK-8) were added to each well, and the cells were incubated at 37 °C for 1 h. The optical density value of each well was measured at a wavelength of 450 nm.
Cell migration and invasion assays
RCC cell migration and invasion were assessed using a 24-well transwell chamber with an 8-μm pore size (Corning, NY, USA). Cell suspension (200 μL of serum-free DMEM, containing 2 × 10⁴ cells) was added to the coated filter of the upper compartment, and the lower compartment was filled with conditioned culture medium. Cells were then incubated at 37 °C. After 24 h, cells that had invaded or migrated to the lower chamber were fixed with 4% paraformaldehyde and dyed using crystal violet for 30 min. Finally, cells that had migrated to the bottom surface were fixed with methanol and counted, after staining with 0.5% crystal violet. Migratory cells were counted under the microscope at a ×200 magnification, using six random fields of view.
Western blot analysis
Protein samples were prepared by lysing cells using RIPA buffer (Jiangsu Kaiji Biotechnology Co., Ltd, Wuxi, Jiangsu, China) according to the manufacturer's instructions. Then, 30 ug of total protein were loaded in wells of 10% SDS-PAGE gels, separated by electrophoresis, and transferred onto PVDF membranes (Millipore, Bedford, MA, USA). The PVDF membranes were blocked with 5% non-fat milk and incubated with primary antibodies against PD-L1, PD-1, C5a, E-cadherin, vimentin, MMP-9, or Tubulin overnight at 4 °C. The protein bands were visualized using the ECL kit (Beyotime, Shanghai, China), with Tubulin being used as the internal loading control.
Statistical analyses
All statistical analyses were performed using SPSS 21.0 (IBM Corporation, Armonk, NY, USA) and GraphPad Prism 6 (GraphPad Software Inc., San Diego, CA, USA) software. Statistical significance was indicated by a P-value <0.05. The Mann–Whitney test was used to compare the H-scores. Kaplan–Meier analyses and log-rank tests were used for survival analysis. Univariate and multivariate Cox proportional hazard models were used to evaluate the hazard ratio and 95% confidence interval.
Results
Clinicopathological characteristics of mRCC patients
The median age among the 231 patients in this cohort was 57 years (14–87 years). There were 169 males and 62 females; 95 patients were treated with sorafenib and 136 were treated with sunitinib. With respect to the initial TNM stage, 91 patients were in stage I, 35 were in stage II, 91 were in stage III, and 14 were in stage IV. The histological type of 199 patients was clear cell (ccRCC), and that of 32 patients was non-ccRCC. There were 38, 153, and 40 patients in the favorable, intermediate, and poor risk groups of the International Metastatic Renal Cancer Database Consortium (IMDC), respectively.
Association of C5a expression and characteristics of mRCC patients
To evaluate tumoral C5a level, anti-C5a immunohistochemical staining was performed on tumor tissue microarrays. C5a staining was predominantly associated with the cell membrane and the cytoplasm (Figure 1(a) and (b)). Using the C5a H-scores, we divided these patients into high and low C5a groups based on their tumoral C5a expression levels. The associations between clinical features and C5a levels are shown in Supplementary Table 1. C5a expression was significantly correlated with MMP9 (P = 0.000), vimentin (P = 0.000), tPD-L1 (P = 0.001), sPD-L1 (P = 0.002), PD-1 (P = 0.003), and Ki67 (P = 0.000) expression levels in this patient cohort; the IMDC risk group was also associated with C5a expression. No further significant associations between C5a expression and other clinicopathological characteristics were observed.
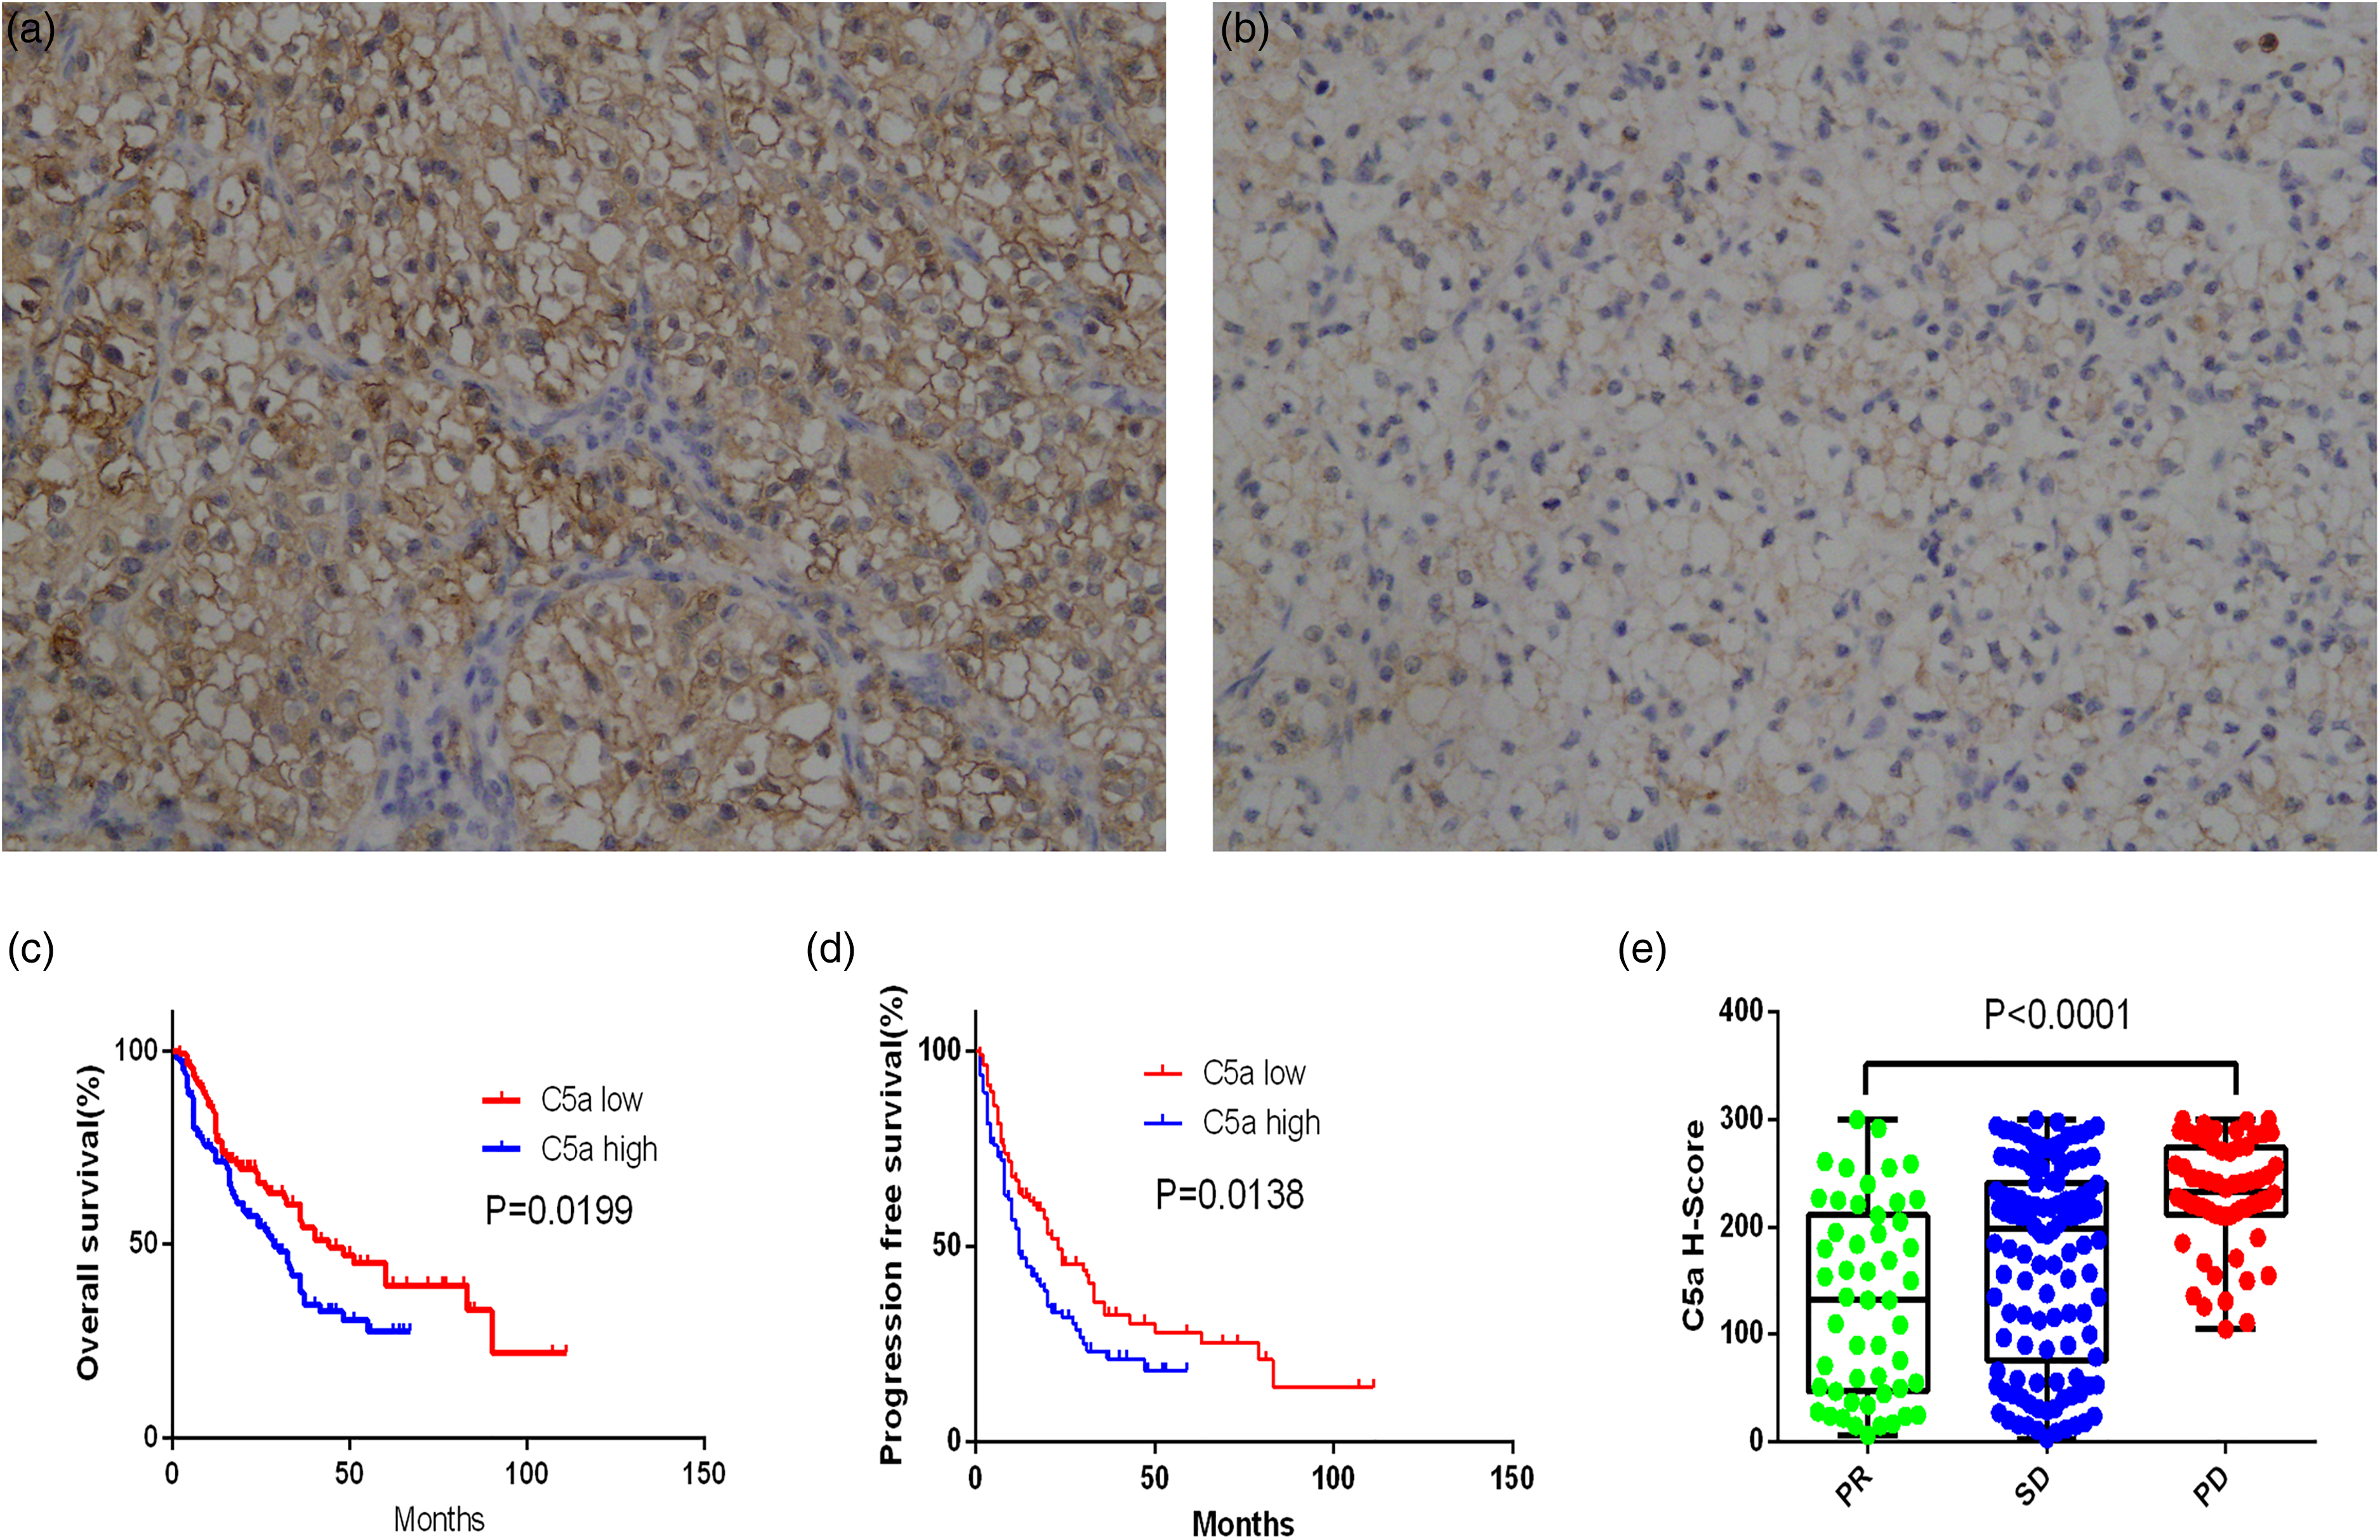
C5a expression is associated with prognosis and treatment response. Typical image of C5a high expression (a) and low expression (b) in tissue microarrays; original magnification: ×100. Kaplan–Meier curve of OS (c) and PFS (d) according to C5a expression; P-value calculated using log-rank test. C5a expression levels in mRCC patients with different response to treatment (e).
C5a expression closely correlates with prognosis and therapeutic response to TKIs in mRCC patients
Kaplan–Meier analyses indicated that C5a expression negatively correlated with OS and PFS (Figure 1(c) and (d)). Univariate and multivariate analyses were conducted to identify the prognostic value of C5a expression. In univariate analyses, initial TNM stage, Fuhrman grade, pulmonary metastasis, IMDC risk group, and C5a levels were possible prognostic factors for OS, whereas initial TNM stage, pulmonary metastasis, IMDC risk group, and C5a levels were possible prognostic factors for PFS. Parameters that were statistically significant in univariate analyses were entered in the multivariate analyses. Multivariate analysis indicated that C5a expression (P = 0.033) was a prognostic factor for OS of patients with mRCC; TNM stage, pulmonary metastasis, and IMDC risk group also remained prognostic factors for OS (P = 0.022, P = 0.006, and P = 0.001, respectively). In addition, multivariate analysis indicated C5a expression (P = 0.019) as a prognostic factor for PFS; pulmonary metastasis and initial TNM stage also remained prognostic factors for PFS (P = 0.025 and P = 0.006, respectively; Table 1). Collectively, these data show that the expression level of C5a is an independent prognostic factor for OS and PFS in mRCC patients. Additionally, the C5a expression level strongly correlated with response to TKI treatment (P < 0.001; Figure 1(e)).
Multivariate Cox regression analyses for OS and PFS of patients (n = 231).
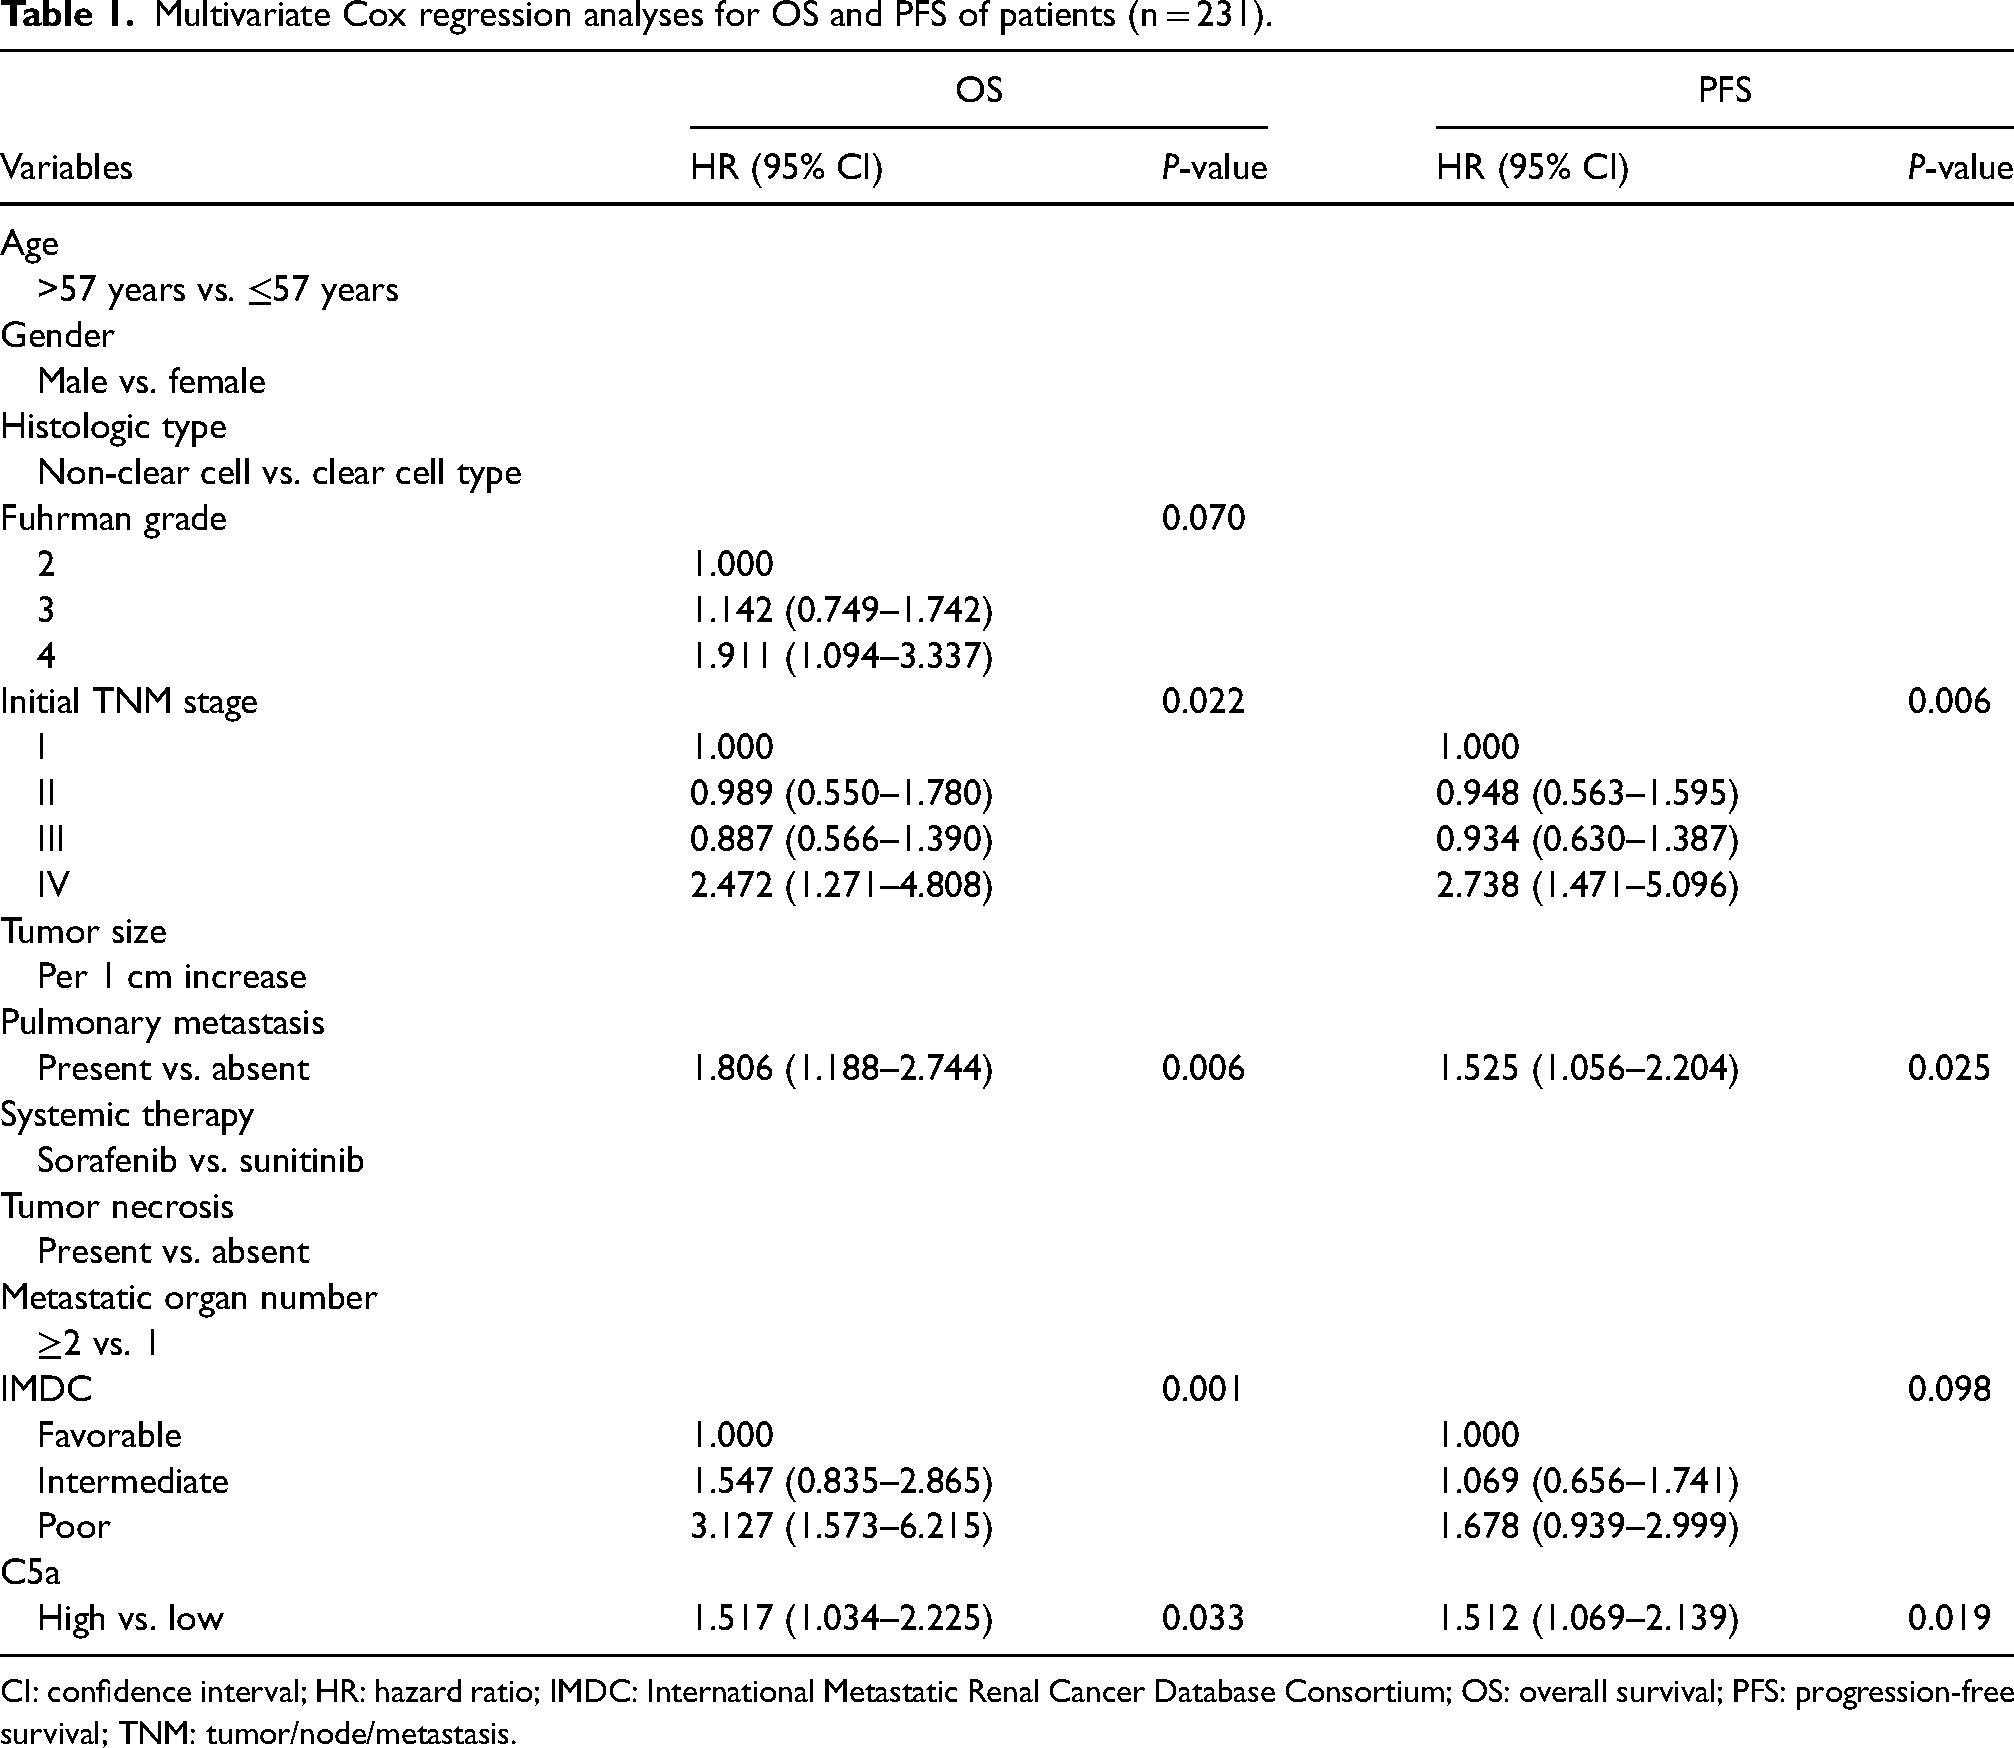
CI: confidence interval; HR: hazard ratio; IMDC: International Metastatic Renal Cancer Database Consortium; OS: overall survival; PFS: progression-free survival; TNM: tumor/node/metastasis.
C5a promotes proliferation, invasion, and migration of RCC cells
The CCK8 experiment was performed to evaluate the effect of complement C5a on cell proliferation. The 786-O and 769-P renal cancer cell lines were seeded in 96-well plates and treated with recombinant human C5a protein (50 ng/mL). We observed that C5a treatment promoted the proliferation of both 786-O and 769-P cell lines, as both C5a-treated lines grew faster compared to their respective controls (Figure 2(a) and (b)). We further examined the effects of C5a stimulation on the migration and invasion ability of renal cancer cells. We observed that the ability to migrate, invade, and break through the basement membrane was significantly enhanced in C5a-stimulated cells compared to controls, for both the 786-O and 769-P cell lines (Figure 2(c) to (f)).
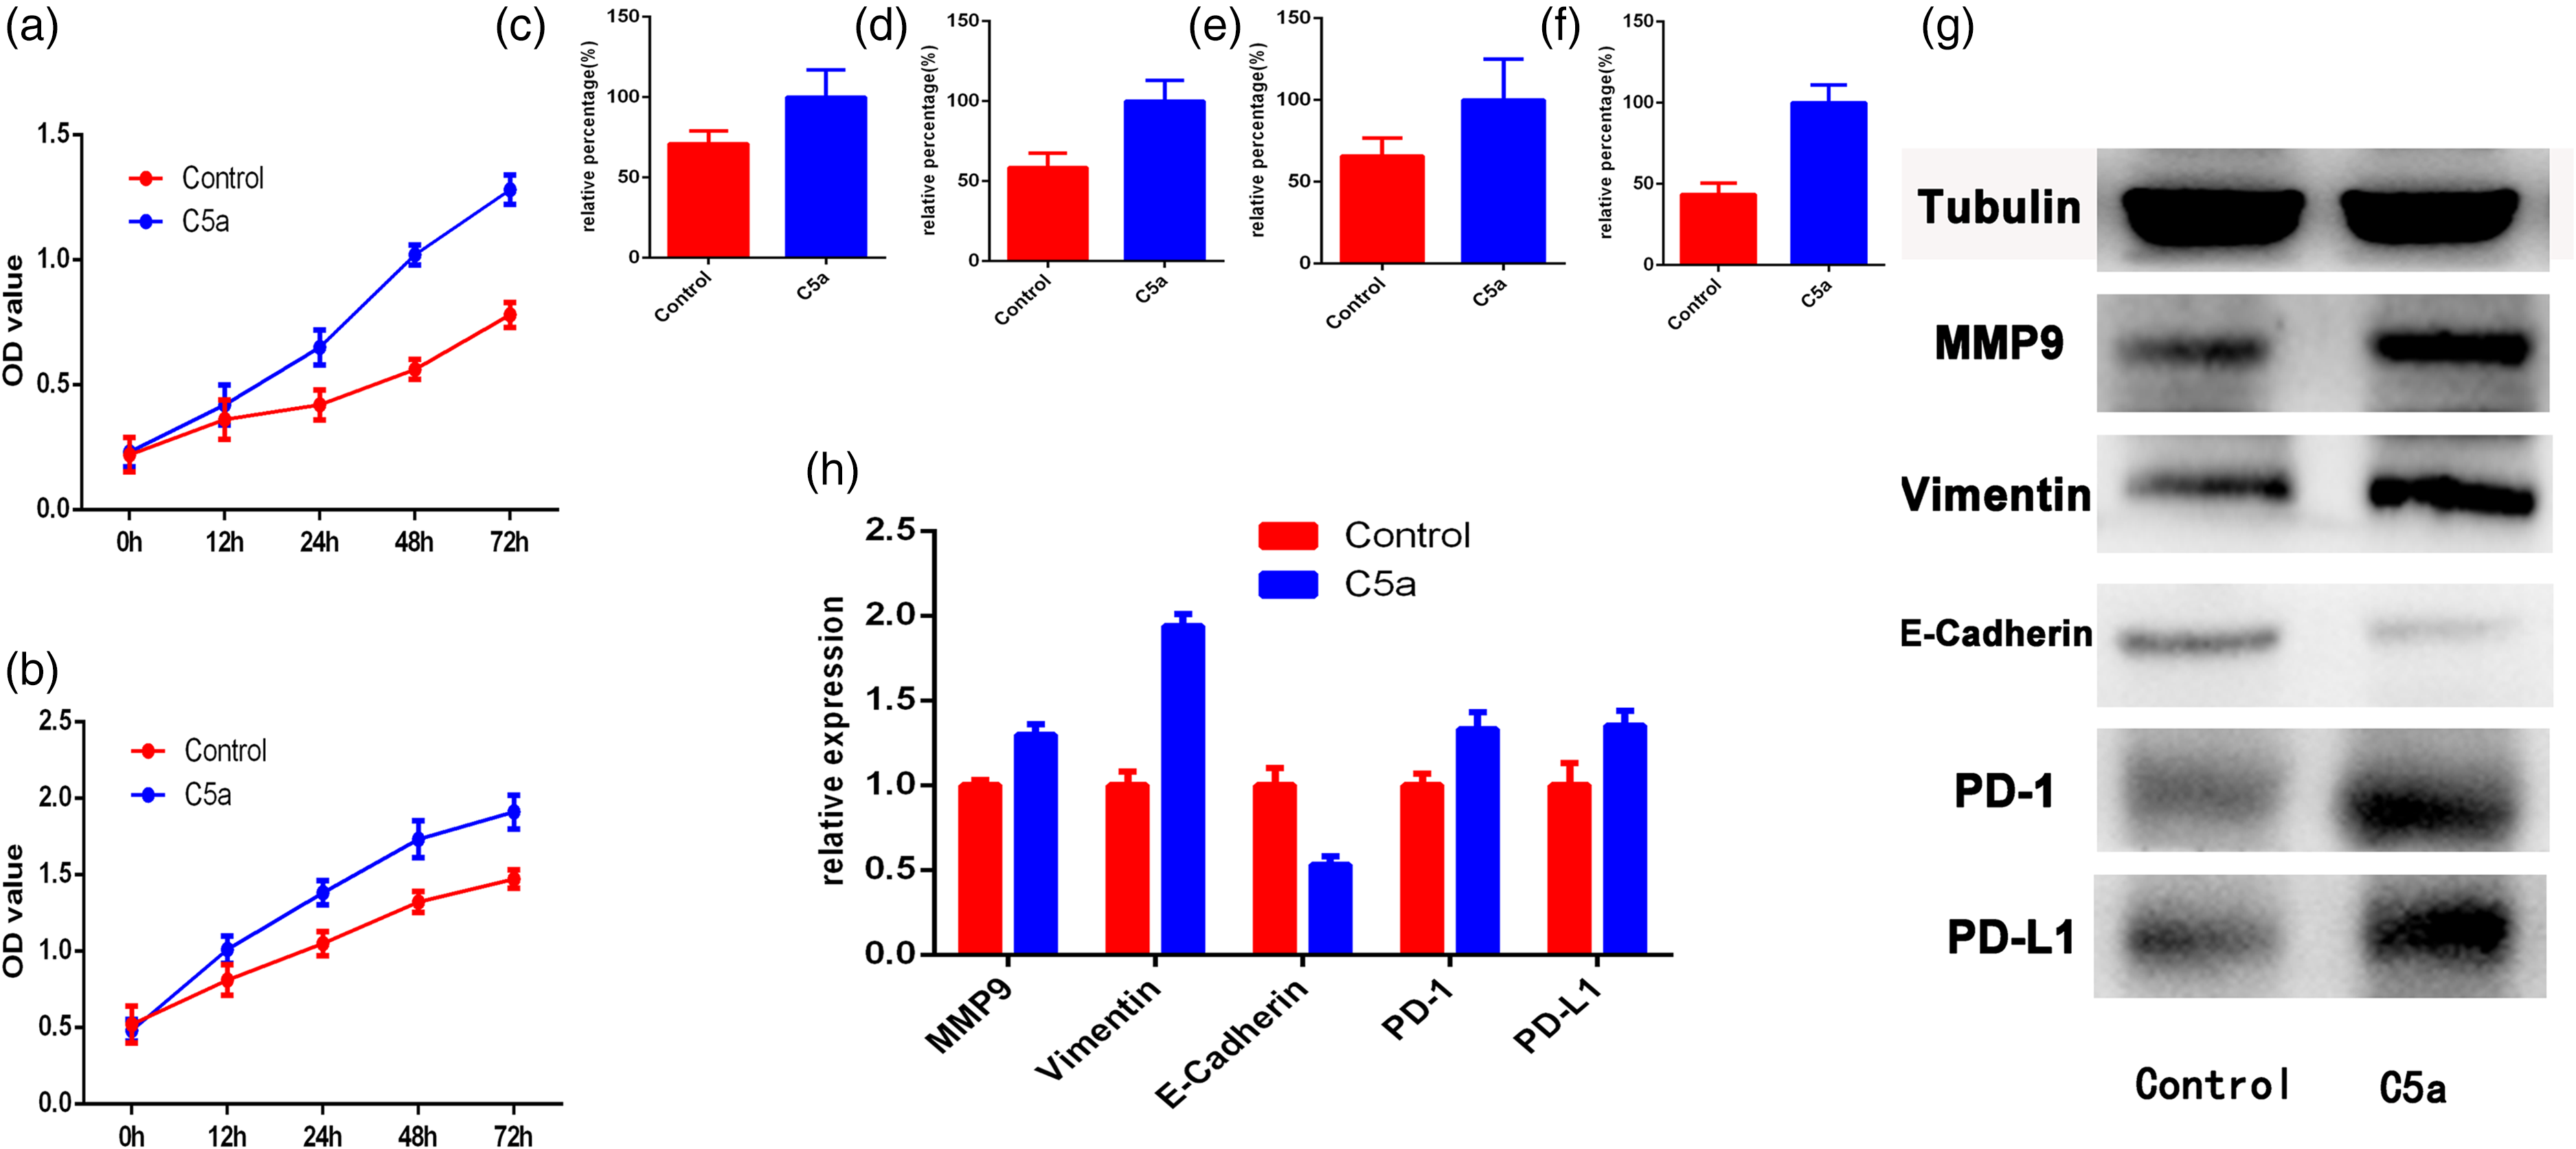
C5a stimulation promotes proliferation, migration, invasion, EMT, and PD-1/PD-L1 expression in RCC cells. Proliferation curve of 786-O (a) and 769-P (b) cells after C5a stimulation. Histogram for migration and invasion of 786-O (c) and (d) and 769-P (e) and (f) cells after C5a stimulation. Representative western blotting (g) and histogram (h) of EMT related proteins and PD-1/PD-L1 expression in 786-O cell after C5a stimulation.
C5a promotes epithelial-mesenchymal transition and PD-1/PD-L1 expression in RCC cells
We also evaluated the expression levels of epithelial-mesenchymal transition (EMT)-related proteins, as well as the expression levels of the immune checkpoint proteins PD-1/PD-L1, in 786-O cells treated with exogenous C5a. We observed that the PD-L1, PD-1, vimentin, and MMP9 expression levels were significantly up-regulated, whereas the E-cadherin expression levels were significantly down-regulated in response to stimulation with exogenous C5a (Figure 2(g) and (h)).
C5 knock-down reduces migration and invasion ability, EMT, and PD-1/PD-L1 expression in RCC cells
The migration and invasion abilities of renal cancer cell lines after knock-down of C5 were evaluated. Migration and invasion experiments in transwell chambers clearly showed that renal cancer cells with C5 knockdown had decreased migration and invasion potential (Figure 3(a) to (d)). Western blotting was performed to detect the expression levels of EMT-related proteins and immune checkpoint proteins PD-1/PD-L1 in 786-O renal cancer cells following C5 knockdown. Compared with the control shRNA cells, the expression of PD-L1, PD-1, vimentin, and MMP9 was significantly down-regulated in 786-O C5 shRNA cells, whereas the expression of E-cadherin was significantly up-regulated (Figure 3(e) and (f)).
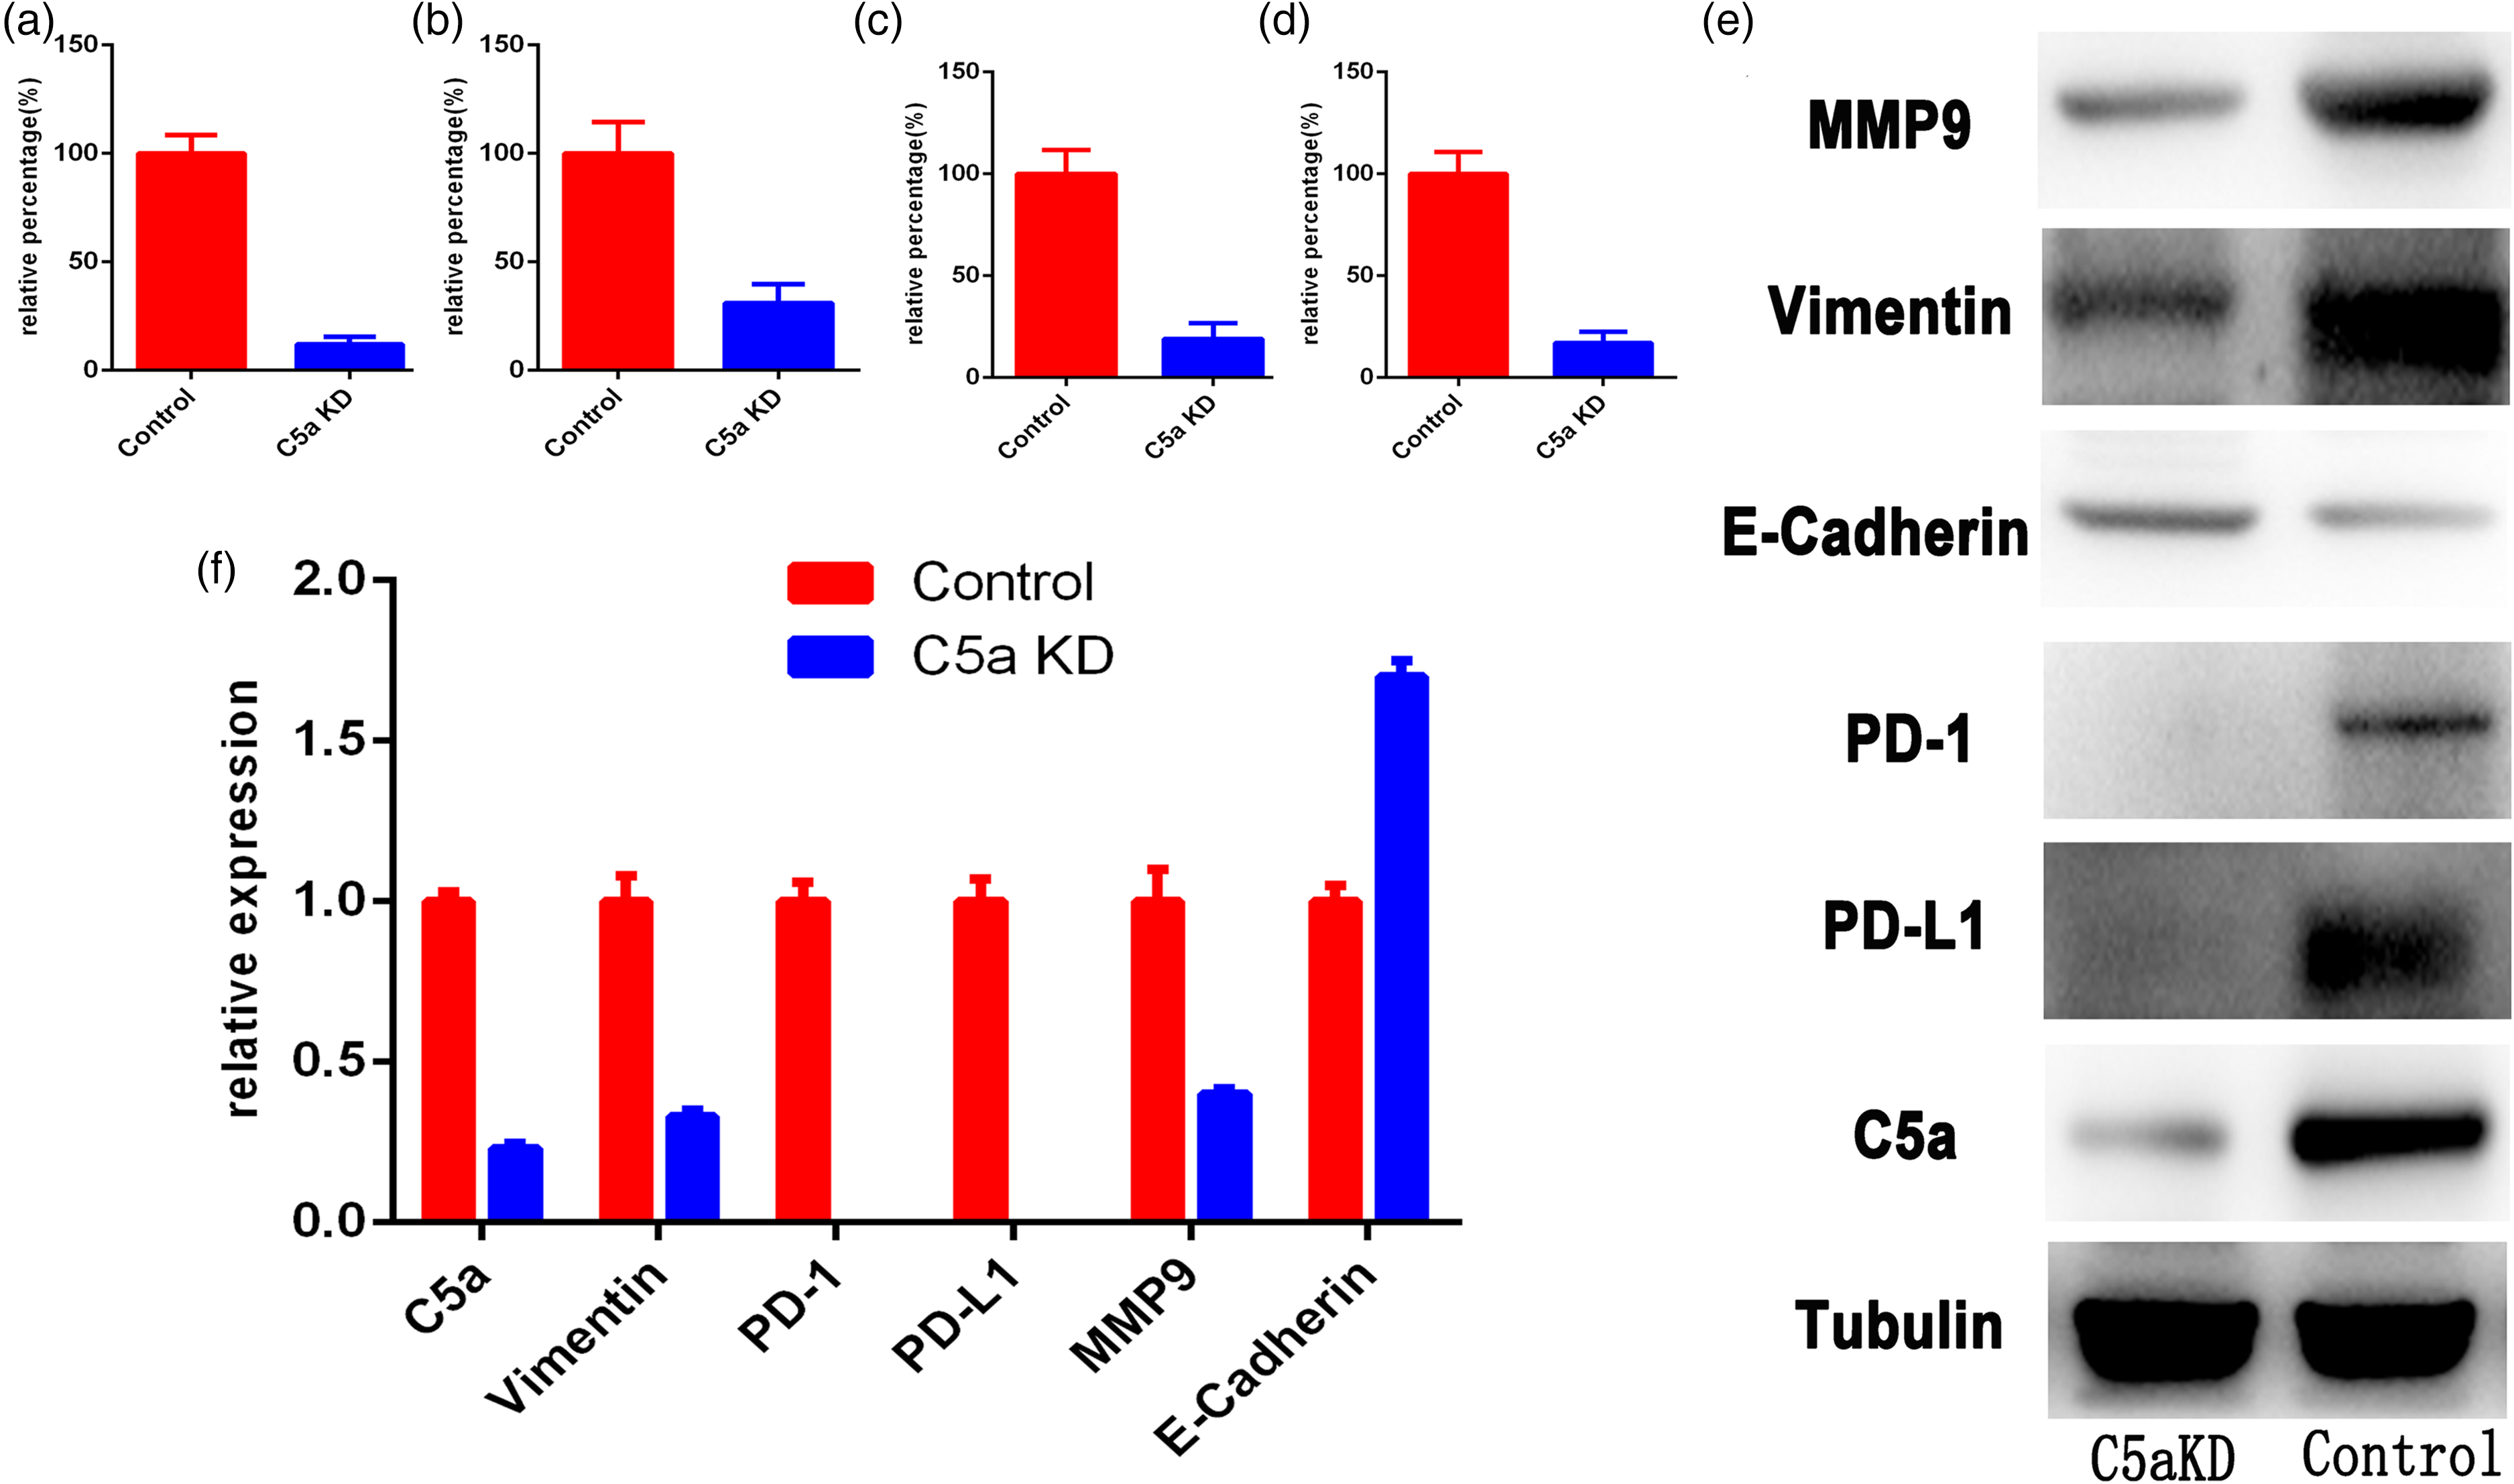
C5a knock-down inhibits proliferation, migration, invasion, EMT, and PD-1/PD-L1 expression in RCC cells. Changes in migration and invasion of 786-O (a) and (b) and 769-P (c) and (d) cells after C5a knockdown. Representative western blotting (e) and histogram (f) of EMT related proteins and PD-1/PD-L1 expression in 786-O cell after C5a knockdown.
C5a expression correlates with proliferation, EMT, and PD-1/PD-L1 expression in patients with mRCC
Samples from patients with mRCC were divided into C5a low and high groups based on the C5a immunohistochemical staining H-score. Immunohistochemical staining of E-cadherin, vimentin, MMP9, Ki-67, tPD-L1, sPD-L1, and PD-1 was performed, and the respective H-scores were compared between the C5a low and high groups. C5a expression was positively correlated with the expression of vimentin, MMP9, Ki-67, tPD-L1, sPD-L1, and PD-1, and negatively correlated with the expression of E-cadherin (Figure 4). These observations further indicate that C5a promotes EMT, proliferation, and PD-1/PD-L1 expression in mRCC.
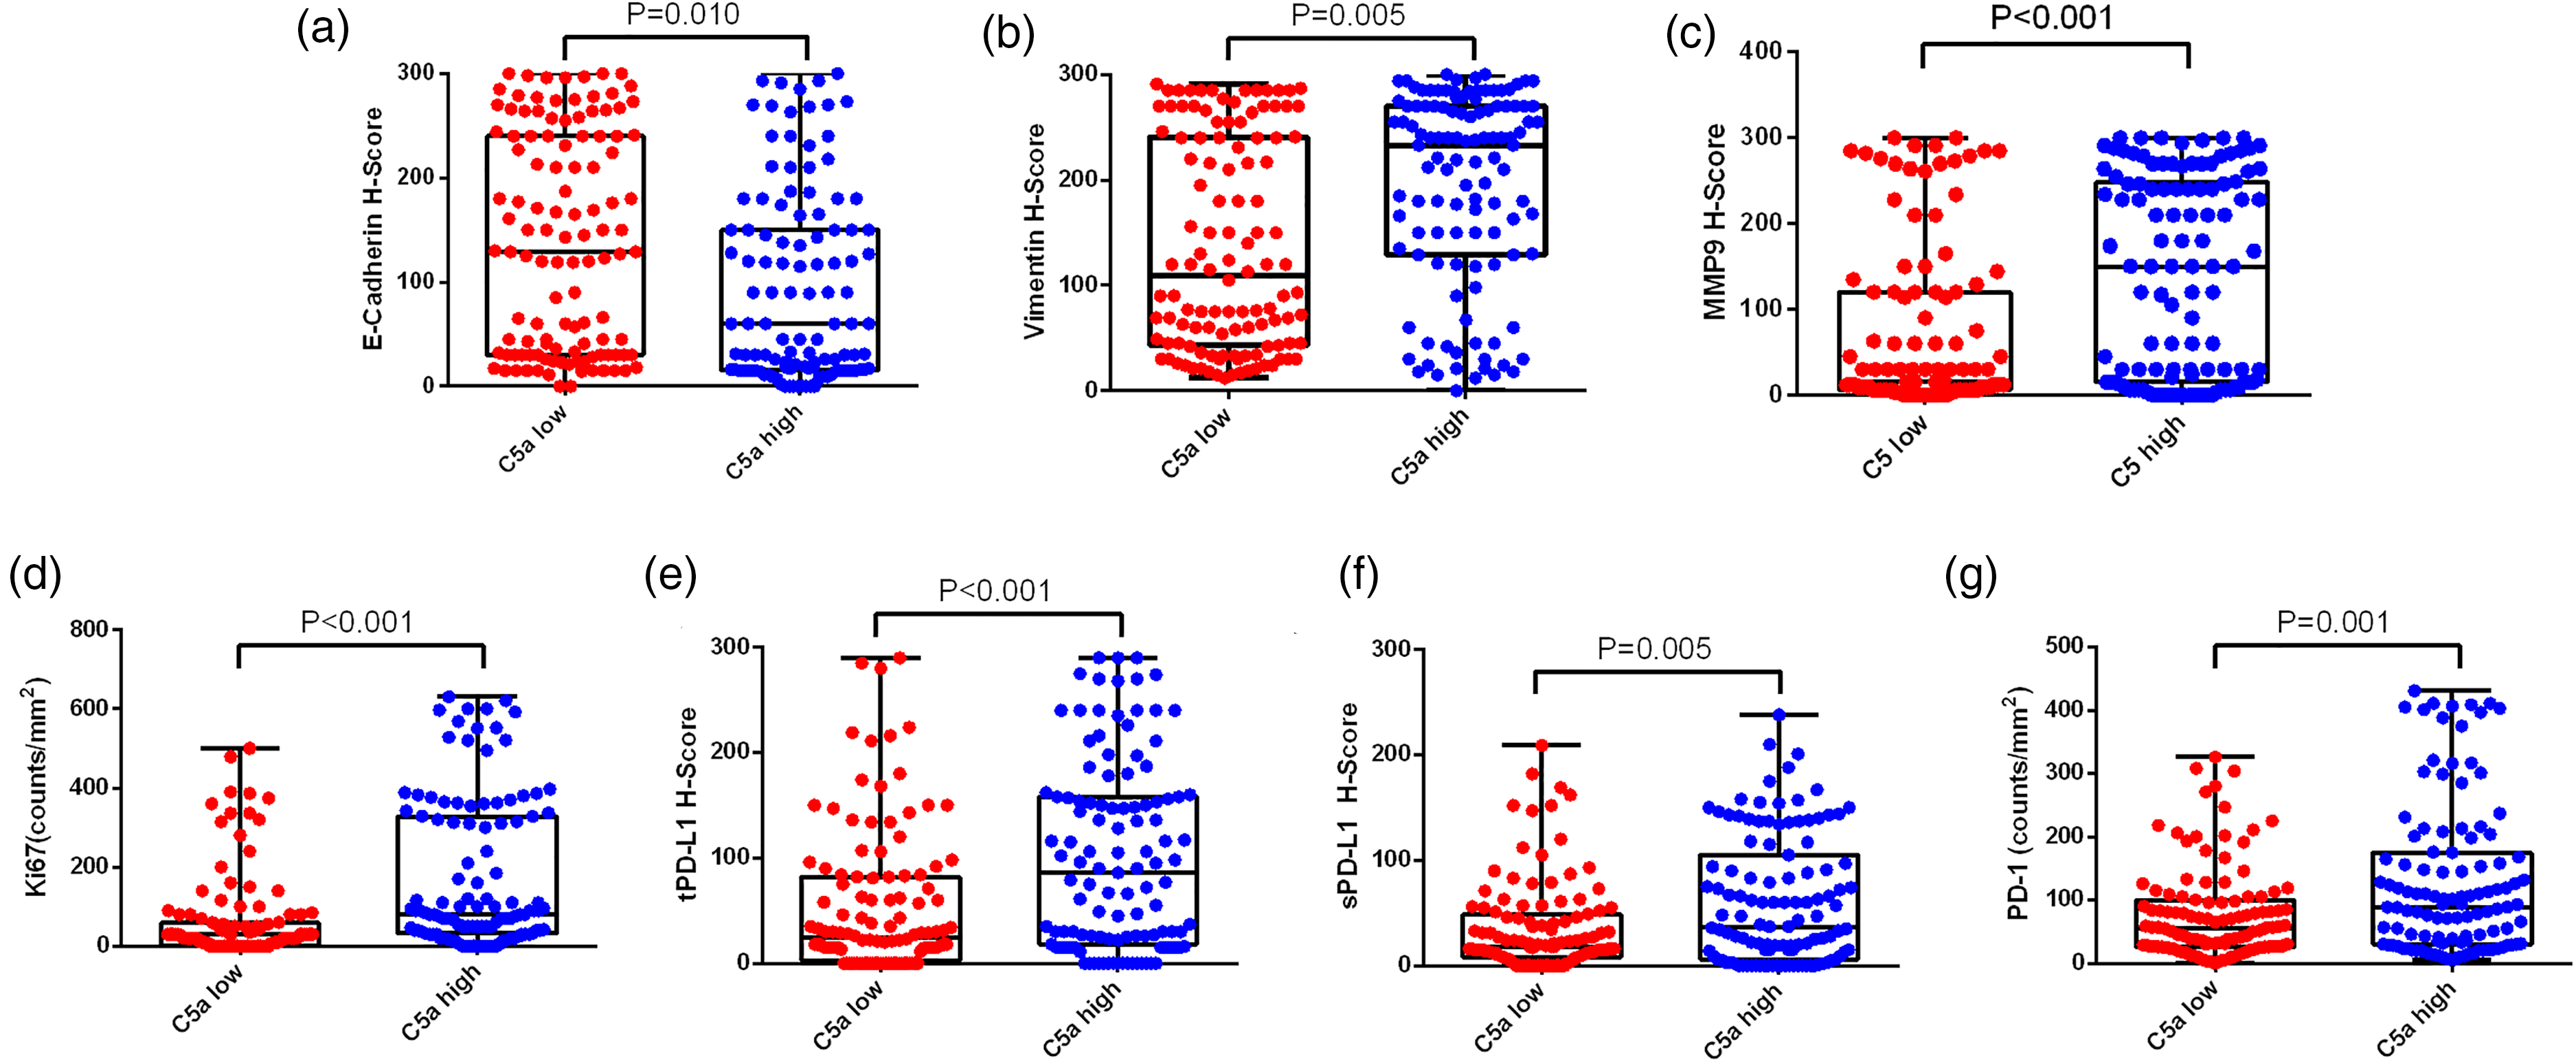
Association of C5a expression and EMT, proliferation-related proteins, and PD-1/PD-L1. E-cadherin (a), vimentin (b), MMP9 (c), Ki-67(d), tPD-L1(e), sPD-L1(f), and PD-1(g) expression levels in the C5a-low and C5a-high groups.
Discussion
Based on the results of the KEYNOTE-426 study, the US Food and Drug Administration (FDA) approved the PD-1 antibody pembrolizumab (Keytruda) combination with axitinib (Inlyta) as first-line treatment against mRCC. 21 This was the first approved combination therapy involving a PD-1 antibody and a TKI, officially opening a new era in the treatment of mRCC. The FDA subsequently approved additional PD-1 and TKI combination therapies as first-line treatments against mRCC. 22 These regimens are associated with superior therapeutic response rates compared to the former TKI single-agent therapies. Therefore, combination treatments that reverse the immunosuppressive environment of mRCC are becoming increasingly important.
Typically, as a result of various genetic mutations, the complement system can attack tumor cells, as indicated by the complement deposition found in various tumors. However, cancer cells can resist these attacks. Yoneda et al. 23 demonstrated that the generation of anaphylatoxin C5a led to significant tumor progression in a mouse model of cervical cancer. This effect seemed to be mediated by the recruitment of myeloid-derived suppressor cells and the generation of an immunosuppressive tumor microenvironment. Complement is also linked to angiogenesis. The presence of C5a in patients with age-related macular degeneration is associated with the development of chronic neovascularization. C5a plays important roles in cytokine release and the chemotaxis of inflammatory cells. 24 In addition, C5a has been reported to regulate anti-tumor responses. Ajona et al. 14 demonstrated that C5a blockade substantially improved the efficacy of PD-1 antibodies in a mouse model of lung cancer. The mechanism underlying this observation was related to the optimized activation and expansion of CD8+ T cells and to the reversal of the immunosuppressive tumor microenvironment. Zha et al. 25 also demonstrated that the combined blockade of the C5a/C5aR signaling axis greatly enhanced the anti-tumor efficacy of PD-1/PD-L1 antibodies in a mouse model of melanoma. In addition, Cai et al. 26 showed that C5a enhanced the proliferation of human nasopharyngeal carcinoma cells in vitro. Chen et al. 27 confirmed that C5aR knock-down significantly inhibited the proliferation and invasion of hepatocellular carcinoma cells. Interestingly, down-regulation of C5aR was also associated with a significant decrease in Ki-67 expression and EMT inhibition. EMT frequently occurs during the initial steps associated with tumor invasion and is an important step in the development of tumor metastasis.
In our study, mRCC patients with high expression of C5a exhibited poor TKI therapeutic responses and shorter OS and PFS. Multivariate analysis identified C5a expression as an independent prognostic factor for mRCC patient outcomes. Additionally, C5a expression was closely associated with the expression of EMT-related proteins and that of the immune checkpoint proteins PD-1/PD-L1. Functional in vitro experiments revealed that C5a-mediated modulation can impact the migration and invasion ability of RCC cells, and can influence the expression of E-cadherin, vimentin, MMP9, PD-L1, and PD-1. In summary, activation of C5a signaling promoted the invasion and migration of RCC cells, specifically through enhancement of EMT and PD-1/PD-L1 expression. Based on the results of our study and previous observations in other cancer types, we believe that C5a promotes tumor cell proliferation and invasion and contributes to an immunosuppressive tumor environment, thereby leading to poor TKI therapeutic responses and poor clinical outcomes.
Our study has several limitations that need to be acknowledged. First, a single-center retrospective cohort may not be representative of all mRCC patients. Second, during the recruitment period of this study, immune checkpoint inhibitors were not approved for mRCC treatment in China; thus, our patient cohort received first-line TKI therapy and not the currently recommended TKI plus immune checkpoint inhibitor combination treatment. Moreover, only sunitinib and sorafenib were used due to limited availability of other drugs in China during the study period. Thus, no patients were treated with pazopanib or cabozantinib, so our conclusions should be interpreted with caution. We used 786-O and 769-P renal cancer cell lines in the cell experiment, and the generalizability of our results must be validated by investigating other cell lines as well. Finally, although we confirmed that in vitro modulation of C5a achieved tumor suppressive effects in RCC, appropriate in vivo experiments and clinical trials are needed to further confirm the efficacy of C5a-targeted therapy.
Although further investigation is required, our data indicate that C5a may be an attractive therapeutic target for mRCC treatment. Importantly, the association of C5a expression with poor outcomes in patients with diverse cancer types suggests that anti-C5a targeted therapy may be useful not only in mRCC but also in a broad range of cancers. Therefore, C5a/C5aR targeted therapy may be suitable for a variety of cancers, particularly in combination with immune checkpoint inhibitors.
Conclusions
C5a expression is associated with poor clinical outcomes in patients with mRCC receiving TKI treatment. C5a expression promotes EMT and PD-1/PD-L1 expression in RCC cells and may contribute to poor prognosis. The results of our study provide the basis for the future development of C5a-related drugs in mRCC treatment.
Supplemental Material
sj-doc-1-jbm-10.1177_03936155231161366 - Supplemental material for Overexpression of complement C5a indicates poor survival and therapeutic response in metastatic renal cell carcinoma
Supplemental material, sj-doc-1-jbm-10.1177_03936155231161366 for Overexpression of complement C5a indicates poor survival and therapeutic response in metastatic renal cell carcinoma by Changjun Yang, Faying Yang, Xiang Chen, Yunpeng Li, Xiaoyi Hu, Jianming Guo and Jiaxi Yao in The International Journal of Biological Markers
Footnotes
Author contributions
Changjun Yang and Faying Yang contributed to the drafting of the manuscript and critical revisions of the intellectual content; Xiang Chen and Yunpeng Li contributed substantially to the conceptualization and design of the study, Xiaoyi Hu collected clinical information and assisted with drafting the manuscript; Jianming Guo and Jiaxi Yao approved the final version of the manuscript for publication and performed critical revisions of the intellectual content. All authors read and approved the final manuscript. Changjun Yang, Faying Yang, and Xiang Chen contributed equally to this work.
Declaration of conflicting interests
The author(s) declared no potential conflicts of interest with respect to the research, authorship, and/or publication of this article.
Funding
The author(s) disclosed receipt of the following financial support for the research, authorship, and/or publication of this article: This study was funded by grants from the Gansu Province Science and Technology Planning Project (20JR10RG310) and the Higher education innovation development fund of Gansu Province (2020B-200).
Ethical statement
The study was approved by the Clinical Research Ethics Committee of Zhongshan Hospital, Fudan University (approval number B2016-161R). Our study followed the Declaration of Helsinki.
Informed consent
Written informed consent was obtained from each patient.
Data availability statement
The datasets analyzed during the current study are available from the corresponding author upon reasonable request.
Supplemental material
Supplemental material for this article is available online.
References
Supplementary Material
Please find the following supplemental material available below.
For Open Access articles published under a Creative Commons License, all supplemental material carries the same license as the article it is associated with.
For non-Open Access articles published, all supplemental material carries a non-exclusive license, and permission requests for re-use of supplemental material or any part of supplemental material shall be sent directly to the copyright owner as specified in the copyright notice associated with the article.