
Abstract
Purpose
The overuse of laboratory tests contributes to impair health systems effectiveness, tumor markers (TMs) being a paradigmatic example. In the present study we applied indicators of TMs appropriateness developed from administrative datasets to appraise regionwide overordering in the clinical practice.
Patients and methods
TMs ordered to outpatients in the Veneto Region over 6 years were obtained from the eletronic Outpatients’ Records of Diagnostic and Therapeutic Procedures. TMs orders were examined as aggregated data or stratified according to disease codes, gender, age, and requests per patient. TMs recommended only for specific malignancies were examined using epidemiological data obtained from Veneto Tumor Registry.
Results
A total of 5,821,251 TMs were ordered in 4,382,159 patients over 6 years. Overall, 3,252,389 (55.9%) TMs were ordered without appropriate disease codes (ranging from 77.0% for PSA to 17.5% for CA15.3). TM orders declined over 6 years (−13.4%), with a noticeable reduction of orders without appropriate disease codes (−21.3%). Orders decreased sharply from 2015 to 2016, after the enactment of a national Decree-Law aimed at improving appropriateness, and remained stable thereafter. However, the rate of inappropriate TMs requests still remained elevated (44.4%) in the last year of observation, with orders of TMs being much higher than expected on the basis of prevalence and incidence figures of specific malignancies.
Conclusions
Indicators developed from administrative datasets were effective in assessing the overordering of TMs and the impact of interventions to improve appropriateness. The developed indicators could be considered for other diagnostic tests.
Introduction
Laboratory tests have a central role in a multiplicity of clinical issues and are frequently the first step in the diagnostic workup. Minimal invasiveness and the relatively low individual cost of most laboratory tests encouraged the spread of their use. However, these positive points also contributed to increase their inappropriate prescription.1–4 Although laboratory tests are only a minimal portion of the global health care expenditure, they may activate a cascade of additional diagnostic procedures.4–6 Tumor markers (TMs) are a paradigmatic example since they are frequently ordered in general practice,7,8 in disagreement with the recommendations of available clinical practice guidelines (CPGs).9–11 The risk of labeling healthy people as sick due to a false positive TM result is much higher in outpatients, as the prevalence of cancer is generally low in the unselected general population. A multiplicity of approaches aimed at improving the appropriateness of laboratory tests have been developed, leading to mixed results.5,12–14 In 2015, the Italian Ministry of Health released a Decree-Law regarding “Conditions of reimbursement and the indications of prescriptive appropriateness to outpatients under the National Health Service.” 15 This health-policy intervention states that reimbursement for tests classified as inappropriate is limited, or requires additional input from the physician to be covered. Typically, any intervention to improve appropriateness should be associated with indicators to monitor its impact.16–18 The absence of clinical information on test orders to outpatients for several laboratory tests is a limitation to the development of indicators, 19 and impedes a direct comparison between the requested test and the clinical problem. In a previous study we developed prototype performance indicators using relevant information gathered from electronic health records (EHRs), which integrate data captured by health information technology infrastructures for administrative purposes. The capability of the indicators to detect the inappropriateness of TMs ordering was first assessed in the outpatient setting of a local health authority. 20 In the present study we tested the relevance, reliability, actionability, and validity based assumptions 21 of previously developed indicators, 20 by monitoring through EHRs TMs ordered to the whole population of the Veneto Region over 6 years. The considered period covered 2 years before and 3 years after the enactment of the ministerial Decree-Law, in order to test if indicators were effective in detecting any impact of the intervention on the appropriateness of TM orders.
Materials and methods
CEA, AFP, CA-125, CA15.3, CA19.9, and PSA ordered to outpatients from January 1, 2013 to December 31, 2018 were included in the study. The geographic area investigated is the Veneto Region, which accounts for a resident population of 4,905,000 inhabitants in 2018. The study was designed, and results are reported, according to the GATHER statement. 22
Sources of data
The examined EHRs were the Veneto Tumor Registry, and the Outpatients’ Records of Diagnostic and Therapeutic Procedures reimbursed by the National Health Service (ORDTP) of the Veneto Region. The ORDTP contains codes of all diagnostic procedures and therapeutic interventions ordered to outpatients within the framework of the Italian National Health Service.
Data mining and extraction
Codified data were extracted from the ORDTP by an authorized data-controller person (LL), and managed in conformity with specific Italian law regarding EHR use in biomedical research. Demographic data and billing information (user charge) were examined. Exemption of a user charge for diagnostic or therapeutic procedures takes into account different criteria, including income and health status. Patients with appropriate disease code are exempt from a charge even if they have high income. Outpatient order forms registered in ORDTP report exemption codes, thus allowing for categorization of orders according to patient's health status. Individual health information was never revealed because all data were used in aggregate form only. TM orders were examined as both aggregated data, and stratified according to disease codes, gender (females, males), arbitrary intervals of age (<30 year (yr.), 31–79, ≥80 yr.), and number of requests of a single TM per patient during every year of study (1 order/patient/yr., 2 orders/patient/yr., and ≥3 orders/patient/yr.). Disease codes concerning clinical conditions that can be appropriately associated with the request of specific TMs are provided in Supplementary Table S1. Disease codes were also searched for orders in which other codes of exemption from user charges payment (i.e., low income) were registered. Orders were divided into two groups: (a) those associated with codes of cancer or diseases in which TMs may be considered, thereafter reported as “with appropriate disease code”; and (b) those with any remaining type of order (no exemption, and exemption for any other cause), thereafter reported as “without appropriate disease code”.
TM orders vs. epidemiological data
AFP, CA-125, CA15.3, CA19.9, and PSA are recommended by CPGs for specific malignancies only, and their use in other diseases should be considered inappropriate.9,10 These TMs were examined with reference to prevalent and incident cases of liver (AFP), ovarian or endometrial (CA-125), breast (CA15.3), pancreatic or biliary tract (CA19.9), and prostate (PSA) malignancies.23, 24 Incidence is the proportion of the new cases (number of the people with the disease) occurring in a specified population during a year. The numerator is the number of new cases; the denominator is the size of the population. Prevalence is the proportion of people with the disease at a particular timepoint. The numerator is the number of cases in the population at January 1 of a given year; the denominator is the total population at the same timepoint.
Performance indicators
Previously developed indicators 20 were assessed on a region-wide scale taking into consideration their relevance, reliability, actionability, and validity-based assumptions, as suggested by the Health Care Quality Indicators (HCQI) project (OECD). 21 The consistence of TM orders with recommendations of CPGs was based on a synopsis of available CPGs.9,10 Suitable indicators for regular use were selected, and desired minimum standards proposed.
Statistical analysis
Numbers and percentages of ordered TMs are presented with reference to either the number of patients within each observation year and in the whole observation period of 6 years. The linear trend of the different TMs ordered across the years of study was assessed through a simple linear regression model with TMs ordered as outcome and year as a covariate. A P-value <0.05 was considered statistically significant.
Ethics
The study was carried out in accordance with the principles established in the Declaration of Helsinki and was approved by the Ethics Committee of the Province of Venice (registration number 233A/CESC), which is the committee of reference for the local health authority Azienda ULSS3 Serenissima, responsible for the organization and managment of the study. This observational retrospective study was based on cases routinely collected by the Cancer Registry of the Veneto Region, which is authorized to use health-related data for research purposes by the Italian Guarantor for the Protection of Personal Data. The need for informed consent was waived, as its collection would have been impossible for organizational reasons. All data were anonymized following the Italian regulations and were handled in the aggregate form only.
Results
From January 1, 2013 to December 31, 2018 a total of 5,821,251 tests regarding the considered TMs were ordered for 4,382,159 patients (1.33 tests-per-patient). The number of patients with TM and ordered TMs by year and in total are reported in Table 1. During the 6 considered years, a decrease occurred in the number of both patients with TM (−13.6%) and requested TMs (−13.4%; P = 0.0158). All TMs showed a similar trend, with a number of orders significantly lower in 2018 than in 2013 (−19.4% for AFP, P = 0.0066; −29.7% for CA-125, P = 0.0059; −15.2% for CA15.3, P = 0.0093; −24.8% for CA19.9, P = 0.0145; −16.7% for CEA, P = 0.0102); PSA showed a smaller and no significant decrease (−4.5%, P = 0.0686). The number of tests-per-patient did not show significant differences (data not shown). Year-to-year percentage variations of patients with TM and ordered TMs are presented in Supplementary Table S2.
Number of patients with tumor marker, and ordered tumor markers in every year of the study and in total.
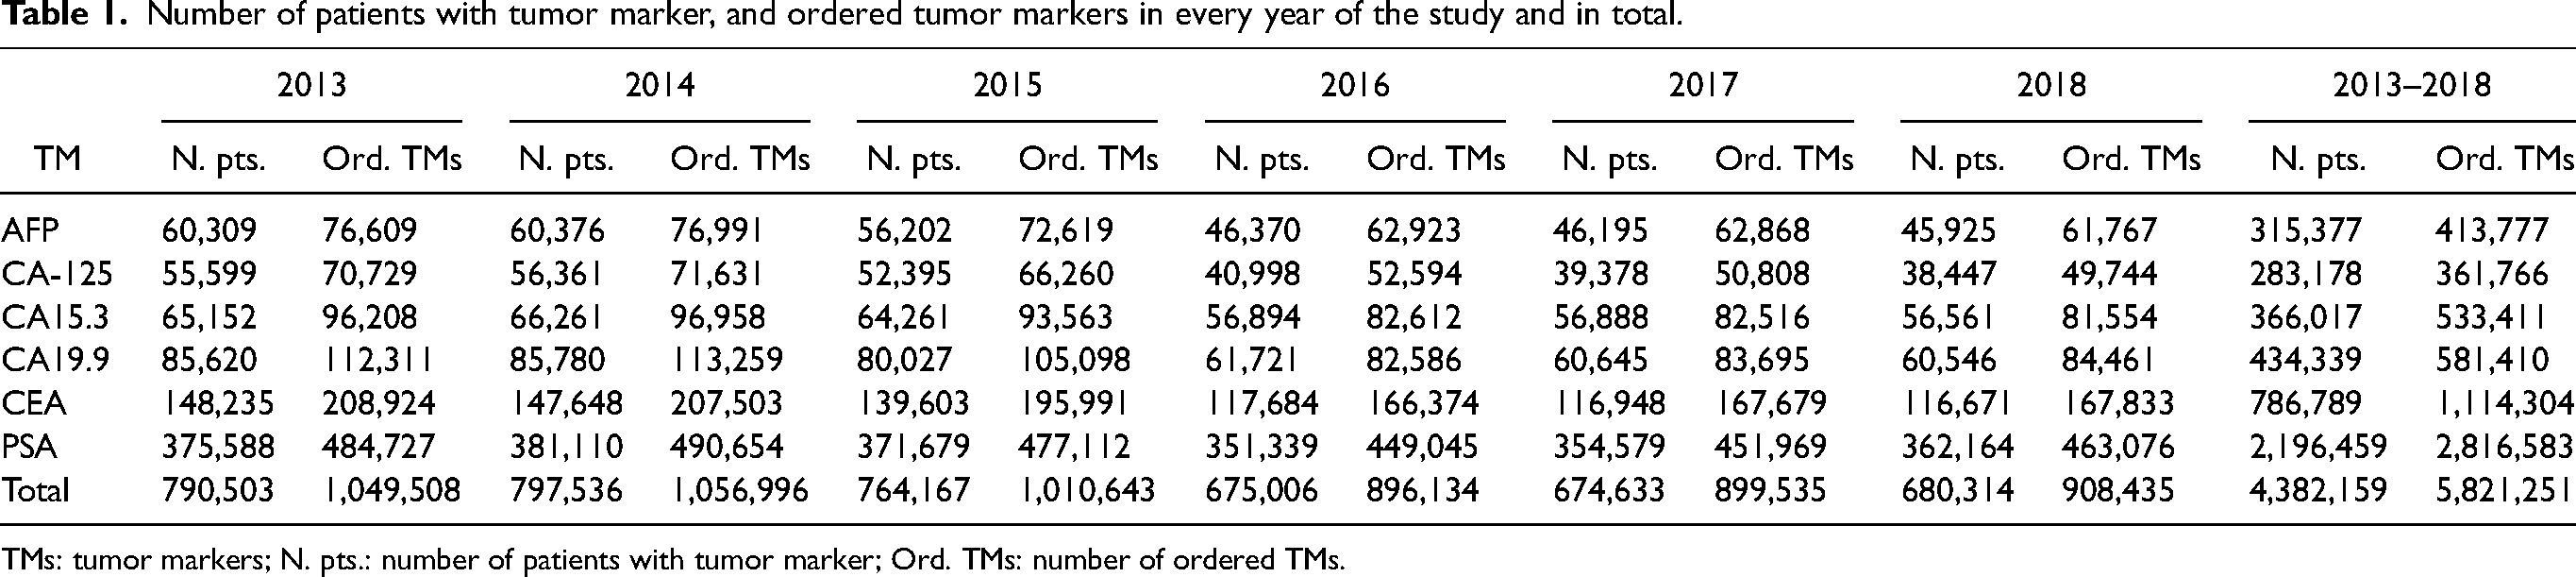
TMs: tumor markers; N. pts.: number of patients with tumor marker; Ord. TMs: number of ordered TMs.
The number of ordered TMs both in total and separated by the presence or absence of an appropriate disease code per year are presented in Supplementary Table S3. Overall, 3,252,389 (55.9%) TMs were ordered without an appropriate disease code. The occurrence of orders without appropriate disease code was different for different TMs (17.5% for CA15.3; 31.2% for CEA; 44.8% for CA19.9; 48.3% for AFP; 50.1% for CA-125; 77.0% for PSA).Orders registered with appropriate disease codes other than cancer were too few (<0.01% of the total) to allow for a dedicated evaluation.
The decrease of ordered TMs did not occur progressively, but orders declined sharply from 2015 to 2016 and remained quite stable thereafter. Year-to-year variations of orders examined both in total and separately by the presence or absence of an appropriate disease code were calculated as a percentage of TMs ordered in 2013. Results are shown in Figure 1. The decrease of orders without appropriate disease code was noticeable for all TMs (−21.9% in total, P = 0.0057; −39.7% for AFP, P = 0.0027; −43.4 for CA-125, P = 0.0048; −45.8% for CA15.3, P = 0.0080; −43.7% for CA19.9, P = 0.0058; −44.4% for CEA, P = 0.0054), except PSA, which showed a minor decrease (−8.8%, P = 0.0219). Conversely, number of orders with appropriate disease code showed a lower decrease (−12.8% for CA-125, P = 0.0148; −7.1% for CA15.3, P = 0.0127; −5.6% for CA19.9, P = 0.1364; −5.4% for CEA, P = 0.0546) or even an increase (5.4% for AFP, P = 0.0733 11.5% for PSA, P = 0.0065), suggesting that the total reduction of TM orders over the years was driven by a prevalent decrease of inappropriate ordering.
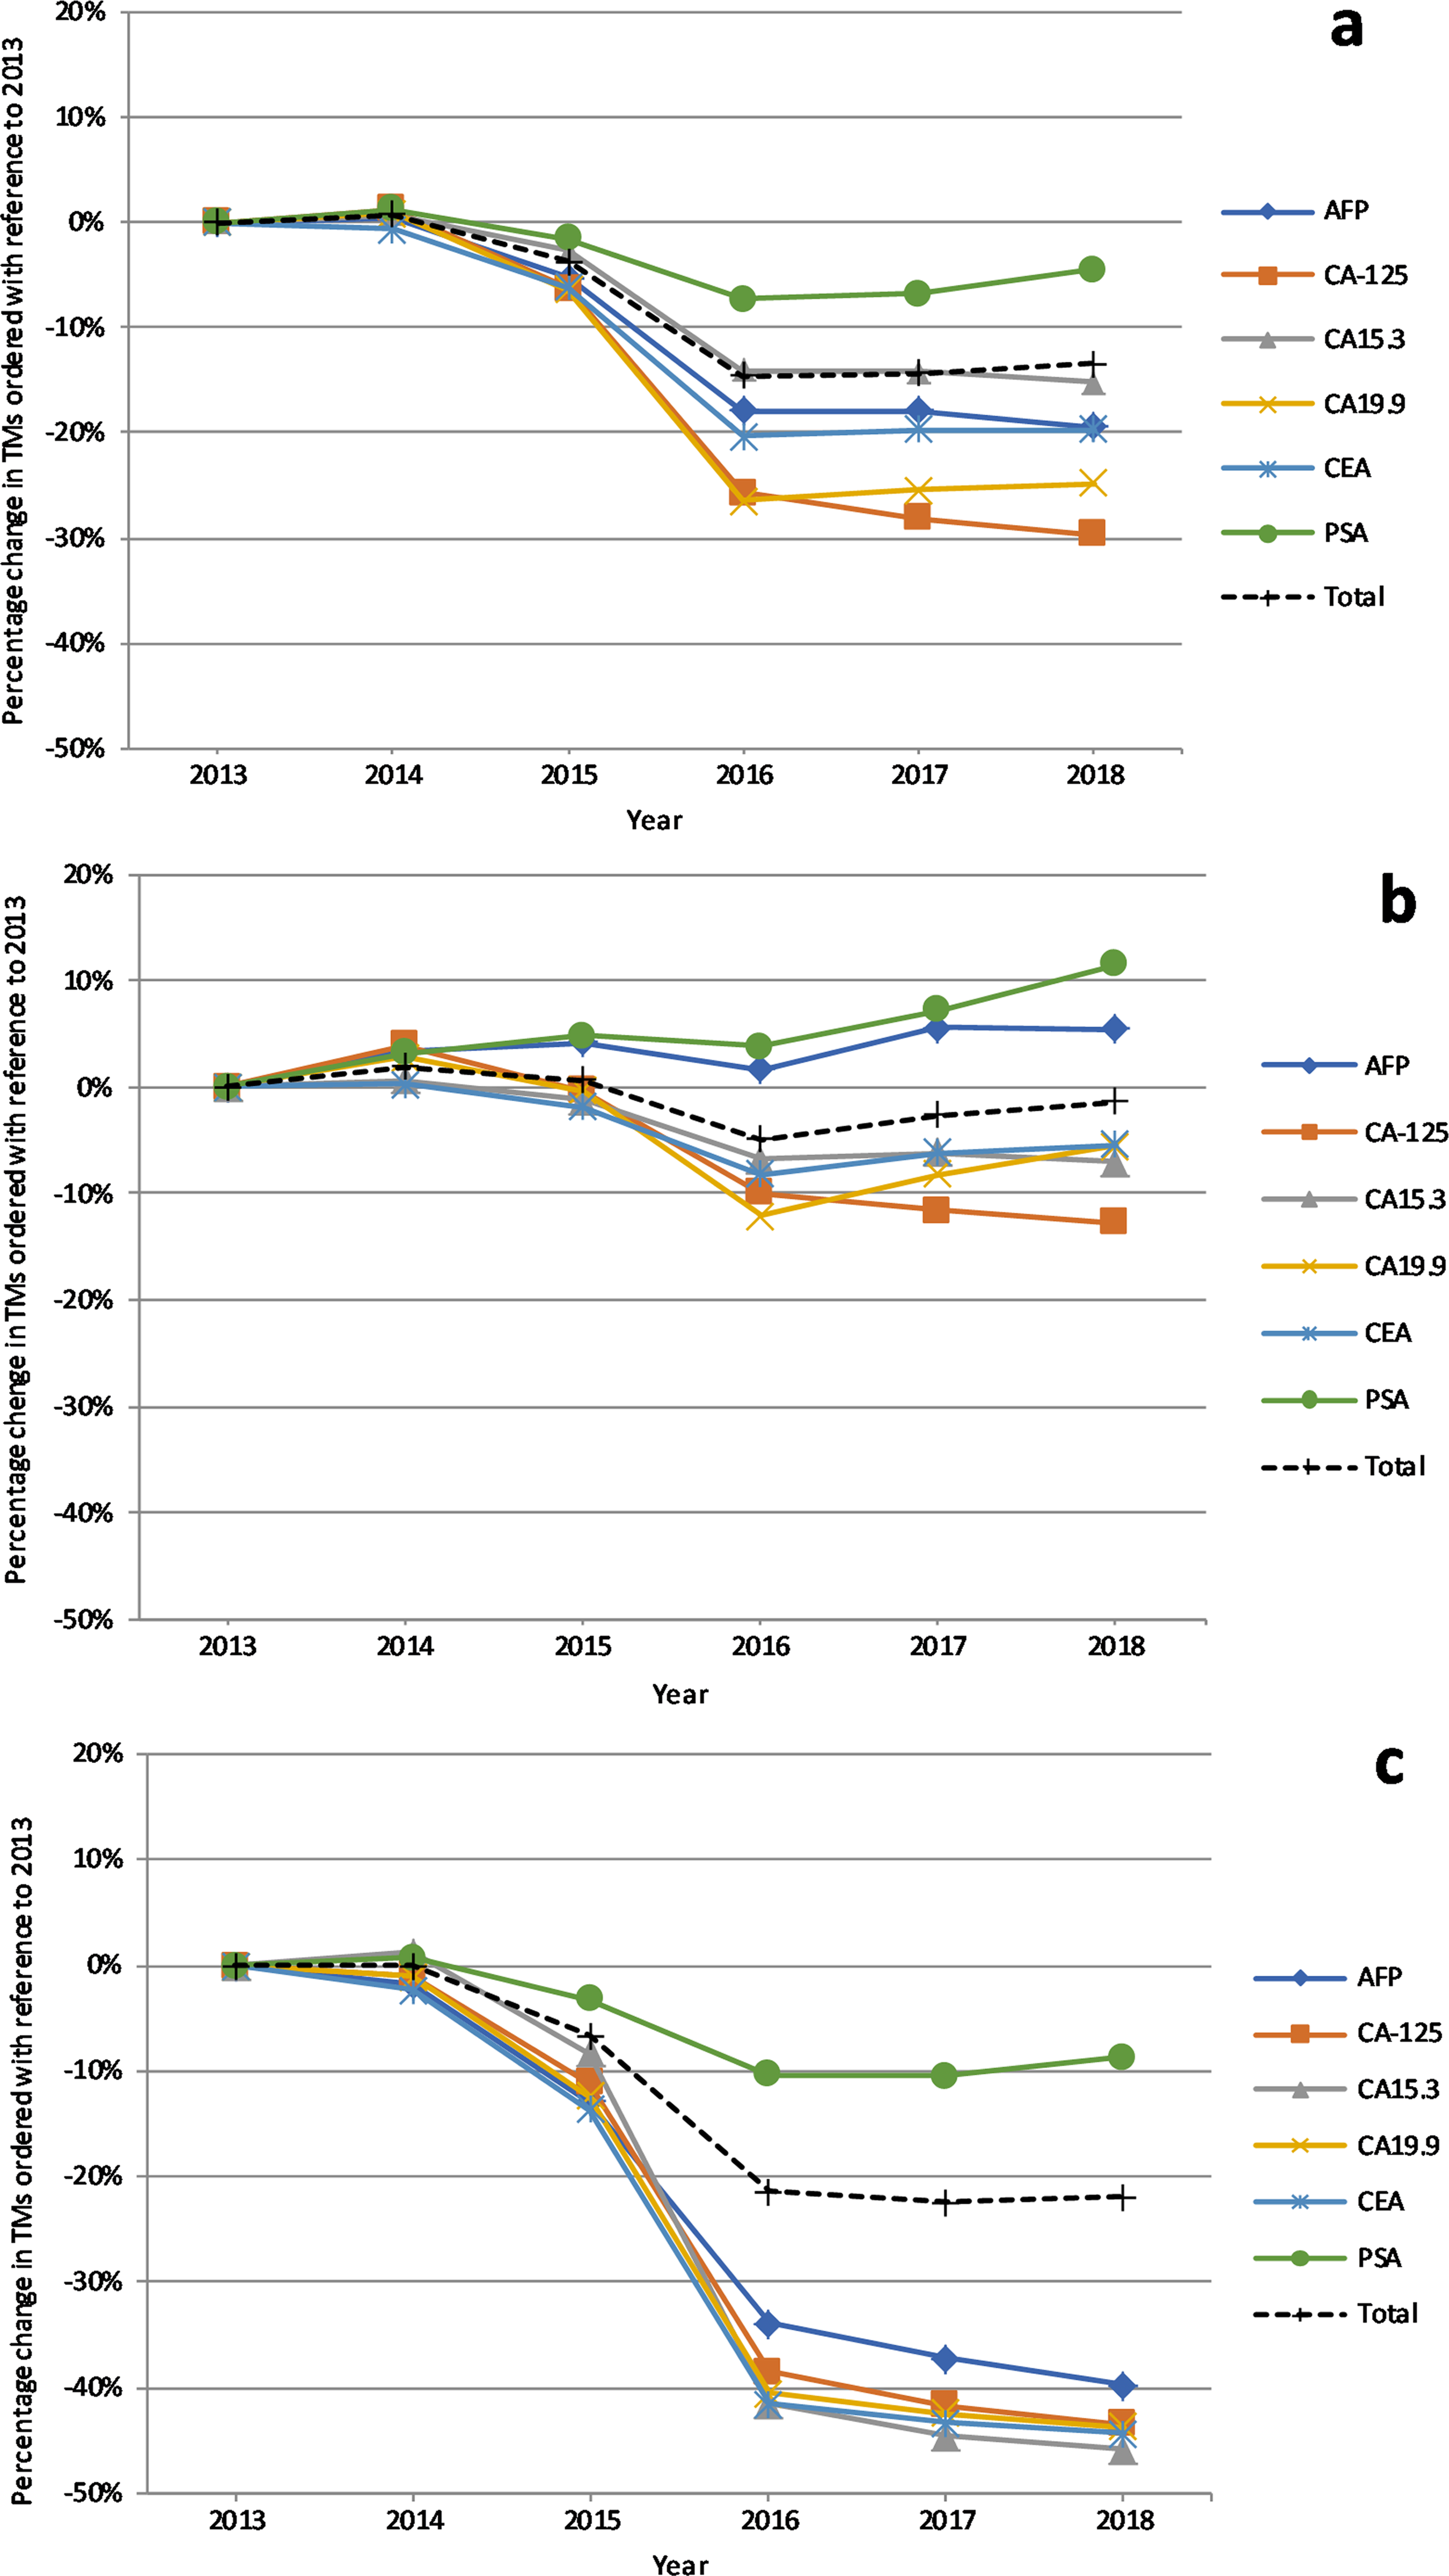
Percentage variations by year of ordered TMs: in total (a); with appropriate disease code (b); with inappropriate disease code (c). TMs: tumor markers.
TM orders in relation to disease code and orders/patient/yr.
In total, 3,441,569 of 4,382,159 patients (78.5%) received 1 order/patient/yr., 682,069 (15.6%) 2 orders/patient/yr. and 258,521 (5.9%) ≥3 orders/patient/yr. In terms of number of tests, the group with 1 order/patient/yr. accounted for 3,441,569 of 5,821,259 ordered TMs (59.1%); the group with 2 orders/patient/yr. for 1,364,138 (23.4%) of the total; and the group with ≥3 orders/patient/yr. for 1,015,543 (17.4%). The percentage of orders without an appropriate disease code was quite different in relation to the number of orders/patient/yr., being the lowest in the group with ≥3 orders/patient/yr. (Table 2).
Tumor marker orders without appropriate disease code according to the number of orders per patient per year.
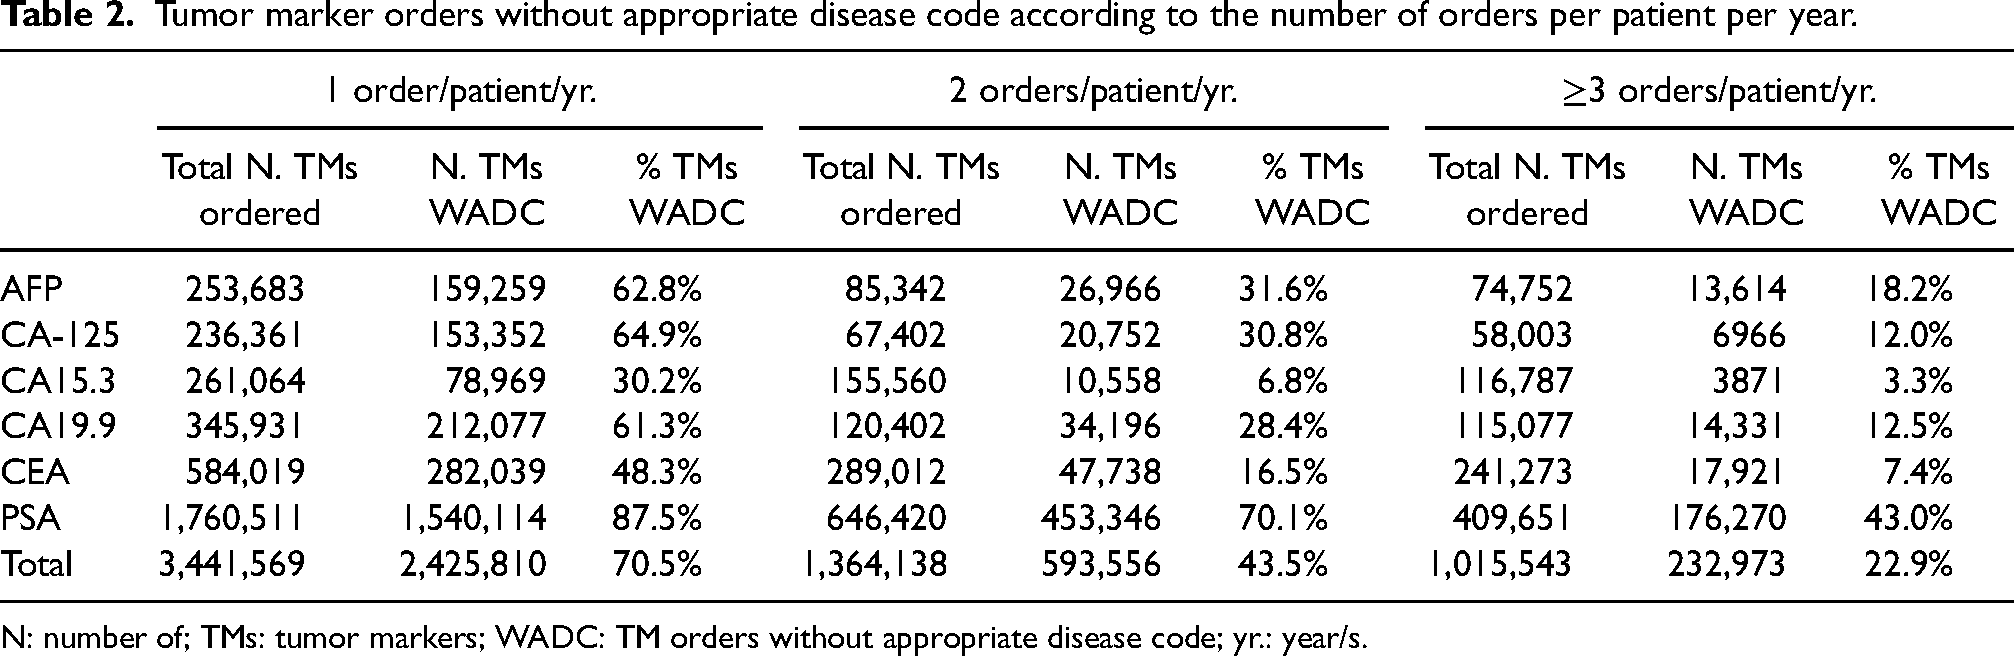
N: number of; TMs: tumor markers; WADC: TM orders without appropriate disease code; yr.: year/s.
Consistency of TM orders to gender
PSA orders in females were 1435, accounting for 0.05% of 2,815,555 ordered PSA over the 6 examined years. Conversely, 20,366 CA-125 and 20,318 CA15.3 were ordered in males, representing respectively 5.6% of all CA-125 and 3.8% of all CA15.3 ordered in the examined period. No noticeable year-to-year variations of ordered CA-125 in males occurred, while the percentage of CA15.3 in males decreased from 4.3% in 2013 to 3.1% in 2018.
TM orders in relation to age, disease code, and orders/patient/yr.
TM orders tend to increase with age, and variations over the years reflect those described in the total patient series. Orders in the <30 yr. group represent a marginal percentage (1.0%) of the total ordered TMs, and therefore they were not further examined. Conversely, 826,304 TMs ordered in subjects ≥80 yr. represent 14.4% of total. In the ≥80 yr. group, the percentage of TM orders without appropriate disease code were similar to those found in the total examined orders (Supplementary Table S4). For all TMs a decline occurred between 2015 and 2016, which tends to be more evident as the number of orders/patient/yr. increases. The rates of orders without appropriate disease code tend to remain elevated over the years in the subgroup with one order per yr. (Supplementary Figure S1).
Consistency of TM orders to epidemiological data
AFP, CA-125, CA15.3, CA19.9, and PSA ordered with and without appropriate disease code were compared, respectively, with the prevalence and the incidence of the specific malignancies in which they can be considered. The ratio between ordered TMs (numerator) and incident cases (denominator) (O/I ratio), and the ratio between ordered TMs (numerator) and prevalent cases (denominator) (O/P ratio), should provide an approximate assessment of the appropriate use of the marker. TMs with appropriate disease code were compared with prevalence of their target malignancies as they are expected to be used to monitor the disease course. On the other hand, TMs ordered without appropriate disease code were compared to the incidence rate of the target malignancies in the assumption that TMs might be ordered in the diagnostic workflow of their target malignancies. The results are reported in Table 3. The O/P ratio varies consistently among TMs with the appropriate disease code, being minimum for CA15.3 (1.0), intermediate for CA-125 (2.1) and PSA (2.7), and elevated for CA19.9 (21.7) and AFP (14.3). The O/I ratio was low for CA15.5 (2.2) and higher for the other examined TMs, with values increasing from 19.4 for CA19.9 to 90.4 for PSA.
Orders of tumor markers considered for specific malignancies and epidemiological data (prevalence, incidence) of these malignancies.
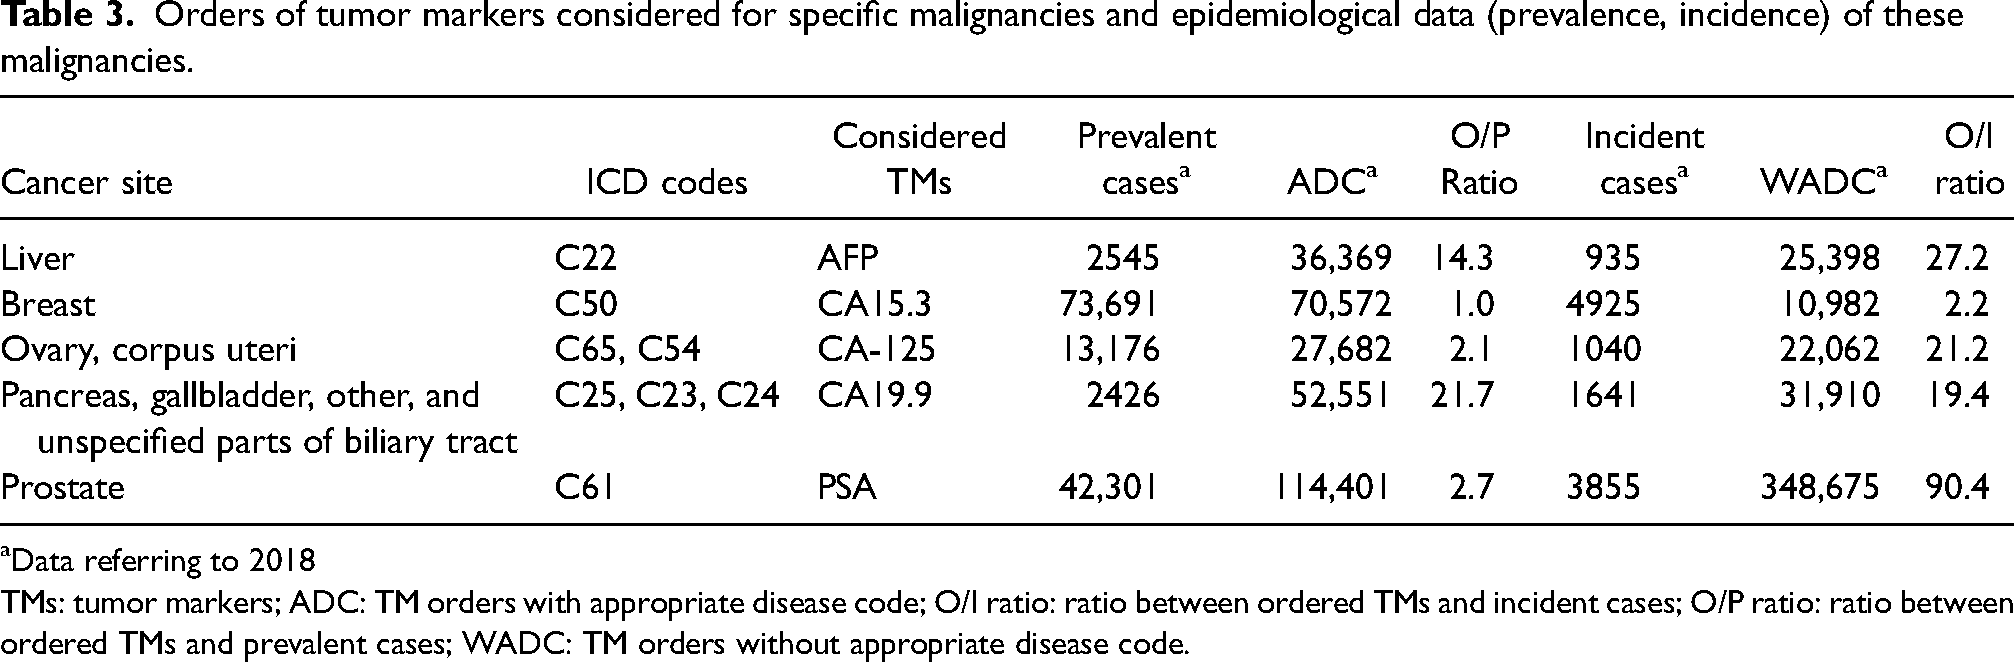
Data referring to 2018
TMs: tumor markers; ADC: TM orders with appropriate disease code; O/I ratio: ratio between ordered TMs and incident cases; O/P ratio: ratio between ordered TMs and prevalent cases; WADC: TM orders without appropriate disease code.
Selected performance indicators
Based on the above findings, we have selected six indicators, summarized in Table 4, which have shown characteristics of relevance, reliability, actionability, and validity 21 adequate for regular application. A detailed comparison with prototype indicators developed in our previous study, 20 as well as criteria applied to evaluate every indicator, tentative desired minimum standards, and context of validation, are reported in Supplementary Table S5. Disease-related indicators were modified, relating the number of ordered TMs to epidemiological data, and focusing their use to TMs recommended for one or two specific malignancies. For gender-related indicators, the orders of PSA in women/total number of ordered PSA were dropped for poor relevance. Orders of CA-125 or CA15.3 in men/total number of ordered CA-125 or CA15.3 were retained. Age-related and test-repetition-related indicators without stratification for disease code were dropped for their poor relevance. Disease- and age-related indicators were dropped for subjects <30 yr. due to poor relevance and were retained for subjects ≥80 yr., but modified focusing on orders without appropriate disease codes. Disease- and test-repetition-related indicators were retained.
Validated indicators.
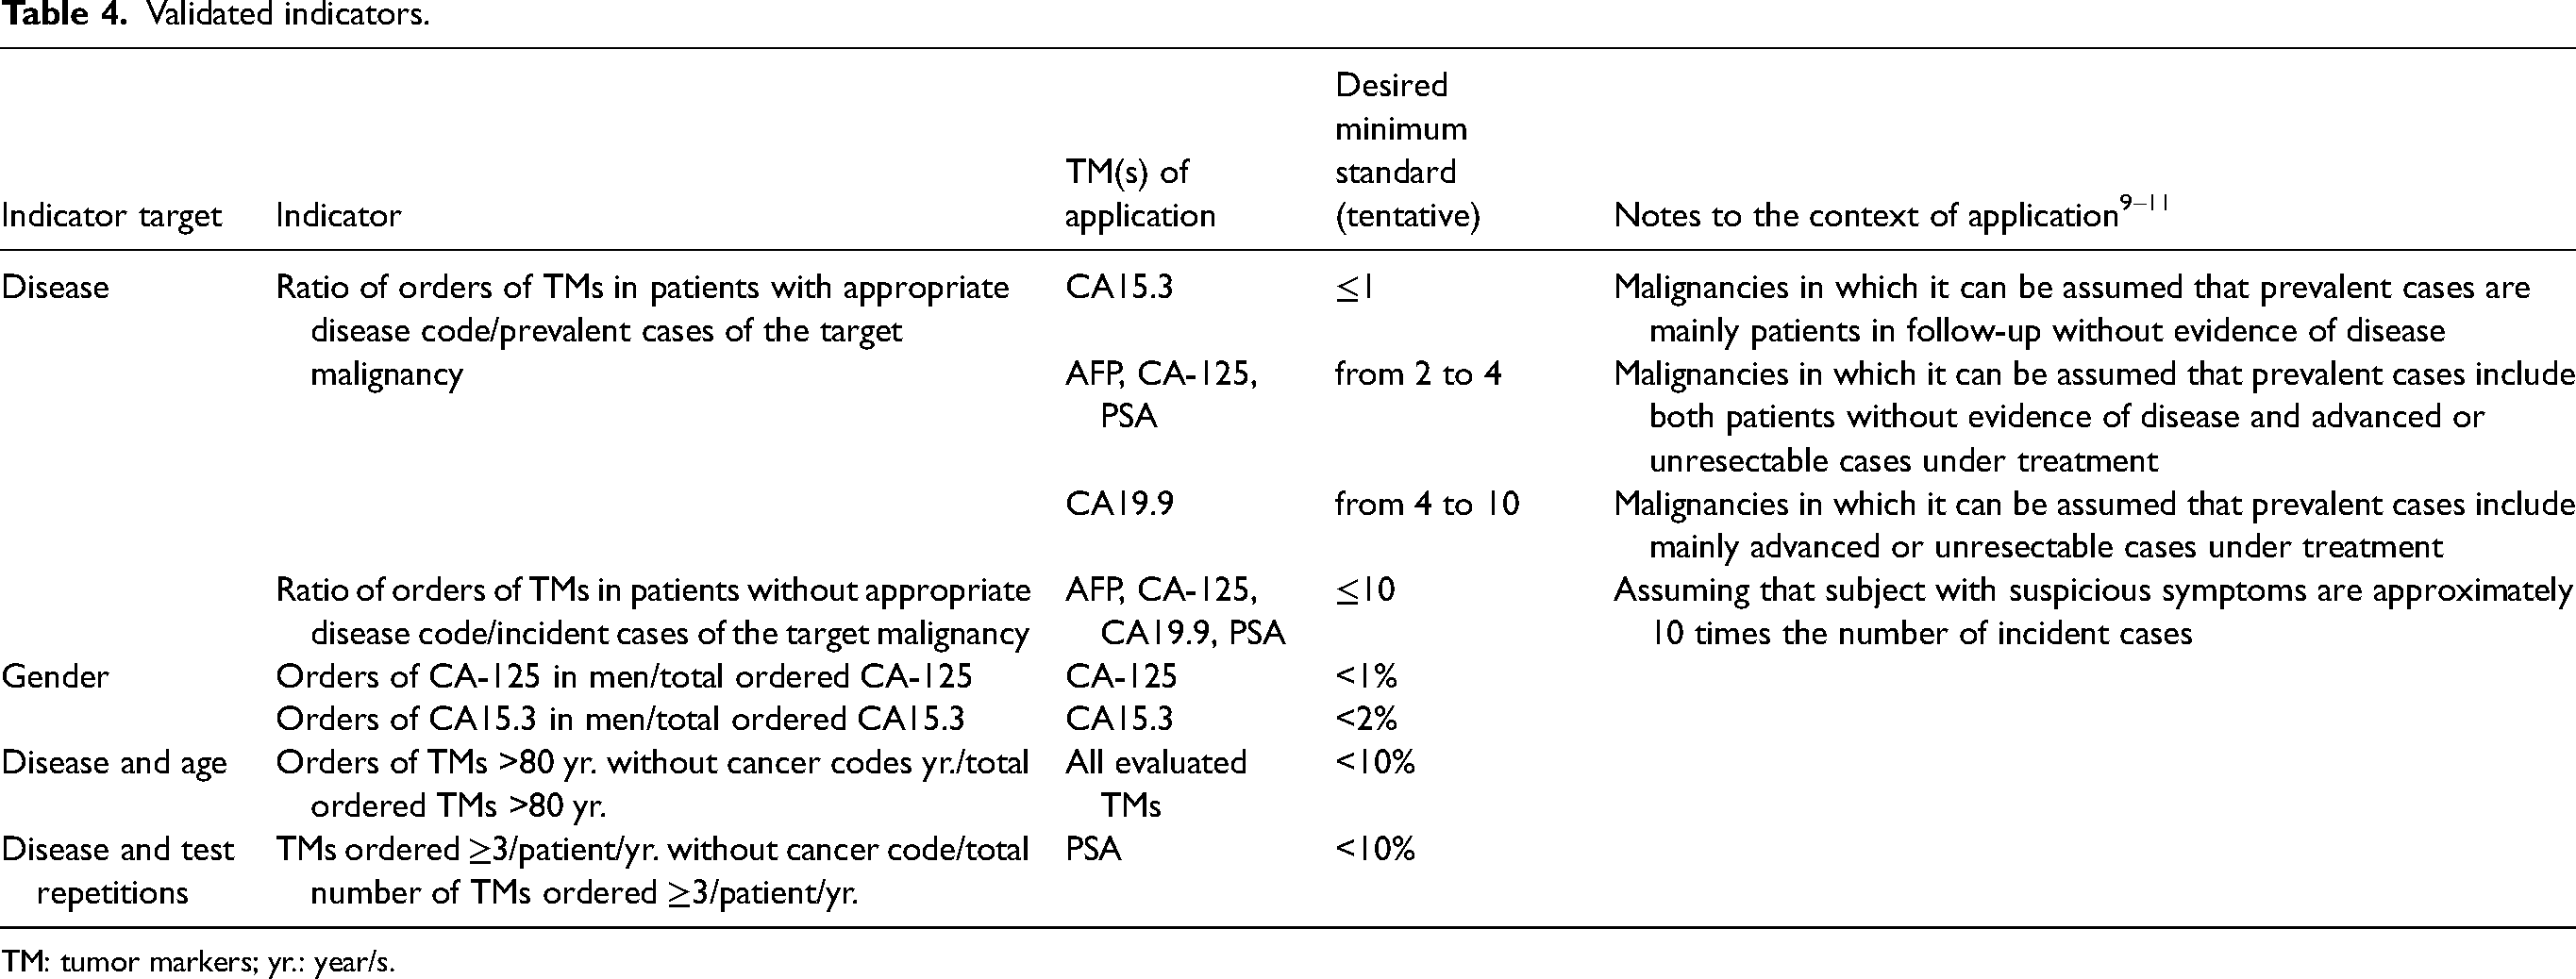
TM: tumor markers; yr.: year/s.
Discussion
This study has validated and optimized at a regional scale previously developed prototype performance indicators concerning TM ordering in general practice. 20 The total number of patients with ordered TMs (730,359 per yr. on average) was elevated, being 2.5-times the total number of prevalent cancer cases (291,931 in 2018), with an average of 198.8 TM orders per 1000 inhabitants. These findings, which persisted over a 6-year observation time, agree with previously published studies7,8 and prove that overordering of TMs in general practice remains an unresolved issue. A global 13.4% decrease of TM orders was observed over 6 years, though it was due to a sharp reduction from 2015 to 2016 rather than to a progressive decline. The decrease of TM orders occurred soon after the release of a Decree-Law on appropriateness released by the Italian Ministry of Health, 15 and remained quite stable thereafter. The decrease pattern was comparable for orders of all TMs, except PSA. The decrease of orders without appropriate disease codes was meaningful for all TMs, except PSA, whereas orders with appropriate disease codes remained relatively stable (Figure 1). These findings show that the decrease of TM orders was mostly due to a reduction of inappropriate use of TMs in subjects without cancer. As concerns the validation of previously developed indicators, the rate of orders of TMs in patients with cancer code/total number of ordered TMs was higher on average (55.9%), but differed for the various TMs. The lowest percentage of orders without appropriate disease codes occurred for CA15.3, possibly because it is commonly perceived as being highly specific for breast cancer. On the other hand, the highest frequencies of orders without appropriate disease codes occurred for PSA and CA-125, which are expected to be used in the diagnostic workflow of patients not yet labeled with a cancer code with suspicious symptoms of prostate or ovarian and endometrial cancer, respectively. TMs exclusively recommended for one or two types of malignancy were compared with the epidemiological data of those malignancies. CEA was excluded as it can be considered in several types of cancer.9–11 We first assumed that the number of TM orders with appropriate disease codes should broadly match the number of prevalent cases of the target malignancy/ies of that TM, and the O/P ratio was considered an approximate assessment of the appropriate use of the marker. We realize that this assumption does not fully adhere to CPGs, as they recommend the use of TMs in a portion of prevalent cases only.9–11 In the case of CA15.3 the O/P ratio of 1.0 suggests a possible regular yearly use of the marker during the follow up of breast cancer, since women without evidence of disease represent the majority of prevalent cases. 25 In the case of CA-125 for ovarian or uterine malignancies and PSA for prostate cancer, the O/P ratios of 2.1 and 2.7, respectively, may be conceivable with a higher number of patients under systemic treatment for advanced (i.e., ovarian cancer) or unresectable (i.e., prostate cancer) disease. Conversely, the 21.7 O/P ratio of CA19.9 and 14.3 O/P ratio of AFP cannot be justified by the prevalence of the target malignancies of the markers, and they are almost certainly used to inappropriately monitor malignancies other than those indicated by CPGs. TMs without appropriate disease code may have been ordered for diagnostic purposes and the O/I ratio should provide an approximate assessment of the appropriate use of the marker.9,10 The O/I ratio of CA15.3 is low (2.2) but all the 10,982 ordered CA15.3 should be considered inappropriate, since no evidence supports considering the marker for diagnostic purposes. Conversely, AFP, CA-125, and PSA could be considered in symptomatic patients for the differential diagnosis of liver, ovarian, or prostate cancer, though always associated with imaging tests.9,10 A limited number of CPGs consider the possible use of CA19.9 in the diagnostic workflow of pancreatic and biliary tract malignancies in patients with suspicious symptoms. 10 However, the O/I ratio of AFP, CA-125, and CA19.9 orders without appropriate disease code are very high, and suggest an extensive overuse of the markers. In fact, clinical symptoms suggestive of initial ovarian cancer are relatively infrequent, and CA19.9 provides unreliable results in case of jaundice, 10 which frequently suggests a pancreatic cancer. Lastly, 348,675 ordered PSA tests without an appropriate disease code compared with 3855 yearly incident prostate cancer cases and a resident population of 722,334 males aged 55–79, suggest that a non-organized, uncontrolled screening is indeed ongoing in the observed geographic area. Regarding indicators related to consistency of TM orders to gender, the number of PSA ordered in females is insignificant to justify any monitoring. Therefore, a specific indicator would have no relevance. On the other hand, 5.6% of total CA-125 and 3.8% of total CA15.3 ordered in males may deserve attention. In fact, according to all existing CPGs,9,10 CA-125 is always inappropriate in males, whereas CA15.3 could be used in male breast cancer, which is a rare disease (<1% of all breast cancers in Italy). 26 TMs ordered in subjects aged <30 yr. and ≥80 yr. were examined as a possible indicator of inappropriate use, since cancer occurrence is rare in young people, and intensive diagnostic approaches are generally not recommended in elderly patients.9–11 TM orders in subjects <30 yr., are very limited (1.0% of total orders) and probably do not deserve the use of an indicator. TM orders in patients ≥80 were indeed relevant (14.4% of the total number or ordered TMs), and orders without appropriate disease codes were prevalent for the majority of TMs (Supplementary Table S4), confirming a probable overuse of TMs for diagnostic purposes also in elderly people. The frequency of orders without appropriate disease codes decreases as the number of orders/patient/yr. increases (Table 2). Given that ≥3 TMs orders/patient/yr. are expected to be ordered only to monitor advanced malignancies under treatment,9–11 the majority of ≥3 repeated orders without appropriate disease codes should be considered inappropriate. The total number of repeated orders without appropriate disease codes is limited for all the evaluated TMs except PSA, both in total and in subjects aged ≥80 yr. Therefore, the relevance of the indicator should be eventually restricted to PSA.
Health care performance indicators range from composite measures targeted to articulated outcomes or processes, to punctual measures focused on specific steps of a given health care process. The two extreme options have been defined as “aggregation and granularity” approaches. 27 Indicators to monitor the appropriateness of TM ordering are “sensu stricto” punctual indicators. However, inappropriate ordering of TMs can trigger a cascade of additional diagnostic and therapeutic interventions that may eventually impact on clinically meaningful composite outcomes. Accordingly, performance indicators focused on specific diagnostic tests have been evaluated.28–30
This study presents some intrinsic limitations. First, the validated indicators are mainly based on disease codes; therefore, the indicators may be assessed in different countries if disease codes are regularly collected and stored in available EHRs. Second, TM results are not available in the regional EHR; hence, the actual rate of false positive results was not assessable. Third, the proposed indicators are only validated for some specific exams and in the frame of specific contexts. Fourth, the combination of TMs that make no medical sense (which may lead to the assumption of inappropriate use) was not evaluated.
Nevertheless, the process of development and validation that we adopted may be applied to other diagnostic tests in clinical scenarios for which CPGs on the diagnostic test's appropriate use is available.
Conclusions
In the present study we tested and validated on a broad population and for an extended time period the performance indicators developed in a previous investigation, using validity, reliability, relevance, and actionability criteria suggested by the OECD. 21 Six indicators which appear suitable for regular application were selected and refined. Indicators related to disease code were effective in detecting a meaningful decrease of TMs ordered without appropriate disease codes over the 2 years following the promulgation of a Decree-Law for the improvement of appropriateness released by the Italian Ministry of Health, corroborating the assumption that it was effective in promoting appropriateness.
Supplemental Material
sj-docx-1-jbm-10.1177_03936155231154663 - Supplemental material for Overordering of tumor marker for outpatients revealed by performance indicators and the impact of a health policy intervention: An observational study using administrative records
Supplemental material, sj-docx-1-jbm-10.1177_03936155231154663 for Overordering of tumor marker for outpatients revealed by performance indicators and the impact of a health policy intervention: An observational study using administrative records by Massimo Gion, Roberto De Gobbi, Manuel Zorzi, Giovanni Carretta, Luca Leonardi, Stefano Guzzinati, Chiara Trevisiol, Maurizio Cancian, Giulia Cardinali, Federica Michieletto, Ruggero Dittadi, Aline S.C. Fabricio, Massimo Rugge and Francesca Russo in The International Journal of Biological Markers
Footnotes
Abbreviations
appropriate disease code alpha-fetoprotein carbohydrate antigen 125 carbohydrate antigen 15.3 carbohydrate antigen 19.9 carcinoembryonic antigen clinical practice guideline(s) electronic health record Health Care Quality Indicators International Classification of Diseases Organization for Economic Cooperation and Development's project ratio between ordered TMs (numerator) and incident cases (denominator) ratio between ordered TMs (numerator) and prevalent cases (denominator) Outpatient Record of Diagnostic and Therapeutic Procedures prostate specific antigen tumor marker(s) without appropriate disease code year/s.
Acknowledgements
We thank Dr. Antonette E. Leon for her contribution in the revision of the English language and Mrs. Ornella Scattolin for administrative assistance.
Authors’ contributions
MG, ASCF, and CT conceived and designed the study. RdG, LL, SG, and GiuC gathered, processed, cleaned, and analyzed the data. MG, RdG, and MZ had full access to and verified all the data in the study. MZ, GioC, MC, FM, RD, MR, and FR collaborated with MG in the interpretation of data. MG wrote the first draft of the manuscript followed by interative revision with CT and MZ. All authors substantially contributed to discussion of content and reviewed and edited the manuscript before submission. All authors were involved in the decision to submit and agreed to publish the manuscript.
Declaration of conflicting interests
The author(s) declared no potential conflicts of interest with respect to the research, authorship, and/or publication of this article.
Funding
The author(s) disclosed receipt of the following financial support for the research, authorship, and/or publication of this article: This study was supported in part by Veneto Region (IT) through the “Programma Regionale per i Biomarcatori Diagnostici, Prognostici e Predittivi” assigned to Azienda ULSS12 Veneziana (currently named AULSS3 Serenissima). The specific role of the funding organization is design and conduct of the study.
Data availability
The data for this study encompass all diagnostic procedures ordered to outpatients within the framework of the Italian National Health Service, and cancer epidemiological data for the entire cohorts of the Veneto Region population. The authors cannot share these data with other researchers due to the sensitive nature and potential for identification. However, other researchers can contact the authors if they have questions concerning the data.
ORCID iDs
Supplemental material
Supplemental material for this article is available online.
References
Supplementary Material
Please find the following supplemental material available below.
For Open Access articles published under a Creative Commons License, all supplemental material carries the same license as the article it is associated with.
For non-Open Access articles published, all supplemental material carries a non-exclusive license, and permission requests for re-use of supplemental material or any part of supplemental material shall be sent directly to the copyright owner as specified in the copyright notice associated with the article.