
Abstract
Introduction:
Real-time, non-invasive monitoring of thrombus formation in extracorporeal circuits has yet to be achieved. To address the challenges of conventional optical thrombus detection methods requiring large devices that limit detection capacity, we developed a micro-optical thrombus sensor.
Methods:
The proposed micro-optical thrombus sensor can detect the intensity of light scattered by blood at wavelengths of 660 and 855 nm. Two thrombus sensors were installed on in vitro circuit: one at the rotary blood pump and one at a flow channel. To evaluate the variation in the ratio of incident light intensity at each wavelength of the two sensors, Rfluct (for 660 nm) and Ifluct (for 855 nm) were defined. Using fresh porcine blood as a working fluid, we performed in vitro tests of haematocrit (Hct) and oxygen saturation (SaO2) variation and thrombus detection. Thrombus tests were terminated after Rfluct or Ifluct showed a larger change than the maximum range of those in the Hct and SaO2 variation test.
Results:
In all three thrombus detection tests, Ifluct showed a larger change than the maximum range of those in the Hct and SaO2 variation test. After the tests, thrombus formation was confirmed in the pump, and there was no thrombus in the flow channel. The results indicate that Ifluct is an effective parameter for identifying the presence of a thrombus.
Conclusion:
Thrombus detection in an extracorporeal circuit using the developed micro-optical sensors was successfully demonstrated in an in vitro test.
Keywords
Introduction
In extracorporeal circulation, thrombosis remains a problem. Thrombi can be found at several points along the extracorporeal circuit, including the pump, connectors, and membrane oxygenator. 1 Blood coagulability is typically modulated with medication, and the effectiveness of anticoagulation is assessed by measuring the activated clotting time (ACT), activated partial thromboplastin time, and anti-Xa.2,3 However, managing anticoagulation remains a significant challenge 1 as those of assay cannot be used to directly assess thrombus formation in an extracorporeal circuit or monitored in real-time since both methods are based on the analysis of sample blood.
Recently, extracorporeal circulation without therapeutic anticoagulation has been attempted in patients at high bleeding risk to reduce the risk of haemorrhagic complications. 4 In such cases, the risk of thrombotic complications will rise, thus increasing the need for real-time thrombus detection. Thus far, various approaches to real-time thrombus monitoring in extracorporeal circuits have been proposed based on electrical,5,6 sound,7,8 or optical9–12 principles. However, invasiveness remains an issue with electrical monitoring techniques, as electrodes must be in contact with the blood. Conversely, sound measurement is non-invasive, but its detection capacity is limited to thrombosis in a pump because the analysis is based on the frequency of sound emitted from a pump. Similarly, optical methods are non-invasive. However, optical methods have other restrictions concerning installation and measurement owing to the requirement for hyperspectral cameras and sufficient distance for focusing. Furthermore, optical fibres must be carefully handled due to restrictions on bending radius, among other factors, rendering fibre-routing to monitor points challenging. Thus, optically monitoring the many potential areas for thrombus formation is currently challenging.
Our research aims to realise a real-time, non-invasive thrombus monitoring system that can monitor all thrombus risk locations in extracorporeal circuits by a highly installable micro optical sensor. As the first objective, in this study, an optical sensing system including micro-optical thrombus sensor was developed. The feasibility of thrombus detection of sensor system was experimentally verified with an in vitro test circuit with porcine blood.
Materials and methods
Micro-optical thrombus sensor
We developed a micro-optical thrombus sensor for monitoring the optical properties of blood (Figure 1). The sensor is comprised of two LEDs, a complementary metal-oxide-semiconductor (CMOS) chip, containing both a photodiode (PD) and amplifier circuit, and a light guide block to restrict the incident light angle. The unique structure involved directly mounting the LEDs and light guide block on the CMOS chip to dramatically miniaturise the sensor (2.8 × 2.8 × 0.7 mm3). The distance between the PD and LEDs was 1.5 mm. The sensor was packaged in transparent epoxy resin. Owing to its small size and thin-film wiring, the sensor can be attached to most extracorporeal circuit components, regardless of the surface shape or size restrictions. Since the absorbance of blood is determined by the absorbance of haemoglobin, 13 660 nm and 855 nm LEDs were selected owing to the low absorbance of these wavelengths by haemoglobin and accordingly their high transmittance in blood. The details of CMOS chip fabrication and assembly are provided in our previous work.14,15
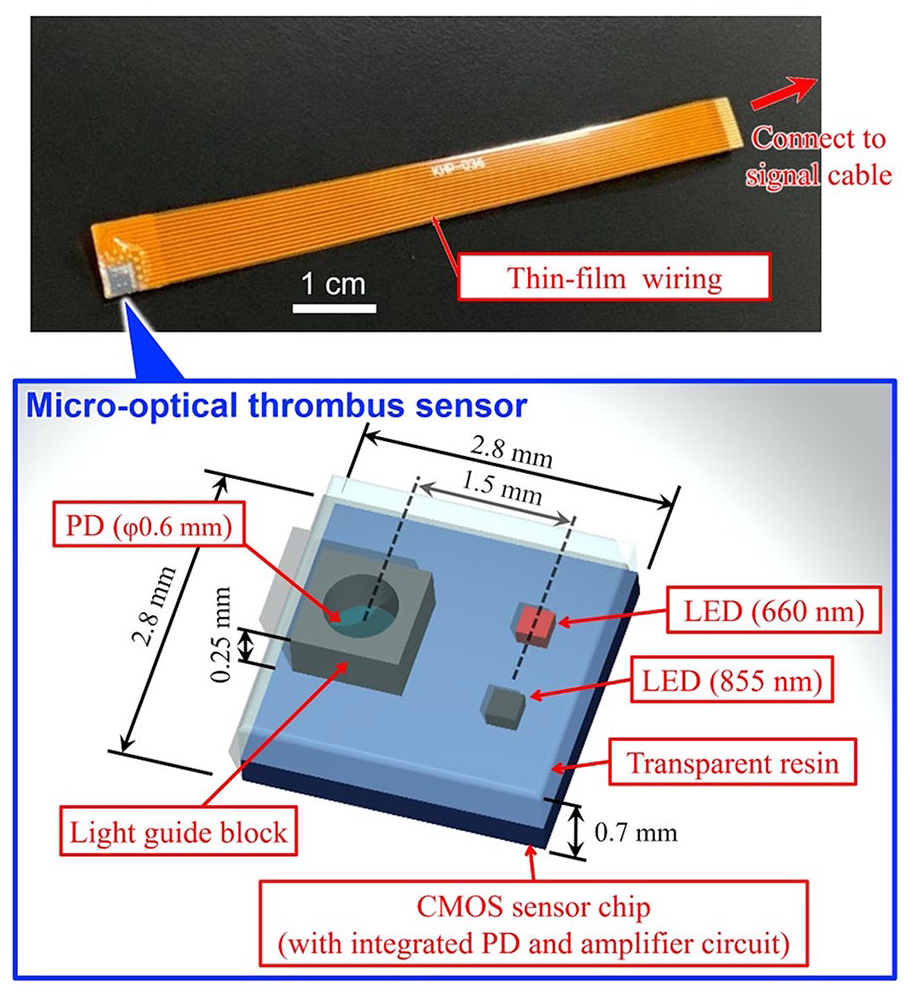
The proposed micro-optical thrombus sensor. The sensor detects the intensity of light scattered from blood. The sensor consists of LEDs (660 and 855 nm), a photodiode (PD), a signal amplifier circuit, and a light guide block. The sensor is 2.8 × 2.8 × 0.7 mm3 and packaged in transparent epoxy resin. Electrical connections were made with thin-film wiring.
Principles of thrombus detection
A thrombus sensor is attached to the extracorporeal circuit where thrombus formation should be monitored. Then, 660 nm and 855 nm lights are irradiated from each LED, which are subsequently absorbed and scattered by the blood components, predominantly red blood cells (RBCs). A portion of the light is then detected by the PD (Figure 2). When a thrombus forms, the haematocrit (Hct) of the thrombus differs from that of the surrounding blood because RBCs are either trapped by the fibrin network of the thrombus or pushed out by the force of the surrounding blood flow.12,16 As light scattering and absorption in whole blood varies with Hct, 17 the detected light intensity by the thrombus sensor is affected by thrombus formation. Therefore, thrombus formation is expected to be detected by optical monitoring based on local Hct changes.
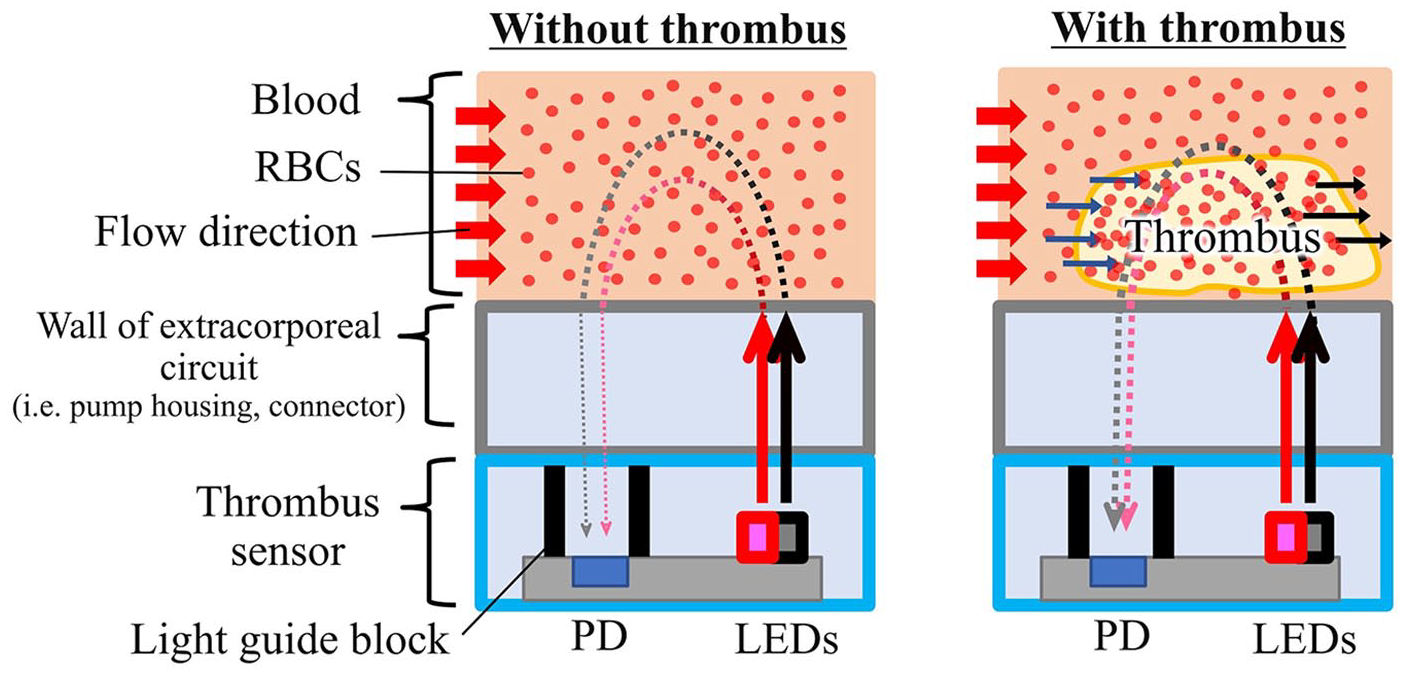
Main optical path from the LEDs to the photodiode (PD) in the thrombus sensor through blood. 660 nm and 855 nm light irradiated from the thrombus sensor is absorbed and scattered by blood and then detected by the PD in the thrombus sensor. The thrombus sensors are installed in at least two positions on the extracorporeal circuit—a reference point (low thrombus risk) and a monitoring point (high thrombus risk). If a thrombus occurs at a monitoring point, the two thrombus sensors will show different signals because the optical properties of a thrombus differ from those of flowing blood.
However, the optical properties of blood are not exclusively affected by thrombus formation. Hct varies in clinical situations due to several factors, including hydration status and medication administration. Oxygen saturation (SaO2) – dictated by oxygenation and oxygen consumption – also affects the optical properties of blood.13,18 To distinguish between the changes in optical properties caused by thrombus formation from those caused by other factors, we propose a strategy of comparing the optical properties of the blood between the positions where thrombus sensors are installed. This strategy requires at least two thrombus sensors, with one located where the thrombus formation must be monitored and the other located where thrombosis rarely occurs. When a thrombus forms at a monitoring point, specific local changes will occur in the optical properties. Thus, this affects the ratio of the local optical properties from each of the two thrombus sensors. However, variations in the SaO2 and Hct of flowing blood cause global changes; thus, this ratio is unaffected.
Data analysis and monitoring system
Data acquisition, analysis and control of the thrombus sensors were performed using a laptop and LabVIEW with analogue I/O modules (National Instruments Corp.). The 660 nm-LEDs were illuminated for 1 s followed by the 855 nm-LEDs for 1 s. Thereafter, both LEDs were turned off for 3 s. The output from the PD was recorded at a 1 kHz sampling, averaged for every second, and divided into three phases: 855 nm LED illumination, 660 nm LED illumination, and no illumination. The signal during the no illumination phase was subtracted from that during the irradiation of light from each LED to account for background intensity. This sequence was repeated every 5 s. The intensities at 855 and 660 nm after background removal were denoted by I and R, respectively, and referred to as Imonitor, Ireference, Rmoitor, and Rreference, where the subscript refers to the sensor location. The comparison parameters Iratio and Rratio were defined as


Here, t is the time elapsed since the start of the test and t0 is the time at normalisation. Ifluct and Rfluct were defined to evaluate the variation in Iratio and Rratio as follows:


where Iratio = Rratio = 1, unless a thrombus was formed. Practically, however, Iratio and Rratio ≠ 1, even without thrombosis, due to the instantaneous non-uniformity of blood in the circuit and sensor noise. Therefore, we defined thrombus formation determination thresholds (TFDTI for 855 nm, TFDTR for 660 nm), which were calculated from the maximum variation of Ifluct and Rfluct while a thrombus has not formed. To evaluate TFDTI and TFDTR, Hct and SaO2 variation tests were performed, in which Hct and SaO2 were varied from 20 to 40% and 40 to 100%, respectively (see Section 2.4). ∆Iratio,max and ∆Rratio,max were defined as the maximum values of |Iratio(t) – 1| and |Rratio(t) – 1| via the Hct and SaO2 variation tests, respectively. Thus, TFDTI and TFDTR were given by


Thrombus formation was suspected when Ifluct(t) > TFDTI or Rfluct(t) > TFDTR.
Haematocrit and oxygen saturation variation tests
Hct and SaO2 variation tests were conducted using an in vitro circuit (Figure 3(a)) comprised of a rotary blood pump (developed at AIST,19–21), reference glass cell (RC), and membrane oxygenator (BioCube 6000, Nipro Co., Ltd.), as well as a blood reservoir (special order, Senko Medical Instrument Mfg. Co. Ltd.), sampling port, tubes, and connectors, all coated with heparin (Senko Medical Instrument Mfg. Co., Ltd.). The thrombus sensors were attached to the bottom of the pump (monitoring point) and the RC (reference point), where the risks of thrombus formation were high and low, respectively. We used fresh porcine blood (obtained from a local slaughterhouse) because its optical properties in terms of scattering, absorption, and aggregability are similar to human blood. 22 The blood was anticoagulated with 100 mL of 3.2% sodium citrate in 900 mL of blood. To vary the Hct, 600 mL of blood was centrifuged and separated into high-Hct blood (>95%) and plasma. Furthermore, 430 mL of blood with 20% Hct was prepared from the remaining whole blood and autologous plasma and used to prime the circuit. The blood was circulated at 1 L/min with a pump speed of 2880 rpm. The flow rate was adjusted using a resistant adjuster and flow meter (TS410, Transonic Systems Inc.). The blood temperature was maintained at 37°C by a water bath. The SaO2 was controlled by the membrane oxygenator using pure O2 gas, pure N2 gas and pure CO2 gas with gas blender. To test the effect of Hct variation on the optical signal, the Hct was increased from 20 to 40% in 5% increments by replacing a portion of the blood in the circuit with the high-Hct blood at a constant SaO2 of 100%. The thrombus sensor signals were recorded for 2 min at each Hct level. To assess the effects of SaO2 variation, the thrombus sensor signals were measured intermittently while decreasing the SaO2 from 40 to 100% at a constant Hct of 30%. The Hct and SaO2 were confirmed from sampled blood using a blood-cell analyser (MEK-6450, Nihon Kohden Co.), and blood gas analyser (ABL80-FLEX System, Radiometer, Ind.), respectively. Finally, TFDTI and TFDTR were calculated using equations (5) and (6), respectively.
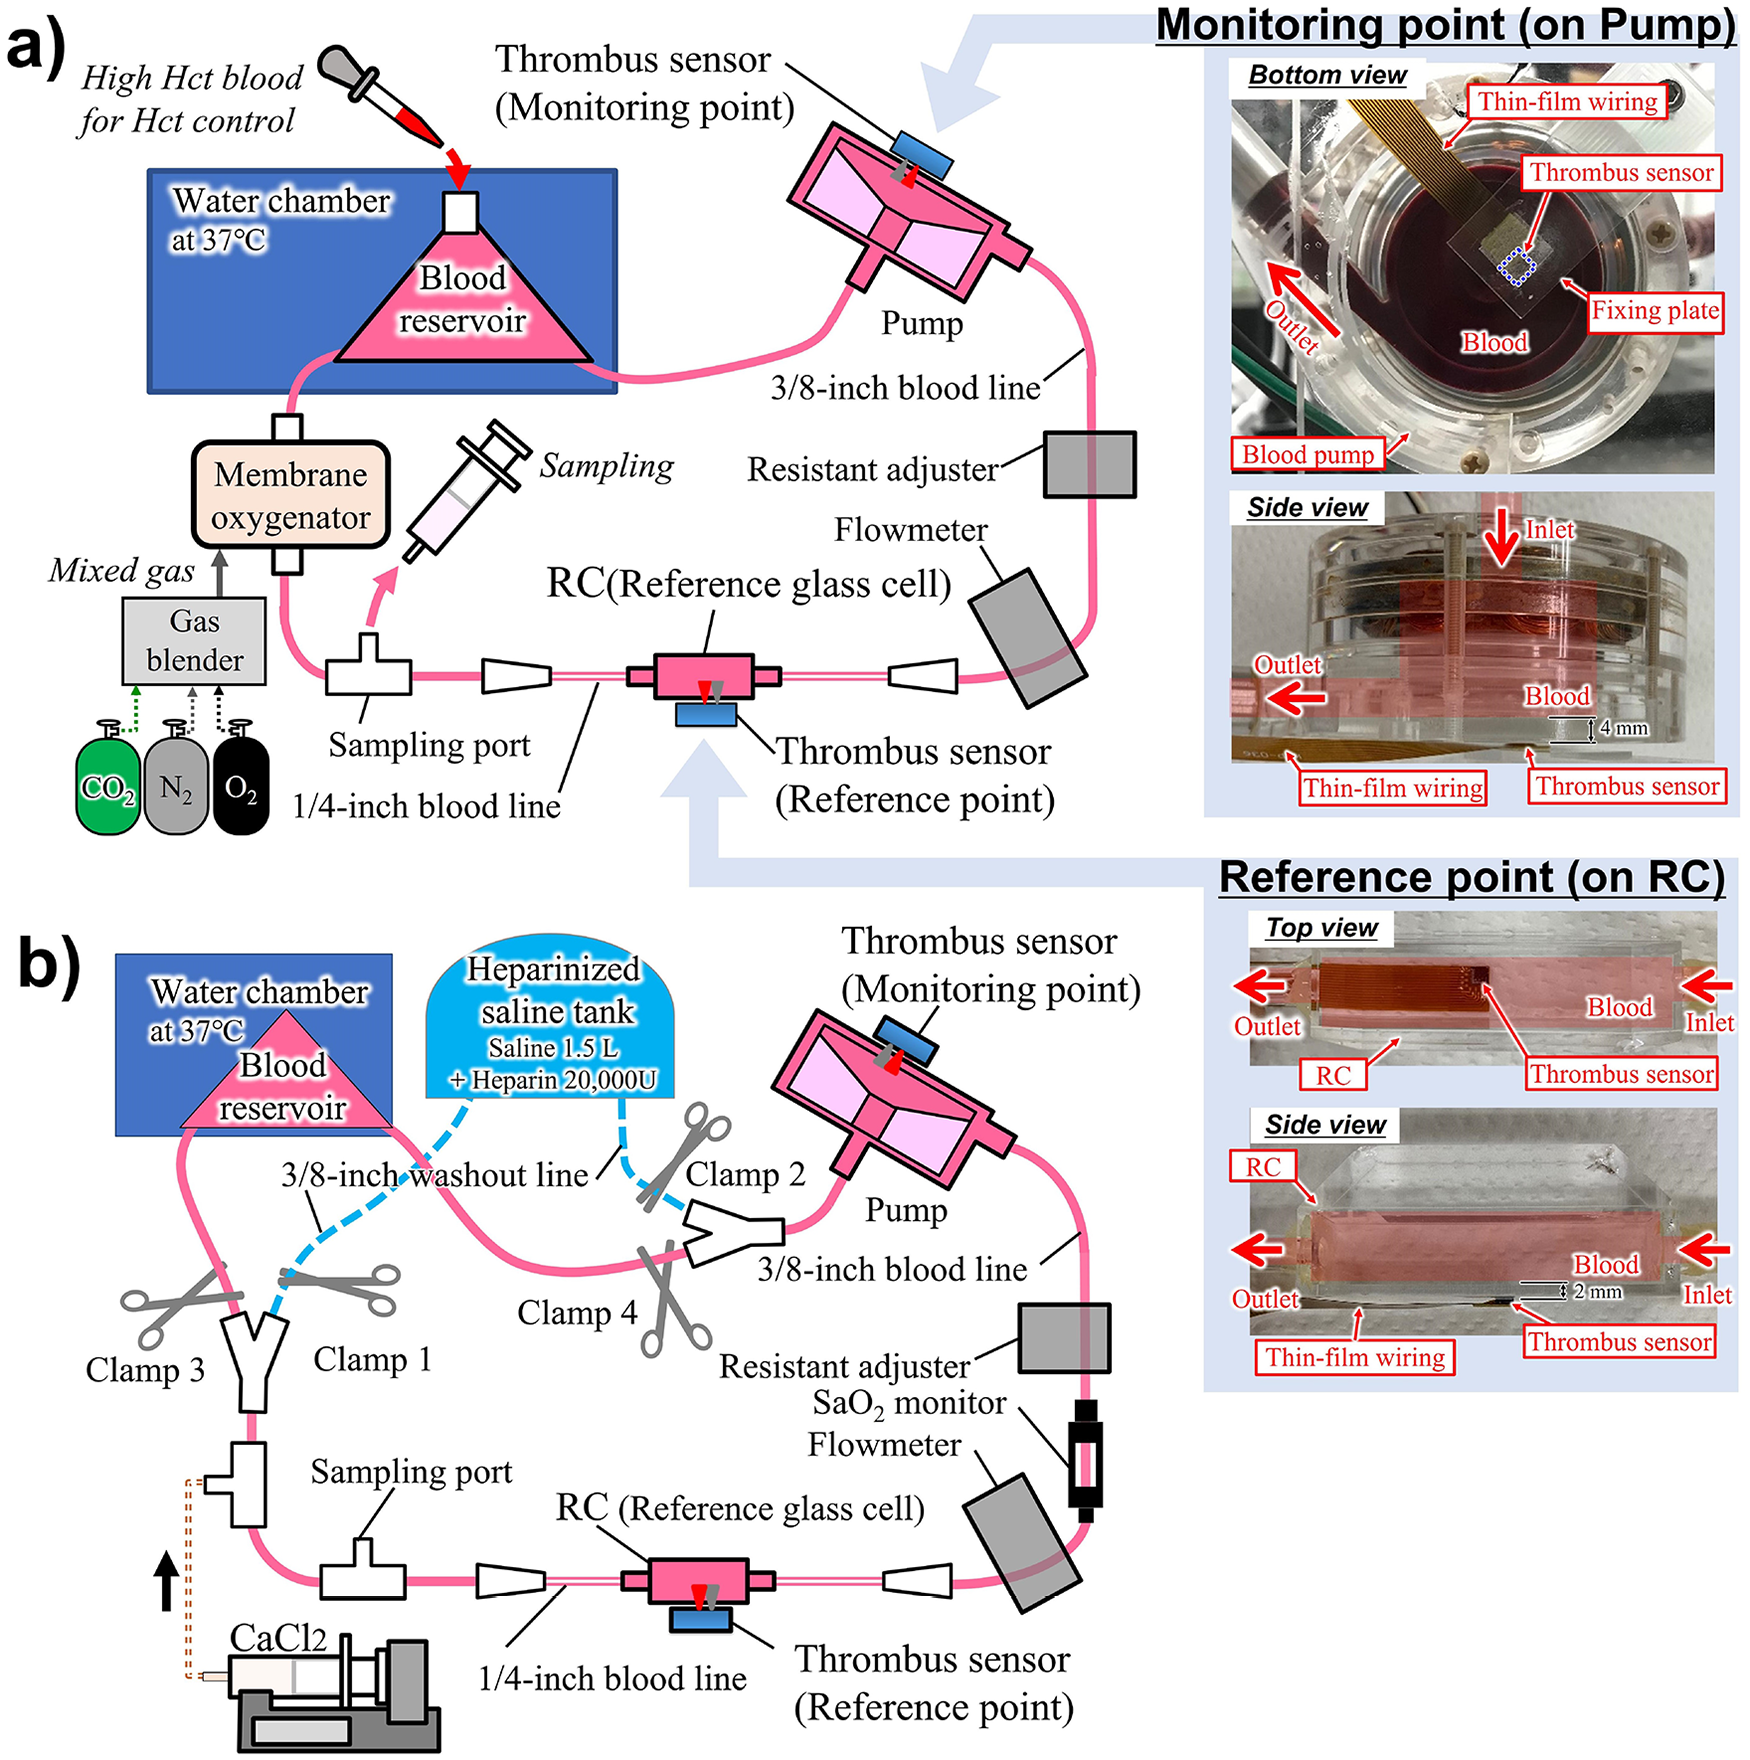
Setup of in vitro tests: (a) setup of the Hct and SaO2 variation tests. The thrombus sensors were installed on the bottom of the pump and on the RC as monitoring point and reference point, respectively. For the details of the sensor installation, refer to the pictures on the right and (b) setup for the thrombus tests. The blood line and the washout line were completely separated by clamps during the test. The washout line was used for terminating the test. The thrombus sensors were installed as in the Hct and SaO2 variation tests.
Thrombus detection test
We conducted the thrombus detection test thrice using the in vitro setup (Figure 3(b)). The protocol for forming a thrombus in the pump was based on prior studies.9,23,24 The circulation path was comprised of a closed-loop line for blood circulation (blood line) and a bypass line to wash out the pump and stop the thrombogenic process after completing the test (washout line). The washout and blood lines were completely separated by clamps (Clamps 1–2: Closed; Clamps 3–4: Open). The heparinised saline tank was used to prepare 1.5 L of saline with 20,000 units of heparin. All other equipment was setup as in the Hct and SaO2 variation tests and the same anticoagulation method was used. The blood line was primed with 600 mL of blood, which was adjusted to 30% Hct with autologous plasma and fully oxygenated to 100% SaO2 prior to the test. The ACT and Hct were monitored every 5–15 min from sampled blood using the Hemochron Response (Accriva Diagnostics Holdings, Inc.) and a blood-cell analyser. The SaO2 was recorded every 5 min using a saturation monitor (HSAT-1, Senko Medical Instrument Mfg. Co. Ltd.). To adjust the ACT, a 2% w/v solution of calcium chloride was added using a syringe pump at a constant injection rate until the ACT was between 130 and 140 s. Two minutes after the calcium chloride injection was stopped (t0 = 0 min), acquisition of Ifluct and Rfluct was initiated. Once Ifluct exceeded TFDTI or Rfluct exceeded TFDTR, a time delay was allowed, following which a section of the blood line was redirected to the washout line (Clamps 1–2: Open; Clamps 3–4: Closed) to end the test. The time delays were 0.2, 2, and 4 min in the first, second, and third tests, respectively, to compare the values of Ifluct and Rfluct for various thrombus sizes. After the test, the mixture of blood and heparinised water inside the pump and the RC were carefully replaced with saline for clear observation of thrombus formation. The thrombus volume was measured using a 10 mL graduated cylinder containing 5 mL of saline, by assessing the change in the liquid level by submerging the thrombus.
Results
Hct and SaO2 variation tests
The results of the Hct and SaO2 variation tests are presented in Figure 4. Iratio and Rratio were normalised to their respective values at 28.9% Hct and 100% SaO2 in the Hct test and 30.1% Hct and 99.7% SaO2 in SaO2 test. Error bars indicate a 99.7% confidence interval region (±3 standard deviations). Over the full variation range of Hct (17.7% to 39.3%) and SaO2 (37% to 99.7%), the maximum fluctuations of Iratio and Rratio were from -2.1% to 2.7% and from −1.6% to 3.2%, respectively. Consequently, ∆Iratio,max and ∆Rratio,max were 2.7% and 3.2%, respectively. Thus, TFDTI and TFDTR were 0.71 × 10⁻³ and 1.02 × 10⁻³ by equations (5) and (6).
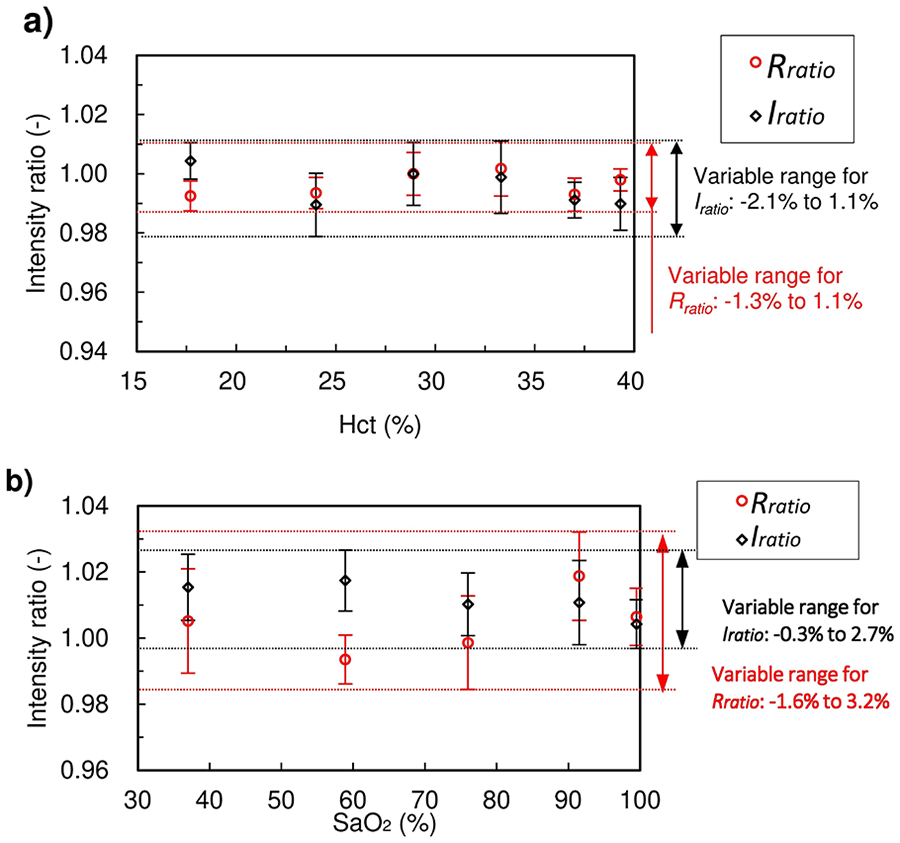
Analytical results of the Hct and SaO2 tests: (a) Hct test at 100% SaO2. Signals were normalised at Hct 28.9% and (b) SaO2 test at 30.1% Hct. Signals were normalised to 99.7% SaO2. Error bars show ±3 SD for each measurement. Over the full variation range of Hct (17.7%–39.3%) and SaO2 (37%–99.7%), the maximum fluctuations of Iratio and Rratio were from −2.1% to 2.7% and from −1.6% to 3.2%, respectively.
Thrombus detection tests
Figure 5(a) shows the results of Test 1. Ifluct(t) exceeded TFDTI after 145.5 min. After exceeding the threshold, a delay of 0.2 min was initiated before the circulation path was switched to the washout line. The final value of Ifluct was 0.88 × 10⁻³. During the test, Rfluct was consistently less than TFDTR. Hct remained constant (28.9 ± 0.3%). The ACT decreased from 136 to 78 s, and the SaO2 decreased from 100 to 95%. After the test, the interior of the pump and the RC were observed. Thrombus formation was confirmed in the impeller of the pump (Figure 6(a)), and there was no thrombus in the RC. The volume of the thrombus was 0.6 mL.
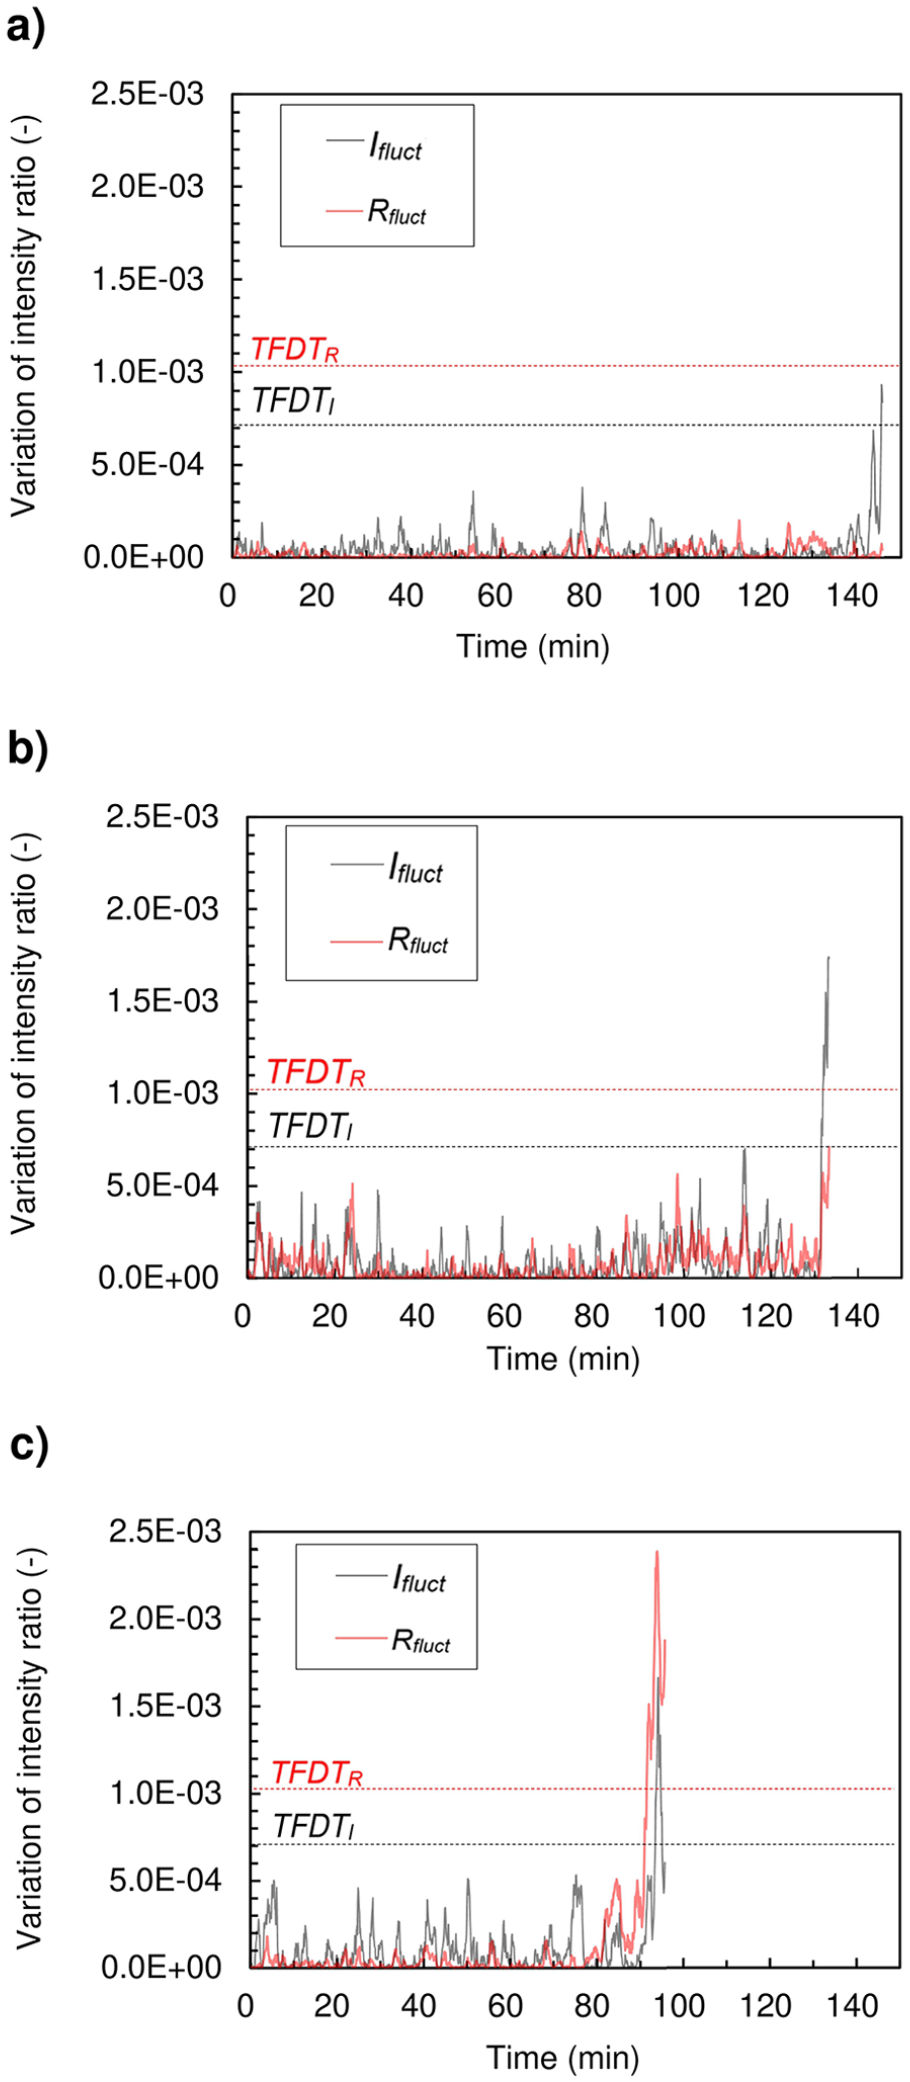
Ifluct and Rfluct results from the thrombus detection tests: (a) test 1:Ifluct exceeded TFDTI at 145.6 min. The test was ended 0.2 min after Ifluct surpassed the threshold. The final value of Ifluct was 0.88 × 10⁻³, (b) test 2: Ifluct exceeded TFDTI at 131.6 min. The test was ended 2 min after the Ifluct surpassed the threshold. The final value of Ifluct was 1.74 × 10⁻³, and (c) test 3: Rfluct exceeded TFDTR at 91.6 min, and Ifluct exceeded TFDTI at 93.6 min. The test was ended 4 min after Rfluct surpassed the threshold. The final values of Ifluct and Rfluct were 0.60 × 10⁻³ and 1.86 × 10⁻³, respectively. Ifluct and Rfluct recorded their maximum values of 1.66 × 10⁻³ and 2.38 × 10⁻³ 1.5 min and 1.9 min, respectively, before the test ended.
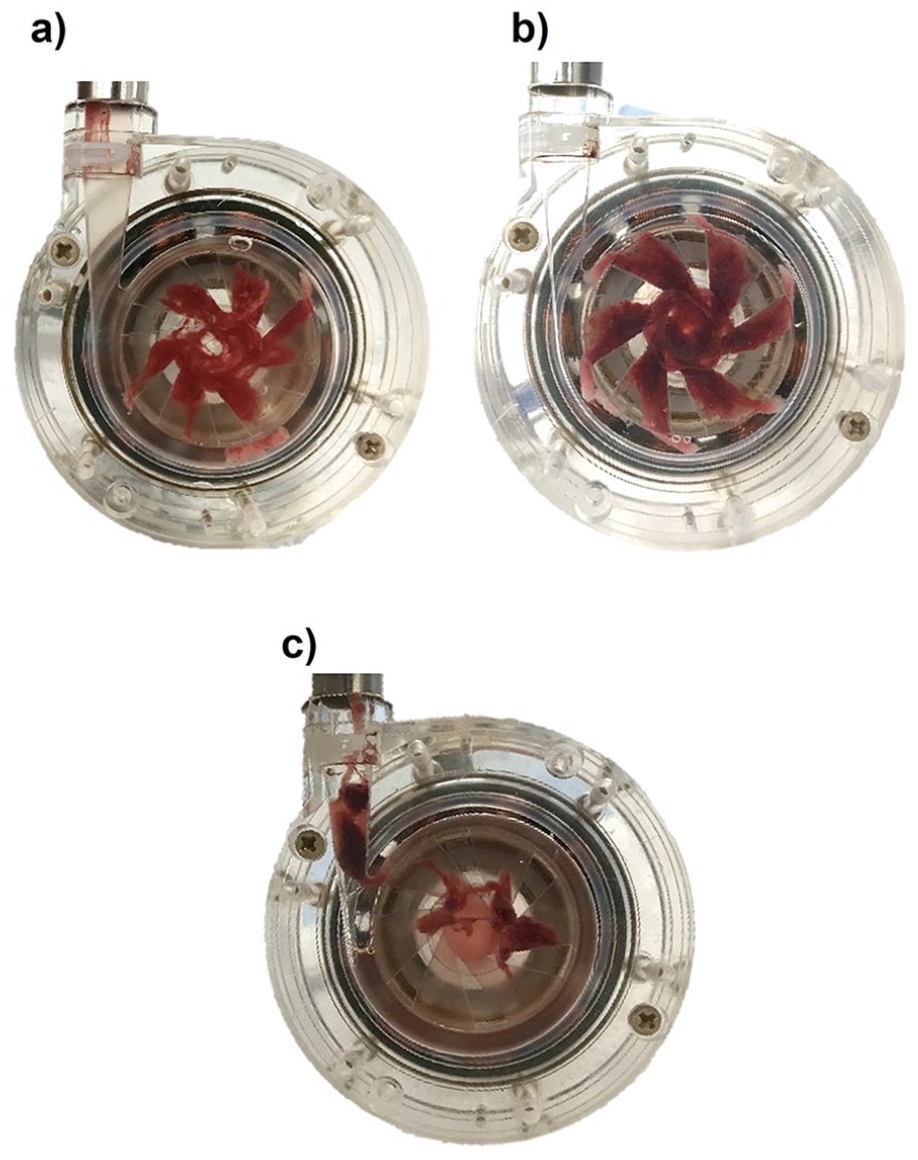
Observations of the pump after the thrombus detection tests. A thrombus was observed in the pump and no thrombus was observed in the RC for each of the three tests: (a) a 0.6 mL thrombus was observed after Test 1, (b) a 1.1 mL thrombus was observed after Test 2, and (c) a total of 1.0 mL of thrombus was observed after Test 3. A 0.2 mL thrombus was found near the centre of the pump as in Tests 1 and 2. The remaining 0.8 mL thrombus was found at the volute outlet of the pump.
Test 2 (Figure 5(b)) was terminated 2 min after Ifluct exceeded TFDTI. The final value of Ifluct was 1.74 × 10⁻³, which is 1.97 times the final value of Ifluct from Test 1. Rfluct was consistently less than TFDTR during the test. The Hct remained constant at 28.6 ± 0.3%. The ACT decreased from 137 s to 75 s, and the SaO2 decreased from 100% to 94%. After the test, thrombus formation was confirmed in the impeller of the pump (Figure 6(b)); there was no thrombus in the RC. The volume of the thrombus was 1.1 mL.
In Test 3, Rfluct exceeded TFDTR after 91.6 min (Figure 5(c)). After a 1.9 min delay, Ifluct exceeded TFDTI. The test was terminated 4 min after Rfluct exceeded TFDTR. The Hct remained constant (29.9 ± 0.6%). The ACT decreased from 137 s to 106 s, and the SaO2 decreased from 99% to 94%. Ifluct and Rfluct reached their maximum values of 1.66 × 10⁻³ and 2.38 × 10⁻³, respectively, 1.5 min and 1.9 min before the end of the test. The final values of Ifluct and Rfluct were 0.60 × 10⁻³ and 1.86 × 10⁻³. After the test, there was a 0.2 mL thrombus in the impeller and a 0.8 mL thrombus at the outlet of the pump (Figure 6(c)). There was no thrombus in the RC, as in Tests 1 and 2.
Discussion
Thrombus detection performance
In all thrombus detection tests, Ifluct exceeded TFDTI, and a thrombus was observed in the pump, indicating that Ifluct is an effective parameter for identifying the presence of a thrombus. Regarding thrombus sensitivity, the thrombus volume in Test 2 (1.1 mL) was approximately 1.8 times greater than that in Test 1 (0.6 mL). Furthermore, the final Ifluct value in Test 2 (1.74 × 10⁻³) was approximately 1.97 times greater than that in Test 1 (0.88 × 10⁻³). These results suggest a potential proportional relationship between Ifluct and the thrombus volume, as both values approximately double from Test 1 to Test 2. Despite the similar values of Ifluct in Tests 2 (1.74 × 10⁻³) and 3 (1.66 × 10⁻³), the volume of the thrombus in the impeller differed significantly between the two tests. However, in Test 3, the total volume of the thrombus was 1.0 mL. Considering the rapid decline in both Ifluct and Rfluct, it is possible that the thrombus started to fragment approximately 2 min before the end of the test, leading to the discrepancy between tests. While Ifluct exceeded TFDTI in all tests, Rfluct did not exceed TFDTR in Tests 1 and 2, though Rfluct increased near the end of Test 2. The difference in sensitivity between the wavelengths can be explained by their respective penetration depths in blood, arising from the absorption coefficient of oxygenated haemoglobin at 855 nm being 0.48 mm−1 and that at 660 nm being 0.08 mm−1. 13 Excessive penetration depth over the thrombus may result in reduced sensitivity due to the increased percentage of non-clotted blood in main optical path from LED to PD. Considering this explanation, Rfluct may have shown higher sensitivity in Test 3 because the thrombus in the impeller was thicker in the direction of light irradiation than it was in Tests 1 and 2. However, the absorption at 660 nm has dependence on SaO2, additional experiments under difference SaO2 conditions are required to discuss sensitivity of Rfluct.
Limitations
The effectiveness of Ifluct for determining the presence of thrombus was shown through the thrombus detection tests. However, additional testing is required to confirm that there is a proportional relationship between thrombus size and the values of Ifluct and Rfluct. In this study, thrombus detection was demonstrated based on assessing the difference in optical properties between two points arising from thrombus formation, assuming that other variation factors of optical property such as Hct, SaO2, would occur equally at both points. This assumption does not hold if there are other factors, such as an oxygenator being present, that affect the optical properties of the blood between the two points. In this case, the proposed detection strategy would still be effective if paired reference and monitoring thrombus sensors were installed both downstream and upstream of the oxygenator. Considering the monitoring in the oxygenator, the light must be limited to wavelengths that are not affected by changes in SaO2 in order to obtain an appropriate reference signal because SaO2 in the oxygenator is not uniform.
Future work
The thrombus confirmed at the end of the test was 0.6 mL, and it is desired to improve the sensitivity for earlier detection. When light propagates through a highly scattering medium such as blood or tissue, depth of the main optical path is varied by changing the distance between a light source and a receiver. 25 Furthermore, aperture of both the light source and the receiver affect the main optical path. The sensitivity could be improved by optimising the depth of the main optical path at the expected depth of thrombus formation by modifying those geometric parameters. The evaluation of the effect of the optimisation and controllable range of the measurement depth requires verification by Monte Carlo simulation. We estimated the possibility of the maximum depth of measurement from the experimental study of spectral imaging of thrombus. 9 The study showed that forward scattered light in near-infrared wavelength (670–750 nm) can detect thrombus generation at a depth of 5.2 mm in blood with 100% SaO2. Inferring from this result, here, assuming that the backscattering light draws a 5.2 mm length of the optical path of an elliptical orbit at a distance of 1.5 mm between light source (LED) and detector (PD) of the thrombus sensor, maximum measurable depth is expected to be about 2.3 mm or deeper. For further discussion of the maximum depth, Monte Carlo simulation is required.
Regarding electrical stability, the thrombus sensor contains a signal drift of ±0.5% at maximum, which is a factor of sensitivity deterioration. This causes up to 1% artefact variation in Ifluct and Rfluct. For example, reducing the drift to ±0.1% can set TFDTI 50% lower. Thus, the improvement of electrical property of the sensor contributes to sensitivity.
Commonly used blood pumps are partially covered with pump driver, resulting in restriction of optical access by attaching a sensor from outside. In such a case, optical access can be achieved by inserting the sensor in the gap between a pump and a driver, or embedding it in a housing or a driver. This requires re-design of their shape to ensure space for installing the sensor. For example, space for embedding can be provided by reducing the thickness of the housing at the embedding area, or conversely, by increasing the thickness of the housing other than embedding areas. The re-design of them is technically possible with the help of the small and thin design of the thrombus sensor with thin and flexible wiring.
Conclusion
This study provided a proof-of-concept demonstration of real-time, non-invasive thrombus detection in an extracorporeal circuit by comparing the optical properties of blood at two points using novel micro-optical sensors. Owing to the underlying design principles and minimal limitations on sensor installation, it is likely that the proposed method can be extended to multiple monitoring points. Thus, an effective thrombus-detection system can be developed for an entire extracorporeal circuit by installing sensors at all points with a high risk of thrombus formation and at several points with a low risk of thrombus formation for reference.
Footnotes
Acknowledgements
Porcine blood was provided by Ibaraki Chuo Meat Center Co. Ltd. The sensor was partially fabricated at the Semiconductor Center of Kitakyushu Science and Research Park.
Declaration of conflicting interests
The author(s) declared no potential conflicts of interest with respect to the research, authorship, and/or publication of this article.
Funding
The author(s) disclosed receipt of the following financial support for the research, authorship, and/or publication of this article: This work was supported by JSPS KAKENHI Grant Number JP 19K20726.