
Abstract
Background:
Malnutrition and anemia are 2 severe public health concerns, predominantly in low-and middle-income nations. Malnutrition is defined as poor nutritional condition that encompasses both under nutrition and over nutrition. The prevalence of overweight or obesity and anemia has increased in India from 2016 to 2021. The study aims to investigate the spatial clustering and factors responsible for underweight, overweight/obesity, and anemia among reproductive women (15-49 years) in India using the data from National Family and Health Survey-5 (2019-2021).
Methods:
We conducted hot-spot analysis using Moran’s Index (MI) with the help of spatial analysis software (i.e., GeoDa 1.18 and ArcGIS 10.8). It also demonstrates the autocorrelation. Multivariable logistic regression analysis has been performed to examine different determinants and risk associated with underweight, overweight/obesity, and anemia with various dependent variable by using Stata-14 software.
Results:
Moran’s Index for underweight (MI = 0.68), overweight/obesity (MI = 0.72), and anemia (MI = 0.62) indicates a high level of spatial-autocorrelation (P < .001) exists across the districts in India. As a result, a total of 156, 143, and 126 hot-spot districts are detected for underweight, overweight/obesity, and anemia, respectively. The burden of undernutrition and anemia is higher in rural areas. Risk of under nutrition and anemia are both reduced by media exposure and eating habits. Moreover, low income and low education level raises the risk of anemia and undernutrition, while obesity shows an inverse trend with income and education level.
Conclusion:
The study recommends targeting hot-spot districts for malnutrition and anemia, and policy level initiatives by addressing the responsible risk factors.
Plain language title
Spatial Clustering of Malnutrition and Anemia Among Women Across Districts in India
Plain language summary
Most of the low-income and middle-income countries are affected by the double burden of malnutrition. Malnutrition and anemia are 2 severe public health concerns, predominantly in low-and middle-income nations. However, the prevalence of undernutrition among women of reproductive age in India has decreased, while the prevalence of overweight or obesity and anemia has also increased in India from 2016 to 2021. The study aims to investigate the spatial clustering and factors responsible for nutritional deficiency and anemia among reproductive women (15-49 years) in India using the data from National Family and Health Survey-5 (2019-2021). This information is expected to help with district-level policy formulation and advocacy, which can, in turn, can play an important role in reducing nutritional deficiency and anemia among women. The results of spatial analysis show the Moran’s Index (MI) for underweight (MI = 0.68), overweight/obesity (MI = 0.72), and anemia (MI = 0.62) indicates a high level of spatial-autocorrelation (P < .001) (i.e., districts are similar to each other) exists across the districts in India. A total of 156, 143, and 126 hot-spot districts are detected for underweight, overweight/obesity, and anemia, respectively. The burden of undernutrition and anemia is higher in rural areas. Risk of undernutrition and anemia are both reduced by media exposure and eating habits. Low income and low education level rises the risk of anemia and undernutrition, while obesity shows an inverse trend with income and education level. Based on these findings, the present study recommends to implement a district level policy by targeting hot spot districts. The needful preventive measures as suggested in the study can also be implemented to control the incident and burden of women’s malnutrition and anemic status in India.
Introduction
Most of the low-income and middle-income countries are affected by the double burden of malnutrition. 1 Malnutrition is defined as poor nutritional condition that encompass both undernutrition and over nutrition. According to the World Health Organization (WHO), approximately 2 billion adults (>18 years age) are overweight or obese, while around half a billion adults are expected to be underweight in 2017. 2 On the other hand, approximately 30% of reproductive women (15-49 years) suffer from anemia. 3
Malnutrition arises from an imbalanced diet and poor health care facilities, which are the consequences of political instability and conflicts, inequality in society, poor economic development, and the dimensions of globalization. 4 The nutritional status of an individual is dependent on socioeconomic, cultural, physiological, and environmental factors. Women are more likely than men to suffer from nutritional deficiencies for a variety of reasons, including women’s reproductive health, poor social status, poor economic condition (poverty), and lack of education. Disparities in domestic work routines and sociocultural practices can also increase the likelihood of malnutrition in women. In a better socioeconomic setting, women tend to be over nourished, resulting in obesity and related health issues. In households with stable economic conditions, obesity can be observed due to food abundance, a lack of information about balanced diets, cultural discrimination, and a sedentary lifestyle. 5,6 In this respect, Deaton and Drèze (2009) clearly indicated that “India’s nutrition situation is full of puzzles.” 7
Anemia is one of the foremost public health concerns affecting people. 8 Anemia among women can cause physical and cognitive impairments 9 and also have adverse effects on their capability to work and may result into untoward pregnancy outcomes. 10 It also increases the risk of maternal and infant death including low birth weight and preterm birth. 9,11,12
Between 2016 and 2021, the prevalence of undernutrition among reproductive age women in India has decreased; while the incidence of overweight or obesity increased (from 21% to 24%). 13 Anemia prevalence has increased in the country, from 53% to 57% between 2016 and 2021. 13
The present study aims to find out the hot-spot districts and factors associated with underweight, overweight/obesity, and anemia among reproductive women (15-49 years) in India. The findings from the study will help to understand the spatial prevalence and will help to detect the hot-spot districts (higher prevalence districts) of malnourishment and anemia in India. This information is expected to help with district-level policy formulation and advocacy, which can, in turn, can play an important role in reducing nutritional deficiency and anemia among women.
Methods
Data Source
This was an analysis of National Family Health Survey (NFHS-5) of India, 2019-2021. The study was restricted to pregnant women. The study was checked for outliers in the data using an informal technique given by Dunn and Clark in 1974. 14 In order to detect anomalous body mass index (BMI) and anemic levels using a scatter plot, certain participants were excluded from the study as their data had the potential to influence the outcomes. 15 Finally, a total of 661 240 women were selected for the final analysis. The age restrictions and outlying observations removal are the reasons for reduced sample size. The dataset can be downloaded from https://dhsprogram.com/data/ and can be accessed for free.
Dependent Variable
Nutritional status
Three dependent variables were measured in the study’s outcome: underweight, overweight or obesity, and anemia. Nutritional status was determined by BMI (kg/m2) and it was classified based on the WHO (1998) criteria as follows: underweight (<18.5), normal weight (18.5-24.9), overweight (25.0-29.9), and obese (≥30.0).
During the logistic regression analysis, the following categorization was employed: a value of 1 was assigned to underweight women while all others received 0; overweight or obese women were marked as 1 and all others 0; and anemic women were classified as 1 while other women received 0. A finger prick was used to collect blood samples, which were then transferred to a microcuvette for analysis. On-site testing was conducted using a battery-powered portable HemoCueHb 201 + analyzer to determine hemoglobin levels. Individuals with a hemoglobin level of less than 12 g/dL were classified as having anemia.
Independent Variables
Following a previous study, 4 the independent variables were chosen. Region (north, east, northeast, central, west, and south), place of residence (urban and rural), religious group (Hindu, Muslim, Christian, and others), wealth index (poor, middle, and rich), women’s age (15-24 years, 25-34 years, 35-49 years), education (no education, primary, secondary, and higher), exposure to mass media (never, occasionally, or every day) and eating habits (takes milk or curd, eats pulses or beans, eats dark green leafy vegetables; eats fruits, eggs, fish, chicken meat, eats fried food, and drinks aerated drinks) are considered independent variables. 4
Statistical Analysis
Univariate and bivariate analyses were performed with the help of Stata 14 software. In the end, a multivariable logistic regression was conducted to assess the combined effect of covariates on various dependent variables. We estimate dichotomous logit for the dependent variables (underweight, overweight/obesity, and anemia) and considered 1%, 5%, and 10% of significant level for all statistical tests.
Spatial Analysis
The present study uses ArcGIS 10.8 and GeoDa 1.18 software to understand the spatial clustering of malnutrition as well as anemia across the 707 districts in India. In order to demonstrate the existence of identifying hotspot locations between districts, we utilized Moran’s I and Local Indicators of Spatial Autocorrelation (LISA) to gauge the level of autocorrelation among neighboring districts. The use of Moran’s Index allows for an assessment of clustering intensity (measured by Z-score) at increasing distances. The resulting z-score can indicate the degree of clustering, which typically increases as the distance between data points increases. However, the z-score peaks at a certain distance, revealing distances where clustering is most prominent. 16,17 The current study employed LISA statistics to identify areas of high incidence of underweight, overweight/obesity, and anemia (hot-spot) among children in the study district. LISA values allowed for comparisons of similarity with neighboring districts, and the significance level (P values) was assessed for each location. Additionally, LISA maps were generated to represent 5 possible outcomes: high values clusters (hot spot or high-high), low values clusters (cold spot or low-low), outliers surrounded by low values (high-low), outliers surrounded by high values (low-high), and no significant local autocorrelation.
Results
Prevalence With Geographical Variation of Malnutrition and Anemia Among Women (15-49 Years) in India
The geographical variation of malnutrition and anemia among women across the States/Union Territories (UTs) of India in 2019-2021 is presented in the Table 1. At the national level, the occurrence of undernutrition, over nutrition/obesity, and anemia is approximately 19%, 24%, and 57%, respectively. Prevalence of underweight is more than the national average in 31% (11 of 36) of the States/UTs. Jharkhand (26.3%) has the highest prevalence of undernutrition, followed by Bihar (25.5%) and Gujarat (25.2%). The prevalence is lowest in Ladakh (4.4%), followed by Jammu & Kashmir (5.2%) and Mizoram (5.3%).
Prevalence of Malnutrition and Anemia Among Women (15-49 years) Across the States/UTs of India in 2019-2021.
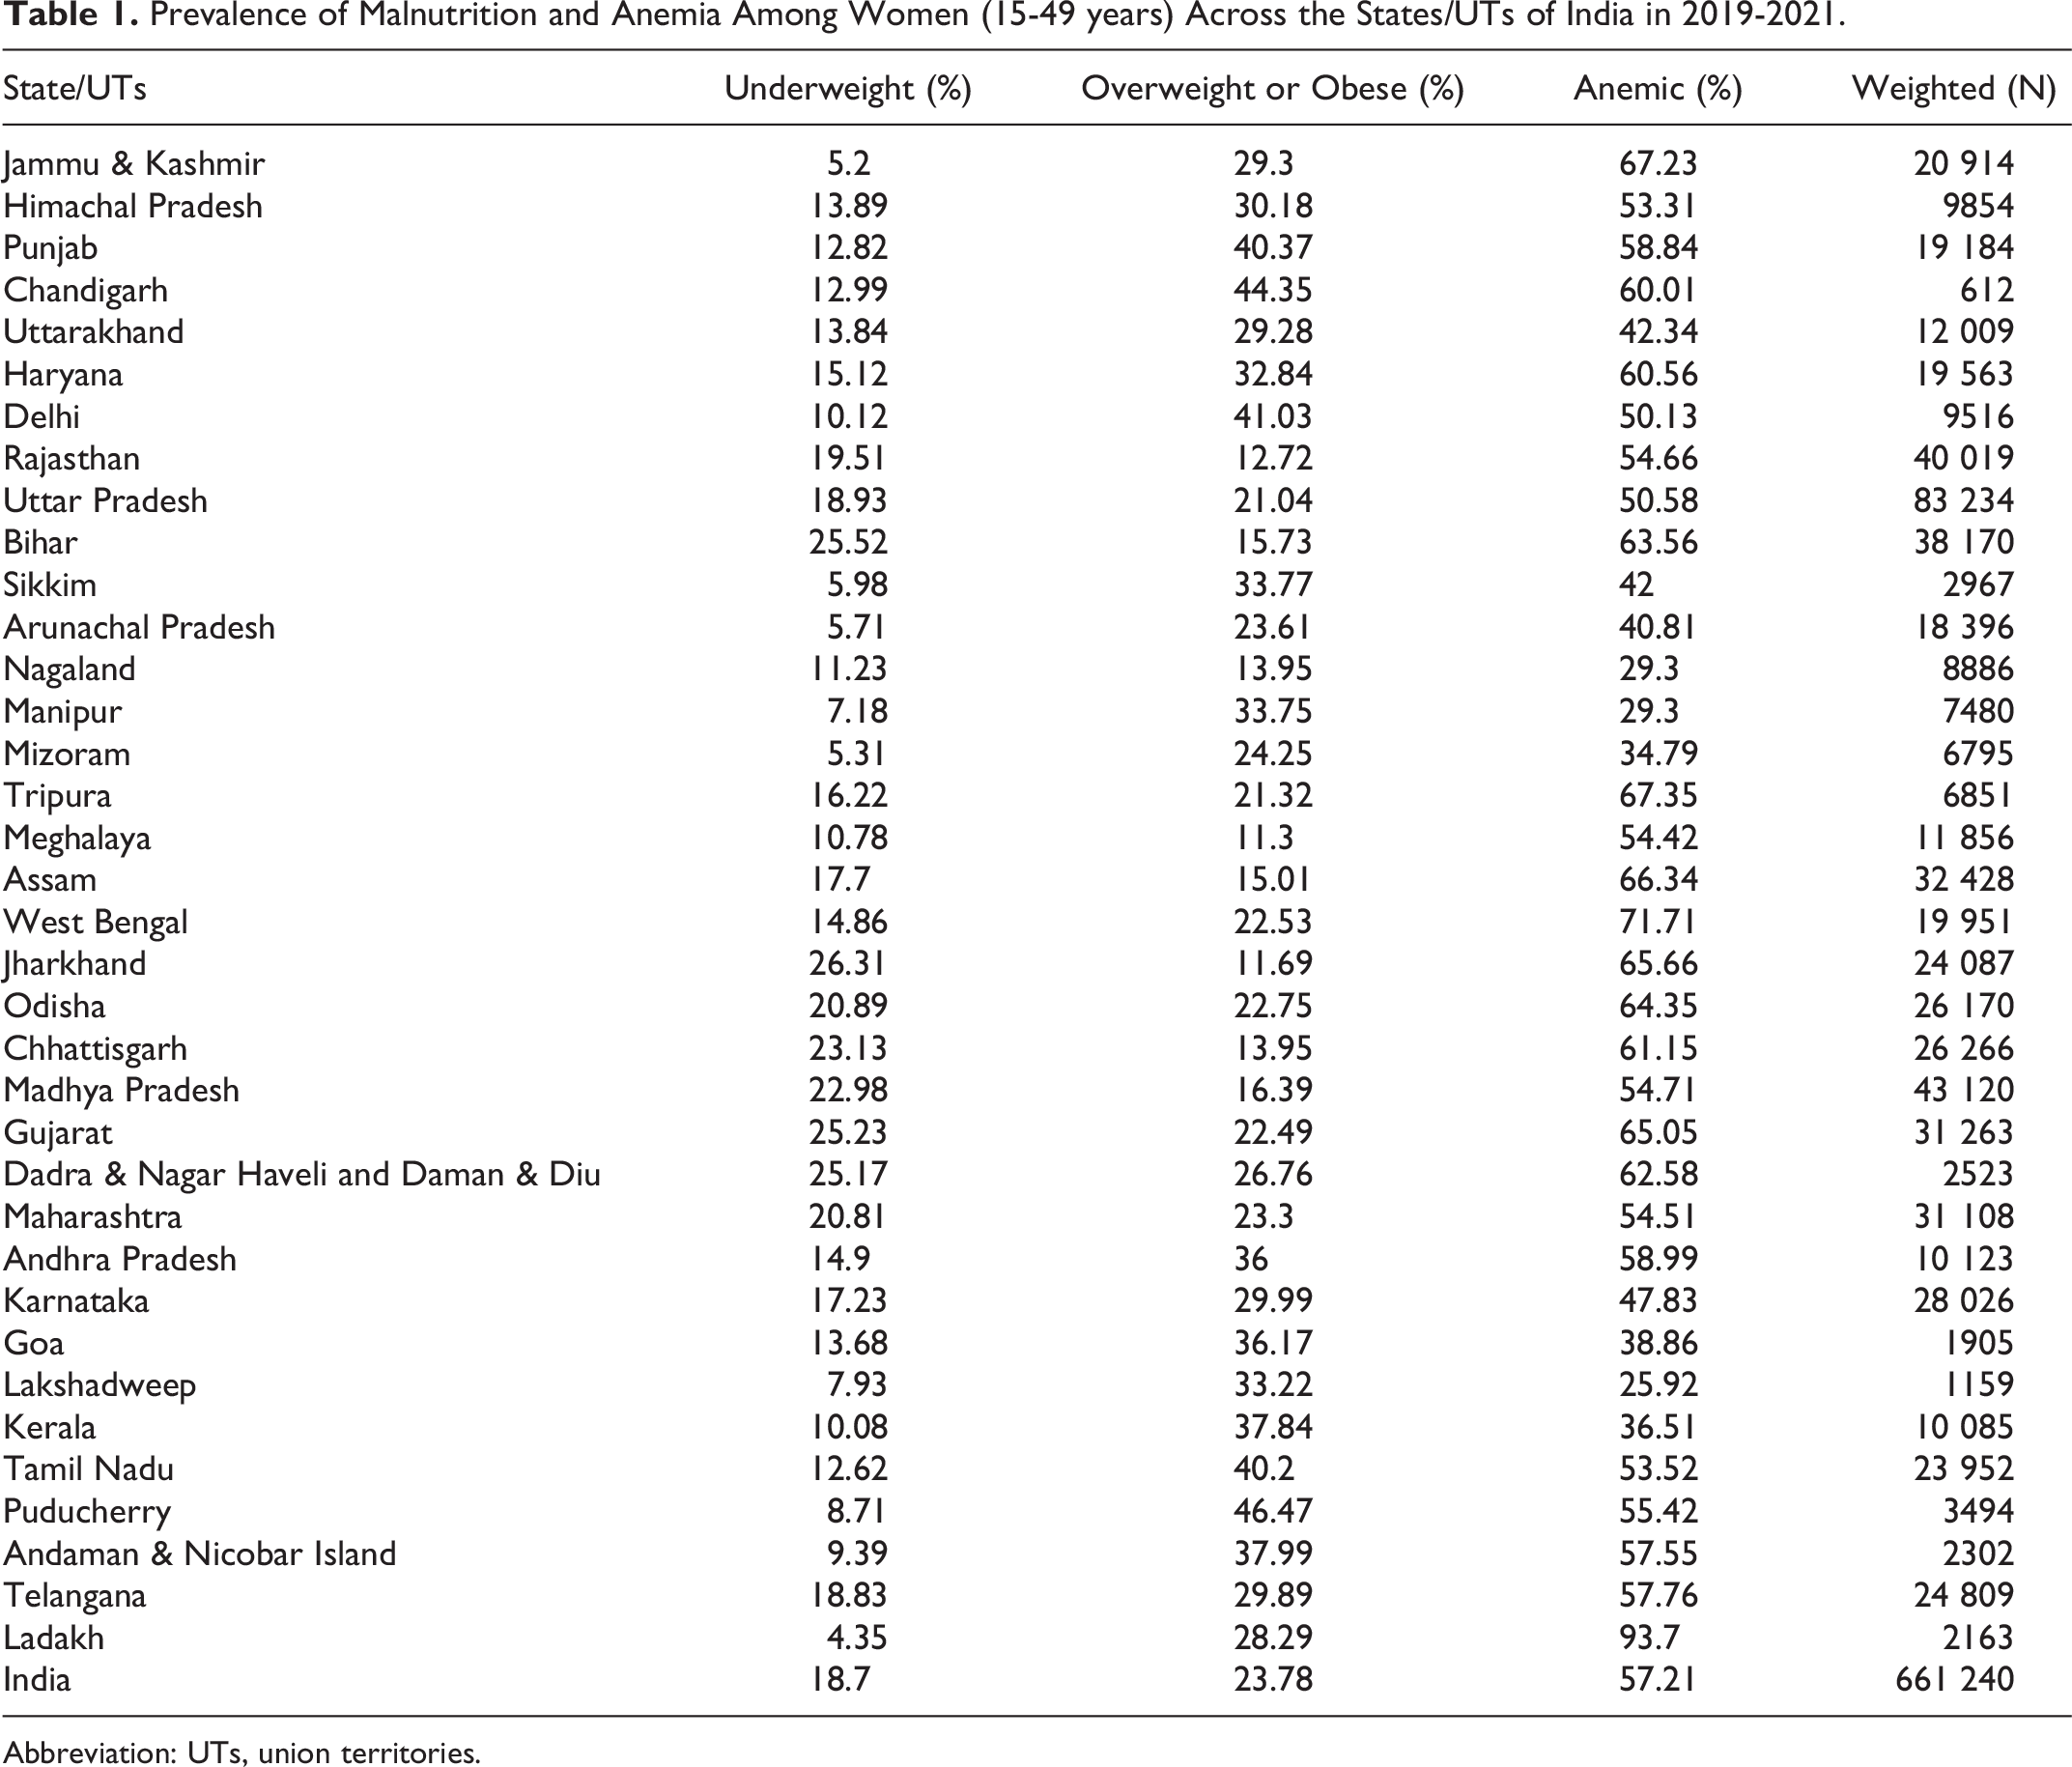
Abbreviation: UTs, union territories.
The incidence of overnutrition and obesity is highest in Puducherry (46.5%), followed by Chandigarh (44.4%) and Delhi (41%). More than half of the States/UTs (21 of 36) have a prevalence greater than the national average. Prevalence was lowest among the states of Meghalaya (11.3%), Jharkhand (11.7%), and Rajasthan (12.7%). Anemia is found to be highly prevalent in Ladakh (more than 90%), followed by states such as West Bengal (71.7%) and Tripura (67.5%). Prevalence is lowest in Lakshadweep (25.9%), Nagaland (29.3%), and Manipur (29.3%) (Table 1).
Hot-Spots of Malnutrition and Anemia Prevalence Across the Districts in India
Moran’s Index for underweight, overweight/obesity, and anemia were 0.68, 0.72, and 0.62 (P value < .001) respectively, which indicates a high level of spatial autocorrelation exists in the prevalence of undernutrition and anemia across the districts in India (Appendix).
On the basis of the result of this analysis the LISA map has revealed the likely district-level hotspot location of such morbidity incidence in India (Figures 1 and 2). Panel-A highlights the clustering level, and Panel-B shows the significant levels of clustering. The hot-spots (high to high) are shaded in red, and cold spots (low to low) are shown in blue color.
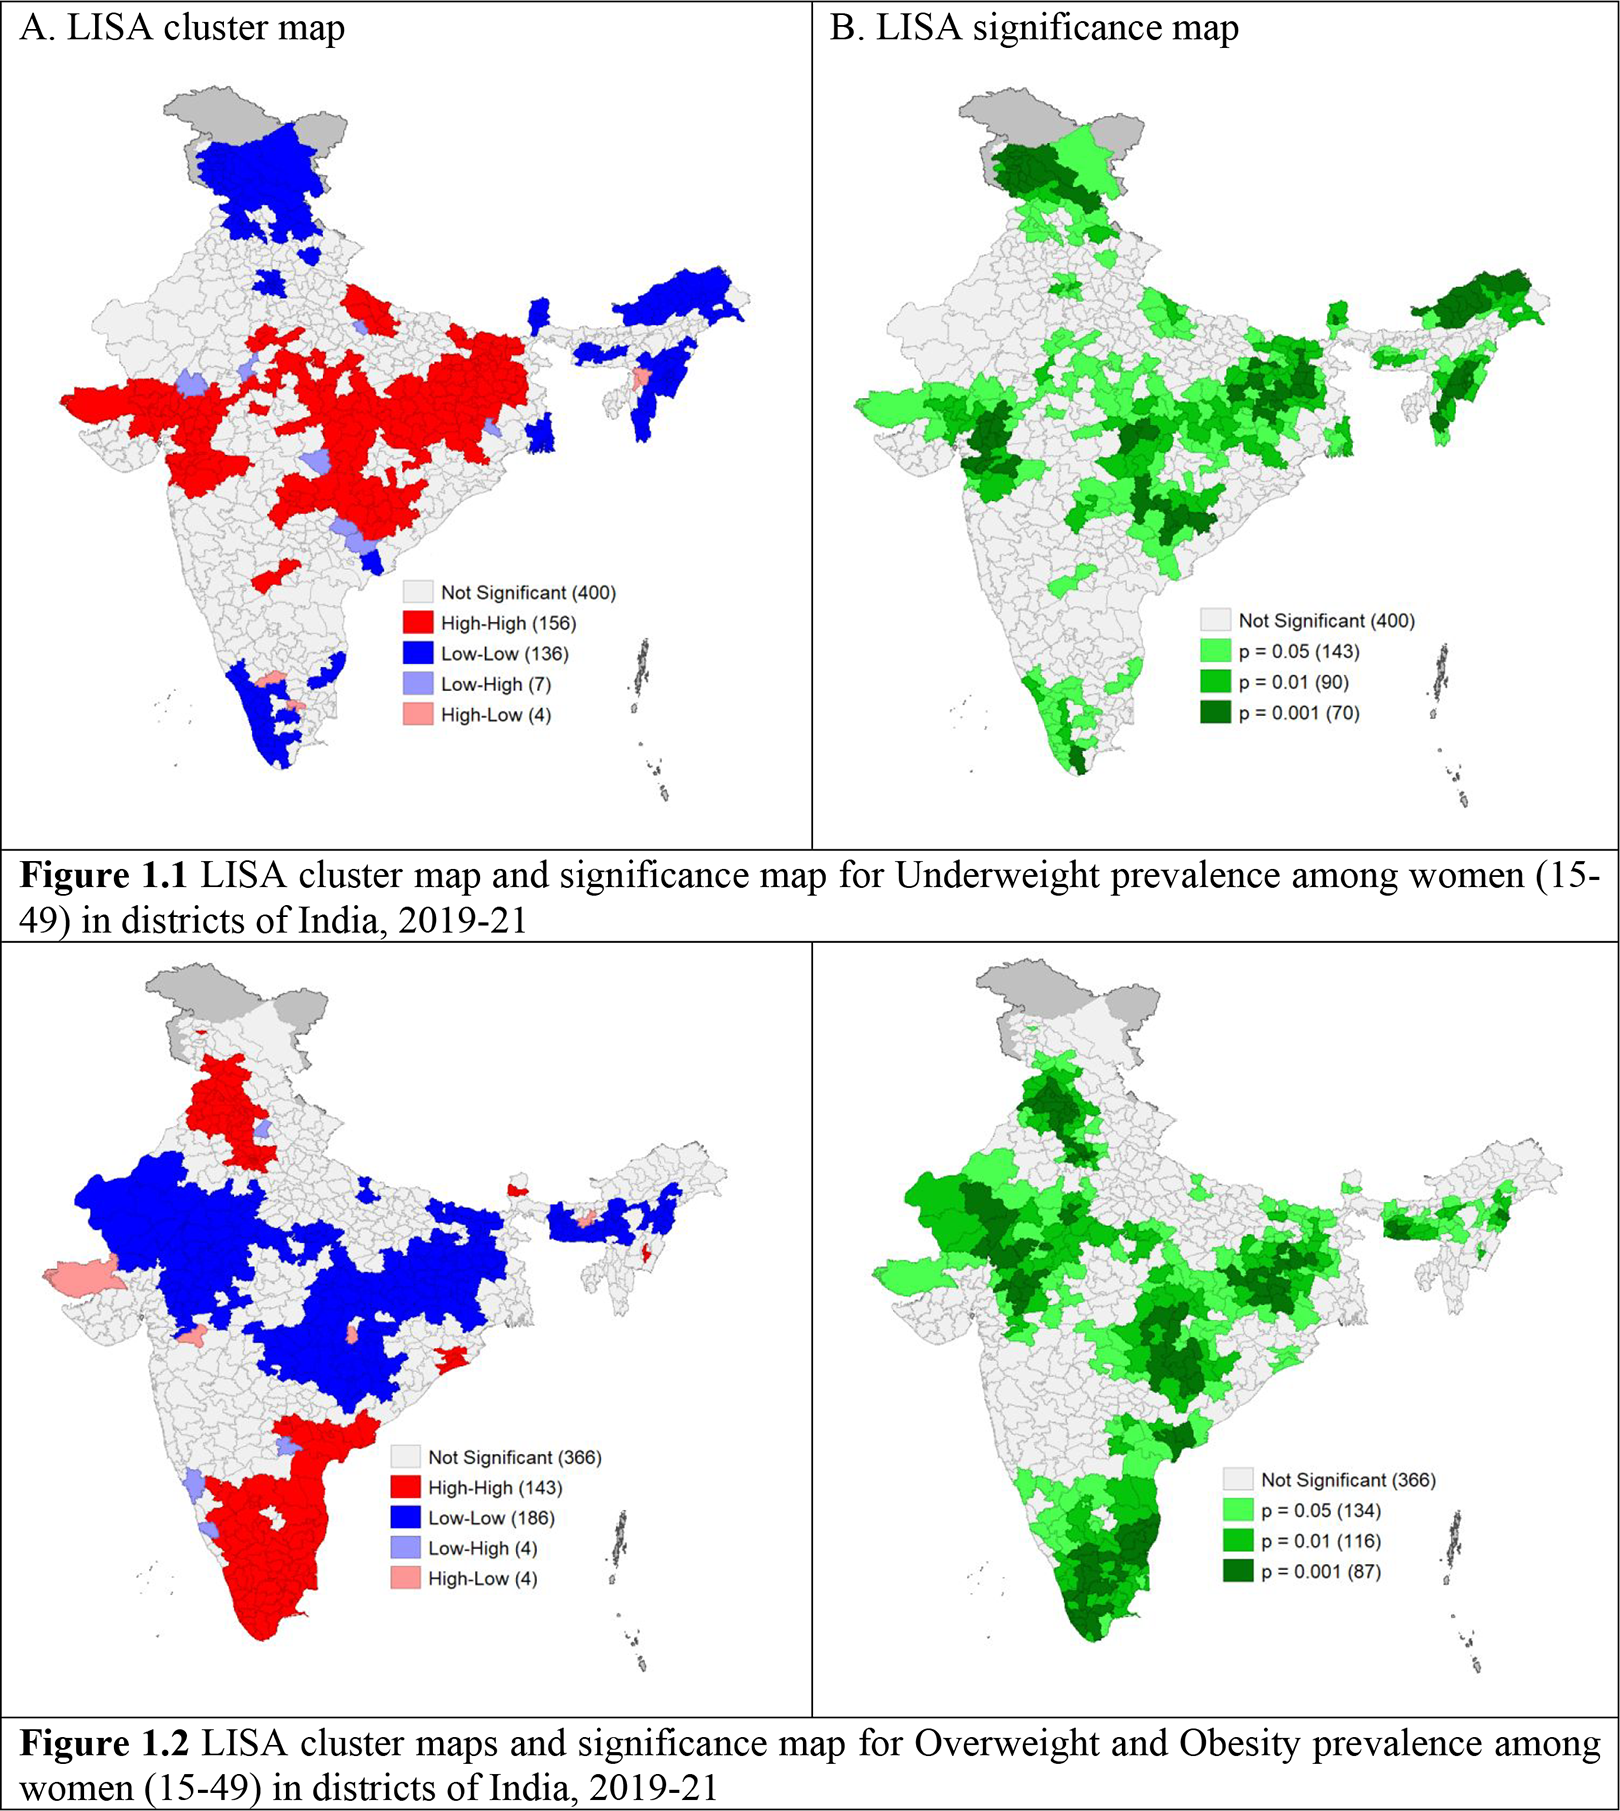
LISA cluster maps and significance map for malnutrition prevalence among women (15-49 years) in districts of India, 2019-2021. LISA indicates Local indicators of spatial autocorrelation.
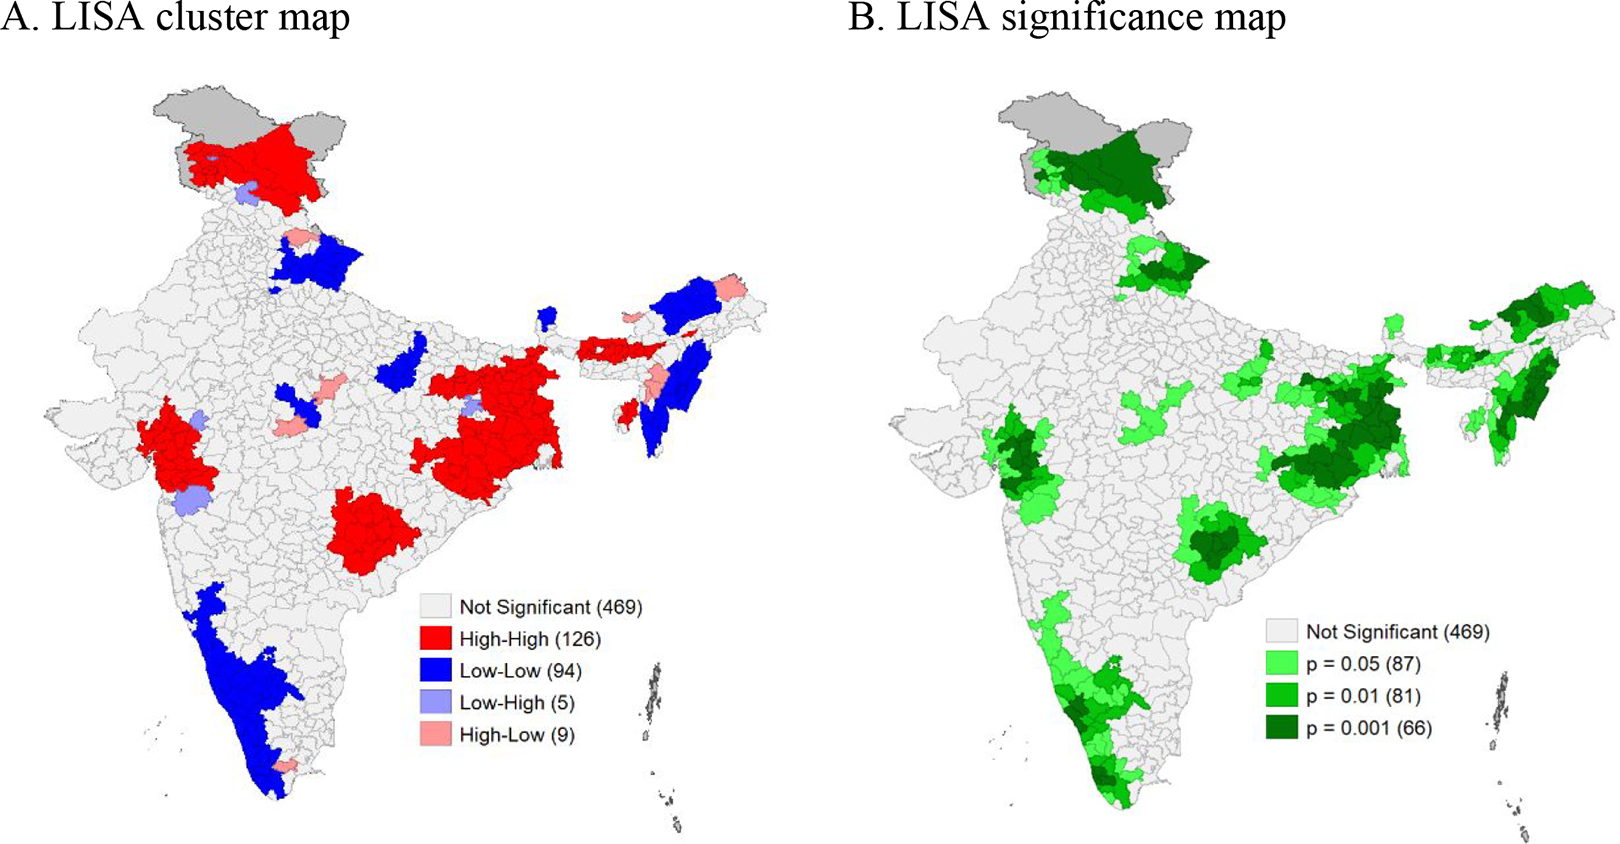
LISA cluster map and significance map for anemia prevalence among women (15-49 years) in districts of India, 2019-2021. LISA indicates Local indicators of spatial autocorrelation.
A total of 156 districts with undernutrition prevalence are classified as “hot spots,” 136 districts are classified as “cold spots,” and 303 districts are reported in clusters with a ≥5% level of significance (Figure 1.1). The majority of the hotspot districts are located in the central, western, and eastern regions of India.
Figure 1.2 depicts the country’s 143 hotspot districts and 186 cold-spot districts for overweight/obesity prevalence. In addition, 337 districts reported in clusters with a ≥5% significance level. Most of the hotspot districts are in the southern and northern parts of India.
On the other hand, for anemia prevalence, a total of 126 districts falls into the hot-spot districts and 94 districts fall into the cold-spot districts (Figure 2); 234 districts are reported in clusters with a 5% level of significance. The majority of the hotspot districts are in India’s eastern, southern, and western regions, with a few in the country’s northeastern and northern regions.
Contextual Determinants of Malnutrition and Anemia Among Women in India
Three separate logistic regressions were carried out (Table 2) taking the binary variables of anemia, undernutrition, and overnutrition as the dependent variables. On the other hand, type of place of residence, region, religion, women’s age, level of education, media exposure, wealth index, and food habit as independent variables.
Logistic Regression Models Assessing Determinants of Malnutrition and Anemia With Background Characteristics of Women Aged 15- to 49-Year in India, NFHS-5 (2019-2021).
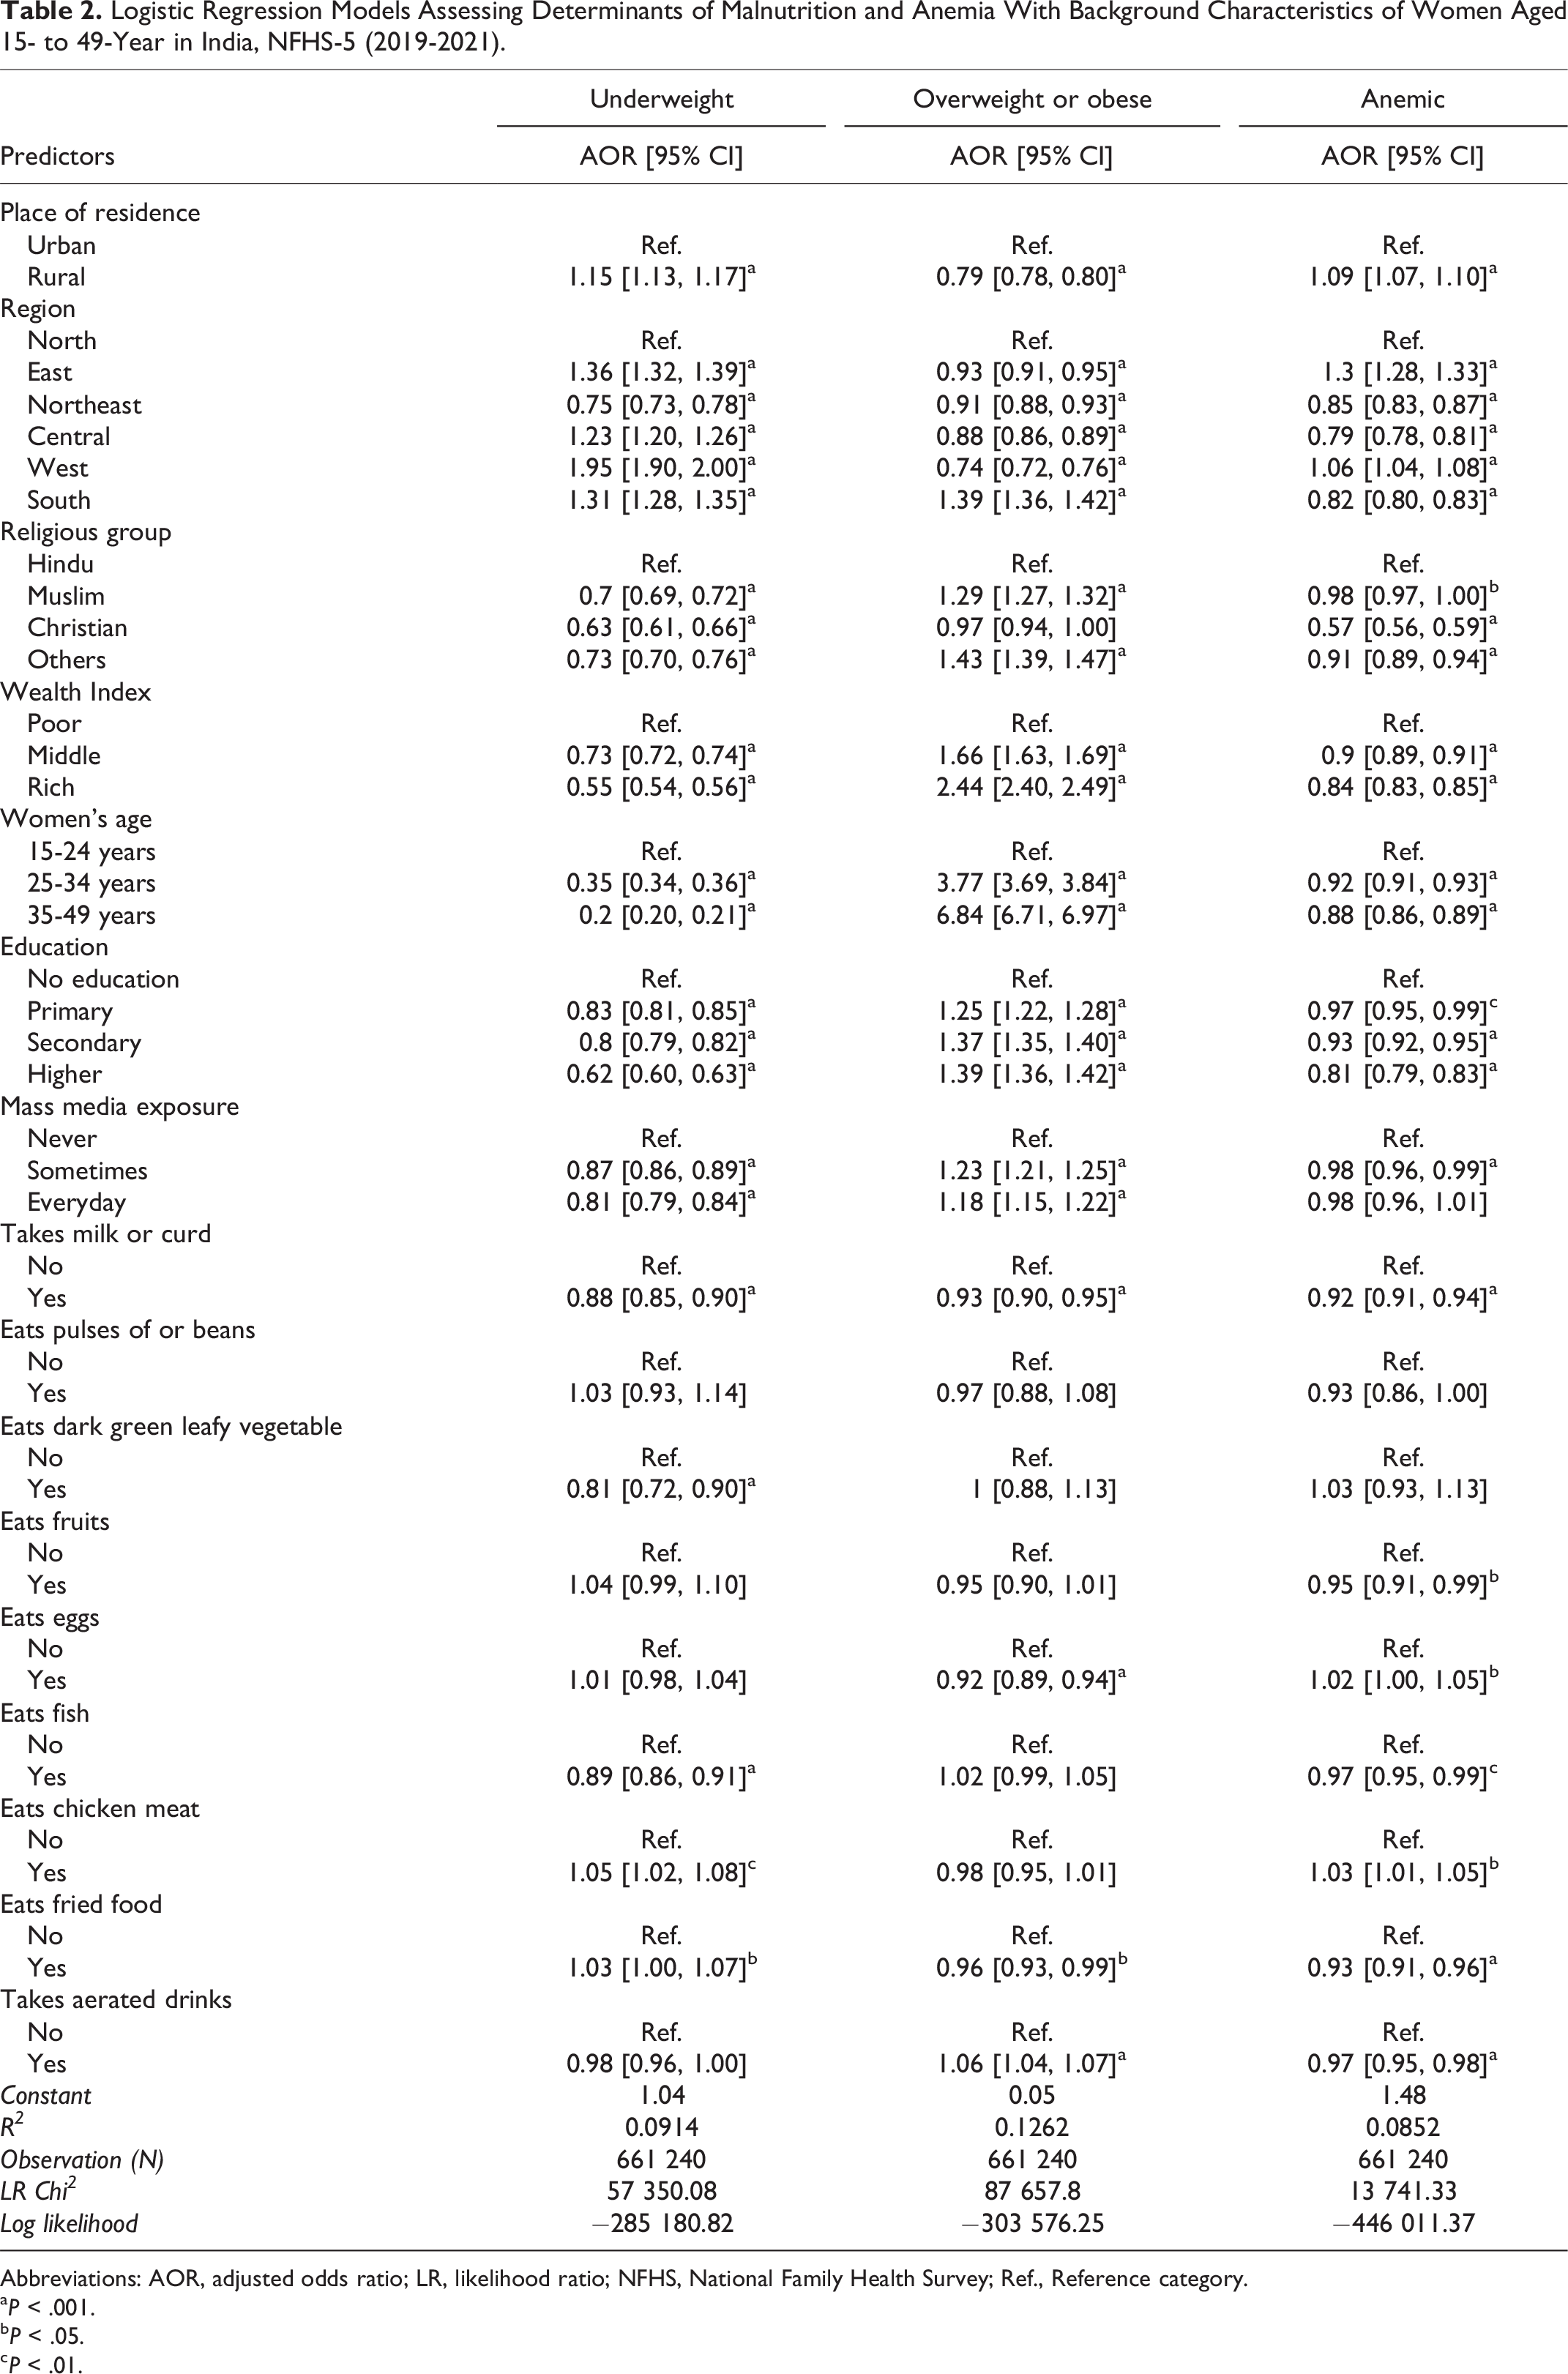
Abbreviations: AOR, adjusted odds ratio; LR, likelihood ratio; NFHS, National Family Health Survey; Ref., Reference category.
a P < .001.
b P < .05.
c P < .01.
Women living in rural areas had 1.15 times higher odds of undernutrition and 1.09 times higher odds of anemia than those living in urban areas. Women living in rural areas (OR = 0.79; 95% CI = 0.78, 0.80) have a lower risk of overnutrition than those in urban areas. As expected, it was found that undernutrition was inversely related to wealth status, education level, and women’s age. A similar trend is seen for anemia as well. The odds of overnutrition, however, are seen to increase with women’s age, education level, and wealth status. The possibility of undernutrition and anemia is lower in all the other religious groups compared to Hindus. Christians had the lowest odds of being malnourished (Table 2).
Women living in western India had the highest possibility of being undernourished, and those living in the eastern region had the highest possibility of being anemic. Women living in the northeastern region had lower odds of developing any form of malnutrition compared to the women in the northern region. In comparison to the other regions of India, women in the southern region had the highest odds of developing obesity or being overweight.
The results showed that women’s nutritional status significantly influenced by media exposure. The incidence of underweight is significantly lower among the women who had regular exposure to media. The odds of being anemic were also lesser among the women who had some exposure to mass media compared to those who had no exposure. However, the risk of overnutrition increased with mass media exposure (Table 2).
The women who consumed milk/curd had statistically significantly lower odds of being undernourished and anemic. As observed from the study, consumption of green leafy vegetables tends to lower the odds of undernutrition. Unexpectedly, no such association was seen with anemia. Women who ate fish were less likely to be underweight compared to who ate chicken. Anemia had shown a similar but weaker association.
Discussion
The present study provides information on the prevalence and spatial clustering on undernutrition and anemia among reproductive women across the districts in India. The present study also identifies the contextual risk factors associated with such a morbid condition.
Our result shows that the highest proportion (35%) of overweight or obese women are from the southern zone and lowest in the northeastern zone (16.8%). The result is consistent with the other study. 18 According to our findings and a previous study, the prevalence of anemia remains highest in the Eastern region. 4 The prevalence of anemia in the northeastern zone (61%) has increased compared to the NFHS-4 findings (39%). 4 This raises concern for the northeastern states, indicating the need for further studies to identify the factors behind it. Spatial analysis reveals a positive autocorrelation between the nutritional status of women and its covariates among the districts of India. Our study’s high autocorrelation indicates that undernutrition and anemia among women are spatially clustered across districts in India. The hotspots found in cases of anemia among women with its covariates were in the eastern, western, and some northeastern regions, similar to another study. 19 In the case of undernutrition among women, the hotspots found were in the eastern, western, and central parts.
Though the prevalence of anemia has decreased over time as a result of various government programs, the situation has improved little among women. 18,20 This may be the reason why more than half of Indian women are anemic, as evident by our result and previous studies. 4,21
Our study has found improvement in undernutrition and anemia status with media exposure (similar to the findings of a previous research). 22 However, obesity, or overnutrition, was found to increase with media exposure. This may be due to the contributing factor of wealth, where people in high-income groups tend to have more exposure to mass media due to its easy accessibility and affordability.
The promotion of fast food through mass media may aggravate the issue of over nutrition in this group of women. 23 The interrelation between socioeconomic conditions and household food insecurity may also be the reason for the higher prevalence of undernutrition and anemia in the poorer, less educated households, 24 which may support the more or less positive effect of the food items on improving undernutrition and anemia evident from the study. Our study shows consumption of aerated drinks tends to lower the odds of anemia unlike a previous study. 4
The result from our study shows the burden of undernutrition and anemia in rural areas is higher, similar to various studies. 23,25 Other studies have also found an increasing trend in the prevalence of obesity/overweight over time, which is forecasted to further increase significantly over the coming years. 25,26 Though our study shows an increasing trend of over nutrition and a decreasing trend of undernutrition and anemia with age, other studies show a more variable finding. However, low income and lower education status are found to be strong predictors for anemia and undernutrition, which is consistent with various studies at the national and international level. 4,23,27 On the other hand, obesity shows an inverse trend with income and education level. 23,28 There is a need for policy-level interventions that are tailored to control the dual burden of malnutrition, taking into account the economic and social disparities that women face in both rural and urban areas. The present study can help in the policy intervention as it has identified the hot-spots and the some of the associated predictors behind malnutrition and anemia, 2 serious public health concerns among women of reproductive age.
The inherent limitations of cross-sectional studies are applicable to this study as well. Temporality or causality cannot be established through this study, and only inferences can be made. However, the result of this study can be generalized to the national and subnational levels. This study is the first of its kind that uses NFHS-5 data, which is a nationally representative survey of India, to understand the spatial distribution of the nutritional status of women in the reproductive age-group and associated risk factors.
Conclusions
The present study based on NFHS-5 (2019-2021) not only identifies the high prevalence and hot-spot districts of malnutrition and anemia for India but also the factors associated with the diseases. The study has found that improved awareness among the people on dietary intake along with intervention to curb the socioeconomic differences can lessen the risk of such morbid conditions. Lower socioeconomic status, less awareness and low dietary intake increases the risk of malnutrition and anemia. There is also significant regional disparity. Based on these findings, the present study recommends to implement a district level policy by targeting hot spot districts. The needful preventive measures as suggested in the study can also be implemented to control the incident and burden of women’s malnutrition and anemic status in India.
Footnotes
Appendix
Declaration of Conflicting Interests
The author(s) declared no potential conflicts of interest with respect to the research, authorship, and/or publication of this article.
Funding
The author(s) received no financial support for the research, authorship, and/or publication of this article.
References
Supplementary Material
Please find the following supplemental material available below.
For Open Access articles published under a Creative Commons License, all supplemental material carries the same license as the article it is associated with.
For non-Open Access articles published, all supplemental material carries a non-exclusive license, and permission requests for re-use of supplemental material or any part of supplemental material shall be sent directly to the copyright owner as specified in the copyright notice associated with the article.