
Abstract
Background:
Maize flour in Uganda is milled by hundreds of enterprises, mostly small- (5-20 metric tons [MT]/day) and micro-scale (<5 MT/day) mills or firms. A mandatory maize flour fortification program exists for medium-scale mills (>20 MT/day) and policymakers are considering including smaller-scale millers.
Objective:
We estimated the private and public costs of maize flour fortification at different scales and explored their implications for extending the mandatory fortification to include smaller-scale mills.
Methods:
We used secondary data on the structure of the maize flour market and primary data on milling and fortification costs to estimate mill and regulatory costs at 3 scales of flour production: micro, small, and medium.
Results:
For micro-, small-, and medium-size operations, respectively, operational costs of fortification were US$13, US$9, and US$7 per metric ton (MT) of maize flour, which represented 20%, 16%, and 16% of annual operating costs, and the ratio of fortification equipment cost to mill equipment costs was higher for micro-scale mills (2.7) than for small- (0.38) and medium-scale (0.54) maize mills. Governmental regulatory costs rise if smaller-scale mills are included due to the increased number of facility inspections.
Conclusions:
Fortification and regulatory costs increase as production scale decreases. Up-front capital costs of fortification would be daunting for micro- and small-scale mills. Medium-scale mills, which supply social protection programs, might be able to manage fortification costs and other challenges. Decision-makers should consider all costs and cost burdens, and the realities of enforcement capabilities before expanding fortification programs to include smaller-scale operations.
Plain language title
Costs of Small-scale Maize Flour Fortification in Uganda
Plain language summary
A study of the costs of adding vitamins and minerals by small-scale maize flour millers in Uganda was undertaken to understand if it would be commercially beneficial from a business and operations perspective for them to do so, and if requiring them to do so would impose additional cost burdens on government to ensure that fortification standards were met.
Why was the study done?
Maize flour is consumed by the majority of Uganda’s population, especially the rural poor. If the flour were fortified, it would reduce vitamin and mineral deficiencies among those at risk. The most important constraint to market-wide fortification is the presence of many small-scale mills or firms that neither have the resources nor the technology to adopt and sustain the fortification process. To date, no study has been done to calculate the costs that small-scale mills would have to face to fortify flour, or what the cost implications for government would be for including smaller-scale mills in a national fortification program, including the costs of enforcing regulations.
What did the researchers do?
The researchers interviewed millers of several scales of operation to collect cost information on their operations and interviewed representatives of government regulatory bodies to estimate the costs of testing maize flour to ensure compliance with regulations. Researchers estimated the cost to the mills of adding fortification to their business models, and the impacts on the government costs (eg, testing additional samples, etc.) of including smaller-scale mills in the fortification program.
What did the researchers find?
The researchers looked at 3 different types of mills based on their capacity to mill maize flour—micro-scale firms milled less than 5 metric tons (MT) a day, small-scale firms milled 5 to 20 MT per day, and medium-scale firms milled over 20 MT a day. For micro-, small-, and medium-size firms, respectively, fortification increased operational costs by US$13, US$9, and US$7 per MT of maize flour, which represented 20%, 16%, and 16% of annual operating costs. Similarly, governmental regulatory costs rose if smaller-scale mills were included because of the increased number of facility inspections required since the current legislation requires mandatory annual inspections.
What do the findings mean?
Fortification and regulatory costs increase as the scale of production by the millers decreases. If fortification by small- and micro-scale mills were made mandatory, up-front costs of fortification equipment and materials would be daunting for micro- and small-scale millers. Ugandan medium-scale millers might manage fortification costs and other challenges, but only if the social protection programs they supplied were of sufficient volume and regularity.
Introduction
Inadequate intake of micronutrients, as one of the causes of micronutrient deficiencies, remains an important public health concern with important nutritional, health, and other consequences. 1,2 Food fortification, the addition of vitamins and minerals (micronutrients) to commonly consumed foods and condiments, when appropriately designed and implemented, can be an effective and cost-efficient strategy to increase the supply of micronutrients to populations. 3 -9 However, much of the available evidence is based on industrialized, large-size, and centralized production processes.
In many countries, the structure of the production of staple foods and condiments is highly fragmented and skewed toward small-scale operations, in some cases comprised of thousands of decentralized small-scale mills or firms (we use the 2 terms synonymously to refer to production facilities), 10 -12 and fortification costs at this scale might be high. Indeed, recognizing the difficulty associated with involving smaller-scale production facilities in national fortification programs, most food fortification programs target “fortifiable foods,” 13 “large-scale food fortification (LSFF),” 14,15 and “industrial-fortification” 16 which have been deemed more efficient from the points of view of food producers and regulatory agencies. Modeling exercises also tend to focus on the proportion of any fortifiable vehicle that is produced (domestically or abroad) by large-scale operations. 17,18 This effectively removes smaller-scale, “infeasible” 7 producers from the calculations of expected nutritional benefits and costs, suggesting that insurmountable technical and cost issues will emerge at any and all scales of production below that of large, industrial producers. Nevertheless, driven by consumption patterns of the population in lower socioeconomic strata, for more than 30 years fortification of foods produced by smaller-scale firms has been considered and in some cases promoted to reach these populations vulnerable to micronutrient deficiencies. 19,20
The adoption of food fortification as a public health strategy to reduce micronutrient deficiencies in Uganda dates back to the late 1990s when the Ugandan government made iodized salt compulsory. 21 By 2002, the Ministry of Health established a National Working Group on Food Fortification with other government agencies, private sector industries, academia and civil society, and development partners to consider and support the fortification of other commodities. 21 This partnership resulted in the initiative to fortify vegetable oil with vitamin A, and maize and wheat flour with multiple micronutrients (including vitamin A, vitamin B1, vitamin B2, niacin, vitamin B6, folic acid, vitamin B12, iron, and zinc), and which started to be implemented as early as 2005. 21
By 2017, Uganda was fortifying 60% of its vegetable oil and 100% of its wheat flour. 22 Furthermore, 2 mid-size maize flour millers started fortifying in 2005 with the support of Micronutrient Operational Strategies and Technologies (MOST), the United States Agency for International Development (USAID) Micronutrient Program (1999-2005), and a regulation was enacted in 2011 to request facilities that manufacture 20 metric tons (MT)/day of maize flour or more to mandatorily fortify this product. 23 One miller producing above this threshold at the time of this study had chosen not to produce for the national market (focusing on international outlets for its products, mainly food assistance products). In reaction to this regulation, several mills have adjusted production volumes so as to remain below the threshold that would require fortification. 10 In essence, the regulation as written may be hampering both capacity utilization and industry consolidation.
The Ministry of Health, the Uganda National Bureau of Standards (UNBS), the Uganda Revenue Authority (URA), the Uganda Industrial Research Institute (UIRI), and the National Drug Authority (NDA) are key agencies in enforcing and monitoring the national fortification programs. The Ministry of Health is in charge of overseeing use and benefits (potential and realized) of the fortified foods at the household level, and it is the custodian of the food fortification regulations.
That said, the desire to include smaller-scale operations in food fortification programs has persisted in Uganda, where its Nutrition Action Plan of 2011-2016 24 (re)identified staple food fortification, which includes fortification of maize flour, as part of its strategy to reduce micronutrient deficiencies. Simultaneously, Uganda’s neighboring countries have developed and promoted special fortification equipment to be adapted to smaller-scale firms. 20,25 The Ministry of Health and other stakeholders including the Ministry of Trade Industry and Cooperatives are currently considering the inclusion of smaller-scale mills into the mandatory fortification program.
In this article, we identified, in Uganda, 3 categories of maize flour production operations (micro- <5 MT/day, small- 5-20 MT/day, and medium-scale >20 MT/day) and estimated the costs that firms and regulatory agencies would incur if fortification were required, for each scale-specific category. We included both the up-front investment and operational costs to firms of fortification, as well as governmental enforcement costs related to maize flour fortification.
Methods
Maize Flour Value Chain and Categories of Scales of Production
We developed a value chain framework to describe the operations and to estimate costs of maize flour fortification at different scales of production (Figure 1).
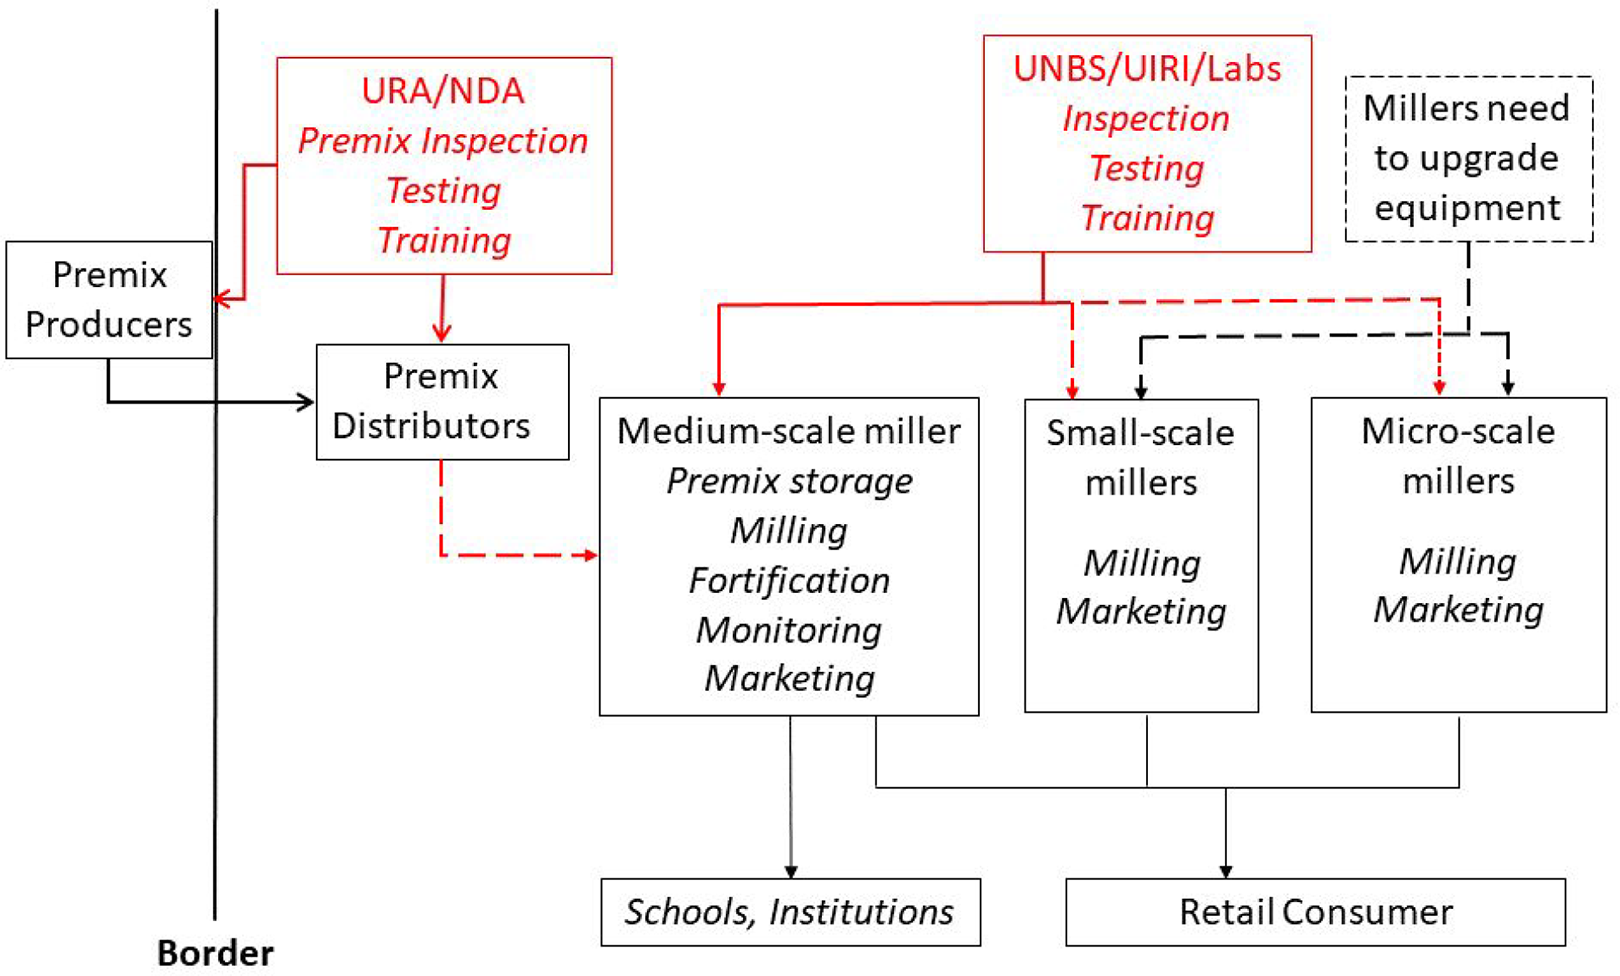
Maize flour fortification value chain. Figure showing the relationships among the various stakeholders that would be involved in production and sale of fortified maize flour. Italicized text in each box refers to the role of the listed stakeholder in the implementation of the fortification program and for whom we were able to obtain costs associated with that role. Solid lines indicate existing relationships; dashed lines indicate relationships that would need to be established. NDA indicates National Drug Authority; UIRI, Uganda Industrial Research Institute; UNBS, Uganda National Bureau of Standards; URA, Uganda Revenue Authority.
The value chain provides a general overview of the processes of milling and fortification in Uganda, from procurement of a micronutrient premix to the consumption of fortified food at the population level. In the framework, we have indicated with dashed lines the additional actions to undertake and linkages to create if the fortification program were extended to varying scales of milling operations.
Regarding scales of maize flour production, the Uganda Micro, Small, and Medium Enterprise (MSME) Policy classifies micro-, small-, and medium-scale enterprises as having 1 to 4, 5 to 50, and 50 to 100 employees, respectively. 26 For the purposes of this study and based on the 2017 maize market mapping report, 10 we identified 3 scale-specific subcategories of maize milling operations; micro- (<5 MT/day), small- (5-20 MT/day), and medium-scale (>20 MT/day), categories that roughly coincided with employee-focused MSME classifications.
Data Collection
We carried out this study between January and June 2018. We used a two-stage approach to gather information on maize milling and fortification: (a) a review of available documents and reports on the size and structure of the maize flour market; and (b) key informant interviews with stakeholders to gather information about experiences with and views about fortification.
We reviewed reports on maize production 27,28 and the structure of the maize milling industry. 10 We contacted stakeholders involved in all stages of the milling and fortification process—government representatives from the Ministry of Health; Ministry of Trade, Industry and Cooperatives; UNBS; NDA; UIRI; URA; Private Sector Foundation of Uganda; private sector representatives of micro-, small-, and medium-scale maize millers; a premix supplier; and the developer of a dosifier to add the premix in micro- and small-scale mills.
We subsequently carried out key informant interviews with millers in 8 districts in the Central and Eastern regions of Uganda, which reported the largest number of maize millers (38% and 22% of all maize millers in Uganda, respectively). 10 Finally, we used purposive sampling to select 9 micro-scale, 2 small-scale, and 1 medium-scale maize miller for detailed cost data collection. In addition to collecting costs, we visited mills to observe milling facilities and operations, and to assess access to facilities for internal or external quality monitoring of flour, premixes, and fortified products. We collected public sector costs in interviews with representatives from UNBS, NDA, and UIRI.
To understand the potential roles of the private and public sectors in any proposed maize fortification program, we asked all key informants about their visions of the potential roles of micro-, small-, and medium-scale firms in the national fortification program. All this information and data served as inputs to calculate costs (by scale of operation) at each stage of the value chain framework, and to inform scale-specific discussions about operational challenges that a mandatory fortification program might impose (again, by scale of operation).
Cost Calculations
Mill operational and fortification costs
We developed and used field data collection instruments to consistently collect data from maize millers and other key informants (premix suppliers and regulatory agency representatives) (note 1). We assembled data and developed 3 cost models for each scale of operation, in scale-specific spreadsheets.
To arrive at summary national estimates for each scale (micro, small, and medium) of production, we calculated the average cost of various components for the millers within each scale categories. Scale-specific cost models contained information on the following: daily and annual production of unfortified flour, investment costs (depreciated value of milling machinery), operational costs (which included salaries, rents, electricity or fuel, if machines were powered by gasoline, storage, packaging, marketing (note 2)), and regulatory costs (sampling, testing, certification, and licensure for products). We also incorporated scale-specific information on the operational process of maize flour production.
This information informed some of the cost model’s key assumptions. For example, we assumed 8 months of “in-maize-season” milling (173 days, milling 6 days/week), with 4 months of “off-season” production (87 total milling days, milling 3 days/week), during which the millers used stored grain and the mills incurred 50% lower operational costs (note 3). Combined, this is equivalent to approximately 220 days of operation and costs incurred during a given calendar year (our temporal unit of analysis). We also assumed a 5% loss of grain between miller purchase point and finished milled flour product, based on the average of losses reported by the millers, and a 7% annual depreciation rate, a 15-year life span, and zero salvage-value for all equipment.
We also collected data on fortification costs (capital costs for equipment such as dosifiers and batch mixers; the purchase, transport, and storage of micronutrient premix [information provided by a premix supplier in Uganda]; internal quality control testing of fortified flour) from the medium-scale miller in our sample that was fortifying maize flour. Since, no micro- or small-scale millers were fortifying their products when we collected study data, we used unit-costs (eg, cost of premix per MT of fortified flour) related to fortification provided by medium-scale millers to estimate the costs that these smaller-scale millers would face if they chose, or were compelled to, fortify. In reality, fortification costs faced by micro- and small-scale would likely be higher, in part because of the transaction costs associated with investments in machinery, changes in business operations, and regulatory compliance that micro- and small-scale millers would incur.
Finally, we obtained product prices by the producers for fortified and unfortified flour. This allowed us to estimate the change in product price attributable to fortification.
Public-sector fortification program costs
Finally, we collected data on recurring government costs, which represent the public costs of monitoring flour mills and their product. We included 2 main costs in this category—NDA costs of testing premix, and UNBS costs of inspecting and monitoring maize flour. Since the costs of tests will be similar for all scales of production, the cost differences between the different production scales lies in the number of mills (note 4).
We used the data reported on different scales of production using the Strengthening Partnerships, Results, and Innovations in Nutrition Globally (SPRING) project’s maize millers mapping study in the 4 regions of Uganda to estimate the total number of millers, by scale of production in all the regions of Uganda—Central (24 districts), Eastern (32 districts), Western (26 districts), and Northern (30 districts) regions. 10 SPRING project’s maize millers mapping study developed an estimate, from a convenience sample of districts in the Central (15 districts), Eastern (12 districts), Western (13 districts), and Northern (9 districts) regions, and surveyed a convenience subsample of millers in these districts. We used the report’s breakdown of millers, by scale, by included district, and extrapolated those numbers to the districts not included, and arrived at an estimated number of millers, by scale, in the 4 regions. We first calculated the average number of millers per included district in the report, and then used that average to estimate the number of millers in the districts that were excluded from the study and summed the 2 numbers. This allowed us to calculate the annual national public sector costs for all millers by scale of operation.
We used these costs to summarize the resources required for national regulatory monitoring and enforcement. Since the SPRING study was a convenience sample, we assumed that our total count of millers in the 4 regions underestimates the actual number of millers in Uganda. For all scales of millers, we also estimated annual certification and recertification costs. The certification process includes an annual audit, product testing, issuance of permit, calibration of instruments, medical fitness tests of staff, assessment of suitability of premises, and includes a cost of a consultant to help the miller navigate the certification process. Annual recertification includes all of the above, but the total cost is lower as the miller already possesses a certificate, so the consultant input is lower.
Research Ethics Approval
We registered the study with the Uganda National Council for Science and Technology, Kampala, Uganda (reference #HS191ES) and the John Snow Inc. Institutional Review Board, Boston, MA (reference #18-10E). Both bodies approved the study.
Results
Table 1 reports our estimates of the numbers and production volumes of maize millers in the 4 regions of Uganda—Central, Eastern, Western, and Northern regions, by scale of operation (note 5). Most maize mills were in the micro-scale category (62% of the milling facilities), although their production contributed only 17% of the total maize flour in the market. Small-scale mills represented over one third (36%) of all mills, and they supplied 72% of all maize flour. Finally, medium-scale mills were few (only 3% of the total number of mills) and their share of the maize flour market was 11%.
Volume-Based Scale of Maize Millers and Maize Flour Production in Uganda.
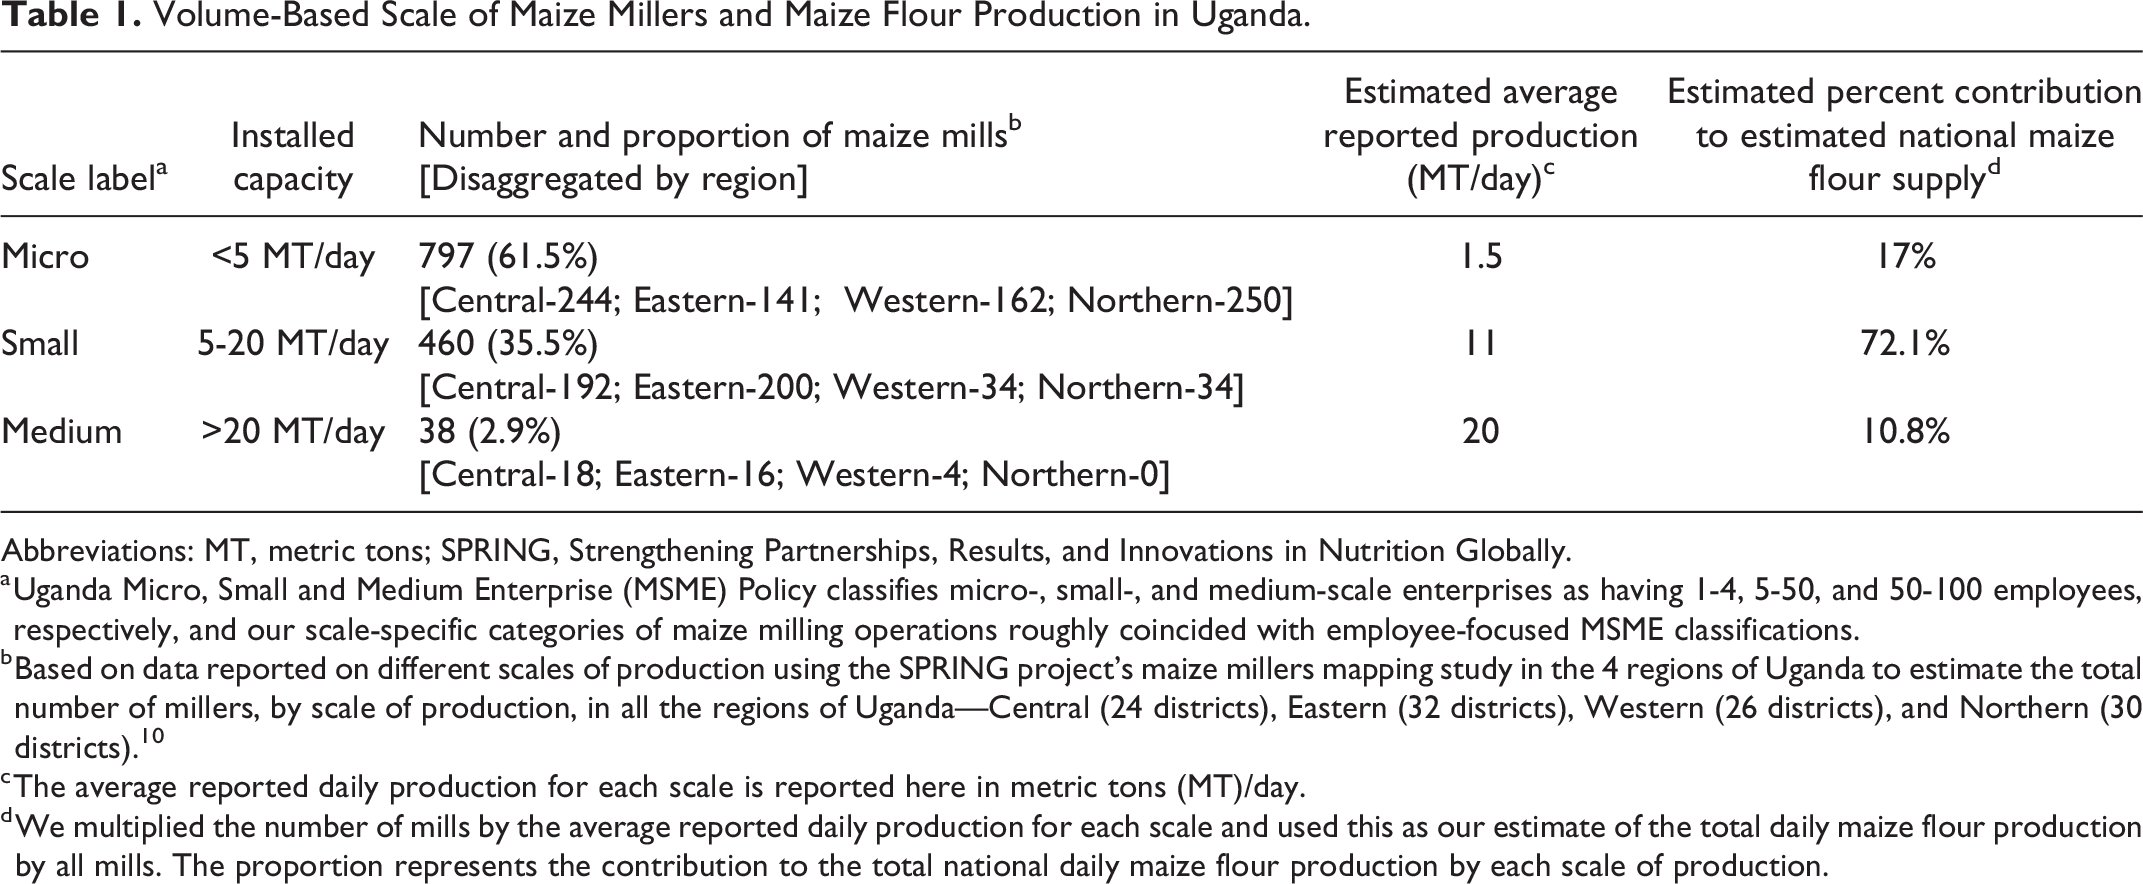
Abbreviations: MT, metric tons; SPRING, Strengthening Partnerships, Results, and Innovations in Nutrition Globally.
a Uganda Micro, Small and Medium Enterprise (MSME) Policy classifies micro-, small-, and medium-scale enterprises as having 1-4, 5-50, and 50-100 employees, respectively, and our scale-specific categories of maize milling operations roughly coincided with employee-focused MSME classifications.
b Based on data reported on different scales of production using the SPRING project’s maize millers mapping study in the 4 regions of Uganda to estimate the total number of millers, by scale of production, in all the regions of Uganda—Central (24 districts), Eastern (32 districts), Western (26 districts), and Northern (30 districts). 10
c The average reported daily production for each scale is reported here in metric tons (MT)/day.
d We multiplied the number of mills by the average reported daily production for each scale and used this as our estimate of the total daily maize flour production by all mills. The proportion represents the contribution to the total national daily maize flour production by each scale of production.
Table 2 reports a few basic characteristics and costs of the milling operations included in our study, and our scale-specific estimates of fortification costs (rows g to l, Table 2). Note that total equipment costs for milling and for fortification increase as the scale of operation decreases because of the larger number of devices required. There was a stark contrast in production capacities between the different scales of milling operations, with the average annual flour production for small- and medium-scale maize millers being 5 and 15 times, respectively, when compared to micro-scale maize millers. The ratio of fortification equipment cost to mill equipment costs was higher for micro-scale mills (2.7) than for small- (0.38) (note 6) and medium-scale (0.54) maize mills. The larger ratio for the medium-scale mills was due to the more expensive equipment used in these more industrialized settings. Moreover, the ratio of equipment cost to total annual premix costs is 1.98, 0.55, and 0.39 for micro-, small-, medium-scale mills, respectively. Hence, for the micro-scale mills, the cost of the equipment is higher than the annual cost of micronutrient premix. To put this in context, in large-scale wheat flour fortification operations, the cost of the premix represents 90% to 98% the total cost of fortification.
Profiles of the Maize Miller Operations, Miller Business Operational Costs, and Incremental Costs of Fortification (in 2018 US$), by Production-Volume-Based Scale of Operation in Uganda.
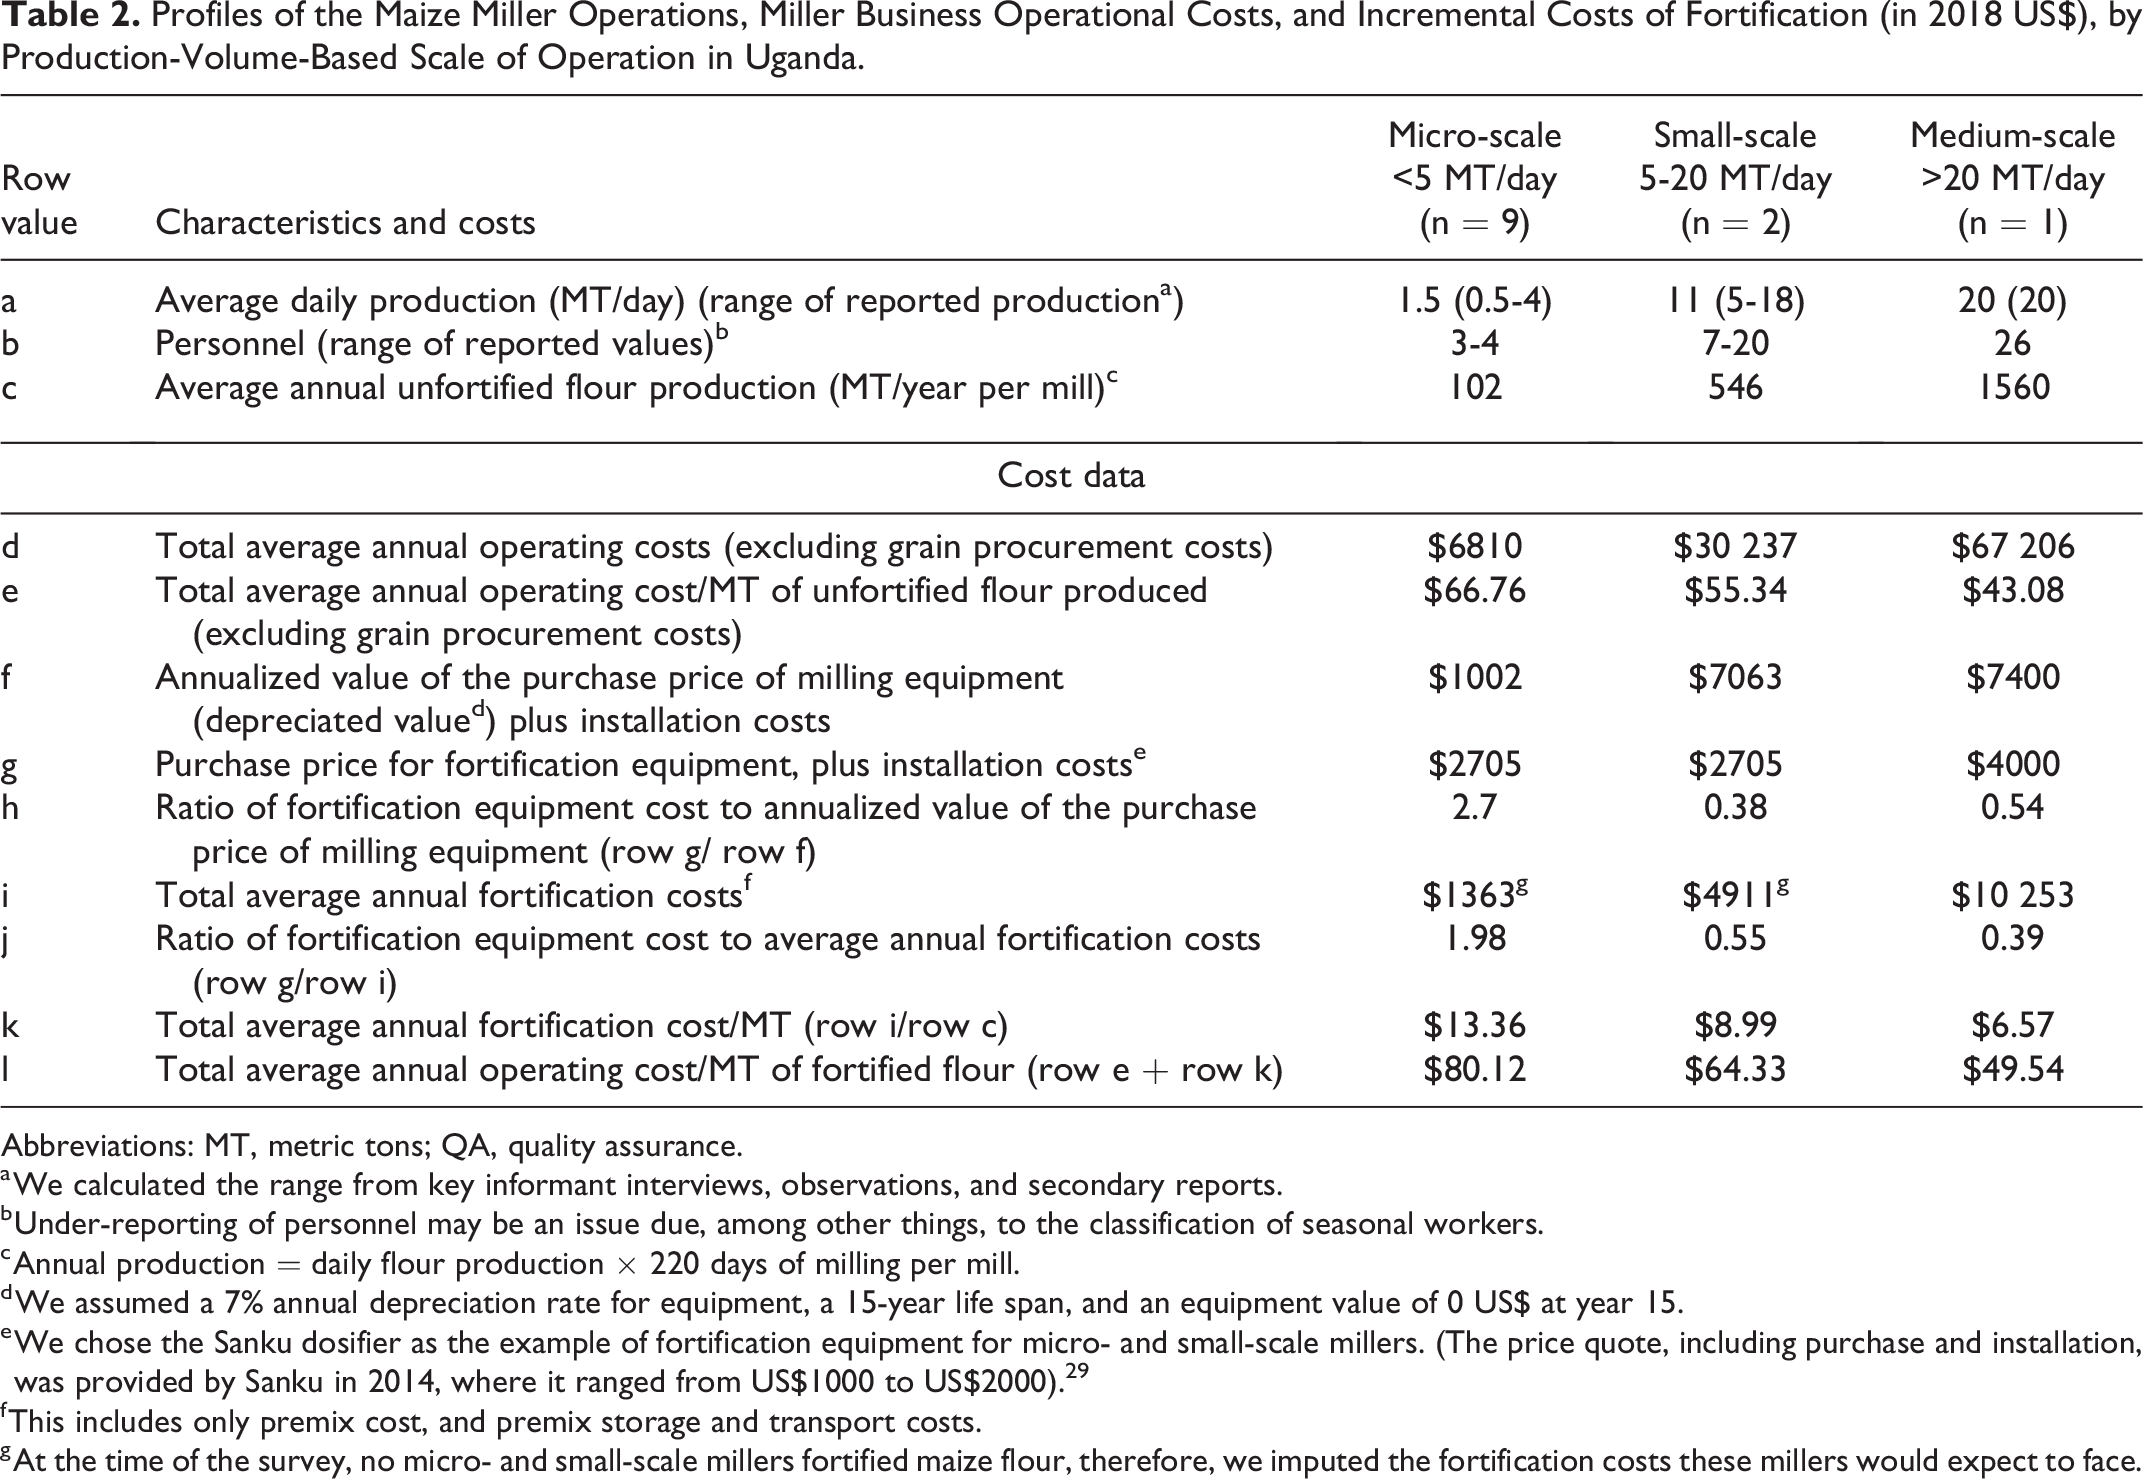
Abbreviations: MT, metric tons; QA, quality assurance.
a We calculated the range from key informant interviews, observations, and secondary reports.
b Under-reporting of personnel may be an issue due, among other things, to the classification of seasonal workers.
c Annual production = daily flour production × 220 days of milling per mill.
d We assumed a 7% annual depreciation rate for equipment, a 15-year life span, and an equipment value of 0 US$ at year 15.
e We chose the Sanku dosifier as the example of fortification equipment for micro- and small-scale millers. (The price quote, including purchase and installation, was provided by Sanku in 2014, where it ranged from US$1000 to US$2000). 29
f This includes only premix cost, and premix storage and transport costs.
g At the time of the survey, no micro- and small-scale millers fortified maize flour, therefore, we imputed the fortification costs these millers would expect to face.
Total annual fortification costs also increased as the scale of production increased (US$1363, US$4911, and US$10 253 for micro-, small-, and medium-scale maize mills, respectively) because of the increasing volume of production. However, as expected, due to economies of scale, the cost of producing flour decreases in inverse proportion with the size of the mill. The operating cost for producing maize flour is US$67, US$55, and US$43 per MT in micro-, small-, and medium-scale mills, respectively. This suggests that adding fortification costs would increase total operating costs to approximately US$80, US$64, and US$50 per MT for micro-, small-, and medium-scale mills, respectively. Hence, the degree of competitiveness of micro- and small-scale mills decreases with the introduction of fortification.
Table 3 summarizes the incremental costs of fortification by scale of milling operation. We imputed the cost of fortified flour for micro- and small-scale millers by applying the fortification input costs (note 7) for medium-scale millers and scaling them down to be proportional to the lower scales of production. The estimated incremental cost of fortification was US$13, US$9, and US$7 per MT in micro-, small-, and medium-scale mills, respectively, which represents 20% (of US$67), 16% (of US$55), and 16% (of US$43) of annual operating costs, respectively. Note that the cost per MT of fortified flour produced by micro-scale mills is approximately twice that of medium-scale mills. We converted this result into incremental cost per kilogram (kg) and calculated the contribution of fortification cost to the self-reported product price from the producers, at the day of interview in 2018. The proportion of fortification costs to product price does not vary greatly across micro-, small-, and medium-scale mills (3.2%, 2.4%, 2.1%, respectively), but micro-scale mills with already higher prices (eg, US$0.38 vs US$0.33 per kg for micro- and medium-scale mills, respectively) would be placed at a competitive disadvantage.
Incremental Costs of Fortification (in 2018 US$), by Scale of Milling Operation in Uganda.
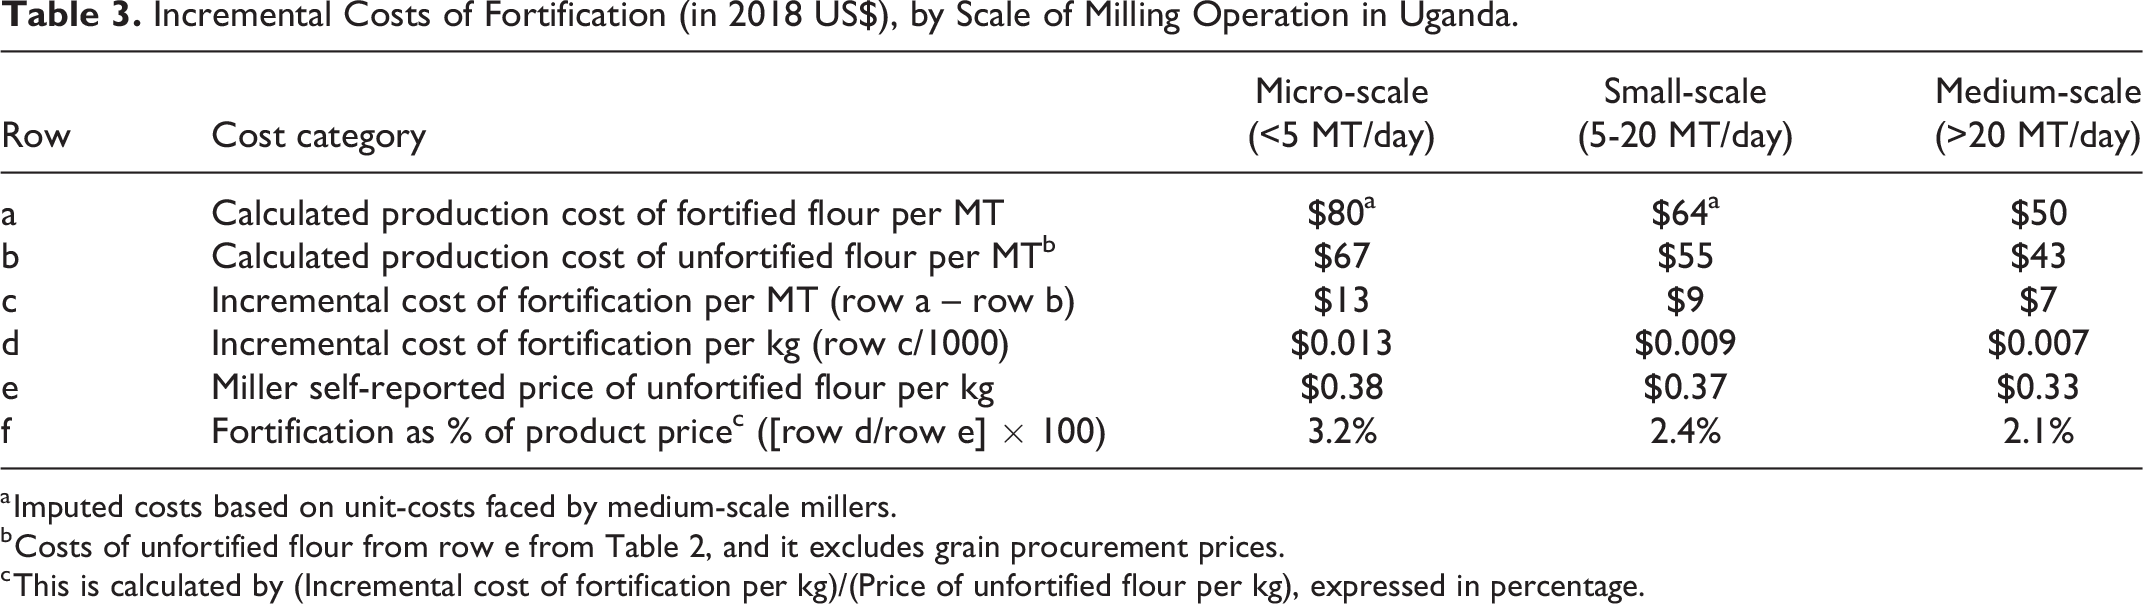
a Imputed costs based on unit-costs faced by medium-scale millers.
b Costs of unfortified flour from row e from Table 2, and it excludes grain procurement prices.
c This is calculated by (Incremental cost of fortification per kg)/(Price of unfortified flour per kg), expressed in percentage.
Cost of Regulation
Table 4 presents the public sector costs associated with regulating the maize flour fortification program, by scale of milling operation. We estimated these costs for our sample of micro-, small-, and medium-scale maize mills from the 4 regions of Uganda (797, 460, and 38 mills, respectively). The unit costs faced by NDA remain similar for each scale of production (US$7903, US$8751, and US$7792 for micro-, small-, and medium-scale mills, respectively) as they are responsible for testing the premix annually in their laboratory, after taking samples from the point of import at the border. However, the annual costs faced by UNBS for training maize millers increases as the size of the mill decreases (US$59 764, US$34 494, and US$3749 for micro-, small-, and medium-scale mills, respectively) and for inspection of production facilities (US$151 430, US$87 400, and US$7220 for micro-, small-, and medium-scale mills, respectively) increase with reductions in the scale of milling operations because the number of inspections and tests (note 8) will increase with higher numbers of trainings and site visits. The overall costs decrease with increasing scale of production (US$219 097, US$130 645, and US$18 761 for micro-, small-, and medium-scale mills, respectively). That said, alternative regulatory visit schemes can be envisioned and there may be cost savings associated with their design and implementation.
Public Sector Fortification Program Annual Costs (in 2018 US$), by Scale of Milling Operation in Uganda.a
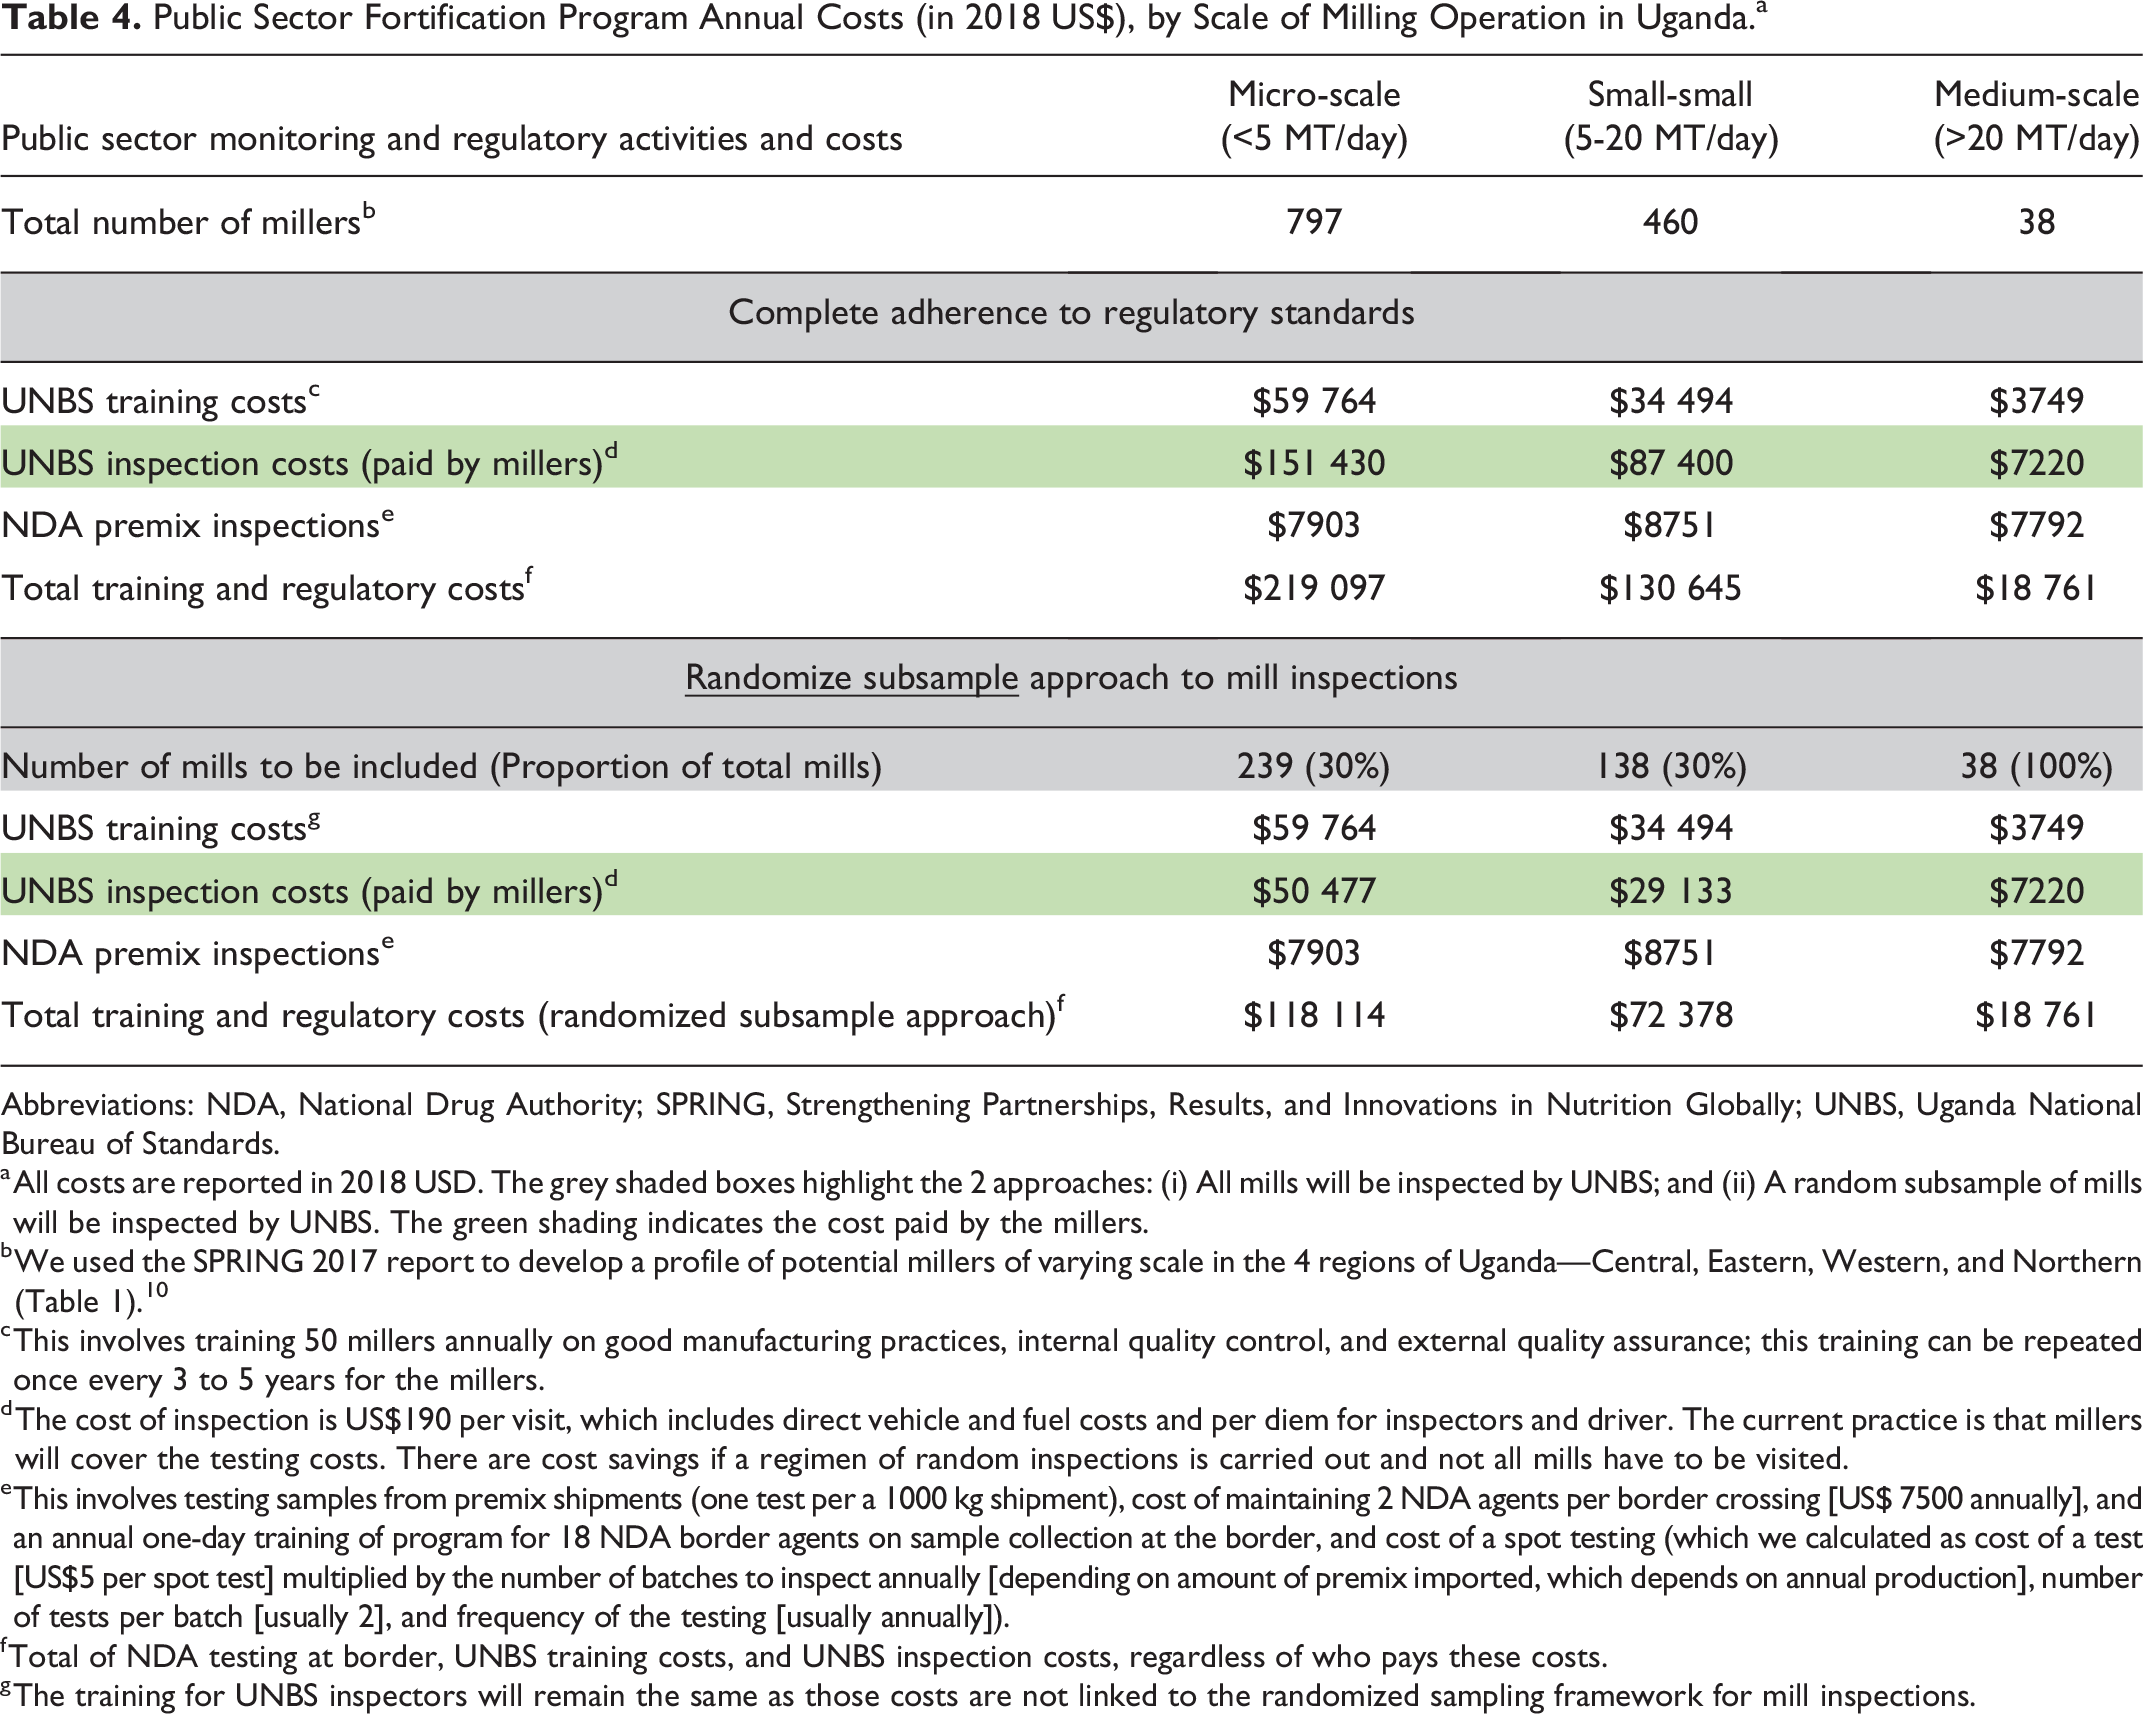
Abbreviations: NDA, National Drug Authority; SPRING, Strengthening Partnerships, Results, and Innovations in Nutrition Globally; UNBS, Uganda National Bureau of Standards.
a All costs are reported in 2018 USD. The grey shaded boxes highlight the 2 approaches: (i) All mills will be inspected by UNBS; and (ii) A random subsample of mills will be inspected by UNBS. The green shading indicates the cost paid by the millers.
b We used the SPRING 2017 report to develop a profile of potential millers of varying scale in the 4 regions of Uganda—Central, Eastern, Western, and Northern (Table 1). 10
c This involves training 50 millers annually on good manufacturing practices, internal quality control, and external quality assurance; this training can be repeated once every 3 to 5 years for the millers.
d The cost of inspection is US$190 per visit, which includes direct vehicle and fuel costs and per diem for inspectors and driver. The current practice is that millers will cover the testing costs. There are cost savings if a regimen of random inspections is carried out and not all mills have to be visited.
e This involves testing samples from premix shipments (one test per a 1000 kg shipment), cost of maintaining 2 NDA agents per border crossing [US$ 7500 annually], and an annual one-day training of program for 18 NDA border agents on sample collection at the border, and cost of a spot testing (which we calculated as cost of a test [US$5 per spot test] multiplied by the number of batches to inspect annually [depending on amount of premix imported, which depends on annual production], number of tests per batch [usually 2], and frequency of the testing [usually annually]).
f Total of NDA testing at border, UNBS training costs, and UNBS inspection costs, regardless of who pays these costs.
g The training for UNBS inspectors will remain the same as those costs are not linked to the randomized sampling framework for mill inspections.
The bottom section of Table 4 reports the estimated monitoring costs associated with a regulatory visit scheme that annually targeted 30% of small- and micro-scale millers and 100% of medium-scale millers (with lower overall costs of US$118 114, US$72 378, and US$18 761 for micro-, small-, and medium-scale mills, respectively). Note that border inspection tests would also increase if smaller-scale millers were included in the national fortification program, since doing so would increase the (expected) flow of premixes into the country. If we assume that border testing is conducted for every 1000 kg shipment that enters Uganda, and we factor in the personnel costs for 2 border inspectors and annual training for 18 inspectors, the cost of incremental border testing of premix is as follows: (a) if all medium-scale mills participated, the cost would be US$7792; (b) if all medium and small-scale mills were included, the cost would be US$16 543 (US$7792 + US$8751); and (c) if all micro-, small-, and medium-scale mills were included, the cost would be US$24 446 (US$7792 +US$8751 + US$7903). In 2018, UNBS had a scheme of voluntary certification; the cost associated with first-time certification was US$4931 and the annual recertification cost was US$4698.
Discussion
This study contributes to the ongoing discussion of how to improve existing and planned food and condiment fortification programs in low- and middle-income countries, with particular focus on the costs (measured here in the context of Uganda) and benefits (not measured here) of extending fortification programs to include smaller-scale producers. This issue is not new. Fiedler and Macdonald 3 provided early estimates of scale-specific costs in the context of wheat flour milling in Kenya and Walters et al 30 have done so more recently in the context of vitamin A fortification of edible oils in Tanzania. However, national-policy level discussions of fortification program challenges and next steps have tended to pay less attention to the production scale issue, often placing products processed by smaller-scale producers into the “infeasible” category, for an array of reasons. 7 Nutrition modelers have tended to do the same by focusing exclusively on products processed (domestically or internationally) by large-scale enterprises. 18 A deeper understanding of how firm-level and public sector costs vary by scale of operation among smaller-scale producers may help identify new policy options for addressing micronutrient deficiencies, especially among the rural poor.
Our study calculated the costs of maize flour fortification in Uganda for different scales of milling operations, and from the perspective of regulatory agencies who enforce a legislative mandate of the existing maize flour fortification program. We found that the incremental operational costs per MT of maize flour fortified by micro-, small-, and medium-scale maize millers decreased with increasing scale of milling operation (US$13, US$9, and US$7, respectively). Walters et al found an even steeper cost gradient by scale of production for the case of vitamin A-fortified edible oils in Tanzania. 30 In contrast, in terms of scale, a study conducted in Kenya, Zambia, and Uganda to assess the feasibility of large-scale maize flour fortification found that the average cost per MT of fortified maize flour was US$4.41 per MT. 31 Therefore, while LSFF programs are more efficient from a business perspective, they may not reach—as is the case of maize flour in Uganda—the poor, especially the rural poor, because the maize products consumed by them are not produced in large-scale firms.
In East Africa, the Project Health Children and Sanku are leading an effort with several other organizations to introduce fortification in small-scale mills, mostly in Tanzania. 29 However, this model depends on continual external donations of equipment, technical assistance, and supervision, and therefore it is not creating a locally sustainable program from a public health perspective. It would be useful to know the itemized total costs and the nutritional benefits of this program to objectively assess its viability and usefulness. This is a matter outside the scope of this article.
A review of small and medium enterprises (SMEs) (defined in the review as a firm with a maximum of 250 employees) in low- and middle-income countries showcased some examples of SMEs involved in food fortification. 32 The key challenges that the review outlined for SMEs included information gaps (hindering SMEs to develop micronutrient context-specific foods); funding (access to sustainable financing); technical support (gaps in production, nutrition, and business plans); ability to comply with regulations, capacity building and scale-up, and finding business models that are scale-appropriate and market-context-appropriate.
Our study highlights all these challenges faced by the micro- and small-scale mills in Uganda. In particular, the initial capital costs to equip micro- and small-scale mills with fortification equipment and technology were high absolutely, and relative to the cost of the milling machines. In 2018, the certification process was voluntary for millers. In 2023, all millers were required to undergo the certification process, but we do not have any data on how this is being enforced. The recurring costs of fortification and the regimen of certification, testing, and inspection also serve as deterrents to smaller-scale producer participation in the existing national fortification program in Uganda.
The results from our study echo the findings of another review from Burkina Faso, which explored the role of food fortification programs in reducing micronutrient inadequacies while creating an inclusive environment for actors of all scales of operation within the domestic food supply chains. 11
A study on the policy enabling environment for LSFF in Kenya has some parallels with our study. 12 The review examined the capacity of different scales of food processors to comply with the fortification mandate. The authors identified that the challenges faced by small-scale (production capacity of less than 20 MT per day) and medium-scale (production capacity between 20 and 50 MT per day) in fortifying their products relate to lack of personnel for quality control and assurance, and lack of funding for fortification machinery, which makes it harder for them to absorb the incremental cost of fortification. These costs when passed on to consumers made these firms non-competitive with the larger firms which, in contrast, are better able to pass along these costs.
We also calculated the cost of government enforcement. The estimated inspection cost for the food control authorities of the government would increase from a few visits per year to large-scale factories to potentially hundreds of visits if all micro-, small-, and medium-scale mills were included in the national fortification program, since the current legislation requires mandatory annual inspections. Options may exist for reducing the numbers of mills visited in any given year (eg, visit a random sample of one third of mills each year); such schemes may help reduce costs.
A related role for the government falls in the area of ensuring marketplace competitiveness among the various scales of maize flour production. If the government requires micro- and small-scale firms to fortify maize flour, it needs to make significant financial investments to ensure that all mills comply and that imported maize flour is also fortified to standards; given current regulatory capacity, this would be very difficult to achieve.
To be commercially viable, smaller-scale millers must pass all of the increased operational costs and perhaps some of the amortized capital expenditure costs to the consumers of their products. The same is true for medium-scale millers, but there may be options for them to provide fortified flour for institutional feeding (eg, schools, hospitals, communities under emergency situations), and to pass along fortification costs to the organizations supporting these social programs.
As currently articulated in mandatory fortification standards, to participate in the fortification program, mills much achieve and adhere to a set of good manufacturing practices, which may require mills to address unsanitary conditions around the mills, inappropriate storage of grain and flour, potential for contamination of grain and flour with animal excrement, and so on. The medium-scale maize miller in our sample followed these good manufacturing practices, but the small-scale and, especially, micro-scale mills did not. Making the investments and the changes to operating practices required to meet these standards may be even more expensive and otherwise challenging than participating in the fortification program. Therefore, regulators may face a trade-off between improving the micronutrient content of a (potentially) less-safe maize flour or dealing with the larger challenges and costs associated with both improving the micronutrient content and the quality of maize flour.
The current maize flour fortification program, with mandatory participation for firms with daily production greater than 20 MT/day, provides a strong economic disincentive to firms to grow and produce above that threshold. This not only hampers the fortification program (essentially no smaller-scale producers are participating), it also limits firm-level exploitation of scale economies and may be limiting the consolidation of the maize milling industry and hence sustaining a relatively high-cost industry 22,33 and (perhaps ironically) increasing the cost of fortifying this food vehicle.
Our study had some limitations. First, we relied heavily on self-reported data from selected millers. We took steps to assure millers that their operational information would be confidential, but production estimates may have been biased downward (so as to remain below the volumetric threshold for mandatory participation in the fortification, and perhaps for other reasons), and there may have been uncertainty around reported costs. That said, data were cross-checked and compared with international estimates for consistency. Second, the exact size and composition of the maize milling industry are not known. We used a convenience sample and the costs of various inputs among millers within the micro- and small-scale categories had little variability. We also relied on data from a 2017 study on maize millers to build our sample in the Central and Eastern region, and to extrapolate our findings to the national level. 10 Third, we did not estimate increases in transaction costs that all smaller-scale millers would face linked to the new complexities associated with fortification (eg, introducing changes to their business practices, procuring equipment and premixes, securing required licenses and certificates, and introducing required quality control and testing); the smaller the scale of operation, the more onerous these costs would become vis-à-vis gross revenues. Fourth, we did not evaluate the quality of flour being produced by micro-scale mills versus small- versus medium-scale mills. It is likely that there are differences in flour quality based on differences in the types of milling machines used by the micro- and small-scale mills (hammer mills), and those used by some of the small-scale and most of the medium-scale mills (roller mills). Flour quality issues may affect product prices received, and hence the financial viability of participating in the national fortification program. Fifth, we did not assess the ability of regulatory agencies to take on the additional and very significant tasks of including smaller-scale mills in the existing fortification program, although we did provide estimates of the costs associated with doing so. Finally, but quite importantly, the study is silent on the fundamental issue of the nutritional benefits that would accrue to the rural poor from expanding the current fortification program to include smaller-scale maize mills.
In conclusion, we believe that it is important to recast the discussion of the issue of scale of production in food/condiment fortification in general. It was, and remains, important for policymakers to prioritize LSFF in most settings, especially for vehicles with broad and equitable reach (eg, edible oils); the costs are low relative to other scales of production and their cost-effectiveness has been demonstrated. 15 However, for other vehicles such as maize flour and rice, LSFF programs may not reach poor households, especially in rural areas. In these cases, it may well be worth investing in promoting the development of the smaller-scale segments of the market. There is no predetermined “line in the sand” in fortification discussions regarding scale of operation; rather, scale-dependent tipping points will depend on how private and public costs vary with scale, how the burdens of these costs shift with scale, and (very importantly) the expected nutritional and other benefits associated with moving “down” the production-scale gradient.
Our results, based on the Ugandan situation, demonstrate that no medium- or smaller-scale maize mills will voluntarily adopt fortification; doing so would place individual mills at a competitive disadvantage, and the industry apparently has taken care to remain below the scale at which fortification would become mandatory. So, in effect, the current fortification program has generated few nutritional or other benefits.
Policymakers are seeking to reduce the scale-specific threshold for inclusion in the mandatory fortification program, but questions remain regarding how far to reduce the threshold. Our research suggests that reducing the threshold will increase the private and public costs of the fortification program and will also likely shift the burden of up-front investments (at least) among stakeholders. Doing so will also increase the cost of maize flour, and the extent of price increases would also increase as scale of production decreases.
This study also demonstrated the usefulness of and need to carry out cost studies as a preliminary step to any initiative under consideration for involving smaller-scale enterprises in national fortification programs. The results of these cost studies should be set alongside the results of studies that assess nutritional needs and the potential for fortification undertaken at different scales of operation to help meet these needs. Finally, food fortification should be pursued as part of a comprehensive program to promote the development of food systems, so that fortified foods emerge from efficient, safe, and progressive enterprises.
Footnotes
Acknowledgments
The authors would like to acknowledge the contributions of the key stakeholders and experts who took their time to provide them with valuable information to build their costing models. They are especially grateful to the members of the Uganda National Working Group on Food Fortification for their feedback on the study design. They would also like to thank the Uganda Ministry of Health, especially Sarah Ngalombi from the Nutrition Division, and the Ministry of Trade, Industry, and Cooperatives, especially Francis Enaru from the Directorate of Micro-Small and Medium-Scale Enterprises, for their support to this activity. They would also like to acknowledge the support provided by Jeniece Alvey from the USAID Bureau for Global Health, and Alfred Boyo, formerly with USAID Uganda.
Author Contributions
DM, OD, and SV conceptualized and designed the research. DM, EB, and MM conducted the research, and analyzed the data. DM prepared the draft manuscript. DM, EB, MM, OD, and SV provided substantial input to the article. SV has the primary responsibility of final contents. All authors read and approved the final manuscript.
Declaration of Conflicting Interests
The author(s) declared the following potential conflicts of interest with respect to the research, authorship, and/or publication of this article: OD is affiliated with the funder, USAID, and contributed to the study design, data collection and analysis, decision to publish, and preparation of the manuscript as an expert on fortification, independent of his role with the funder.
Funding
The author(s) disclosed receipt of the following financial support for the research, authorship, and/or publication of this article: This work was supported by the United States Agency for International Development (USAID) under the terms of the Cooperative Agreement (AID-OAA-A-11-00031, SPRING), managed by JSI Research & Training Institute; and under the terms of contract (7200AA18C00070, USAID Advancing Nutrition), both awarded to JSI Research & Training Institute, Inc. The website of the funder is ![]() . The views expressed in this article are the authors’ own and do not necessarily reflect the views of USAID or the US government.
. The views expressed in this article are the authors’ own and do not necessarily reflect the views of USAID or the US government.