
Abstract
Introduction:
Tanzania aimed to reduce micronutrient deficiencies and neural tube defects by introducing mandatory fortification of large-scale packaged wheat and maize flour but not for small- and medium-scale mills.
Objectives:
Ascertain the proportion of the population in Morogoro region, Tanzania, that consumes packaged maize flour from small-, medium- and large-mills; and understand the impact of monthly apparent purchase and consumption of packaged flour.
Methods:
In 2018, a regional, multistage cluster probability study was conducted among residents in Morogoro region living in households that reported consuming maize flour. Interviews collected information on sociodemographic factors and patterns of household flour consumption. Weighted medians estimated daily apparent flour consumption and the estimated average requirement (EAR), according to age.
Results:
Information was collected on 711 households. Packaged maize flour was purchased 10–12 months of the year by 22.9% of households, 6–9 months by 17.6% of households, 1–5 months by 25.1% of households, and 34.4% did not purchased maize flour. Median apparent daily consumption of maize flour was 209.7 g/d/adult male equivalent (AME). Apparent median daily consumption of maize flour was 230.1 g/d/AME in rural areas and 176.2 g/d/AME in urban areas; 228.7 g/d/AME among males and 196.4 g/d/AME among females. If all packaged maize flour were fortified according to standards, those consuming packaged maize flour 10–12 months of the year would apparently consume 199.9 µg folic acid/d representing 49.7% of daily EAR requirements.
Conclusions:
Fortifying packaged maize flour at small-, medium- and large-mills is a promising strategy for increasing access to micronutrients, including folic acid.
Keywords
Introduction
Globally, more than 2 billion people experience deficiencies in key micronutrients such as iron, iodine, vitamin A, folate, and zinc. 1 These deficiencies can result in major health consequences including anemia, stunting, and neural tube defects (NTDs). These deficiencies are especially prevalent in low- and middle-income countries. 2 In Tanzania, anemia is prevalent among 58% of children 6–59 months old and 57% of women 15–49 years old. 3 The prevalence of NTDs in Tanzania, estimated by the March of Dimes Birth Defects Foundation, may be as high as 13 per 1000 live births. 4
Periconceptional consumption of 400 µg of folic acid each day among women of reproductive age (WRA) can lower, by up to half, the likelihood of having a pregnancy affected by an NTD. 5 Folate deficiency or insufficiency among WRA is a key risk factor for a baby to be born with an NTD. Current regional and national data are not available for folate deficiency/insufficiency in Tanzania. However, one study among a cohort of 600 nonpregnant women reported 26.9% with serum folate deficiency (cutoff at < 10 nmol/L). Based on this report of high serum folate deficiency, other micronutrient deficiencies, such as red blood cell folate deficiency/insufficiency and vitamin B12 deficiency, might also be high in the population. 6 Therefore, the number of folic-acid preventable NTDs may be substantial.
Fortifying staple foods may be a cost-effective intervention for reducing micronutrient deficiencies and subsequent NTDs in many settings. 7,8 In particular, adding folic acid to staple foods consumed by a large proportion of the population has prevented between 30% and 75% of NTDs, such as spina bifida and anencephaly. 9,10 Tanzania has reduced some micronutrient deficiencies through food fortification. In the early 1990s, the Tanzanian government organized small-scale salt producers to fortify salt with iodine. Through this effort, Tanzania achieved universal salt iodization, resulting in a sharp decline in the total prevalence of goiter, from 62% in the 1980s to 12.3% in 2004, in 27 districts where goiter was endemic. 11
In 2011, Tanzania mandated fortification of large-scale mills produced wheat and maize flour with several key micronutrients, including folic acid. 12,13 However, many people, especially in rural areas, do not have access to nor can afford wheat flour. Although maize flour is consumed by an estimated 93% of women in Tanzania, most maize flour production is fragmented (ie, not produced in large-scale mills), a major implementation barrier for its fortification. 14 In 2016, about 7.8 million metric tons (MT) (85.4%) of the maize grain produced in Tanzania was processed by small-scale (2 MT to <24 MT) and medium-scale mills (<24 to <72 MT). 15 Almost 99% of the maize grain is converted to flour in small- and medium-scale mills. 16 These mills are commercial mills that are packaging maize flour into sacks for sale.
Maize milling practices differ between urban and rural areas. In rural areas, where most of the population resides (71.3%){Tanzania National Bureau of Statistics, 2012 # 17 }, capacity and resources to fortify maize flour are limited. Flour is sourced, milled, and packaged by these small- and medium-scale mills. Maize flour can also come from small “toll mills” (also known as “service” or “sembe or dona” mills), which charge a fee to mill raw maize provided by the consumer (typically farmers). Mills that are exclusively toll mills neither buy raw maize nor the bags to package the flour. These toll mills usually process <2 MT of maize flour daily. Some small-scale mills operate both as commercial packaging mills and offer toll milling services during parts of the year, typically around the maize harvest when consumers have access to a surplus of raw maize. Maize fortification remains voluntary for small- and medium-scale millers and toll mills are completely exempt from fortification requirements. 15 Similar implementation barriers that prevent food fortification from reaching the entirety of their population exist in other countries in Sub-Saharan Africa, such as Uganda. 18
Until recently, there was no fortification technology or scalable model feasible for small- and medium-scale maize mills. Promising technology (such as dosifiers) and business models now exist that can deliver consistent and precise amounts of micronutrients, thus allowing for fortification at the point of milling in small- and medium-scale maize flour mills. 15 Adoption of this technology and business models has the potential to address the significant gaps in micronutrient coverage among populations that are not currently reached by industrially large-scale milled maize flour. The Morogoro region of Tanzania produces some of the largest amounts of maize in the country. The Morogoro region also has a large number of small- and medium-scale millers that produce packaged maize flour. Additional information was needed to better understand the proportion of Morogoro’s population that purchases packaged maize flour throughout the year and how consumption of maize flour differs by months of use so that those consumers who purchase maize flour at small- and medium-scale flour mills might be reached by maize flour fortification.
Therefore, the aims of this study were to (1) ascertain the proportion of the population in Morogoro region, Tanzania, that consumes packaged maize flour from small-, medium- and large-scale mills; (2) understand if apparent consumption of packaged maize flour is affected by changes in use during the year; and (3) determine who might potentially be reached by point-of-milling fortification in packaging mills.
Methods
Study Population
The Morogoro region is located in southeast Tanzania. In 2012, the Morogoro region had a total population of 2 218 492; 71.3% lived in rural settings; 41.3% were younger than 15 years of age; and 24.3% were WRA. 17
Sample Design
A probability proportional to size (PPS), multistage cluster sampling design was used to define the study population. In the first stage of sampling, the number of households were identified from the 2012 census and listed by census tract. 17 Probability proportional to size sampling was then applied to obtain 30 clusters by urbanicity (20 rural and 10 urban); fewer clusters were selected from urban census tracts, and more clusters were selected from rural census tracts, since the majority of the population lives in rural areas. Selected clusters were mapped using a combination of census maps and field work to ensure all housing units were counted, located, and confirmed. If a cluster area contained 200 households or more, the sector was segmented after conducting the listing and mapping. When a cluster was partitioned into 2 or more segments, random sampling was used to select one of the segments from which to sample households. There were 6 clusters that had more than 200 households and were therefore segmented. A census of households was then carried out in the selected clusters. Finally, a systematic random sampling was used to select households from each selected cluster.
Eligibility and Data Collection
Upon arriving at the preselected households, study staff identified the head of the household, explained the purpose of the study, and then asked the head of the household a series of inclusion/exclusion questions to determine the household eligibility. Households were deemed eligible if the head of household had resided at the residence at least 3 months; at least one WRA (15-49 years) resided in the household; residents reported consuming maize flour; and a woman of legal age (18 years or older) consented and was available to complete the household questionnaire. If the household was eligible, but no woman of legal age was available at the first attempted contact, a message was left at the house and two additional attempts were made to contact the household. Data collection occurred from August to September 2018.
Household Interviews
Once an eligible household and appropriate respondent were identified, a standardized questionnaire was used to collect information in Swahili by census-trained interviewers on Samsung Tablets using EPI Info software (Epi Info™). Questionnaires addressed the staple foods most frequently consumed, as well as the reported quantities of maize and wheat flour that the household purchased, consumed from its own production, received as a gift or in-kind payment, or obtained from other sources in the past 7 days. Only maize and wheat flour intended for household consumption were used to estimate household intake of flour; purchases of maize and wheat flour for business or animal feed were not included to estimate household intake.
Fortifiable Maize Flour
Fortifiable maize flour was defined as any maize flour that was at some point packaged for retail sale at a flour packaging mill (regardless of mill size) or from a retail shop. In this study, purchased maize flour (as opposed to maize grown and then taken to a “toll mill” by the consumer) was assumed to be packaged flour, and therefore fortified or fortifiable. We will be using the term “package maize flour” to represent maize flour that is or can be fortified.
Coverage and Purchase of Maize Flour During the Year
To ascertain how often families purchased packaged maize flour throughout the year, either as a primary source of food or as a supplemental source when their own harvests ran out, participants were asked about maize flour purchases in each month, (ie, “Did you purchase maize flour in January, February, etc.?” The respondent’s options were “yes”, “no”, or “I don’t know”). To assess the sensitivity of the results and to improve accuracy, participants were also asked, for each month, whether they used their own maize for maize flour. In the analysis, “Coverage and Use” responses were condensed into 4 response categories: Always—household purchased maize flour 10–12 months out of the year; Medium—household purchased maize flour for 6–9 months out of the year; Low—household purchased maize flour 1–5 months of the year; and Never—household purchased maize flour 0 months out of the year.
Household Wealth Index
Sociodemographic information was collected to determine the household wealth index—a composite measure of the cumulative living standard of a household. The household wealth index was calculated based on ownership of a selected set of assets, such as household televisions, bicycles, and cars; dwelling characteristics such as flooring material; the source of the household’s drinking water; toilet and sanitation facilities. 19
Household and Apparent Consumption of Maize Flour
Because we did not collect information about intrahousehold allocation of maize flour, we used data on the quantity of maize flour purchased per household in the past 7 days (eg, 1000 grams [g] of maize flour/7 days [d]) and the household roster that provided age- and sex-specific enumeration of individuals in the survey to estimate apparent consumption of maize flour. With this information we used the adult male equivalent (AME) units to estimate the individual energy requirements, which are age- and sex-specific. 20,21 The energy requirements of an adult male aged 19–30 years was used as the reference value, and other age and sex groups were weighted accordingly based on their estimated energy needs. The AME maize flour amount apparently consumed per day for WRA was estimated as the product of the amount of household maize apparently consumed/day and the household AME fraction for WRA (ie, household consumption g/d × WRA individual AME).
The AME method assumes the distribution of foods in the household is proportional to each individual’s age- and sex-specific share of total household energy and nutrient requirements. A weight, or adjustment factor, was assigned to each person in the household using adult males as the referent population.
Extreme upper outliers were identified and deleted using either cutoffs based on assumptions of reasonable consumption or standard statistical methods (interquartile range [IQR] or a combination of both). Households were identified as outliers when the amount of maize flour purchased was less than 1 kg in the past 7 days. In addition, we applied the IQR to identify additional outliers of estimated individual consumption that fall above Q3 + 3IQR. This process excluded 144 individuals, yielding a total of 3079 individuals in 711 households.
Potential Folic Acid Apparent Consumption
We defined the potential daily folic acid apparent consumption as the daily apparent consumption of fortifiable maize flour multiplied by Tanzania’s maize fortification standard for folic acid at the time of the survey. 12 In other words, the potential apparent consumption is what can be realized if folic acid fortification is implemented in small- and medium-scale packaging mills. The result of potential daily estimated consumption of folic acid was reported as apparent consumption of folic acid in micrograms (µg) and as percentages of the estimated average requirement (EAR) according to age.
Quality Assurance
Field supervisors performed daily quality assurance checks for completeness and potential recording errors. In addition, every evening the data manager and field supervisors reviewed all surveys to identify discrepancies or issues with the data and contacted interviewers if any were found. In cases where the discrepancy could not be rectified, the interviewer either called the household to verify a response or returned the following day to the household. Key variables were regularly compared to identify any inconsistencies, such as maize flour consumption. If the interview responses showed a questionable pattern of unrealistic or implausible combinations of responses, data field staff were retrained by the data manager. A sampling expert was involved throughout the entirety of the study to train mappers and interviewers and to serve as a study monitor to address any issues that arose.
Statistical Analysis
We performed statistical analyses with SAS 9.4 (SAS Institute) and SUDAAN (version 11.0; Research Triangle Institute). We used sample weights and sample design variables to produce regional representative estimates that account for the complex survey design and adjustments for household nonresponse. 22 We calculated descriptive statistics for the following variables: area (rural, urban), respondent education (preprimary or less, primary, and postprimary), food assistance (yes, no), household wealth index (low, middle, high), household decision maker (head of household, respondent, head of household with other household member), household consumption of maize and wheat flour (yes, no), and monthly use of packaged maize flour purchase. We estimated for all variables, the unweighted sample size, weighted percent, and associated 95% confidence interval (CI). We computed summary statistics to show the distribution of frequency of purchase of packaged maize flour by location, respondent’s education, and household wealth index.
We used unadjusted and adjusted logistic regression models to determine the prevalence risk ratio (PRR) comparing population characteristics with frequency of purchase of package maize flour. Univariate analyses were used to investigate the unadjusted (crude) associations and multivariate analyses were used to determine variables independently associated with frequency of purchase. 22,23 We defined significance for all analyses as P < .05. We estimated weighted medians and IQRs to determine the estimated individual intake of maize flour (g/d/AME). Daily apparent estimated consumption of folic acid was estimated in µg and as a percentage of the EAR according to age and sex. In addition, linear trends in individual apparent consumption of maize flour by age, treated as an ordinal variable, sex and residence were assessed using multiple linear regression with the Satterwaite adjusted F-statistic. All reported P values were based on 2-sided tests.
Ethics
The study protocol was approved by Tanzania’s National Institute of Medical Research and the National Bureau of Statistics. The study protocol was also reviewed by the US Centers for Disease Control and Prevention’s Institutional Review Board in Atlanta, Georgia, and received a determination of nonresearch. After interviewers explained the purpose and procedures of the study, household members were given a written consent form that they could read on their own along with the offer to have the consent form read aloud. All survey participants provided informed consent before the beginning of each interview.
Results
A total of 984 households were identified for participation. All households were contacted to determine their eligibility. From the 984 households selected, 39 were unoccupied; 184 had no eligible woman; 11 did not meet the 3-month requirement of residency; and 1 did not consume maize flour. Of the 749 households that met eligibility criteria, 38 refused to participate. Thus, a total of 711 households were included in the analytic sample for a response rate of 94.9%, yielding a total of 3169 individuals.
Table 1 summarizes the weighted characteristics of the households in the study: 66.9% lived in rural areas, 57.4% completed primary education, 14.0% received food assistance, and 42.5% reported the lowest household wealth index. The median household size was 4.0 (95% CI 3.0, 5.0). Overall, the sample population reflected the Morogoro general population at the time of the study (data not shown) {Tanzania National Bureau of Statistics, 2012 # 17 }: when we compared our urban sample population to the Morogoro regional urban population we did not find any significant differences between them (difference = 3.3; 95% CI −0.1, 6.8, χ2 = 3.7, P = NS). Similarly, no significant differences were found when we compared the average number of household members (difference = 0.0; 95% CI −1.2, 1.2; t = 0, df = 2219; P = NS).
Characteristics of Study Population in Morogoro Region, Tanzania, 2018.
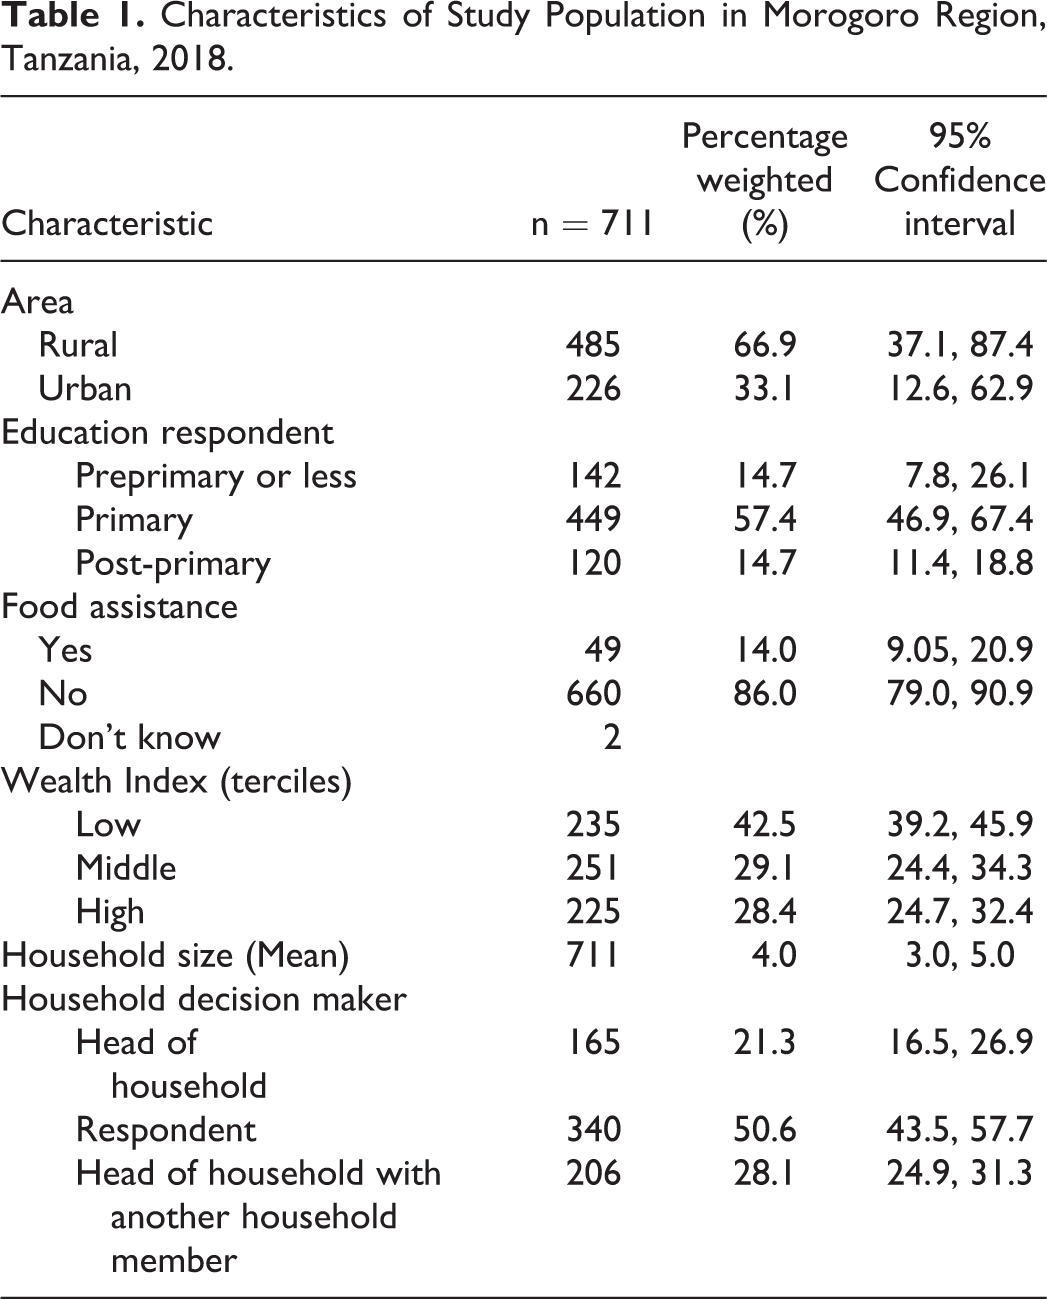
Table 2 describes how household consumption of maize and wheat flours varied by sociodemographic characteristics. Maize flour was consumed by 100% of households, as expected, because it was an eligibility criterion, whereas wheat flour was consumed by 49.5% (95% CI 40.6, 58.4) of households. Even after adjusting for covariates, the consumption of wheat flour was significantly lower among households with the lowest and middle household wealth index compared to those with the highest wealth index [43.8%, 44.8% compared to 61.4%, respectively; adjusted prevalence rate ratios (aPRRs): 0.6 (0.4, 0.9) and 0.6 (0.5, 0.8), respectively].
Household Reported Purchase of Fortified Wheat Flour by Sociodemographic Characteristics, Morogoro Region, Tanzania, 2018.
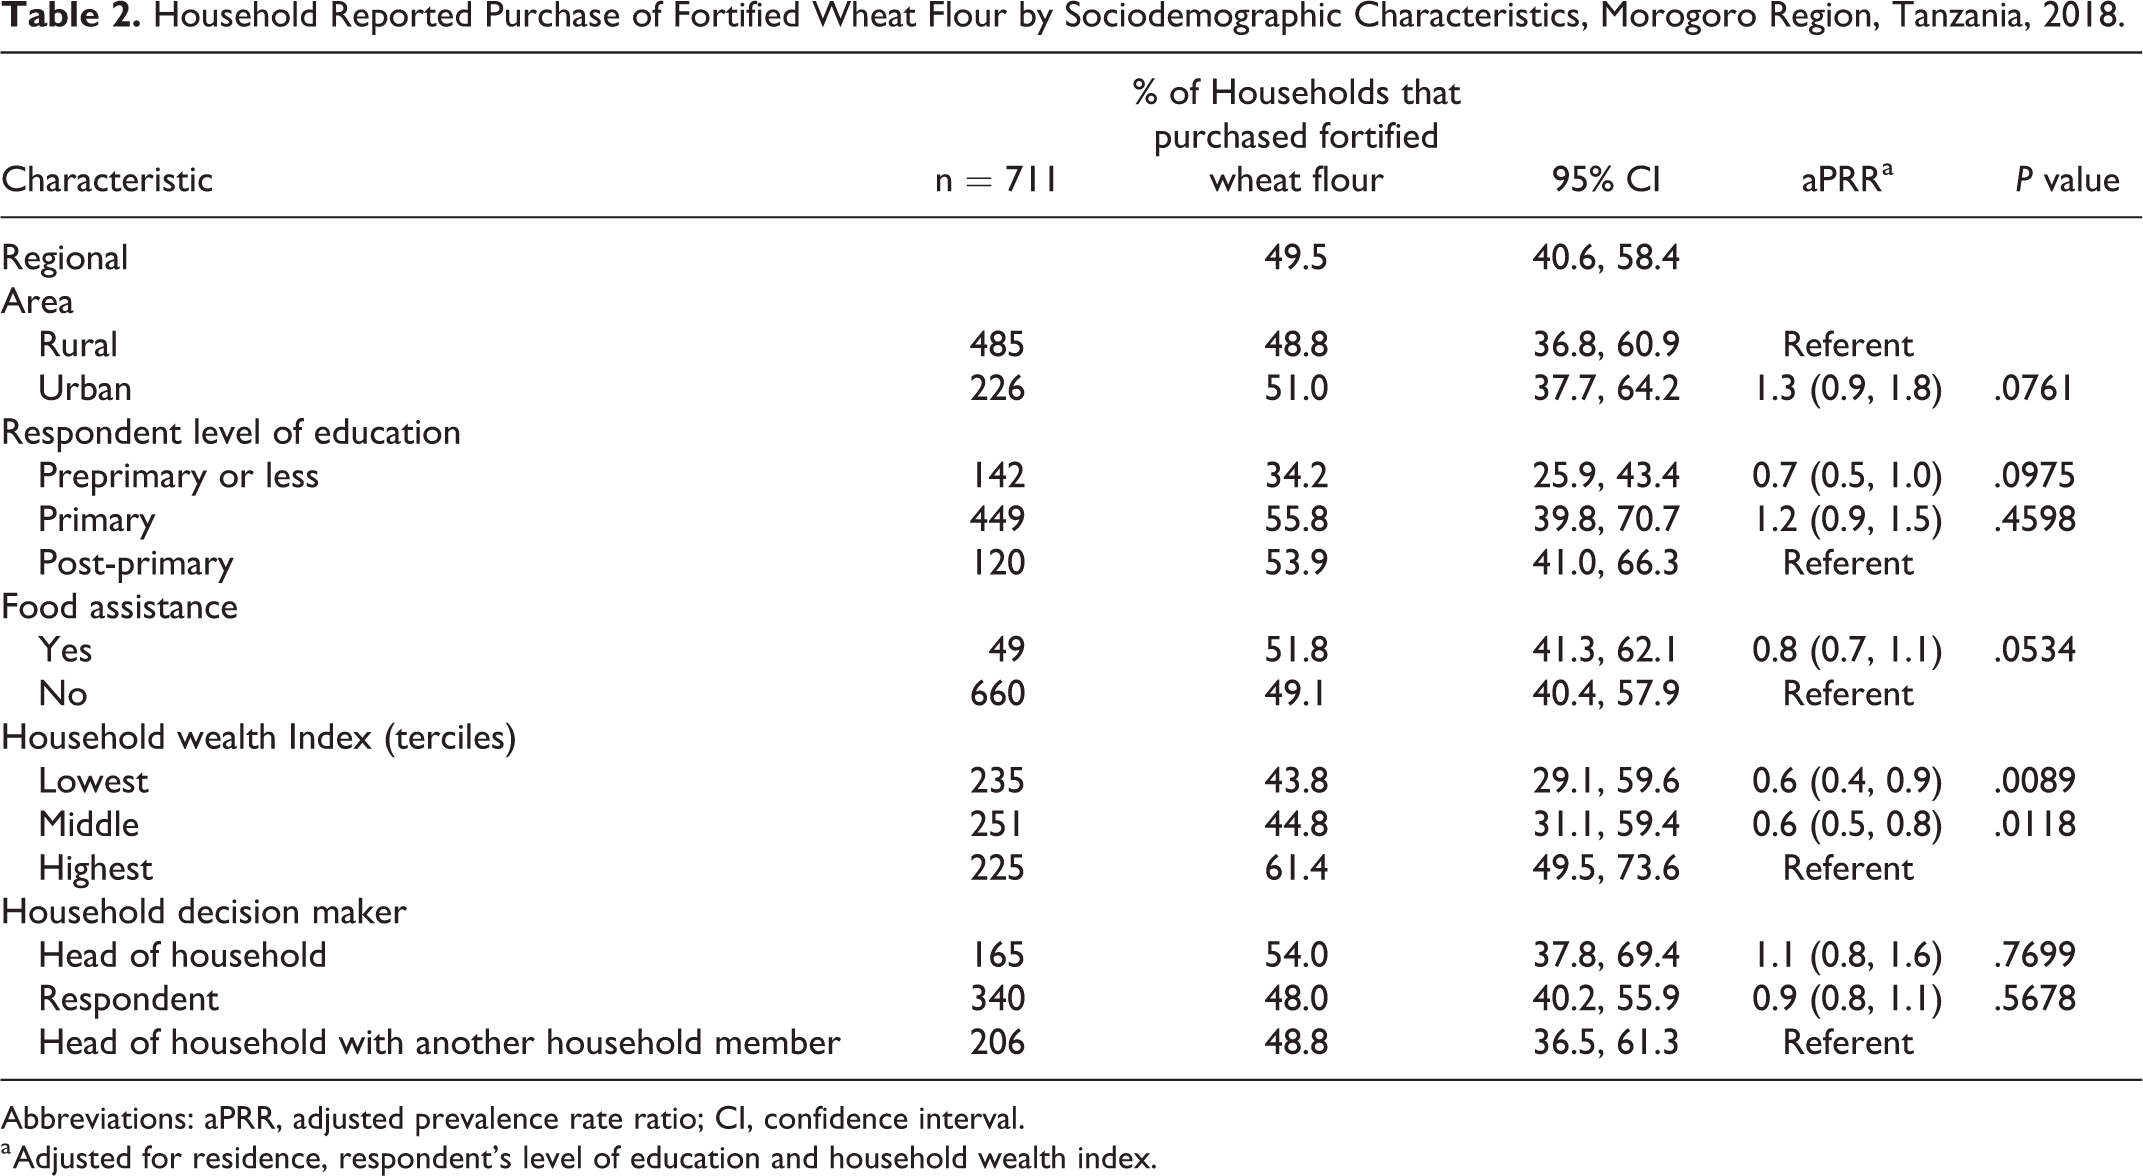
Abbreviations: aPRR, adjusted prevalence rate ratio; CI, confidence interval.
a Adjusted for residence, respondent’s level of education and household wealth index.
Table 3 highlights the coverage and months purchased of packaged maize flour by specific characteristics. In the Morogoro region, 22.9% (95% CI 17.9, 28.8) of households reported purchasing fortifiable maize flour 10–12 months of the year, 17.6% (95% CI 12.3, 24.6) 6–9 months of the year, 25.1% (19.1, 32.1) 1–5 months of the year, and 34.4% (95% CI 29.5, 39.6) reported never purchasing fortifiable maize flour during the year. This finding varied greatly between rural and urban areas. Households in rural settings were less likely to purchase fortifiable maize flour 10–12 months of the year than households in urban settings (11.2% and 46.5%; aPRR 0.2 95% CI 0.1, 0.3), and were more likely to never purchase fortifiable maize flour (rural: 39.1%, urban: 24.8%; aPRR 2.3 95% CI 1.6, 3.3). Only 11.3% (95% CI 4.9, 24.2) of households within the lower tercile of wealth in Morogoro reported consuming fortifiable maize flour 10–12 months out of the year. Of households in the lowest tercile of wealth, 31.3% (95% CI 22.4, 41.7) reported never purchasing fortifiable maize flour during the year. The estimated number of households in the region who purchased fortifiable maize flour 10–12 months of the year was 115 938 (70 705 rural and 45 233 urban households). In addition, an estimated 81 006 households purchased fortifiable maize flour 6–9 months of the year.
Frequency of Purchase of Packaged Fortifiable Maize Flour and Adjusted Prevalence Risk Ratios by Region, Area, and Wealth Index Among Households That Purchased Maize Flour, Morogoro region, Tanzania, 2018.
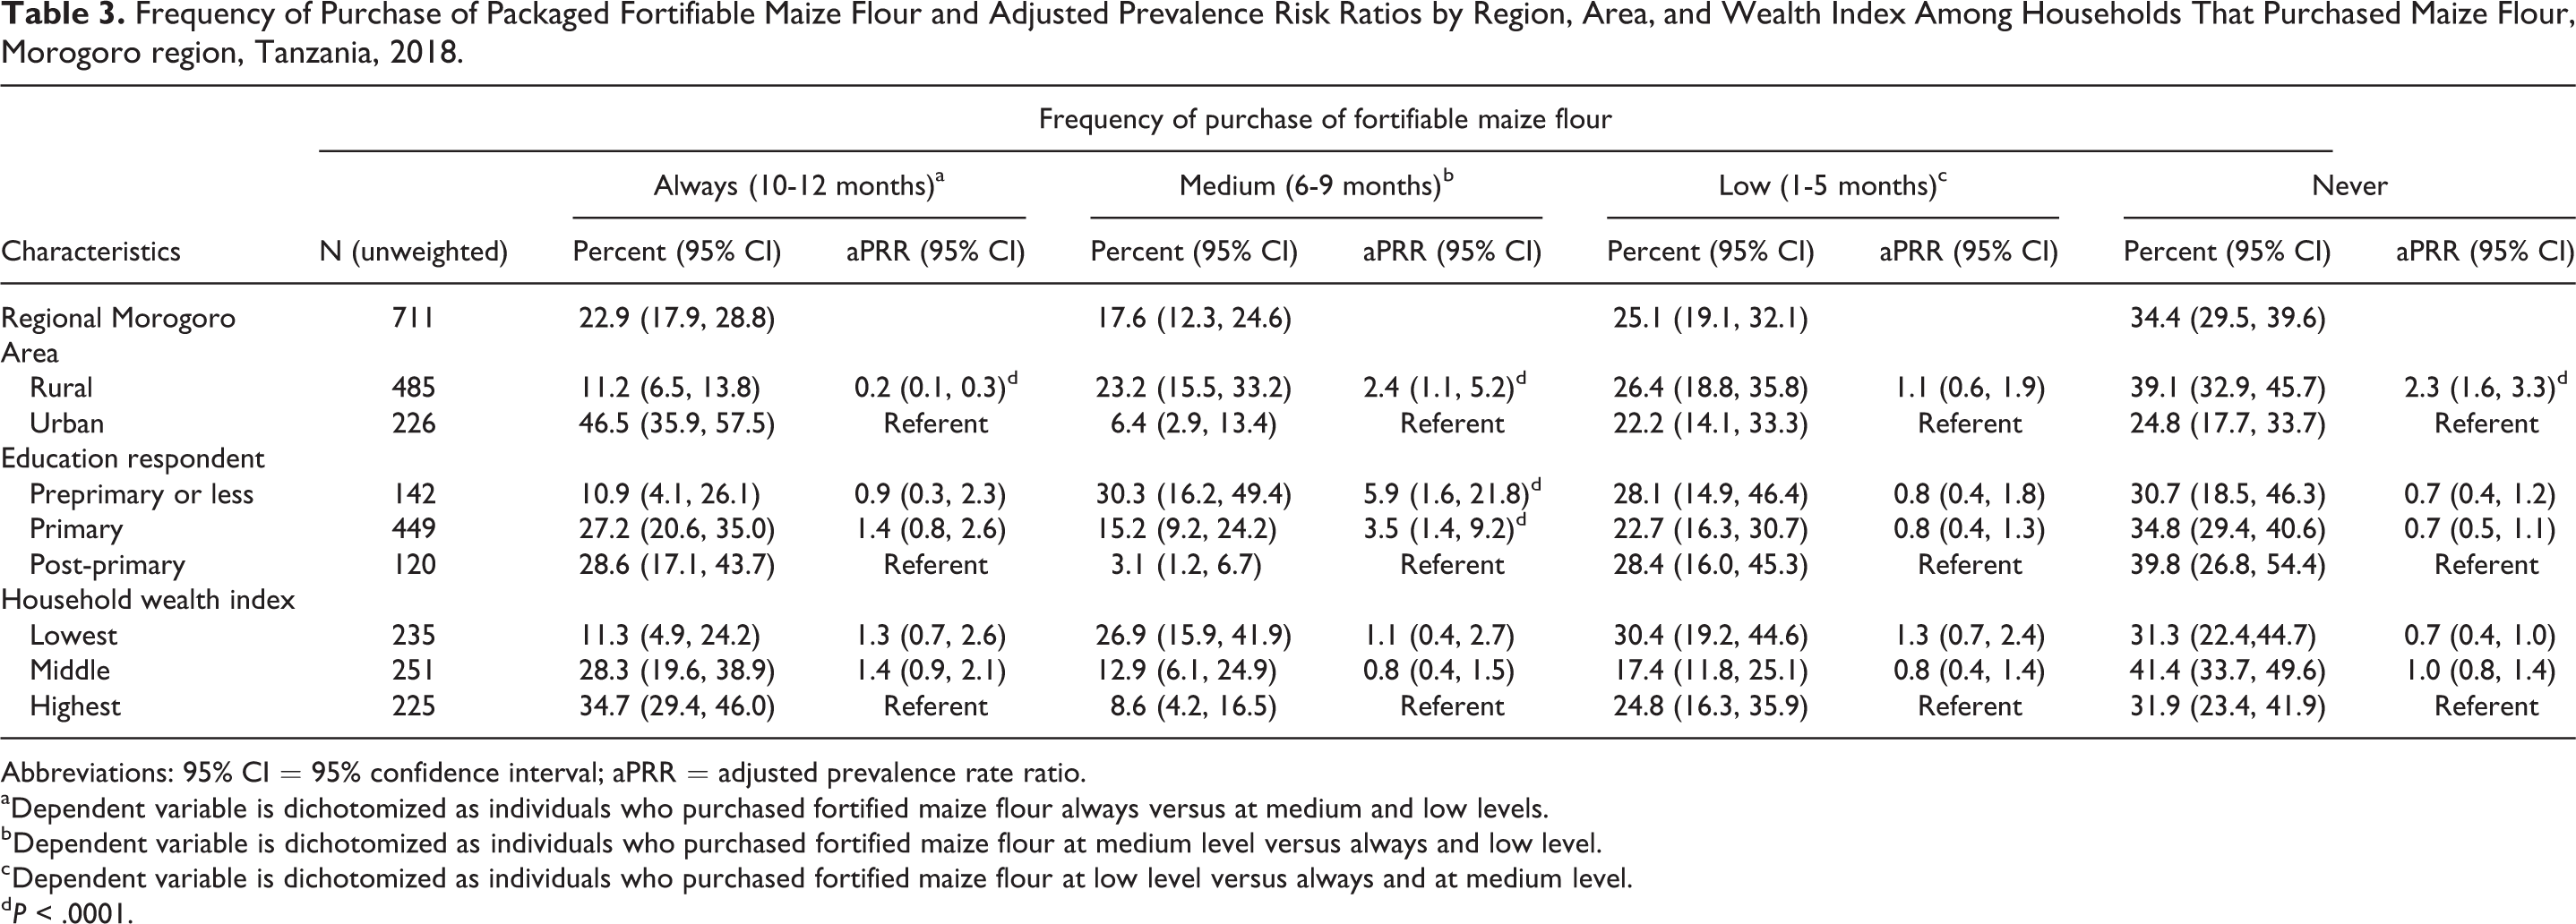
Abbreviations: 95% CI = 95% confidence interval; aPRR = adjusted prevalence rate ratio.
a Dependent variable is dichotomized as individuals who purchased fortified maize flour always versus at medium and low levels.
b Dependent variable is dichotomized as individuals who purchased fortified maize flour at medium level versus always and low level.
c Dependent variable is dichotomized as individuals who purchased fortified maize flour at low level versus always and at medium level.
d P < .0001.
Table 4 describes the estimated consumption of any maize flour by area, age-sex specific groups, and household wealth index. The regional estimated median apparent consumption of any maize flour from all sources was 209.7 g/d/AME. Rural areas had an estimated apparent consumption of 230.1 g/d/AME, whereas urban areas estimated apparent consumption was 176.2 g/d/AME. Estimated consumption was 196.4 among females and 228.7 g/d/AME among males. Generally, estimated daily maize flour apparent consumption increased with age among both females and males. Among WRA, estimated apparent consumption was 262.6 g/d/AME in rural areas and 194.4 g/d/AME in urban areas. Among children 1–3 years of age, median estimated daily apparent consumption was 105.9 in female children and 101.6 g/d/AME in male children. Overall, the lowest estimated median daily apparent consumption was among households with the highest household wealth index.
Estimated Apparent Consumption of Maize Flour (g/d/AME) by Sex, Age, Area, and Wealth Index, Among Households That Purchased Maize Flour, Morogoro Region, Tanzania, 2018.
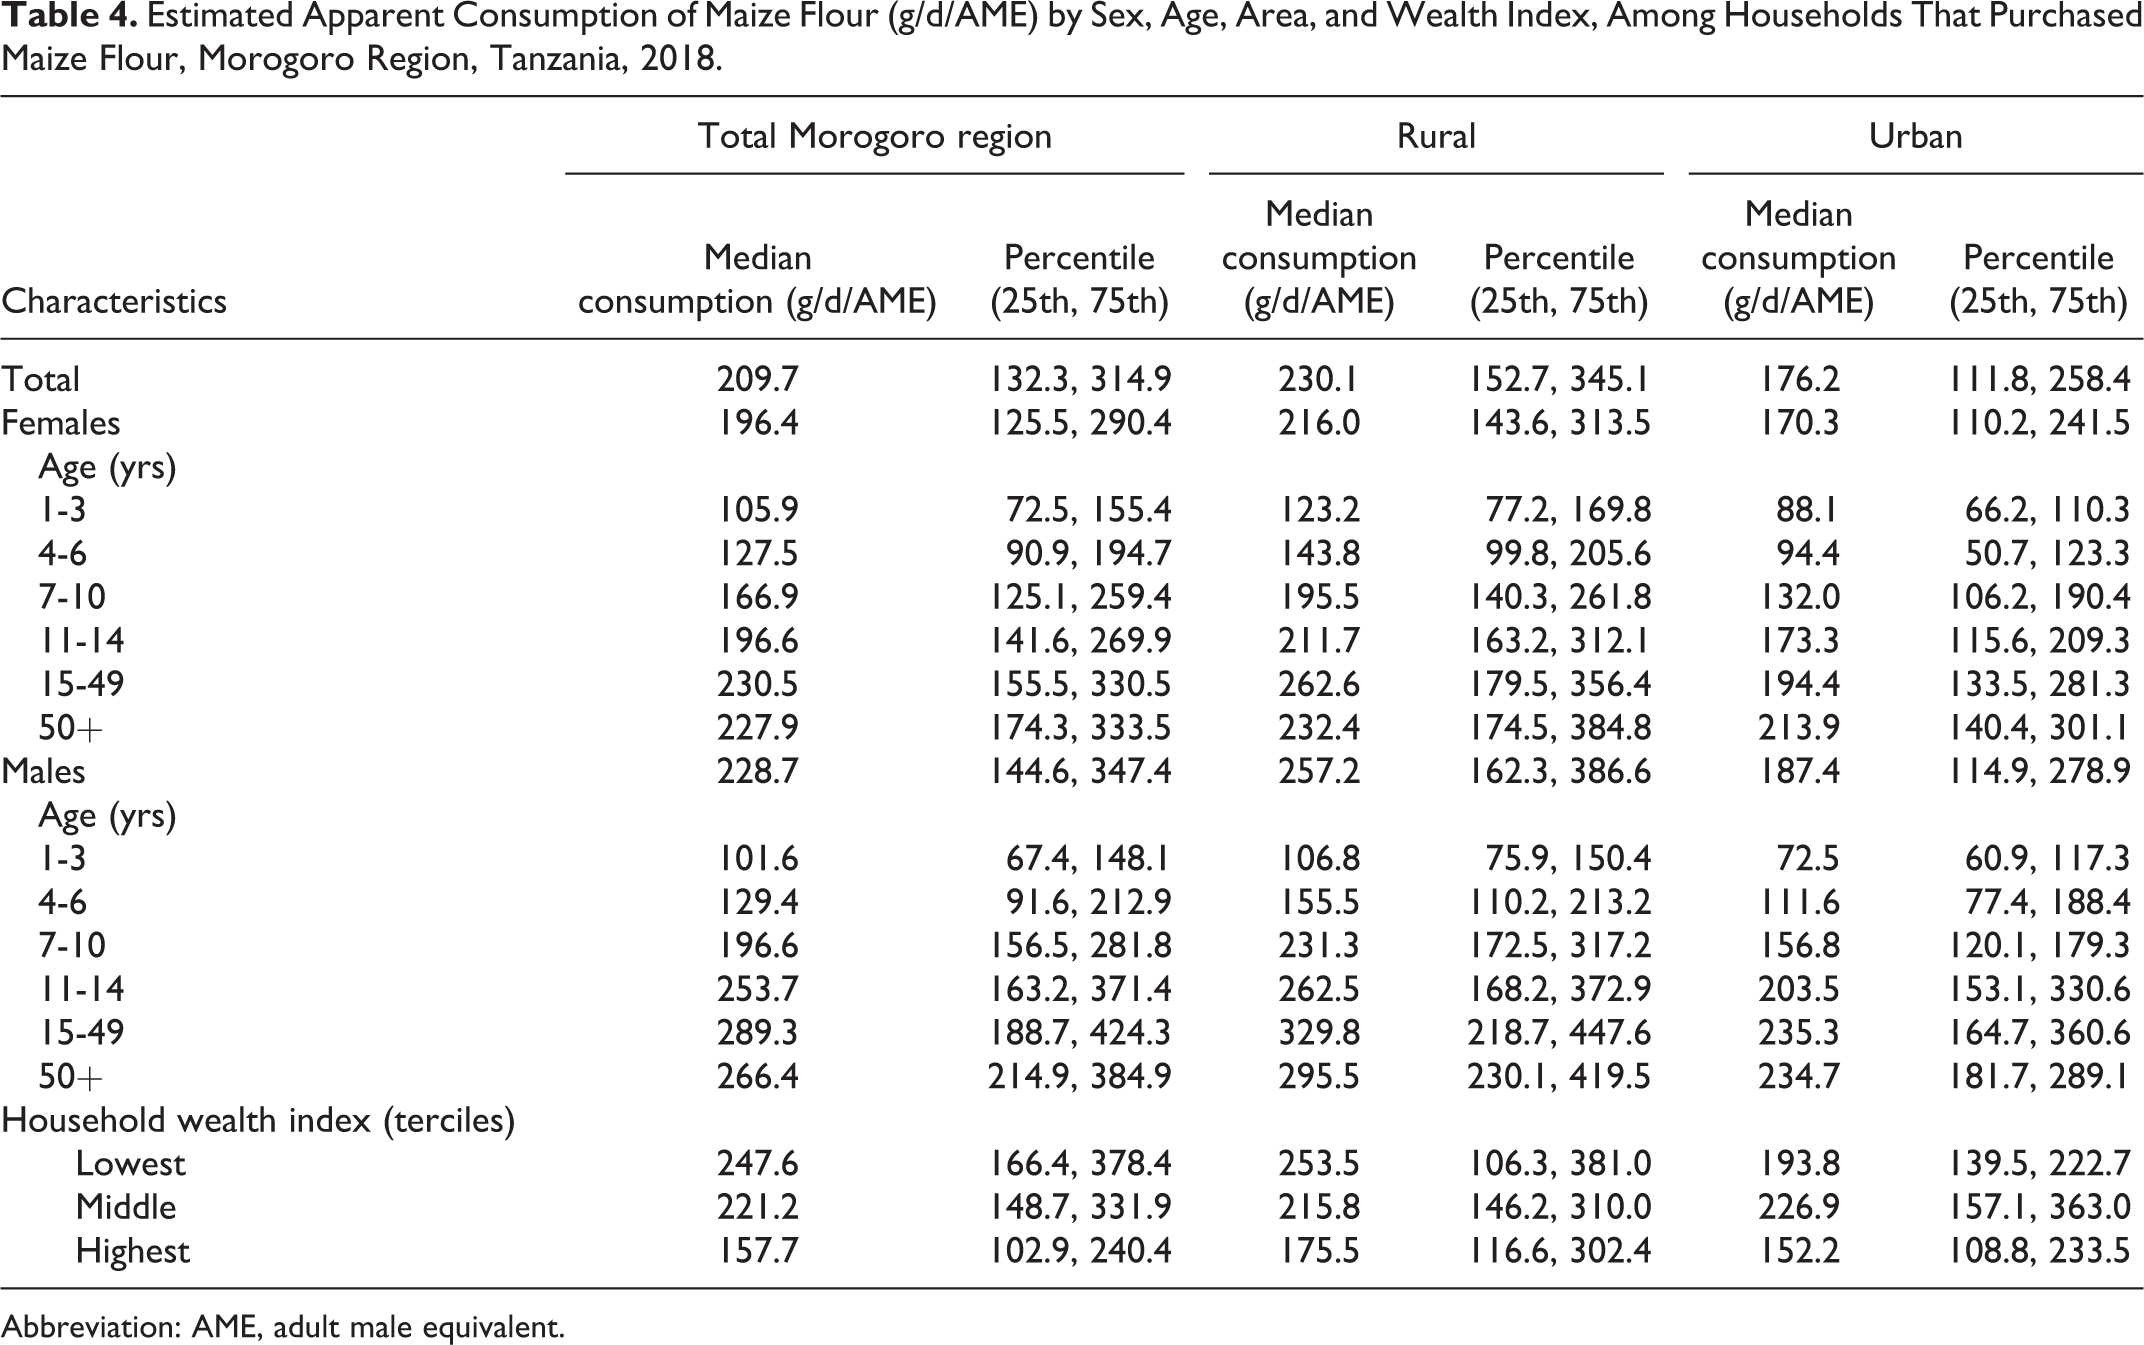
Abbreviation: AME, adult male equivalent.
Overall, the median individual apparent consumption of maize flour increased significantly with age among females (105.9 g/d/AME to 227.9 g/d/AME; P trend < .001) and males (101.6 g/d/AME to 266.4 g/d/AME; P-trend < .001). Similar patterns were observed among female and males in rural and urban areas.
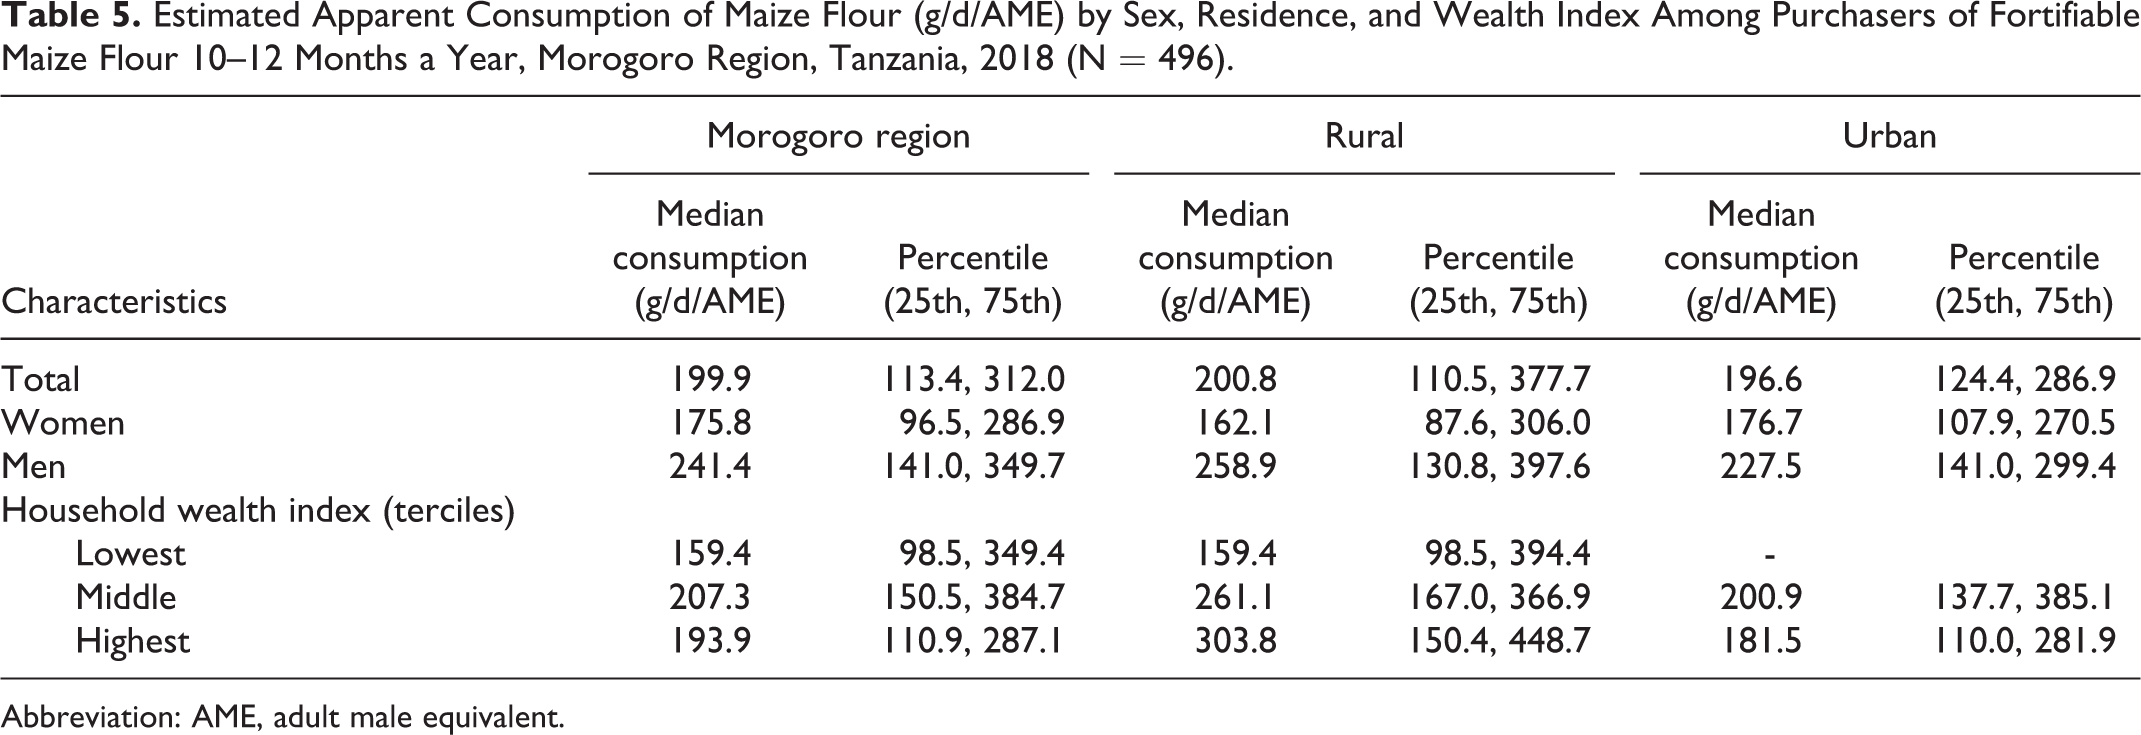
Table 5 describes the estimated apparent consumption of any maize flour by area, sex, and household wealth index among households who purchase fortifiable maize flour 10–12 months a year. Based on their estimated daily apparent consumption, these individuals on average could consume 199.9 µg of folic acid covering 49.9% of the required daily EAR. The estimated median apparent consumption of maize flour among women and men could provide 175.8 µg and 241.4 µg of folic acid, respectively, covering 43.9% and 61.2% of required daily EAR. Additionally, variation was observed by area and household wealth index. Moreover, apparent consumption of maize flour among households that purchase fortifiable maize flour 1–5 and 6–9 months of the year would provide a reduced EAR (data not shown).
Estimated Apparent Consumption of Maize Flour (g/d/AME) by Sex, Residence, and Wealth Index Among Purchasers of Fortifiable Maize Flour 10–12 Months a Year, Morogoro Region, Tanzania, 2018 (N = 496).
Abbreviation: AME, adult male equivalent.
Discussion
This is the first population-based study in the Morogoro region, Tanzania, which showed that fortification of maize flour from small-, medium-, and large-scale packaging mills has the potential to increase the intake of folic acid and other micronutrients, which could have significant health impacts on the population. Maize flour in the Morogoro region is almost universally used by all rural and urban households, which is consistent with reports on maize flour household use from Tanzania, Malawi, and Zimbabwe (Tanzania National Bureau of Statistics 13,24 ). We found that daily apparent consumption of maize flour was 209.7 g/d/AME, though it varies across subgroups. Apparent consumption of maize flour is higher in rural than urban areas (230.1 vs 176.2 g/d/AME) and lower among females than males (196.4 g/d/AME vs 228.7 g/d/AME). Fortifying packaged maize flour has the potential for increasing to 44–57% the folic acid EAR. However, even if fortification were implemented using current Tanzanian standards, consumption levels of fortifiable maize flour would still be below the recommended individual daily folic acid requirements of 400 µg, similar to other sub-Saharan countries. 24,25
This study showed that although maize flour is consumed across the Morogoro region, there is wide variation in how households purchased maize flour. Forty-one percent of the population could be reached 6 months or more with maize fortifiable flour and almost 60% of the population could be partially reached or not at all. This situation, coupled with a fragmented maize milling and distribution system formed by small- and medium-scale mills not required to fortify under the existing mandate, becomes a major implementation barrier for maize flour fortification, hindering the potential to reach a larger portion of the population.
Several fortification strategies might be needed to improve micronutrient intake among Tanzanians with limited access to industrially produced flours. One strategy might be to provide fortified packaged maize flour to vulnerable populations through social protection programs. Another strategy might be to increase promising technologies (such as dosifiers) and business models that are now available for fortifying maize flour produced at smaller mills. A dosifier is a machine that fortifies maize flour produced in small- and medium-scale mills with micronutrient premix, similar to the process used in large scale industrial mills. These dosifiers are already used at more than 400 small- and medium-scale packaging mills throughout Tanzania. 15,26 To reach households that do not use small- or medium-, or large-scale packaged maize flour, food fortification regulations could be modified to include not only the packaging mills but also the toll mills or fee-for-service mills and at the same time provide premix to these small millers, coupled with significant advocacy and education to policymakers on the benefits of fortified flour to increase demand among the rural population (Mildon A et al., 2015). 27 To ensure proper population coverage with micronutrients, the Tanzanian government might establish a surveillance system that monitors the progress of the fortification program to identify gaps in micronutrient coverage (% of the population consuming maize flour that is fortified) and/or deficiencies to adjust fortification strategies in the population at risk.
Strengths and Limitations
A major strength of this study was that the study population was representative of the Morogoro population and was large enough to provide enough power for reliable estimates within the urban and rural areas. In addition, the study allowed us to assess the potential impact of fortifying packaged maize flour in the Morogoro region. Furthermore, the survey data were collected via carefully designed and reliable procedures. Rigorous protocols were used in conducting the field work, thus minimizing factors that could have compromised data collection.
There were, however, several limitations to our study. In our estimation of consumption of maize flour, it was assumed that the maize flour that was purchased during the 7-day reference period was the only staple consumed, which underestimates the consumption of all staples. Also, because maize flour purchasing was collected at the household level and not for each specific individual, the intrahousehold variability in consumption of maize flour could not be determined. As a result, we assumed that the consumption distribution was proportional to each member’s share of the household AMEs. Also, the survey was carried out during the period immediately after the maize harvest, when consumers have the most access to raw maize. As farmers have plenty of raw maize to mill or sell on the market, toll milling is highest during this period and demand for packaged flour is lower. Therefore, we may have underestimated the consumption of packaged maize flour.
Conclusions
Fortifying maize flour at small- and medium-scale commercial packaging mills is a promising strategy for increasing household consumption of micronutrients in Tanzania among 66% of households. Increased consumption of folic acid among WRA has been associated with reducing the likelihood of having a baby born with an NTD. However, even if fortification were implemented using current Tanzanian standards, estimated consumption levels of fortified maize flour would fall below the recommended daily folic acid requirements of 400 µg for WRA.
Additional strategies may be needed to reach the most vulnerable populations to ensure that fortified maize flour is available throughout the year. Establishing surveillance systems that monitor the progress of the fortification program and identify gaps in micronutrient coverage and/or deficiencies may help ensure proper population coverage. Further assessment of the feasibility of implementation and effectiveness of fortification innovations (products, devices, premix) may inform future approaches.
Footnotes
Authors’ Note
The findings and conclusions in this report are those of the authors and do not necessarily represent the official position of the Centers for Disease Control and Prevention.
Declaration of Conflicting Interests
The author(s) declared no potential conflicts of interest with respect to the research, authorship, and/or publication of this article.
Funding
The author(s) received no financial support for the research, authorship, and/or publication of this article.