
Abstract
Background:
In Africa, little is known about the epidemiological significance of vitamin B12 deficiency.
Objective:
To analyze regional and country-specific trends (1990-2017) in vitamin B12 supply in Africa and estimate the prevalence of inadequate intake.
Methods:
National food balance data compiled by Food and Agriculture Organization for 45 African countries were used. Per capita food supplies for 95 commodities were transformed into B12 contents (µg/capita/day) assuming no fortification and B12 density was determined per 1000 kcal. Estimated Average Requirement cut point method was used for estimating the prevalence of inadequate intake.
Results:
Over the period, the mean per capita B12 supply in Africa significantly increased by 12.7% from 2.02 to 2.27 µg/capita/day (z = 5.27, P < .001). However, the B12 density remained below the reference goal of 0.8 µg/1000 kcal. In 2017, the B12 supplies (µg/capita/day) in Northern (3.52), Central (3.15), and Southern Africa (2.99) were considerably higher than Western (2.10) and Eastern Africa (1.36) regions. The supply in upper-middle- or high-income countries (3.21) was also substantially higher than low- (1.58) and low-middle-income (2.58) countries. In 2017, the B12 supplies ranged from 5.95 in Mauritius to 0.66 in Ethiopia. Similarly, the nutrient density extended from 1.88 in Gambia to 0.28 in Ethiopia. In Africa, the estimated prevalence of inadequate intake declined from 48.1% in 1990 to 29.9% in 2007 and resurged to 40.6% in 2017. In 2017, the prevalence of inadequate intake was nearly universal (> 90%) in 4 countries and exceeded 50% in 8 more countries.
Conclusion:
Many African countries have major deficits in vitamin B12 supply.
Background
Vitamin B12 is unique among vitamins because of its complex chemical structure that contains a metal ion. 1 Vitamin B12 is a coenzyme in one-carbon metabolism and is indispensable for diverse physiological functions including synthesis of nucleic acid, erythropoiesis, metabolisms of folate, branched-chain amino acids, and odd-chain fatty acids. 1 -4 Further, B12 is required for the normal function and regeneration of the nervous system through the formation of myelin sheath. 5 B12 can only be synthesized by certain microorganisms, including normal flora bacteria of the gastrointestinal tract of humans and animals. As a result, all naturally occurring plant-based diets are devoid of B12. 1
Vitamin B12 deficiency is primarily caused by inadequate dietary intake or poor absorption. 1,6 Limited access to animal source foods and vegetarianism are the primary causes of inadequate intake; whereas aging, atrophic gastritis, or pernicious anemia lead to malabsorption. 1,6 Limited information is available on the global and regional prevalence of vitamin B12 deficiency, yet a systematic review suggested that serum B12 concentration is fairly low in many high- or low-income settings. 7 A systematic review of national and local surveys in Latin America and the Caribbean also reported a high prevalence of low or marginal vitamin B12 status. 8 Conversely, a study concluded clinical vitamin B12 deficiency is rare but subclinical deficiency may range between 2.5% and 26%. 9
In Africa, data on the epidemiology of vitamin B12 deficiency are limited and the nutrient has so far received little attention both from public health and clinical perspectives. Yet, the magnitude is expected to be high due to limited access of the African population to animal source foods. According to an estimate based on national food balance data of the Food and Agriculture Organization of the United Nations (FAO), in 2018, the meat supply in many of African countries was below 20 kg/person/year. 10 Similarly, the average milk consumption was less than 50 kg/person/year. 10 Recent national micronutrient surveys in Malawi, 11 Kenya, 12 and Ethiopia 13 indicated a high burden of B12 deficiency among women in the reproductive age. In Malawi, 54% of women had B12 depletion or deficiency. 12 In Kenya and Ethiopia, 35% and 15% were deficient. 13,14 However, in Ghana, the prevalence was relatively lower (7%). 15
The purpose of the current study was to analyze the regional and country-specific trends (1990-2017) in vitamin B12 supply in Africa and to estimate the prevalence of inadequate B12 intake based on national food balance data compiled by FAO.
Methods
Study Design
This time-trend analysis was conducted based on per capita food supplies data from the Food Balance Sheets (FBS) compiled for 45 African countries by FAO for the period 1990 to 2017. According to the 2017 estimate, the 45 countries in combination had a population exceeding 1.1 billion people. National FBS dating back to the early 1960s is available. However, in the current analysis, with the intention of concentrating on the recent trends, 1990 was taken as the base year. The compilation of the FBS for the recent 3 years (2018-2020) had not been completed and hence not included in the analysis. Nine African countries (Burundi, Comoros, Democratic Republic of Congo, Equatorial Guinea, Eritrea, Libyan, Seychelles, Somalia, and Southern Sudan) had not been included because their food balances are not publicly available. 15,16
Nature of the FBS
Food Balance Sheets estimates the food supply of a given country as a balance of domestic production, imports, exports, and changes in stocks for major commercialized food commodities. Adjustments are also made for food waste (including harvest, storage, and transportation losses) and the use of food for other purposes (feeds, seeds, biofuels). Nearly 100 primary (eg, bovine meat, milk) and processed commodities (eg, butter) are monitored. Food Balance Sheet is issued on yearly basis as a moving average of the food supply over the preceding 3-year period. Food Balance Sheet quantifies food potentially available for human consumption and estimate overall surpluses or shortages in the territory. Food Balance Sheet is assembled from a variety of sources including official statistics on production, trade, stock changes, and industrial use. Food Balance Sheet is considered as an important tool for designing and evaluating national food and agriculture policies. 17
Study Setting
As of 2019, Africa has a population of 1.3 billion—equivalent to 16% of the world’s total. 18 The continent comprises 54 sovereign countries of which 46 are low or lower-middle-income economies. In Africa, rates of poverty have declined over the past 3 decades. 19 However, uncontrolled population growth has actually increased the number of poor and Africa remains the world’s poorest region. In 2012, more than 300 million Africans were living in absolute poverty (earning less than $1.90 a day). 19 Africa’s major economic challenges include political instability, population pressure, and degradation of natural resources.
Estimation of Vitamin B12 and Calorie Contents of the Food Commodities
The supply statistics (kg/capita/year) for 95 food commodities was first transformed into daily equivalents, and then vitamin B12 and calorie contents were estimated using Food Data Central composition database of the US Department of Agriculture (USDA). 20 B12 contents were determined assuming no fortification. Per capita, vitamin B12 supply was computed by multiplying the quantity of food commodities by their respective B12 concentrations as taken from the composition database. The B12 and calorie composition database constructed for the analysis is provided as a supporting file (Supporting File 1).
The FBS presents all data on meat in terms of carcass weight with bone-in. 17 Carcase weight was converted into retail weight using the conversion factors recommended by USDA: bovine meat (70%), mutton or goat meat (89%), pig meat (77.6%), poultry meat (86.9%), and fish (100%). 21 For eggs and edible offal, conversion ratios of 98.5 and 100%, respectively, were assumed. 21 For the commodity “offal”—the category that includes at least 17 edible parts or organs of the animals—dependable data on B12 contents were not available in Food Data Central or any other database. Accordingly, the average B12 contents for all flesh foods was assumed. All plant source foods were considered to have no B12. Finally, the daily B12 supplies for the 95 commodities were summed, and the total B12 (µg/capita/day) was estimated for each country year.
Estimation of Vitamin B12 Density
Daily per capita vitamin B12 density was estimated per 1000 kcal as daily vitamin B12 supply (µg/capita)/daily calorie supply (kcal/capita)×1000. Value of 0.80 µg/per 1000 kcal/d was considered as the reference micronutrient density. 22
Estimation of Prevalence of Inadequate B12 Intake
The prevalence of inadequate B12 intake for each country year was estimated using the Estimated Average Requirement (EAR) cut point method proposed by the Food and Nutrition Board of Institute of Medicine (FNB/IOM). 23 The EAR cut point method assumes distribution of requirements is symmetrical at the mean and probability below the EAR is estimated as inadequate intake by consulting standard normal probability distribution. 23
In order to estimate the country-year-specific prevalence of inadequate intake, the following procedures were completed. (1) The EAR for vitamin B12 for all relevant age, sex, and physiological groups (lactation and pregnancy) was adopted from the FNB/IOM Dietary Reference Intakes recommendations. 24 For the age 0 through 12 months, FNB/IOM specified adequate intake rather than EAR. Accordingly, EAR of 0.32 µg/d extrapolated by FAO 1 was assumed for the age group 6 to 12 months, whereas for infants 0 to 5 months, dietary requirement was taken as nil assuming universal exclusive breastfeeding. (2) Country-year-specific population size and composition (based on age, sex, pregnancy, and lactation status) was worked out using the data of the Department of Economic and Social Affairs of the United Nations. 18 Number of lactating women assumed to be equivalent to infants younger than one year. Numbers of pregnant women were estimated by assuming that 8.5% of women of reproductive age are pregnant. (3) Population-weighted country-year-specific EAR was computed. (4) Prevalence of inadequate intake estimated using the formula z = (x – µ)/s, where x is the mean population EAR for a specific country-year, µ the average vitamin B12 supply (µg/capita/day), and s is the standard deviation of the intake distribution—equal to 25% of the mean. 25 Z values were converted to probabilities using the Microsoft Excel program assuming standard normal probability distribution.
Data Management and Analysis
Statistical analysis of the data was performed using SPSS (version 24) and R (version 4.0.2) programs. For the periods 1990 to 2012 and 2013 to 2017, the food supply statistics and the population size for each country were downloaded from the old 15 and new 16 FAOSTAT databases, respectively. Data coming from the 2 datasets were harmonized and merged.
Vitamin B12 supply, nutrient density, and prevalence of inadequate intake in Africa were further disaggregated by country, geographic regions, and national income levels. Geographical classifications into Northern, Eastern, Southern, Western, and Central regions were made in accordance with the UN subregion classification. 26 Furthermore, in conformation with the World Bank classification based on national income, the countries were divided into low-income ($1035 or less), lower-middle-income ($1036-$4045), upper middle-income ($4046-$12 535) or high-income ($12 536 or more) economies. 27 The geographic and economic classification of the countries is provided as a supporting file (Supporting File 2). Whenever estimates are provided by aggregating multiple countries, population-weighted analysis was used.
Trend in a time series was analyzed via Mann-Kendall trend test and z-score and corresponding P values are reported. Positive z-score with significant P value indicates a positive monotonic trend and the opposite holds true for negative z-scores. 28 Percentage increment in vitamin B12 supply over the study period (1990-2017) was estimated by dividing the difference between 1990 and 2017 to the base value in 1990.
Results
Characteristics of the Countries
The food balance data for 45 countries were available for analysis. According to the UN subregion classification, 16 Western, 12 Eastern, 7 Central, 5 Northern, and 5 Southern African countries were included. Based on the World Bank classification by gross national income (GNI) per capita, 27 one high-income country (Mauritius), 4 upper-middle-income, 22 lower-middle-income, and 18 low-income countries were represented.
Vitamin B12 Supply by Regions, National Income, and Countries
Between 1990 and 2017, the per capita vitamin B12 supply in Africa has increased steadily by 12.7% from 2.02 to 2.27 µg/capita/day (z = 5.27, P < .001). The increase has been particularly strong in Northern Africa region that had the highest B12 supply in the continent since 2007 (z = 6.38, P < .001). The Central Africa region also recently experienced significant positive changes (z = 4.36, P < .001). The Southern Africa had the highest supply until 2007, however, due to the flat trend it had exhibited (z = 0.83, P = .406), it was overtaken by the Northern and Central regions. The Western Africa regions showed a positive trend between 1990 and 2007 (z = 3.72, P < .001), but since 2007 the trend was reverted (z = −2.60, P = .009). The Eastern African region had the lowest supply throughout the period. However, slow but significant positive changes have been observed in the region (z = 3.88, P < .001).
In 2017, the per capita supplies (µg/capita/day) in Northern (3.52), Central (3.15), and Southern (2.99) regions were considerably higher than the corresponding figures for Western (2.10) and Eastern Africa (1.36) regions (Figure 1).
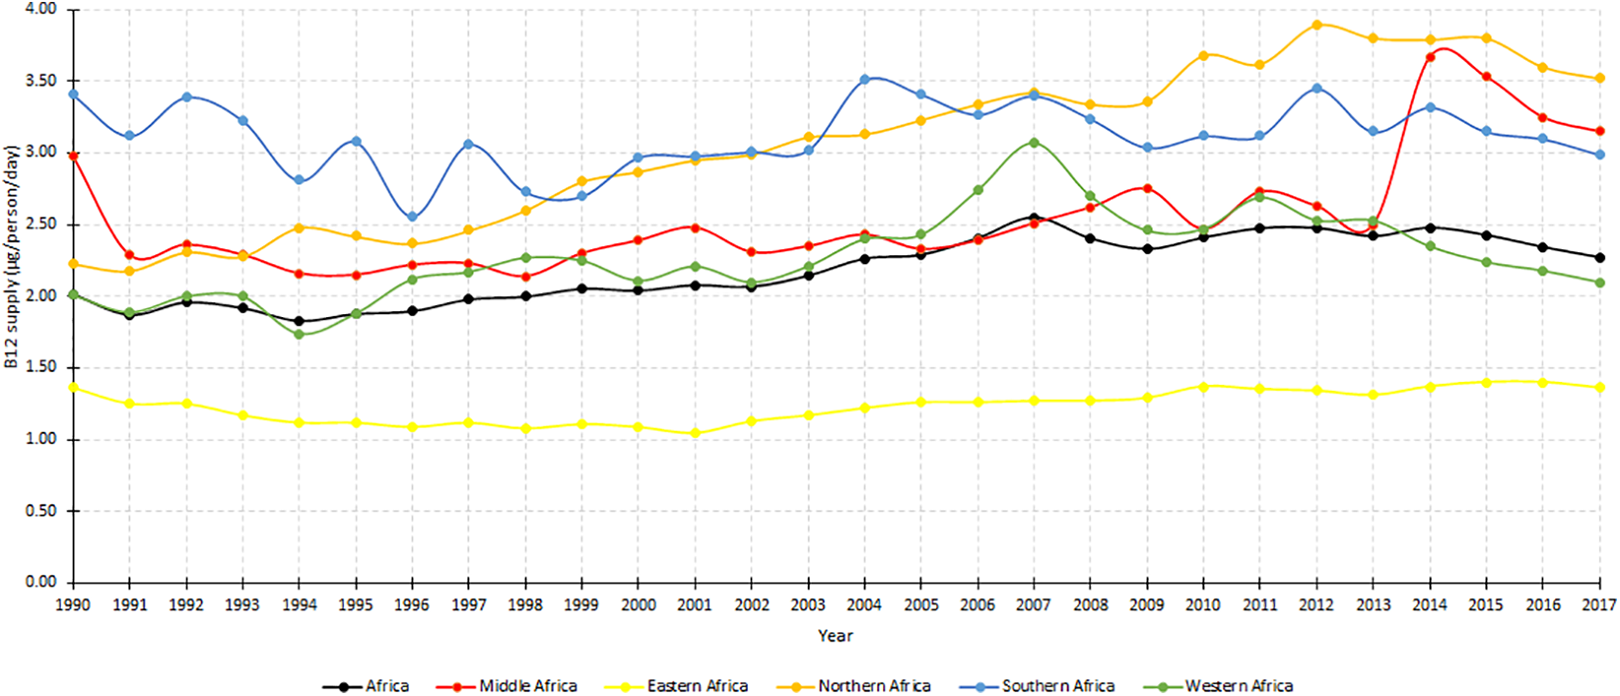
Mean vitamin B12 supply (µg/capita/day) in 5 regions of Africa, 1990 to 2017.
Trends (1990-2017) in vitamin B12 supply in African countries categorized into 3 income levels (low, low-middle and upper-middle, or high-income) are shown in Figure 2. The B12 supply was by far higher in the latter as compared to low or low-middle countries. In 2017, the B12 supply (µg/capita/day) in upper-middle or high-income countries was 3.21 in contrast to 2.58 and 1.58 in low-middle and low-income countries, respectively. Trend analysis indicated statistically significantly improvements in low-middle-income countries (z = 5.32, P < .001) and low-income countries (z = 4.03, P < .001) but not in upper-middle or high-income countries (z = 0.57, P = .566; Figure 2).
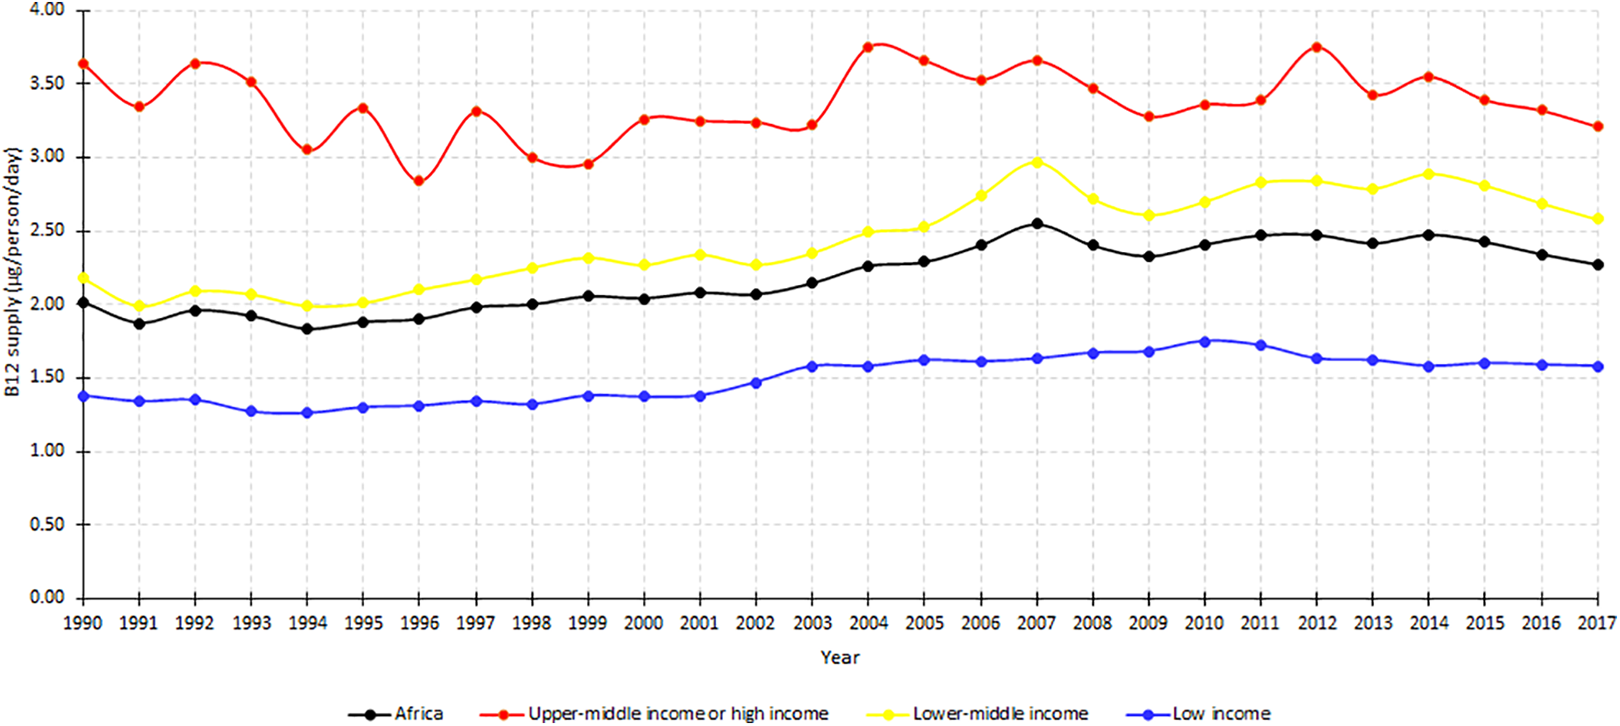
Mean vitamin B12 supply (µg/capita/day) in Africa by national income, 1990 to 2017.
The vitamin B12 supply differed markedly among the 45 countries. In 2017, the daily per capita vitamin B12 supply (µg/capita/day) ranged from 5.95 in Mauritius to 0.66 in Ethiopia. Comparison among the countries based on the 2017 data suggested Ethiopia, Guinea-Bissau, Lesotho, Liberia, Malawi, Nigeria, Niger, and Rwanda were in the lowest fifth of the B12 supply. Conversely, Mauritius, Gambia, Gabon, Morocco, Sao Tome and Principe, Ghana, Sierra Leone, Tunisia, and Mauritania were in the upper fifth. Mann-Kendall test over the period indicated a significant positive monotonic trend for 23 countries, no changes for 17 countries and declining trends for 5 countries (Madagascar, Senegal, Togo, Tanzania, and Gabon; Table 1).
Vitamin B12 Supply (µg/capita/day) in 45 African Countries in 5-Year Interval Between 1990 and 2017.
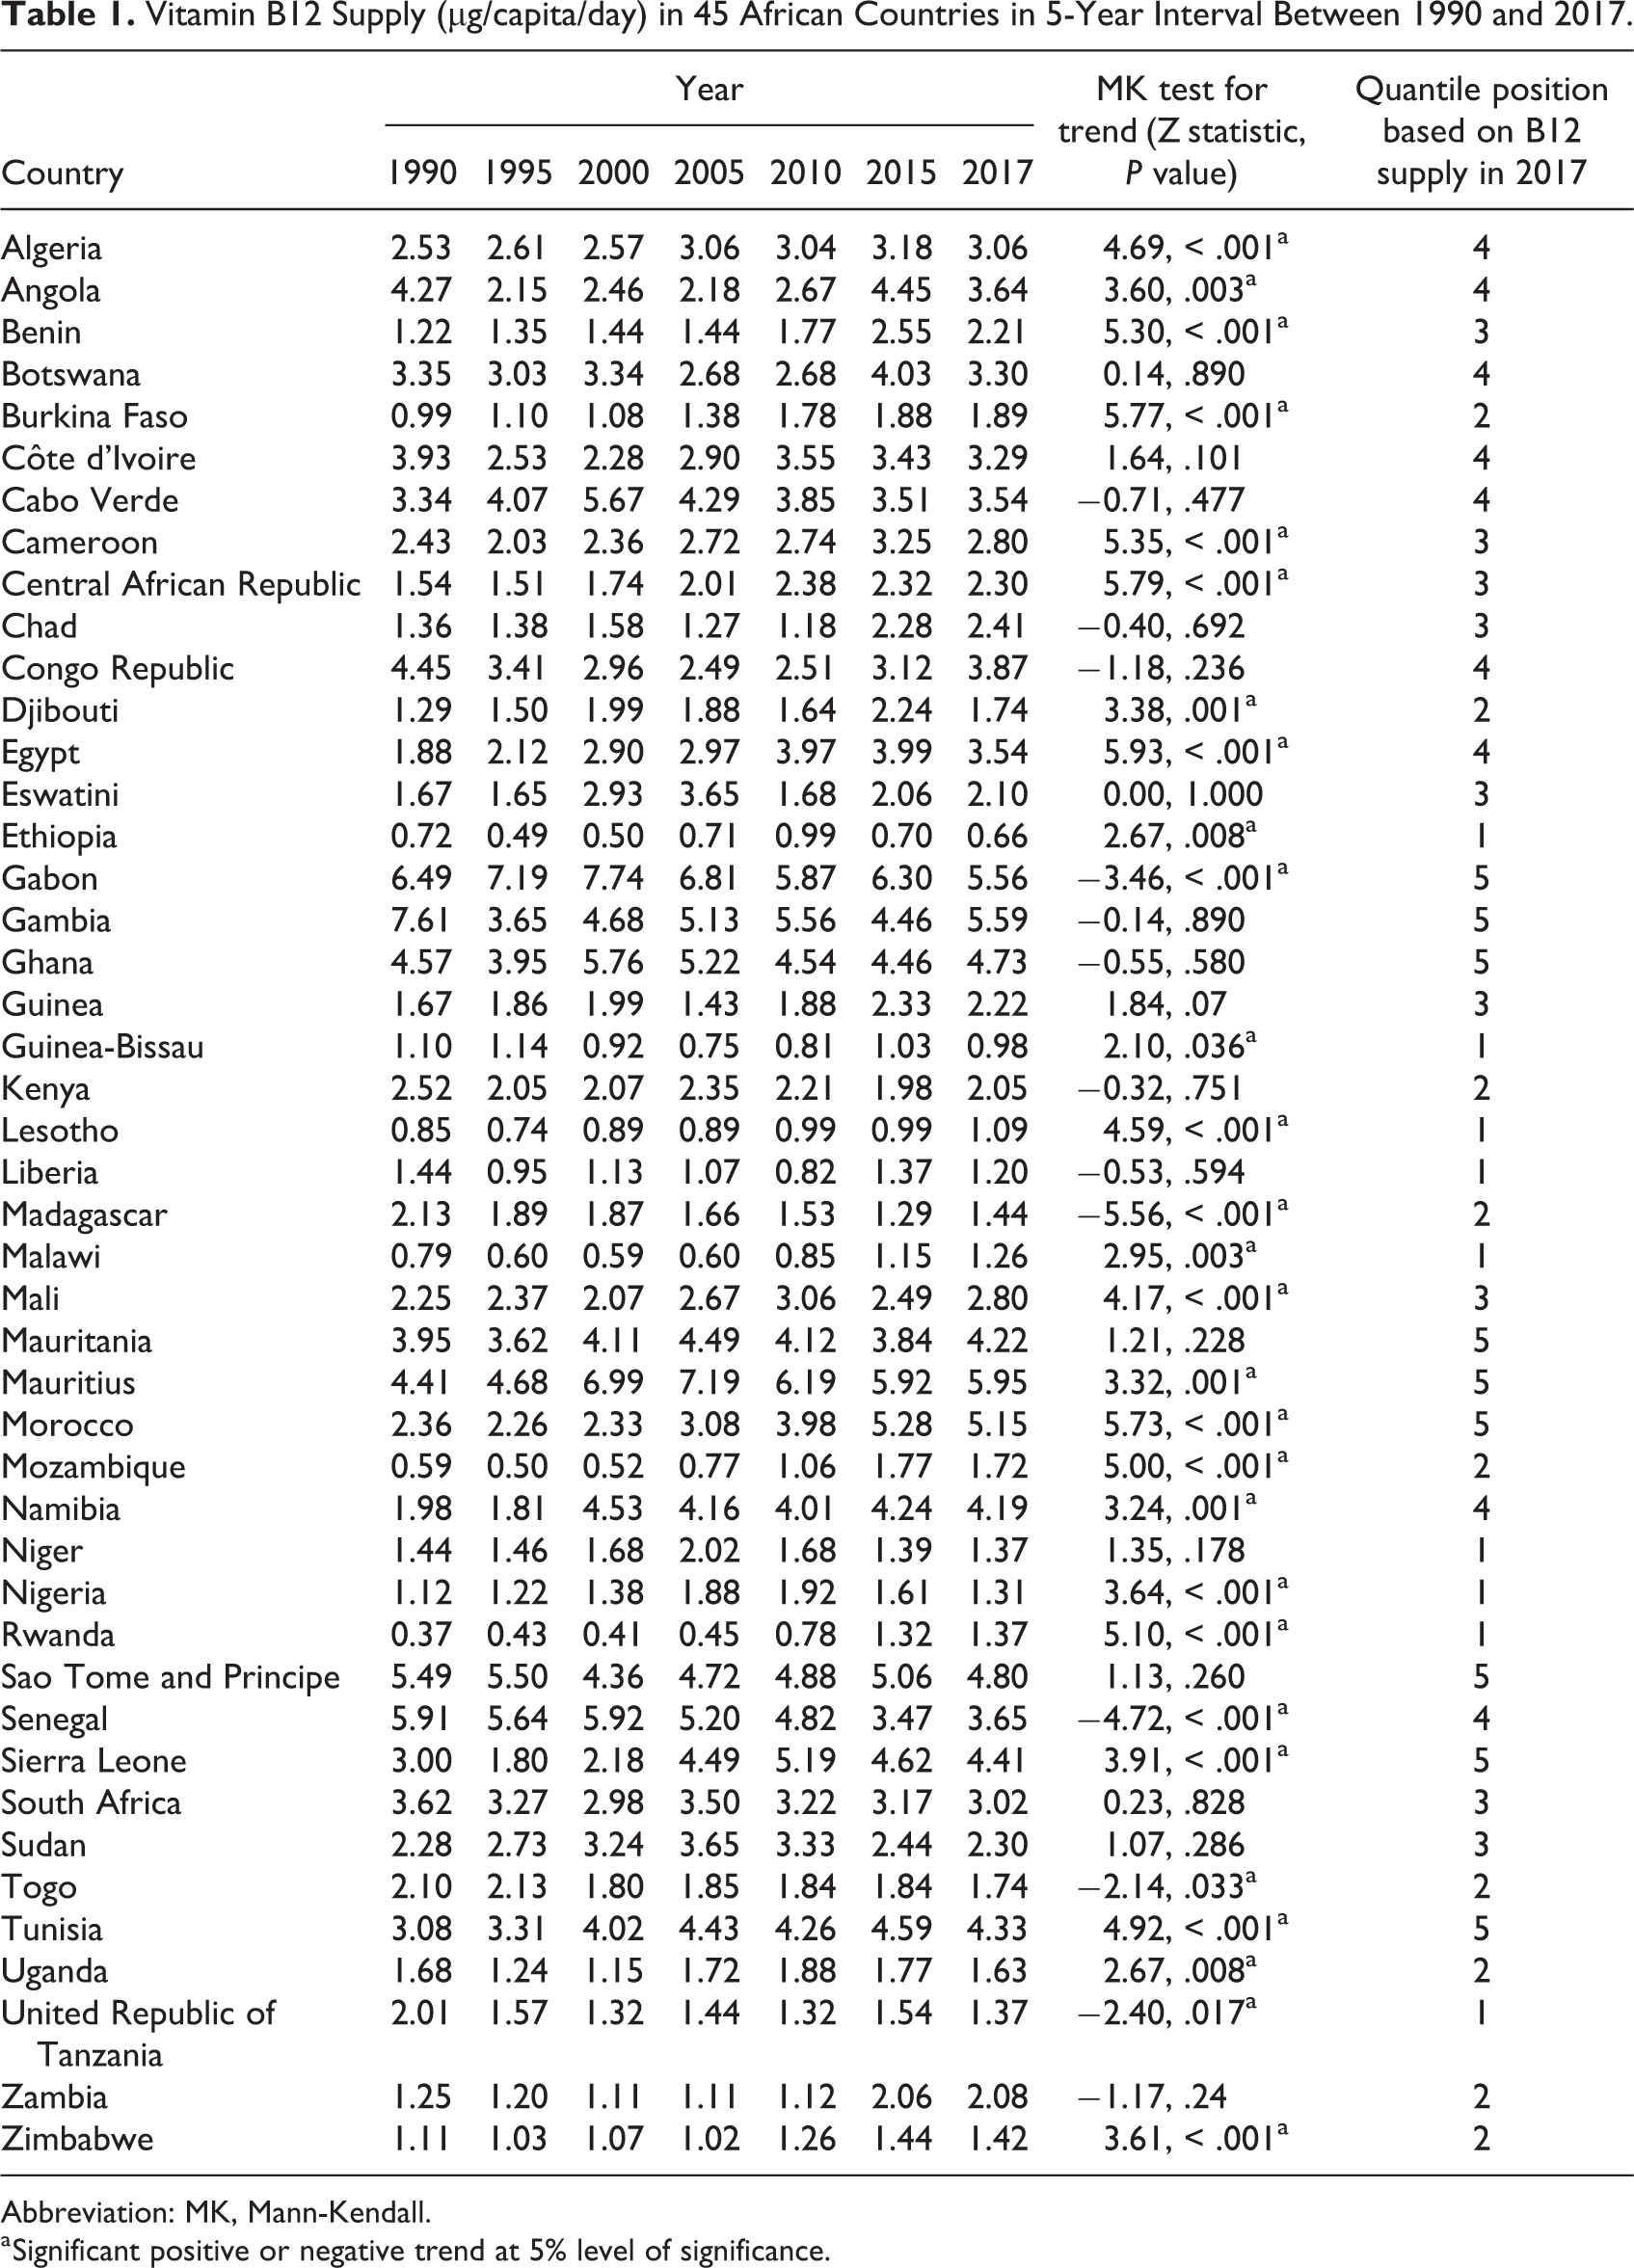
Abbreviation: MK, Mann-Kendall.
a Significant positive or negative trend at 5% level of significance.
Vitamin B12 Density
Figure 3 shows the vitamin B12 density (µg/1000 kcal) in the African food supply disaggregated by geographic regions between 1990 and 2017. In the continent, the vitamin B12 density remained below the reference goal of 0.8 µg/1000 kcal 22 throughout the period except marginal rise in 2007. The nutrient density was consistently above 0.8 µg/1000 kcal/d for Northern, Southern, and Central African regions but the opposite holds true for Eastern and Western Africa (Figure 3). In terms of income levels, the nutrient density in low-income countries remained below 0.8 µg/1000 kcal/d, while upper-middle-income countries remained above the threshold (Figure 4).
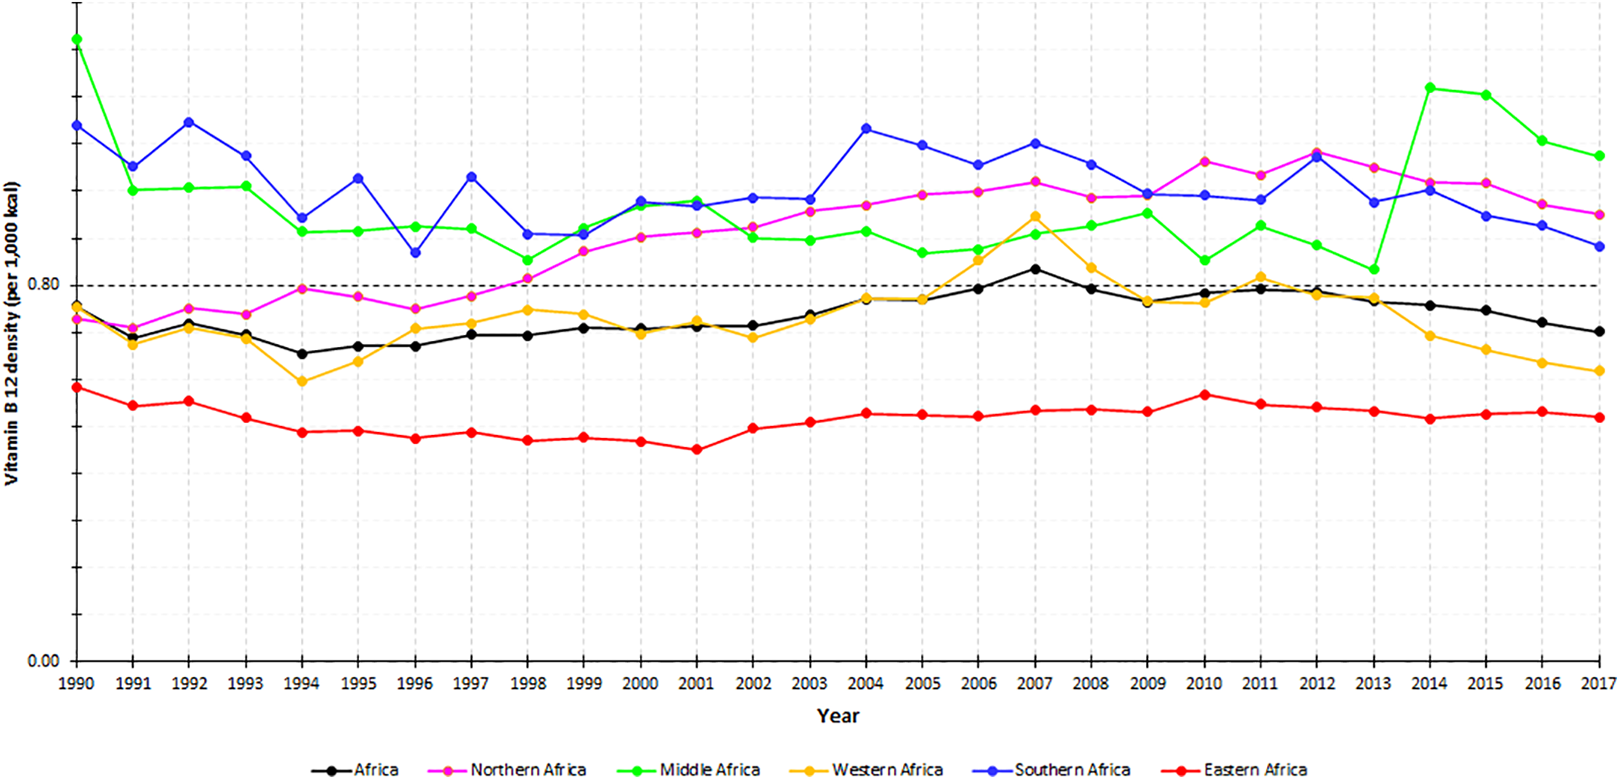
Mean vitamin B12 density (µg/1000 kcal) in 5 regions of Africa, 1990 to 2017.
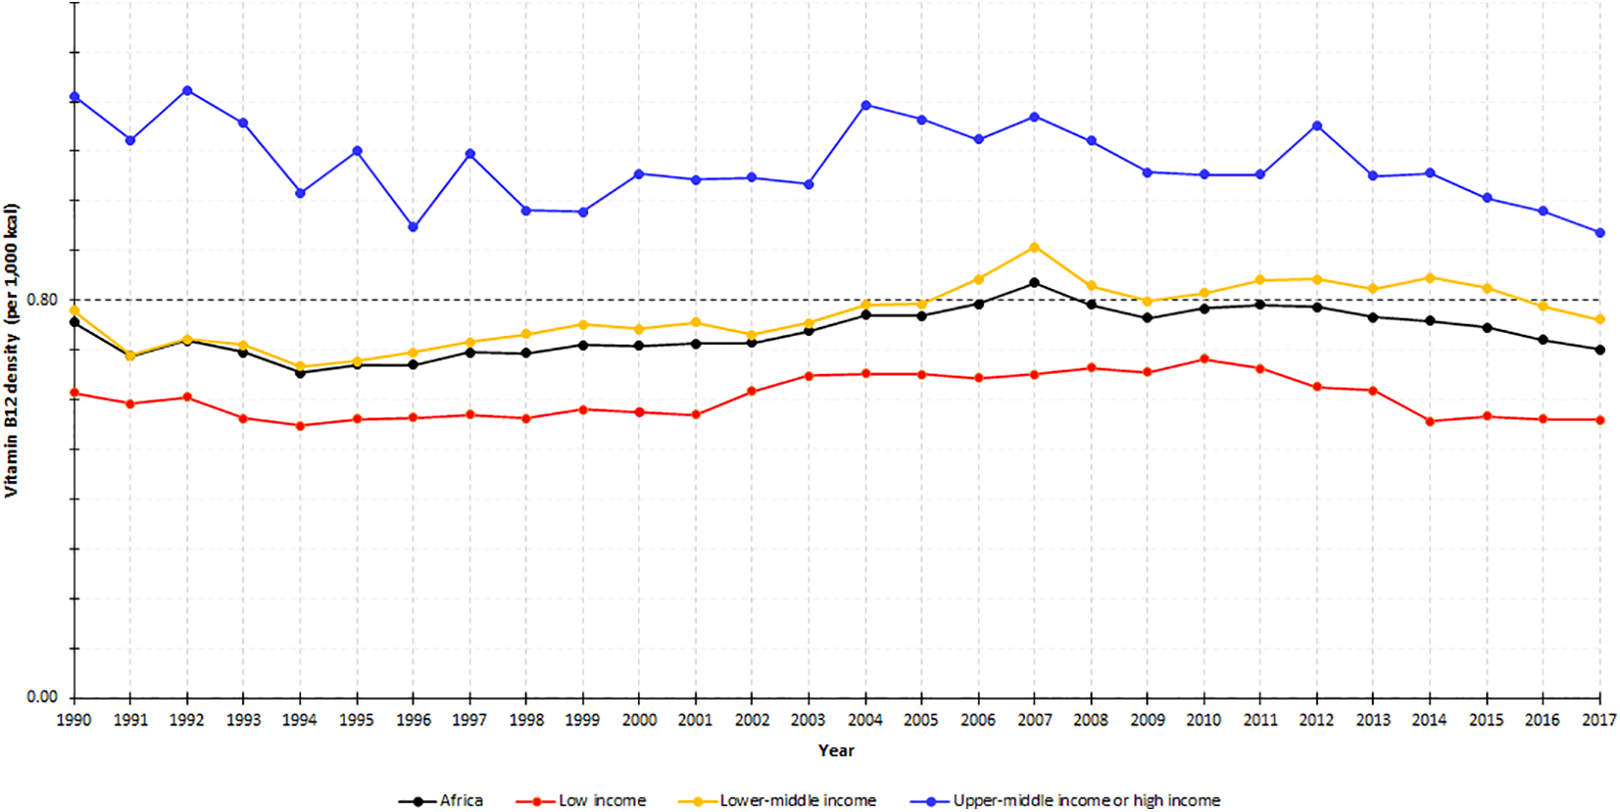
Mean vitamin B12 density (µg/1000 kcal) in Africa by national income, 1990 to 2017.
In 2017, 20 countries had vitamin B12 density (µg/1000 kcal) below the reference goal. The lowest density was in Ethiopia (0.28), followed by Guinea-Bissau (0.36), Malawi (0.39), Niger (0.40), and Nigeria (0.42). Conversely, Gambia (1.88), Mauritius (1.63), Gabon (1.59), Namibia (1.41), and Mauritania (1.31) had the highest density. The vitamin B12 density for each country year is provided in a supplementary table (Supplementary File 3).
Estimated Prevalence of Inadequate B12 Intake
The estimated prevalence of inadequate B12 intake was 41.8% in 1990, fell to 29.9% by 2007, and resurged to 40.6% in 2017. In low-income countries, the risk of inadequate intake declined but still remained above 55%. In lower-middle-income countries, the prevalence sharply declined from 44.9% in 1990 to 15.2% in 2007 but increased to 35% in 2017. In upper-middle or high-income countries, the risk remained below 5% (Figure 5).
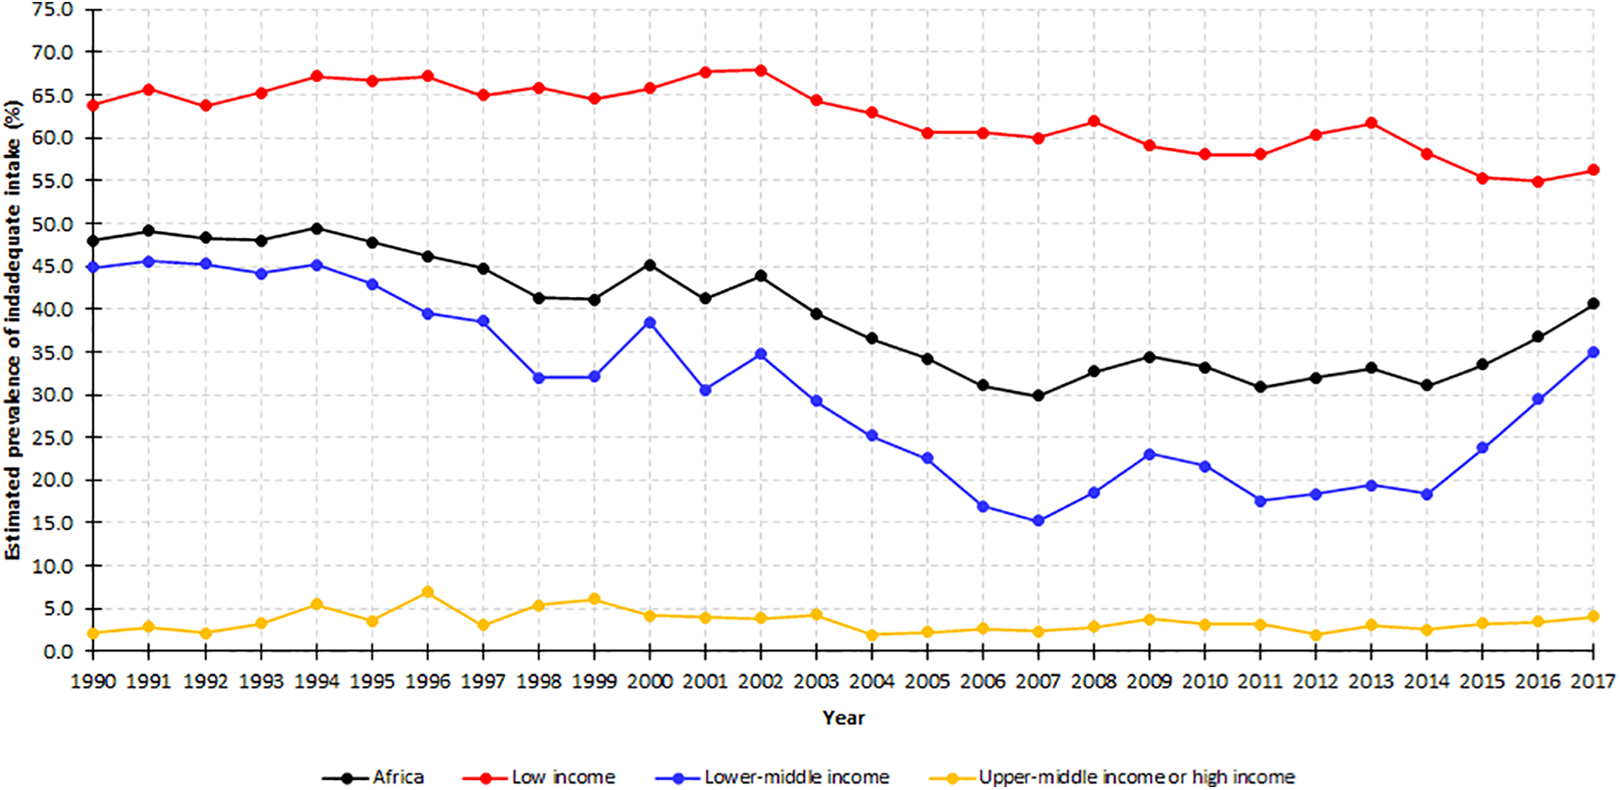
Estimated prevalence of inadequate vitamin B12 intakes in Africa, by national income, 1990 to 2017.
Between 1990 and 2017, the prevalence of inadequate intake remained above 65% in Eastern Africa. In Western Africa, the prevalence sharply declined from 64.6% in 1990 to 13.0% in 2007 and increased to 51.1% in 2017. In Southern Africa countries, the risk remained below 10%. In Northern Africa, it remained less than 5% since 2003. The central Africa also observed a sharp decline in the prevalence of inadequate intake since 2013 (Figure 6).
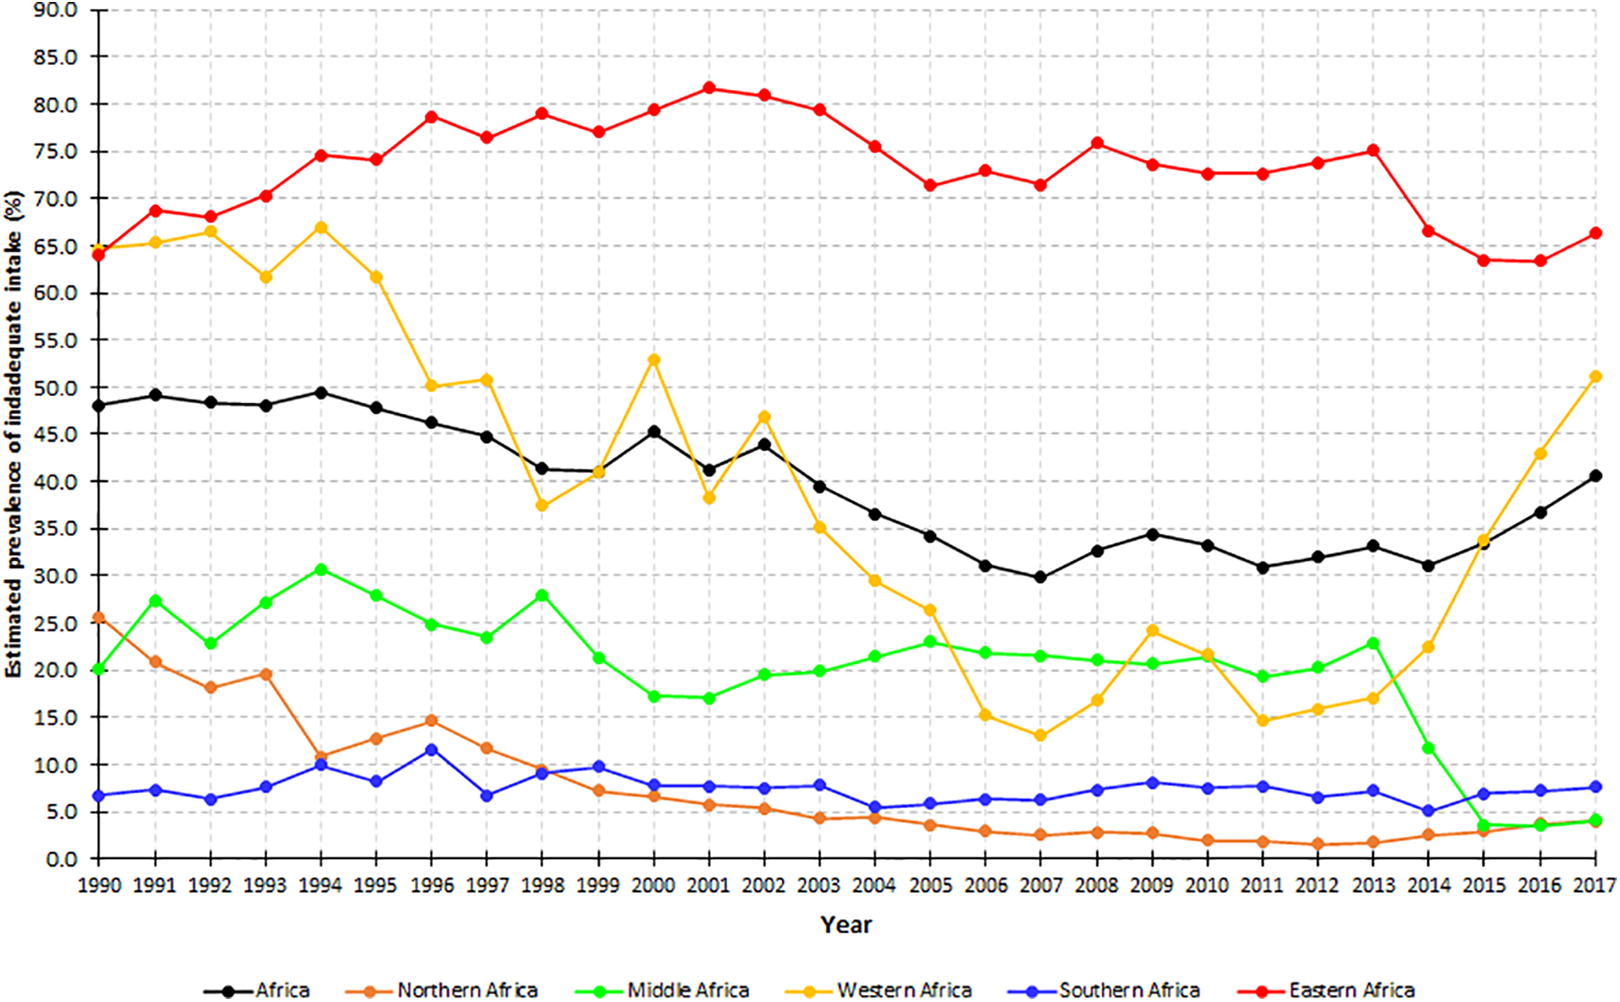
Estimated prevalence of inadequate vitamin B12 intakes in 5 regions of Africa, 1990 to 2017.
Table 2 shows the estimated prevalence of inadequate intake in 45 countries included in the study. In 2017, the prevalence of inadequate intake was nearly universal (> 90%) in 4 (Ethiopia, Guinea-Bissau, Lesotho, and Liberia) countries. Furthermore, 8 countries (Djibouti, Malawi, Niger, Nigeria, Rwanda, Tanzania, and Zimbabwe) had an estimated prevalence exceeding 50%. Conversely, the prevalence was below 5% in 21 countries (Table 2).
Estimated Prevalence Inadequate B12 Intake (as Defined by the EAR Cut Point Method) in Africa Between 1990 and 2017.
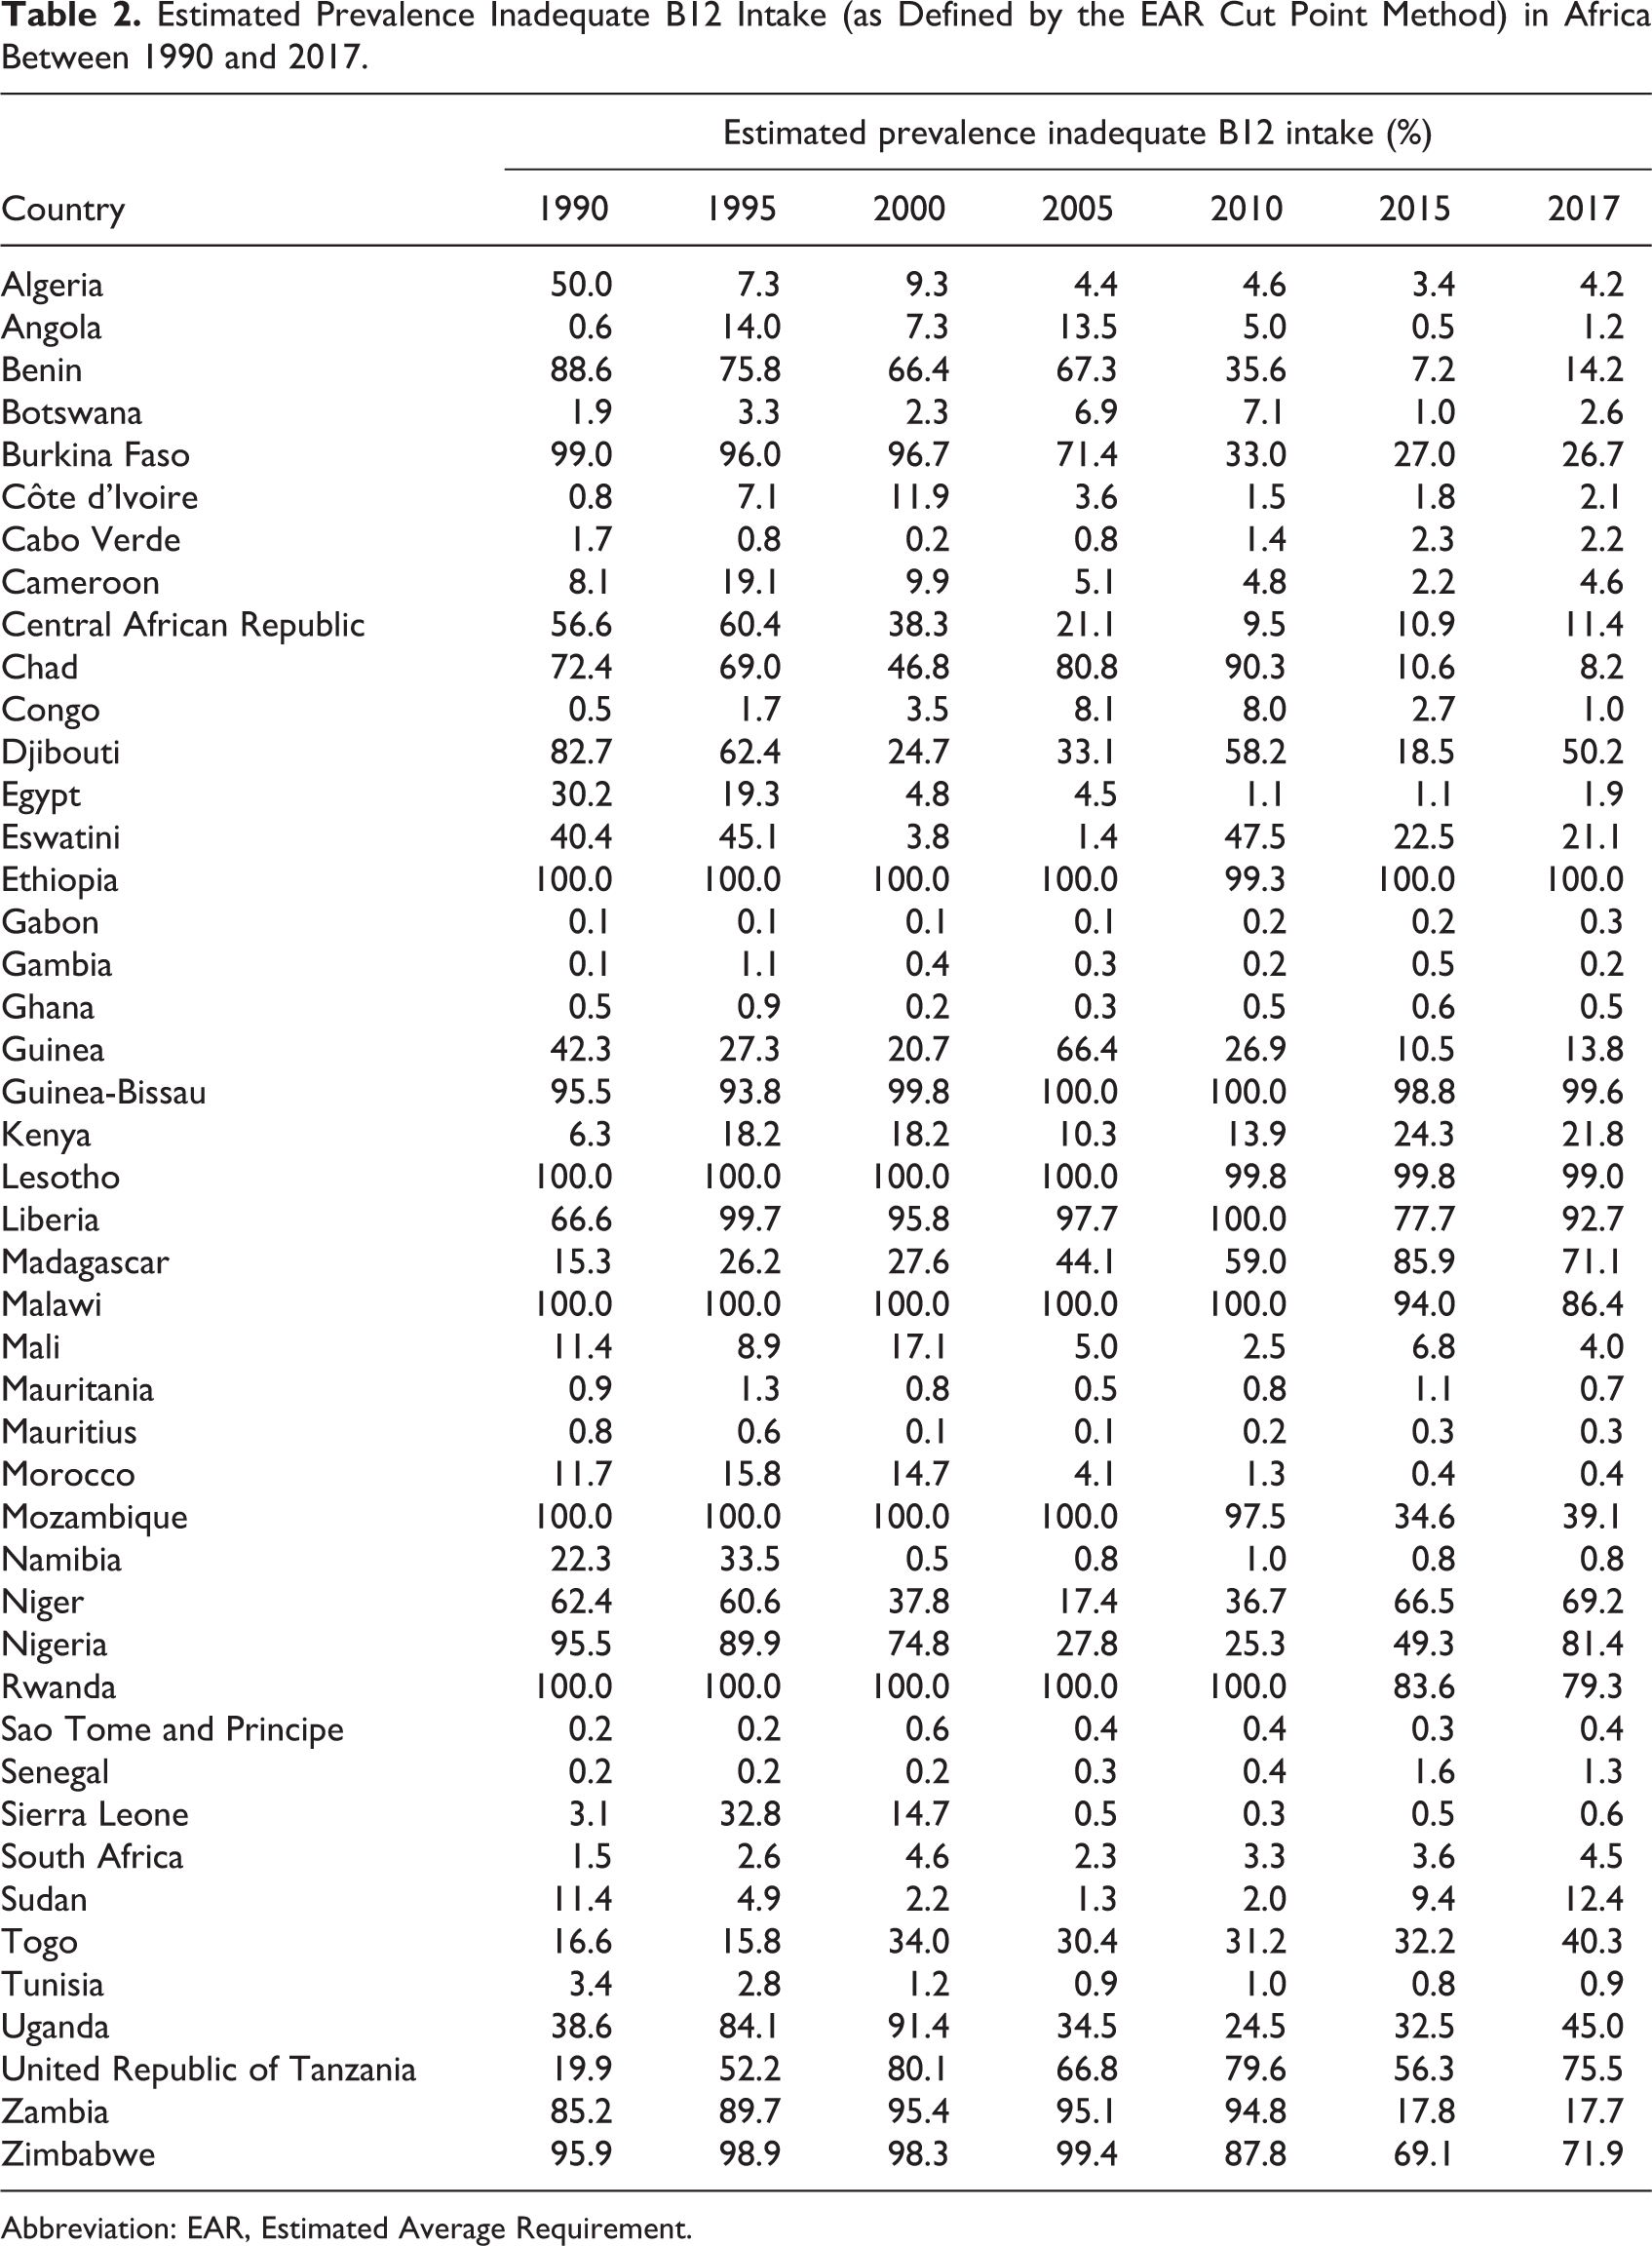
Abbreviation: EAR, Estimated Average Requirement.
Discussion
The objective of the present study was to characterize the regional and country-specific trends (1990-2017) in vitamin B12 supply in Africa and to estimate the prevalence of inadequate intake. Over the period, marginal improvements in the supply and a decline in the estimated prevalence of inadequate intake were witnessed. Yet, the vitamin B12 density remained below the reference goal of 0.8 µg/1000 kcal and in 2017 40.6% of the African population—equivalent to more than half a billion people—had inadequate B12 intake. The vitamin B12 supply showed considerable variations across countries, geographic regions, and national income levels.
In many African countries, the vitamin B12 supplies remain below optimal conditions. The positive trajectories seen in 1990s and early 2000s had been partially reverted in the recent 10 years possibly due to increasing population pressure. The findings suggest the need to improve the availability and accessibility of B12-rich animal source foods through poverty reduction, population control and critical analysis, and revision of national trade and agriculture policies. In countries such as Ethiopia, Guinea-Bissau, Malawi, Niger, and Nigeria having grossly inadequate B12 density, the introduction of large scale and mandatory B12 fortification can be helpful.
The vitamin B12 supply appears to be lowest in the Eastern Africa region. In 2017, the per capita supply was 1.36 µg/d, nearly two-thirds of the region’s population had inadequate B12 intake and the B12 density was just 0.52 µg/1000 kcal. This is likely due to the low economic situation of the region. The Eastern Africa region includes low-income countries such as Malawi, Madagascar, Mozambique, Uganda, and Ethiopia with the gross domestic product (GDP) per capita less than $1000. 27 Despite the low domestic availability of animal source foods, many East African countries including Ethiopia and Kenya export livestock to the Middle East countries to meet needs for foreign currency. 29,30 For example, Ethiopia has one of the highest livestock productions in Africa, 30 per capita consumption of meat is ultralow due to large population size and export-driven agriculture policy.
The vitamin B12 supply also showed a meaningful difference across GNI categories, in favor of upper-middle- or high-income countries. An ecological analysis reported a strong linear relationship between per capita GDP and meat consumption and identified wealth as the main determinant of meat consumption. 31 Globally, the national meat supplies range from less than 10 kg/person/year in low-income countries such as Ethiopia, Gambia, Sierra Leone, Rwanda, and Uganda, to more than 100 kg/person/year in high-income countries such as United States, Australia, and New Zealand. Globally, similar patterns have also been seen with per capita milk, egg, and fish consumptions. 10
The results of this study showed considerable variations among the 45 African countries in terms of B12 supply and prevalence of inadequate intake. A similar study that included 7 South Asian countries also reported that the vitamin B12 supply ranged from 1.58 in Bangladesh to 6.65 µg/capita/day in Maldives. The estimated prevalence of inadequate intake also extended from 0.2% to 99.1%. 32 The huge between-countries variation is likely the reflection of the major difference in access to animal source foods which might, in turn, emanated from disparities in economic status, population size, and agriculture policies.
Food Balance Sheets quantify food potentially available for human consumption in a given territory otherwise unobtainable from other sources. However, FBS also has inherent limitations that must be considered while interpreting the findings of the present study. Food Balance Sheet doesn’t measure variations in subnational, seasonal, and economic class distribution of food. Another limitation is that FBS disregards household-level food wastage and subsistent production of less pertinent food commodities. The latter is especially relevant in Africa because a considerable proportion of Africans are dependent on small-scale agricultural productions. Further, the food balance data generated by many countries is unlikely to be complete due to the lack of a comprehensive agriculture information system. 17 A study that compared FAO’s national food supply estimates with individual-based Global Dietary Database concluded that the earlier significantly overestimated intake of many food groups including meat, milk, and fish. 33
The prevalence of inadequate vitamin B12 was determined based on multiple assumptions that may not be strictly true. The EAR cut point method assumes that the distribution of requirements is symmetrical about the EAR, and the variance is smaller than the variance of the distribution of intakes. 23 However, these assumptions have not been adequately validated for different nutrients in various population groups and settings. 34 Furthermore, the 25% interindividual coefficient of variation assumed in the present study and other similar studies 35,36 may also vary across nutrients, settings, and population groups. Although the estimated prevalence of inadequate intake allows time trend analysis and between-country comparisons, caution should be taken in interpreting the actual figures. Interpretations should only be made in the context of the underlying methodological assumptions.
In the current analysis, the vitamin B12 supply was estimated assuming no fortification because no dependable information exists on the vitamin B12 fortification landscape in the continent including the presence of mandatory fortification regulations, dose of fortification, and market penetration of fortified products. The decision to disregard fortification undervalues the vitamin B12 supply in countries where there is meaningful coverage of fortification. However, coverage of mandatory vitamin B12 fortification is at a rudimentary stage in most African countries. 37
The following issues should also be considered while interpreting the findings of the study. Beyond food supply, the vitamin B12 status of a population can be affected by nondietary factors that modify absorption of the nutrient (eg, aging). However, such factors are not taken into account. The prevalence of inadequate intake was estimated based on EAR derived by FNB/IOM assuming 50% bioavailability of B12. 24 In fact, the actual bioavailability of the nutrient varies from one dietary source to another. For instance, the bioavailability of vitamin B12 coming from dairy products is higher than other sources. 38 As the food supply statistics was measured at a population level, the findings may not be fully generalizable to an individual level. Finally, the estimates coming from the 45 African countries may not be generalizable to the remaining 9 African countries, because countries lacking FBS do have peculiar features including political instability (eg, Somalia, Libya, DRC) or being newly formed nations (South Sudan, Eritrea). Despite all these limitations, the analysis permits for between-countries comparison and apprises progress made over time in 45 African countries.
Conclusion
Between 1990 and 2017, the vitamin B12 supply in Africa marginally increased and the prevalence of inadequate intake declined. However, the nutrient density remained below the reference goal of 0.8 µg/1000 kcal and in 2017 an estimated 41% of the population had inadequate intake. Many African countries—especially Eastern and Western African and low-income countries—have major deficits in vitamin B12 supply. In Africa, the availability and accessibility of B12-rich animal source foods should be improved through introducing mandatory B12 fortification and revisiting national trade and agriculture policies. Furthermore, poverty reduction and population control efforts should be intensified.
Supplemental Material
Supplemental Material, sj-pdf-1-fnb-10.1177_03795721211043353 - Trends in Vitamin B12 Supply and Prevalence of Inadequate Intake in Africa: Regional and Country-Specific Estimates
Supplemental Material, sj-pdf-1-fnb-10.1177_03795721211043353 for Trends in Vitamin B12 Supply and Prevalence of Inadequate Intake in Africa: Regional and Country-Specific Estimates by Samson Gebremedhin in Food and Nutrition Bulletin
Supplemental Material
Supplemental Material, sj-pdf-2-fnb-10.1177_03795721211043353 - Trends in Vitamin B12 Supply and Prevalence of Inadequate Intake in Africa: Regional and Country-Specific Estimates
Supplemental Material, sj-pdf-2-fnb-10.1177_03795721211043353 for Trends in Vitamin B12 Supply and Prevalence of Inadequate Intake in Africa: Regional and Country-Specific Estimates by Samson Gebremedhin in Food and Nutrition Bulletin
Supplemental Material
Supplemental Material, sj-pdf-3-fnb-10.1177_03795721211043353 - Trends in Vitamin B12 Supply and Prevalence of Inadequate Intake in Africa: Regional and Country-Specific Estimates
Supplemental Material, sj-pdf-3-fnb-10.1177_03795721211043353 for Trends in Vitamin B12 Supply and Prevalence of Inadequate Intake in Africa: Regional and Country-Specific Estimates by Samson Gebremedhin in Food and Nutrition Bulletin
Footnotes
Acknowledgment
The author acknowledges the Food and Agriculture Organization of the UN for making the food balance sheets data publicly available without any restrictions.
Declaration of Conflicting Interests
The author(s) declared no potential conflicts of interest with respect to the research, authorship, and/or publication of this article.
Funding
The author(s) received no financial support for the research, authorship, and/or publication of this article.
Supplemental Material
Supplemental material for this article is available online.
References
Supplementary Material
Please find the following supplemental material available below.
For Open Access articles published under a Creative Commons License, all supplemental material carries the same license as the article it is associated with.
For non-Open Access articles published, all supplemental material carries a non-exclusive license, and permission requests for re-use of supplemental material or any part of supplemental material shall be sent directly to the copyright owner as specified in the copyright notice associated with the article.