
Abstract
Objective:
India is the second country after China having the highest population prevalence of diabetes. Several research studies investigating diabetes have been done, but not much work has been done on prediabetes. The purpose of this study was to investigate the effect of nutrition and lifestyle modification on prediabetic females.
Methods:
A total of 120 prediabetic females from Ludhiana city were divided into 2 matched groups: control group (n = 60) and experimental group (n = 60). Impact of nutrition intervention for dietary and lifestyle modification (for 3 months) was assessed on the anthropometric, dietary, biochemical parameters, and diabetes risk score of the experimental group and control group (no intervention).
Results:
All the selected 120 subjects completed the study (experimental group = 60; control group = 60). There was significant difference in the changes between the 2 groups throughout the study. The fasting blood glucose and glycated hemoglobin A1c levels of the experimental group subjects reduced significantly (P ≤ .01). However, no change was observed among the control group subjects. The lipid profile of the experimental group showed a significant improvement (P ≤ .01).
Conclusion:
Nutrition counselling of the prediabetics regarding dietary and lifestyle modification is recommended so as to improve their metabolic control, thus preventing them from being diabetics.
Introduction
The World Health Organization (WHO) and International Diabetes Federation have drawn attention to the current global “diabetes epidemic,” which is expected to escalate in coming years. Most individuals with prediabetes are hyperinsulinemic, meaning they often produce excess insulin. Peripheral insulin resistance is often the etiology of the hyperglycemia in the early stages of diabetes (eg, in prediabetes). There are 463 million people in the world suffering from diabetes and 4.2 million people died due to diabetes in the year 2019. Globally, 373.9 million people suffer from impaired glucose tolerance (IGT). According to Diabetes Atlas 2019, India had 77 million diabetic population and ranked second after China. 1 The multiple risk factors contributing to the development of diabetes are age, obesity, sedentary lifestyle, and unhealthy dietary practices. 2
Prediabetes is an intermediate state of hyperglycemia with glycemic parameters being above the normal but below the diabetes threshold. So, it is simply the prediagnosis of diabetes. 3 Individuals living with prediabetes are at higher risk for heart disease, kidney ailment, blindness, and amputation compared to their on-diabetic counterparts. According to WHO and American Diabetes Association, prediabetes can be detected through impaired fasting glucose (IFG), fasting plasma glucose, IGT, and glycated hemoglobin A1c (HbA1c). Prediabetes can also be termed as IGT that measures blood glucose after 2 hours of a meal (140-199 mg/dL), IFG that measures fasting blood glucose (FBG; 100-125 mg/dL), and insulin resistance when body is unable to utilize insulin effectively.
The Centers of Disease Control and Prevention National Diabetes Statistics Report suggested that 37% of US adults (older than 20 years) and 51% of adults older than 65 years of age were suffering from prediabetes in 2009 to 2012. The worldwide prevalence in 2010 of IGT was found to be 343 million. International Diabetes Federation had reported an increase in the prevalence of prediabetes to 461 million globally by 2035. About 7% of the population visiting Toranomon Hospital (Tokyo, Japan) was found to be prediabetic. 4
The American Diabetes Association recommended that a person aged 45 years and above with risk factors such as overweight, sedentary lifestyle, hypertension, and high triglycerides should periodically monitor their glucose levels. Early detection of undiagnosed type 2 diabetes has been proposed as an important strategy in reducing the personal, public, and economic costs of diabetes. 5 A meta-analysis of all the available interventions to prevent the onset of diabetes in people with prediabetes shows a range of pharmaceutical and lifestyle interventions to be efficacious. 6 Lifestyle intervention plays a very important role in reducing the risk of future diabetes among patients suffering from prediabetes as dietary changes and physical activity can be beneficial. Such estimations hold staggering implications for global human morbidity and mortality related to diabetes and highlight the huge need for screening and prevention of prediabetes.
Women are more vulnerable to malnutrition due to social and biological reasons throughout their life cycle. So, their health should be of major concern as health of women affects the health of family. National Health Family Survey (2015-2016) on eating habits of women reported that a lower proportion of women consumed balanced diet that contains adequate amount of carbohydrates, proteins, fats, vitamins, and minerals on a daily basis. Poverty and discrimination against women can be the reason for poor health of women in India. Fruits, green leafy vegetables, milk and milk product, egg, and fish consumption have reduced, and consumption of fried foods and aerated drinks is increasing day by day. If the diet is lacking in vitamins and minerals for prolonged periods, then such women may come under risk factors for chronic diseases such as diabetes, hypertension, and obesity.
In India, many studies have been done to assess the prevalence of diabetes, but the prevalence of prediabetes has not been given much importance. Therefore, this study was planned with the aim to assess the prevalence of prediabetes among women and further entail the role of nutrition counseling and lifestyle modifications in the management of prediabetes.
Methods
Participants
A total of 730 females in the age group of 30 to 50 years belonging to Ludhiana, Punjab, were tested for FBG, out of which 120 were purposively selected who were having FBG ranging between 100 and 125 mg/dL. Before starting with the experiment, a written consent from all the subjects was obtained for their willingness to participate in the study. The subjects were randomly divided into 2 matched groups, that is, control group (CG) and experimental group (EG). Experimental group comprised of 60 subjects who received the nutrition and lifestyle intervention for 3 months. The second was the CG comprising of 60 patients, which was not given any intervention.
Data Collection
Data collection was done during the year 2018 to 2019. The required data were collected through personal interview technique using the especially structured schedule to elicit the information about the general, socio-economic status, family composition, and dietary pattern–related information such as vegetarian/nonvegetarian dietary pattern, salad intake, frequency of junk food consumption, and type of fat/oil used for different preparation; knowledge regarding nutritive value on food labels was also recorded.
Body Measurements
Various anthropometric measurements such as height, weight, and waist and hip circumference were measured using standard methods. 7 Based on the standard measurements, body mass index (BMI) and waist/hip ratio were calculated. 8
Hematological Examination
Blood samples were collected by a trained technician at baseline and after intervention period and analyzed at the lab by using cyanmethemoglobin method.
Blood Glucose and Lipid Profile Examination
Fasting and random blood glucose was tested using AMES SEAE and PACER Analyzer. Glycated hemoglobin A1c or glycated glucose was estimated using MISPA-i2. The HbA1c (glycated hemoglobin) test depicts the 3-month average blood glucose levels in the body and is used as a diagnostic test for prediabetes or diabetes mellitus. Total serum cholesterol was analyzed by BIOTRON BTR 820 auto blood analyzer using enzymatic method. 9 The concentration of serum triglycerides was estimated by using auto pack reagent kit by method enzymatic DHBC colorimetric method. 10 HDL-C High density lipoprotein cholesterol was measured by using BIOTRON and BTR 820 using phosphor tungstate method. 11 The value for Low density lipoprotein cholesterol (LDL-C) and Very low density lipoprotein cholesterol (VLDL-C) was calculated on the basis of Fried Wald’s equation:

where VLDL-C =
Physical Activity Pattern
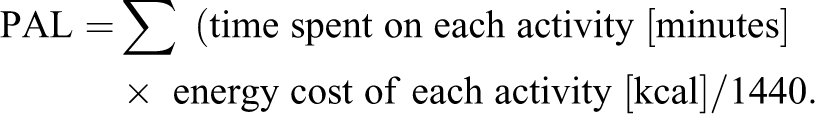
Physical activity diary method was used to record the time spent on different activities of the day during which the dietary survey was carried out. Physical activity ratio given by Food and Agriculture Organization/ World health Organization/ United Nations Organization (FAO/WHO/UNO) was used to calculate the physical activity level (PAL) of the subjects. The mean PAL was calculated using the formula:
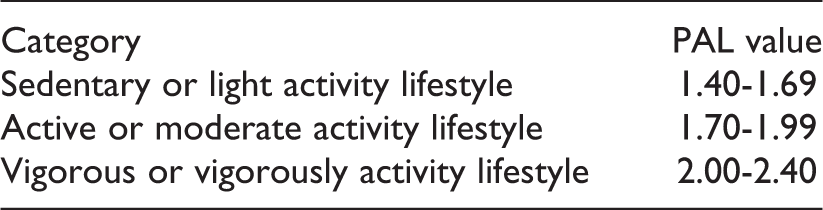
The lifestyle of the subjects was determined on the basis of PAL of the subjects. FAO/WHO/UNO classification was used to categorize the subjects of different age group into 3 following lifestyle categories:
FAO/WHO/UNO (2004) Classification of Physical Activity Level
Dietary Survey
A dietary survey was carried out to gather information regarding dietary pattern, nutrient intake, source of nutrients, and food habits. Detailed information on food intake was obtained for 3 consecutive days by using 24-hour recall method. The nutrient intake was calculated with the help of Indian nutritive software Diet Cal. 12 The dietary and nutrient adequacy of major food groups and nutrients was compared with the Suggested Dietary Intakes (SDI) and Recommended Dietary Allowances (RDA) given by Indian Council of Medical Research (ICMR). 13 The percentage nutrient adequacy was calculated using the following formula:

Nutrient adequacy was categorized using a classification by Jood et al. 14
Diabetes Risk Score
Indian Diabetes Risk Score (IDRS) is based on 4 simple parameters derived from known risk factors for diabetes: 2 modifiable risk factors (waist circumference and physical inactivity) and 2 nonmodifiable risk factors (age and family history of diabetes), which may be amenable to intervention. The Madras Diabetes Research Foundation (MDRF-IDRS) uses a scoring system of 0 to 100. After adding up scores of all the 4 parameters, if the score is ≥ 60, the risk of having type 2 diabetes is very high; 30 to 50: moderate risk; < 30: low risk. 15
Statistical Analysis
The statistical analysis was performed using SPSS 22.0 software. The data obtained from the survey were analyzed using various statistical tools such as frequency, percentages, mean, and SD. The comparisons between categories of respondents, that is, CG and EG, were done using paired t test for assessing differences before and after intervention and P value using chi-square.
Intervention
After selection of 120 subjects, they were asked to provide information required in the questionnaire. They were given complete knowledge on the topic of prediabetes and importance of nutrition in alleviating diabetes and prediabetes. Short messages related to the dietary and lifestyle modifications were also shared with the subjects on a daily basis via WhatsApp groups. Their 3-day diet was recorded at the baseline, and suggested modifications were made in their diets. All the selected subjects were free from any other chronic diseases, so they were suggested to increase their PALs.
Results
The data on general information (Table 1) of the total subjects (N = 120) showed that 71% of the subjects belonged to the age group of 41 to 50 years. About 36% of the subjects had graduate level of education followed by secondary level (23%). More than 50% of the subjects were nonworking. Only one third of the subjects belonged to joint family setup.
General Profile of the Selected Subjects (N = 120).
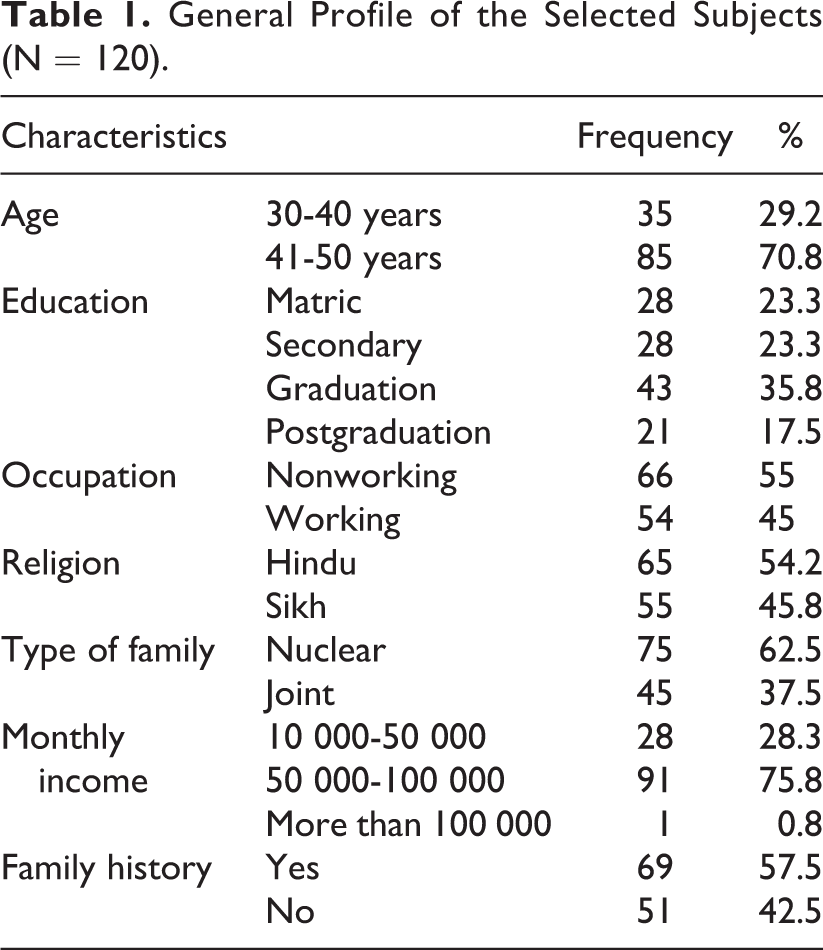
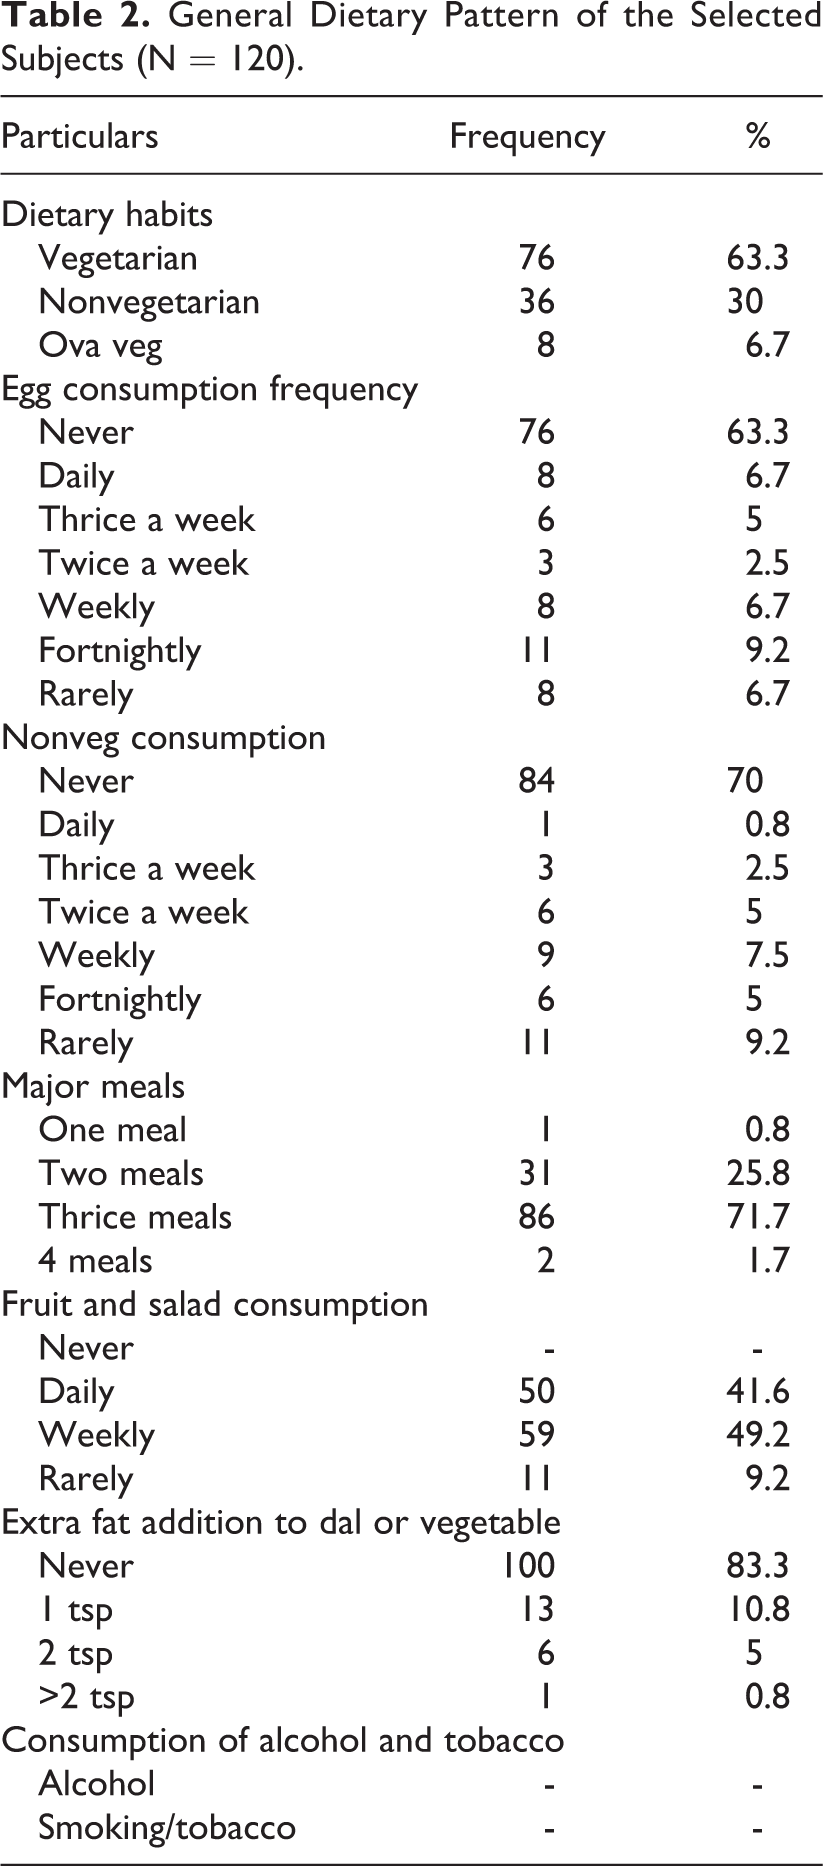
About 60% of the CG and 57.5% of the subjects had family history of diabetes. More than 50% of the subjects in both the groups had walking routine; 63.3% of the selected subjects were vegetarian, 30% subjects were nonvegetarian, and only 6.7% were ovatarians. Ova-vegetarian It was observed that daily consumption of egg or other nonvegetarian foods by the subjects was minimum (Table 2). From those who were consuming nonvegetarian foods, out of them maximum were consuming either on a weekly basis or rarely. The majority of the selected subjects were consuming 3 major meals a day. The daily consumption of fruits and salad was found to be lesser among all the selected subjects. The majority of the selected subjects never added extra fat to their dal or vegetable. Furthermore, consumption of alcohol and tobacco was found to be nil among all the selected subjects.
General Dietary Pattern of the Selected Subjects (N = 120).
In the present study, the majority of the selected subjects, that is, 37.5%, were found to consume bakery products daily, which are rich source of trans-fats, followed by fried foods, which were being consumed by 30.8% of the selected subjects on a weekly basis. Sweet dishes were consumed by 20.8% of the subjects on a weekly basis. Outside eating was being done by 27.5% of the subjects on a monthly basis.
About 70.8% of the selected subjects used desi ghee on parathas and chapati, 56.7% used mustard oil for deep frying, and 45.8% were using mustard oil for tadka preparation. Only 3.3% and 2.5% of the selected subjects were using olive oil for tadka preparation and deep frying.
The convenience food market has grown in today’s scenario, and markets are flooded with these kinds of foods. The present study revealed that 65.8% of the selected subjects were not in a habit of reading food labels, indicating that the majority of the subjects were not aware of the ingredients used/nutritional composition of the convenience foods.
After collecting the baseline data of the selected subjects, they were randomly divided into 2 matched groups: CG and EG, comprising 60 subjects in each group. The subjects of the EG were given nutrition counseling for a period of 3 months on a fortnightly basis using lectures, discussion, and developed educational package. The counseling included modification of the dietary pattern and lifestyle of the subjects. After the intervention period, the results regarding the changes in their anthropometric, physical activity, dietary, hematological, and blood sugar profile were recorded.
Anthropometric Profile
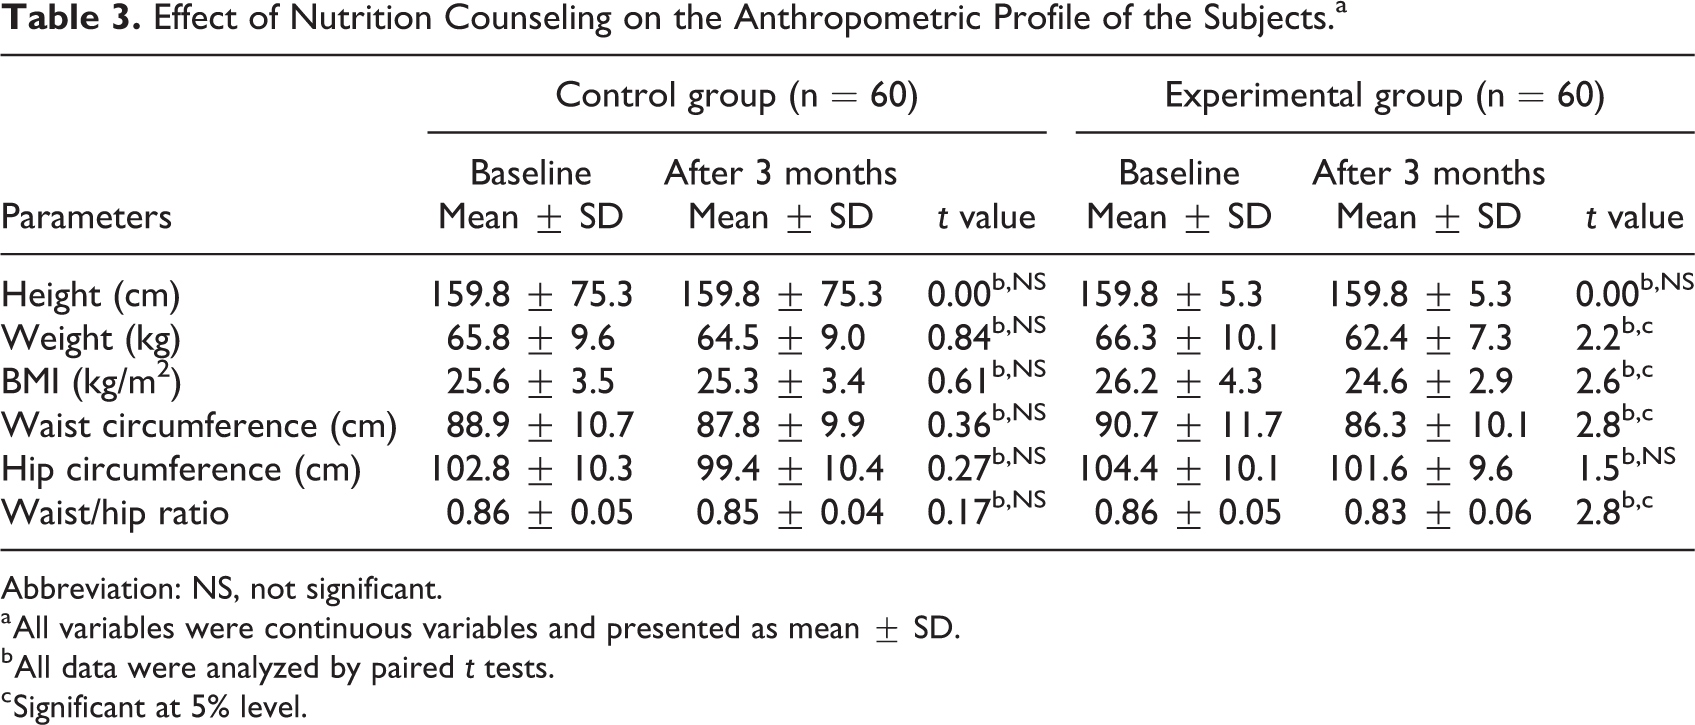
Anthropometric profile reflects the nutritional status of an individual. The anthropometric measurements such as height, weight, BMI, waist circumference, hip circumference, and waist/hip ratio of the selected subjects were recorded and are presented in Table 3. The data dealing with the anthropometric profile of the subjects revealed that there was no significant difference in the weight, BMI, and waist and hip circumference of the CG subjects postintervention. However, there was a significant decrease (P ≤ .05) in the average weight of EG subjects after receiving nutrition counseling. Postintervention data revealed that the BMI of the EG subjects decreased, which is due to the reduction in their respective weight. After 3 months of intervention, the waist circumference of the EG subjects reduced from 90.7 ± 11.7 cm to 86.3 ± 10.1 cm and hip circumference reduced significantly (P ≤ .05) from 104.4 ± 10.1 cm to 101.6 ± 9.6 cm. Also, the waist/hip ratio of the EG decreased significantly (P ≤ .01) after intervention.
Effect of Nutrition Counseling on the Anthropometric Profile of the Subjects.a
Abbreviation: NS, not significant.
a All variables were continuous variables and presented as mean ± SD.
b All data were analyzed by paired t tests.
c Significant at 5% level.
Before the intervention, the number of women fell under the category of preobese in both groups, that is, 38.3% and 36.7% followed by overweight, that is, 26.7% and 30%, in the experimental and CGs. Whereas, the postdata showed that the maximum number of women in the EG fell under normal category (35%), and in the CG, the maximum number of women fell under preobese category (38.3%). Previously, there were 15% women obese in the EG and 13.3% women obese in the CG; after intervention, there were 11.6% in the EG, and in the CG there was no change.
Among CG subjects, the distribution observed was subjects with high risk (55%), followed by moderate risk (28.3%) and low risk (16.7%). However, among the EG subjects, high risk category reduced by 9.3% and low risk category increased by 1.7%.
Biochemical Parameters
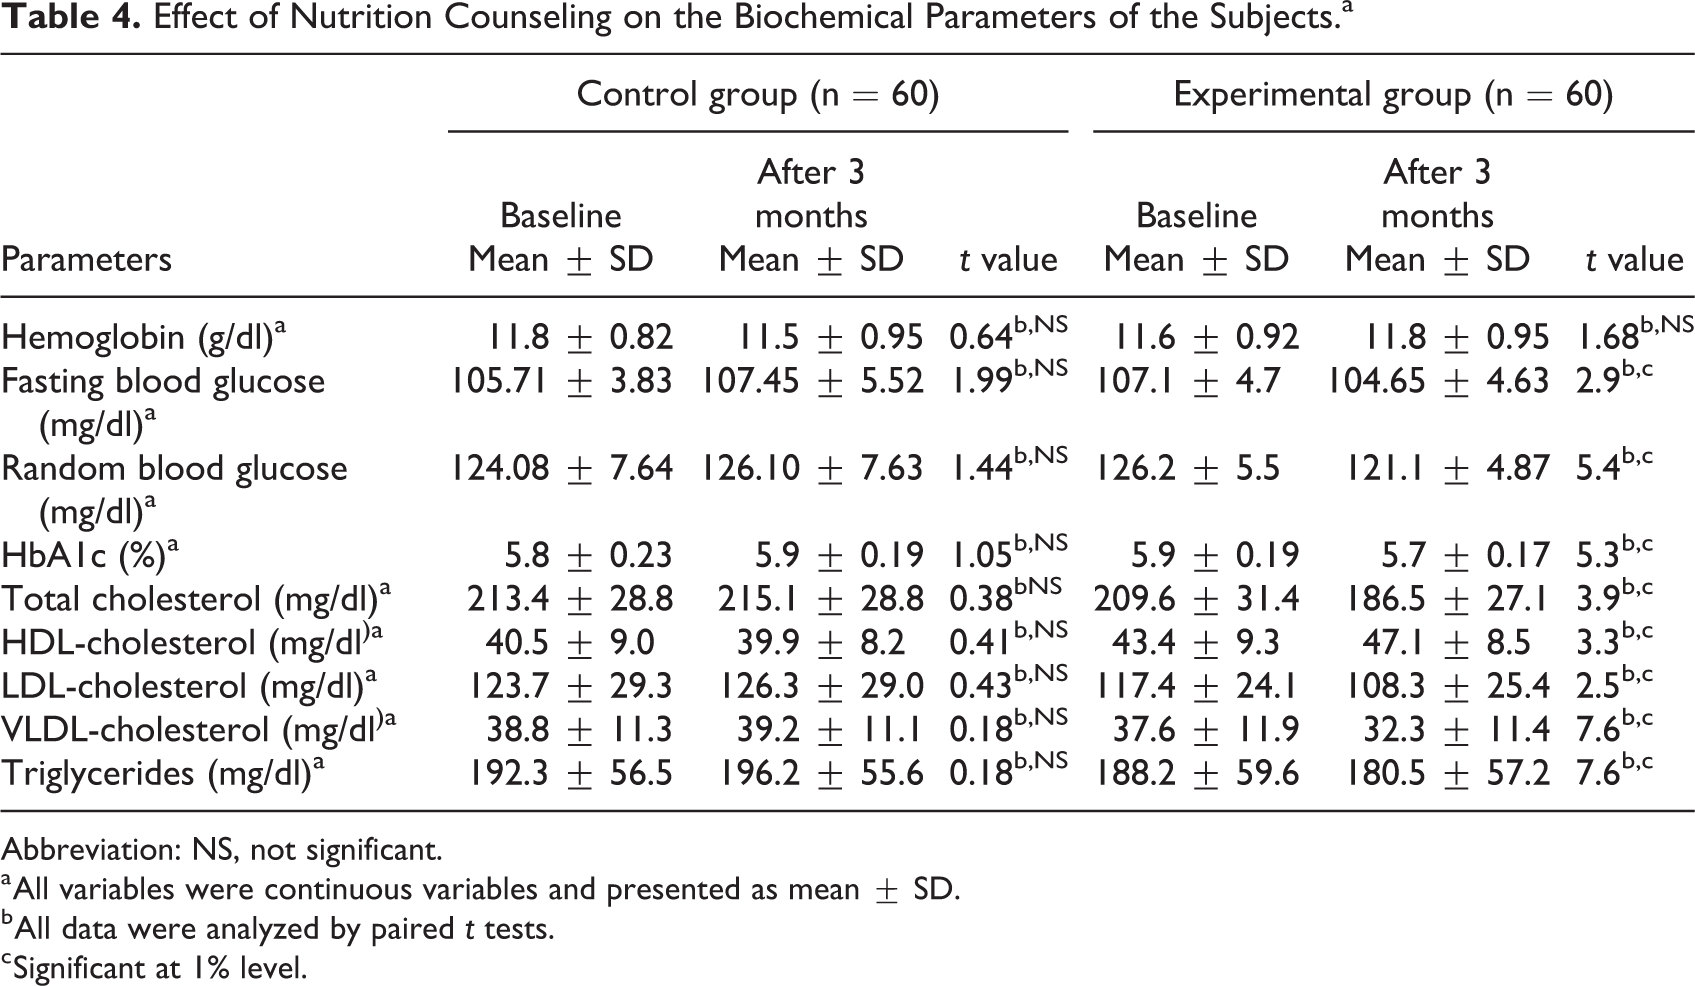
The data regarding biochemical parameters of the subjects at baseline and after 3 months of nutrition intervention indicated no significant difference in the hemoglobin levels of EG subjects (Table 4). A significant decrease (P ≤ .05) in the FBG from 107.1 ± 4.7 mg/dL to 104.65 ± 4.63 mg/dL of the EG was observed, which might be due to the impact of nutrition counseling, hence improving their dietary and lifestyle pattern. The mean values for random blood glucose were found to be 126.2 ± 5.5 mg/dL and 121.1 ± 4.87 mg/dL among EG subjects before and after counseling, which showed statistically significant difference (P ≤ .01).
Effect of Nutrition Counseling on the Biochemical Parameters of the Subjects.a
Abbreviation: NS, not significant.
a All variables were continuous variables and presented as mean ± SD.
b All data were analyzed by paired t tests.
c Significant at 1% level.
The HbA1c range for prediabetes is 5.7% to 6.4%. Although there was a significant change in the HbA1c level of the EG, the mean value was just on the edge of being prediabetic as shown in Table 3. Furthermore, significant improvement was observed in the lipid profile of the EG subjects postintervention. The total cholesterol, LDL cholesterol, and VLDL cholesterol of the EG subjects postcounseling reduced significantly (P ≤ .01) by 11%, 8%, and 14%, respectively. A nonsignificant difference in the total cholesterol:HDL-C ratio was observed in pre- and post-nutrition counseling values. However, the ratio was found to be desirable among EG subjects post nutrition counseling.
Physical Activity Level
It was revealed that there was a nonsignificant difference in the time spent during sleeping, personal care, household work, sitting, and so on, among the CG subjects, before and after the experimental period. Similar results were observed among EG subjects except for that a significant increase was observed in the walking time. Before the intervention period, the subjects of CG and EG had a walking time of 83.5 and 88.9 minutes, which was increased to 110.5 minutes among the experimental subjects. The difference might be due to the reason that they were counseled to change their lifestyle during counseling sessions and increase their walking time. Similarly, Parker et al 16 had also reported that after medical nutrition therapy (MNT) for 12 weeks, the percentage of the subjects indulging in 30 minutes of physical activity increased from 20.9% to 95%.
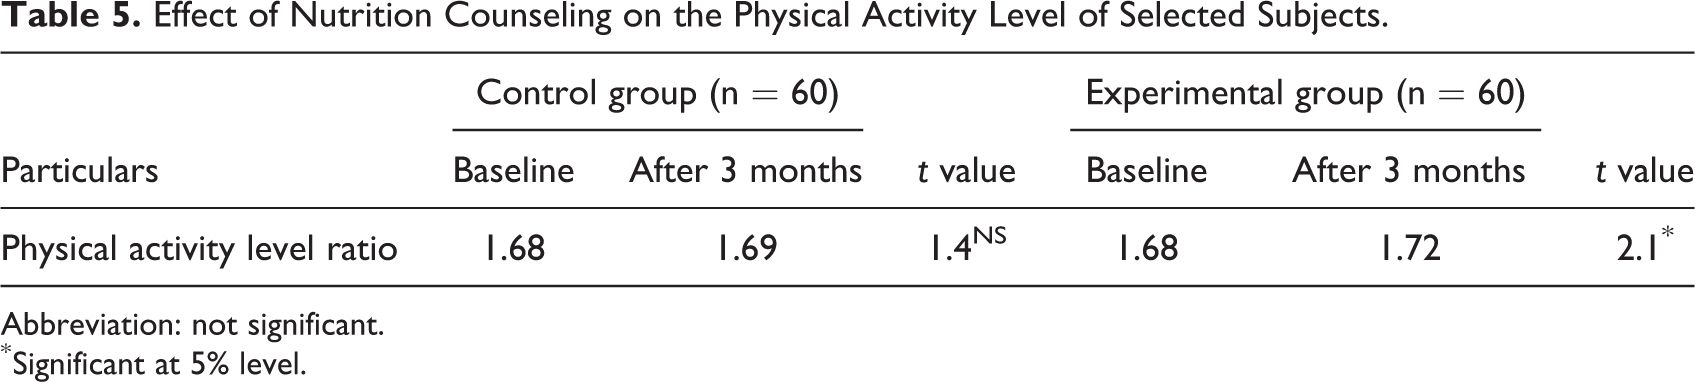
It was observed that selected subjects in the present study were living sedentary lifestyle prior to nutrition counseling (Table 5) as per FAO/WHO/UNU (2004) classification, according to which the PAL ranging between 1.4 and 1.69 is considered as sedentary. Post-nutrition counseling showed a change in the PAL of EG subjects.
Effect of Nutrition Counseling on the Physical Activity Level of Selected Subjects.
Abbreviation: not significant.
* Significant at 5% level.
Food Intake of Subjects
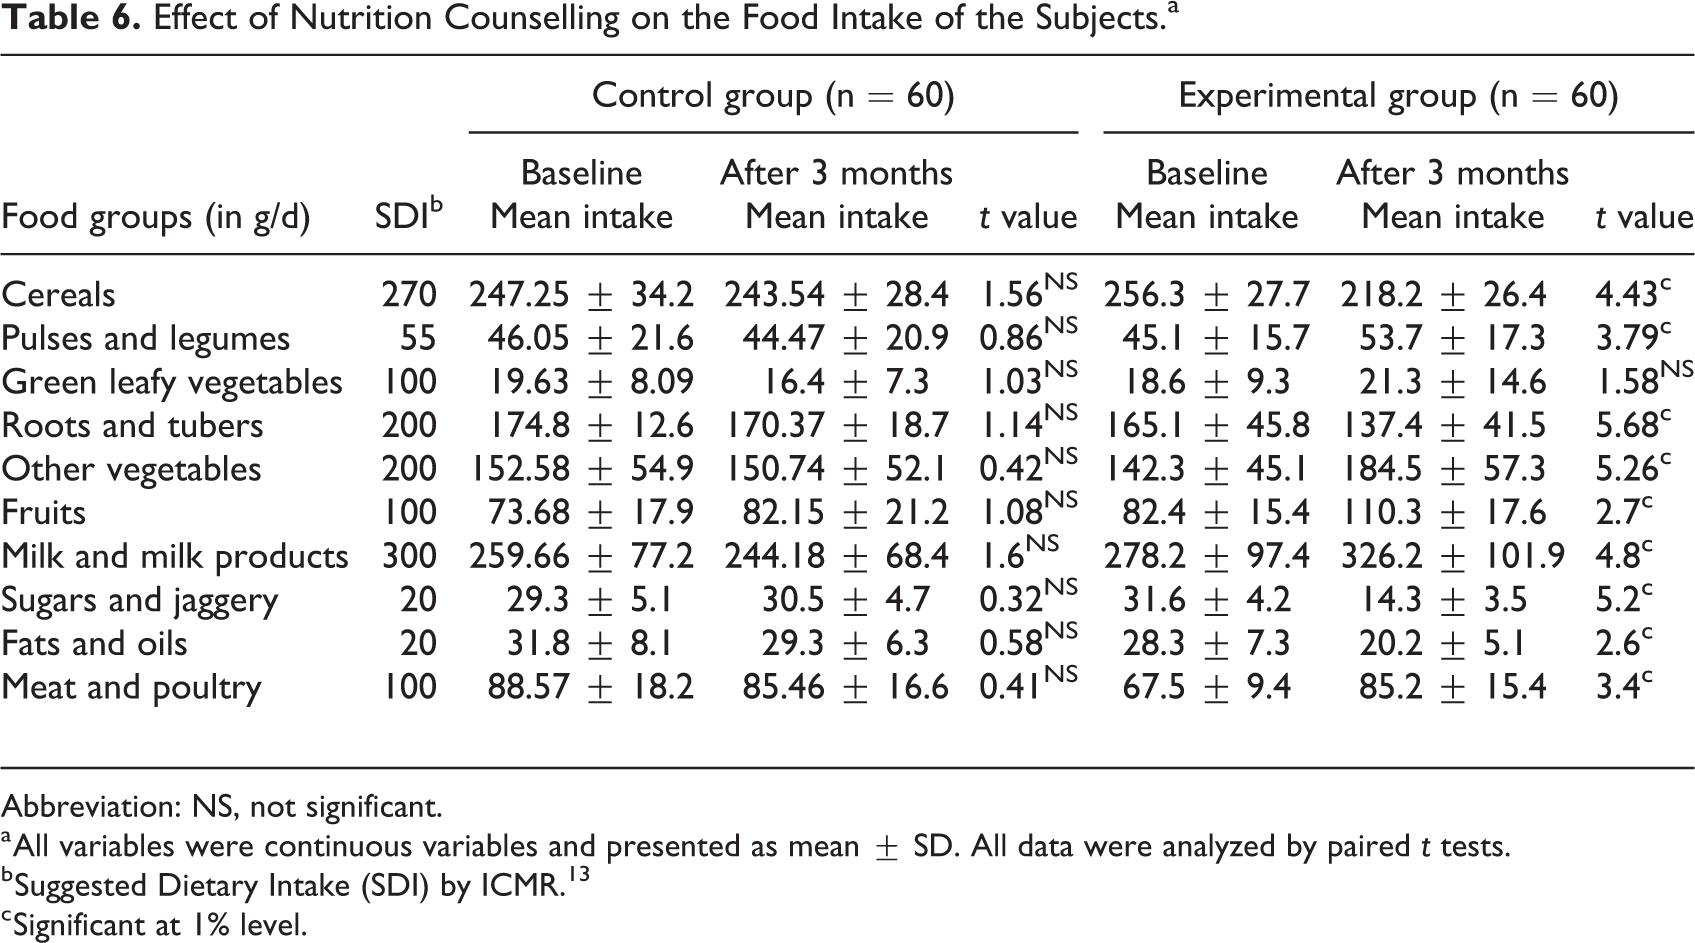
The dietary and nutrient adequacy of major food groups and nutrients was compared with the SDI and RDA given by ICMR. 13 Table 6 details the mean food intake of the CG and EG before and after 3 months of nutrition intervention. The percent adequacy of food intake for the CG and EG was also calculated, as evident in Figures 1 and 2. There was no change in the percent adequacy of food intake of the CG. Whereas, in case of EG subjects, the percentage adequacy of cereal intake decreased by 14.8% and that of pulses and legumes and other vegetables increased by 19% and 29.6%. A reduction of 54.7% and 28.6% was also observed in the sugars and fats adequacy of EG subjects. Among the intake green leafy vegetables, there was a nonsignificant increase in the intake by the EG subjects, while the intake reduced in the CG subjects. To increase the dietary fiber and micronutrient in the diets, the subjects in the EG group were advised to include fruits and vegetables in their daily diets, which was initially lacking in their routine. In Punjab, the consumption of milk and milk products is already near to adequate due to the ample supply; therefore, there was a significant increase in its consumption by the EG subjects.
Effect of Nutrition Counselling on the Food Intake of the Subjects.a
Abbreviation: NS, not significant.
a All variables were continuous variables and presented as mean ± SD. All data were analyzed by paired t tests.
b Suggested Dietary Intake (SDI) by ICMR. 13
c Significant at 1% level.
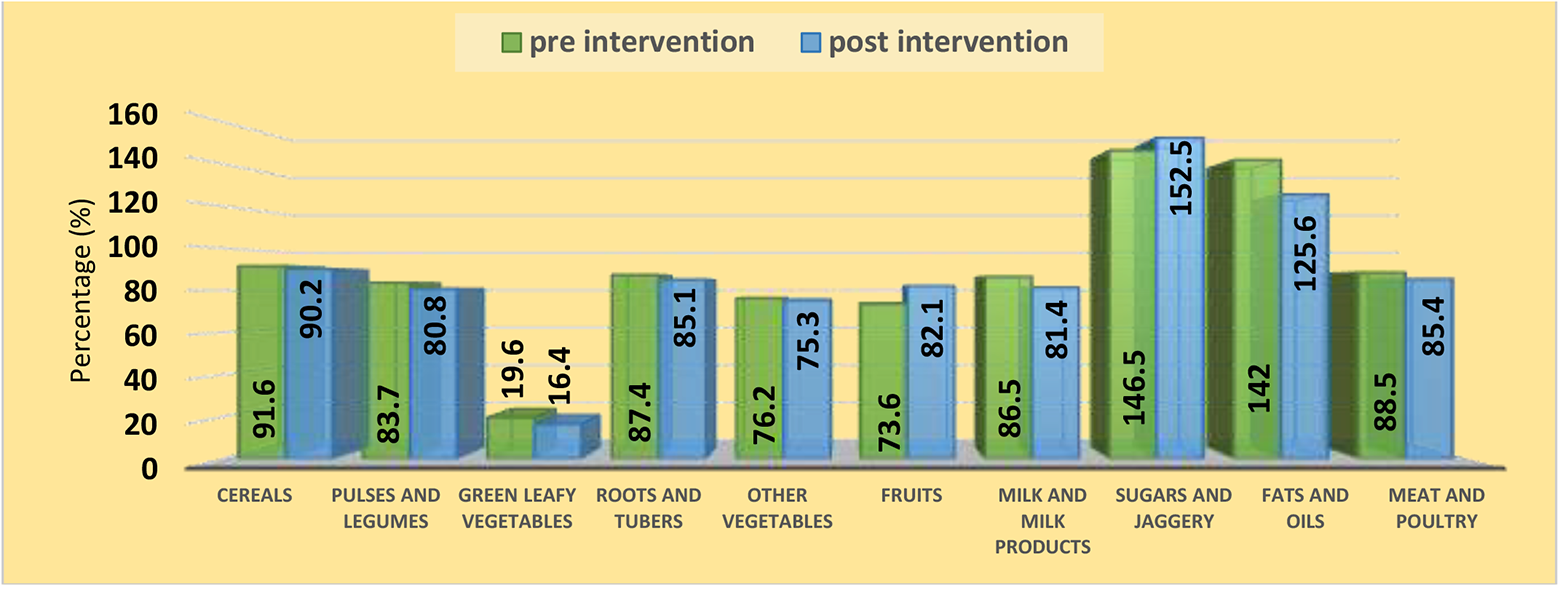
Percentage adequacy of food intake of the control group: pre- and postintervention (n = 60).
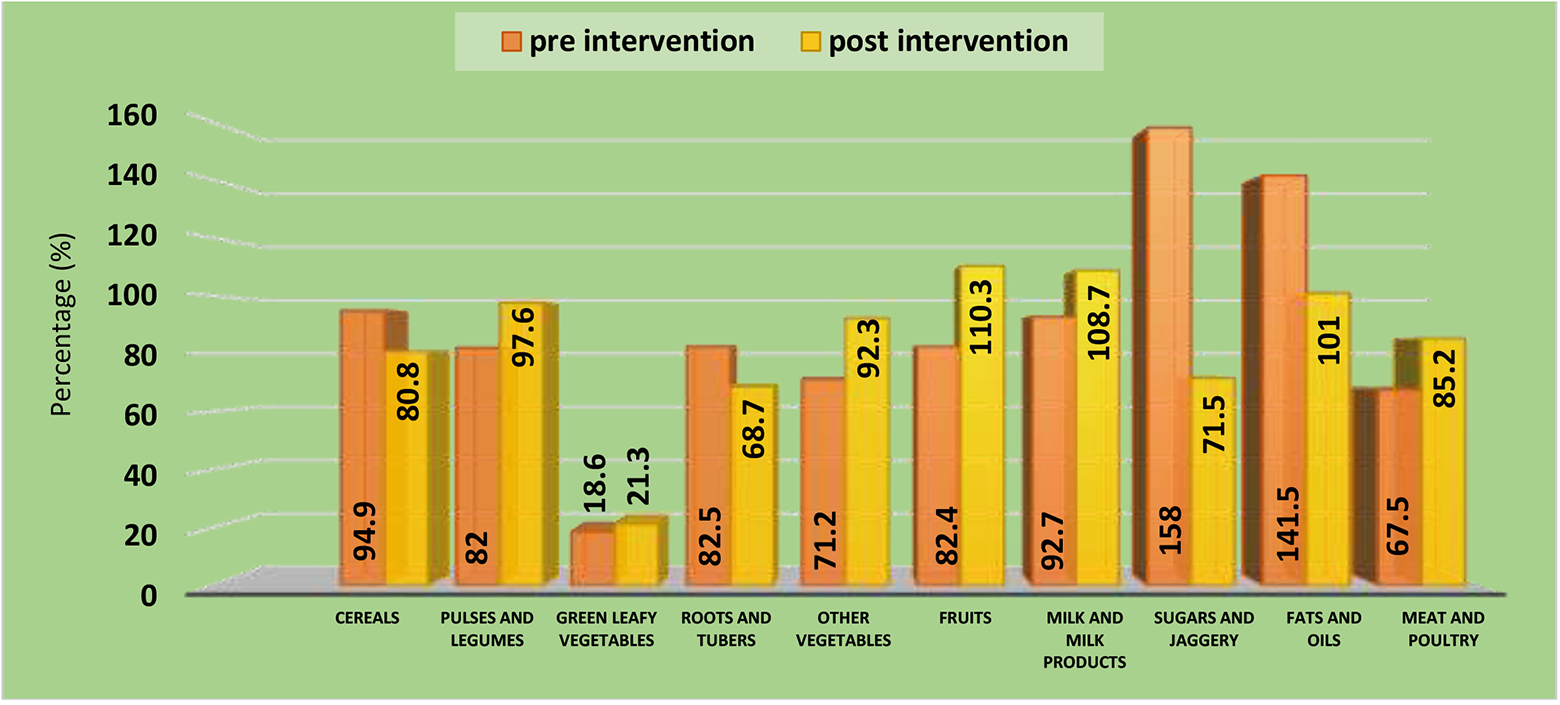
Percentage adequacy of food intake of the experimental group: pre- and postintervention (n = 60).
Nutrient Intake of Subjects
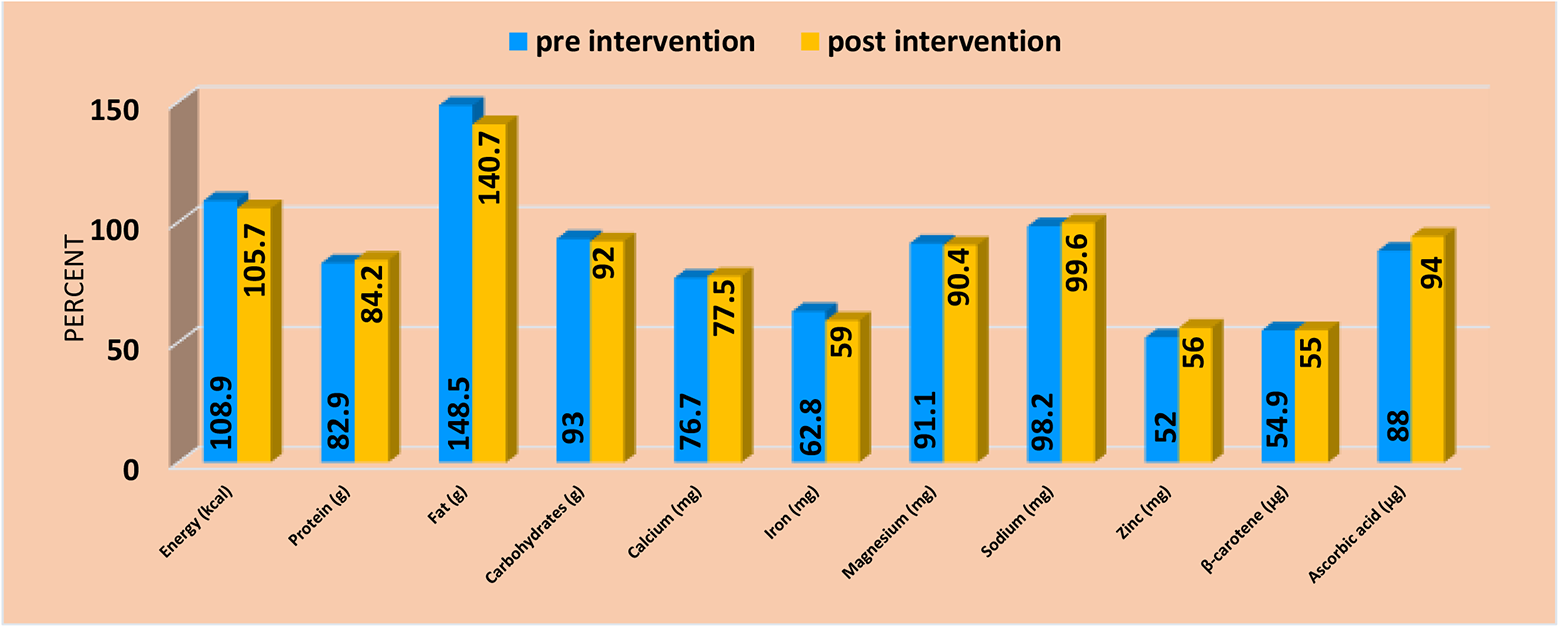
From the food intake data, nutrient intake of the selected subjects was computed using Dietcal. 12 The average daily nutrient intake and their percentage adequacies of both the group are been presented in Table 7 and Figures 3 and 4.
Effect of Nutrition Counseling on the Nutrient Intake of the Subjects.a
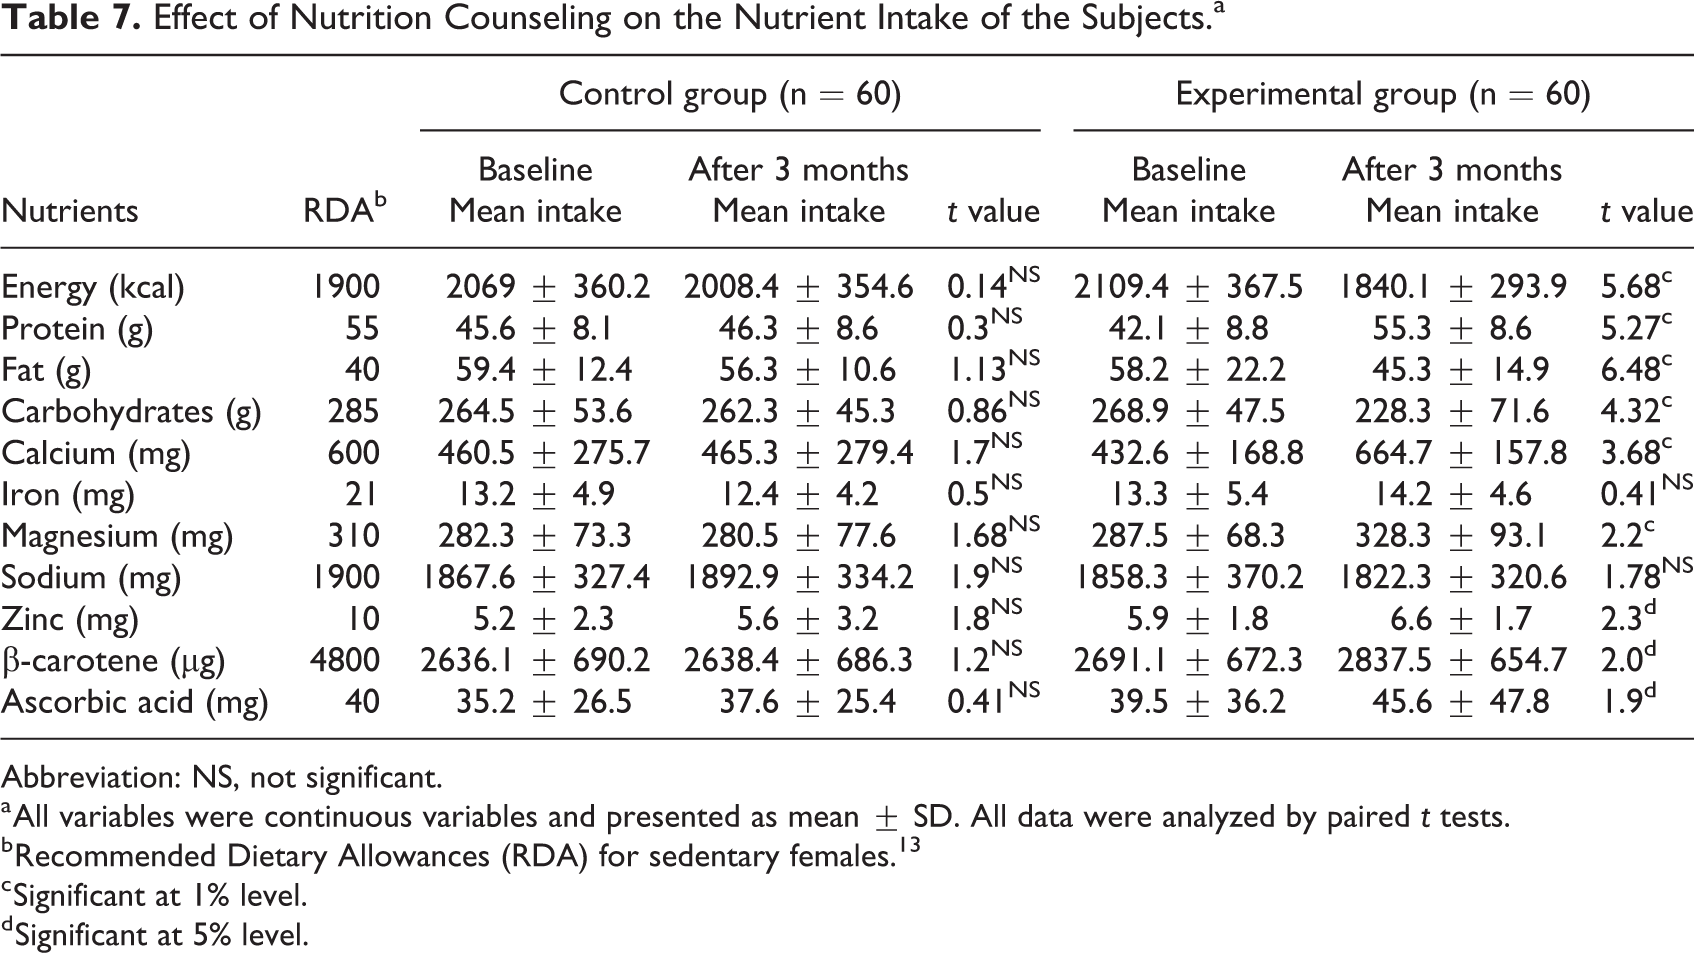
Abbreviation: NS, not significant.
a All variables were continuous variables and presented as mean ± SD. All data were analyzed by paired t tests.
b Recommended Dietary Allowances (RDA) for sedentary females. 13
c Significant at 1% level.
d Significant at 5% level.
Percentage adequacy of nutrient intake of the control group: pre- and postintervention (n = 60).
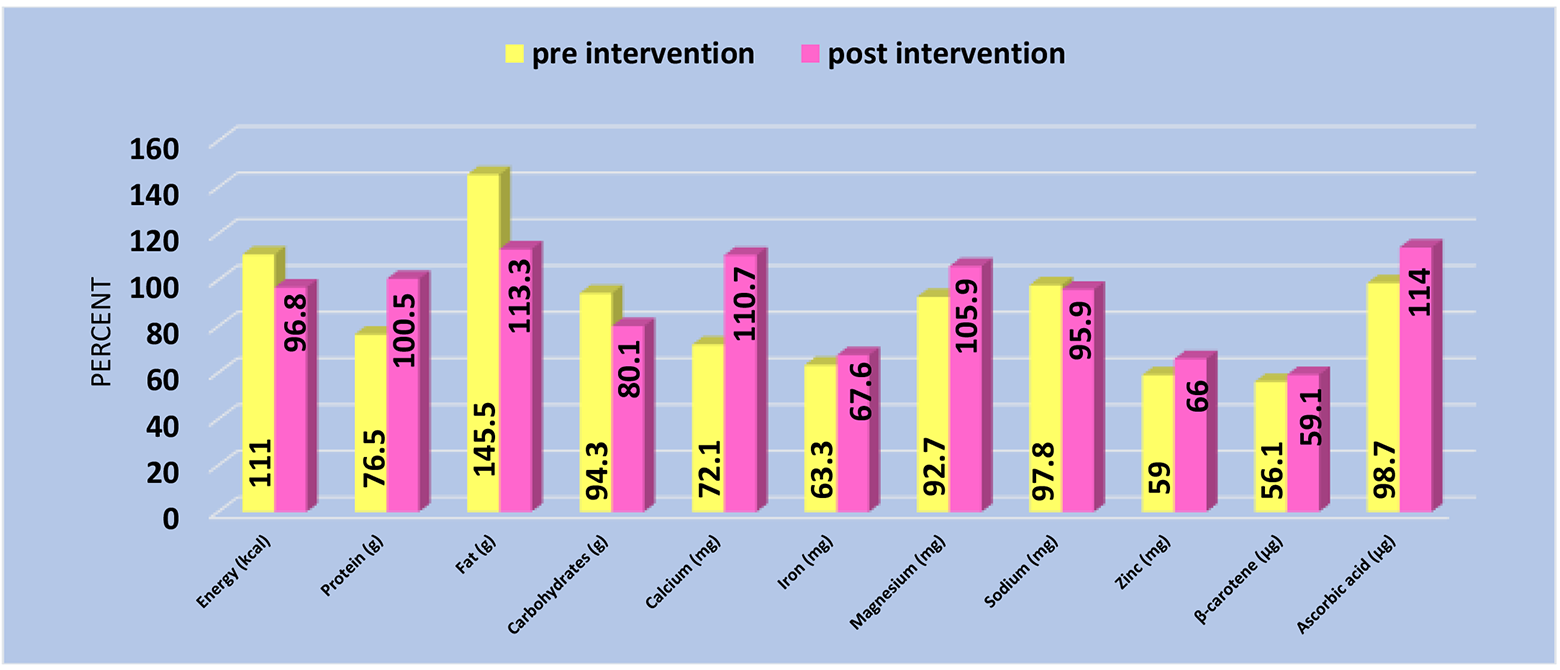
Percentage adequacy of nutrient intake of the experimental group: pre- and postintervention (n = 60).
The energy intake among the CG subjects was 2069 kcal/d, and among EG subjects, it was found to be 2109.4 kcal/d. However, after 3 months of nutrition intervention, the mean energy and fat intake reduced by 13% and 22%, while the protein intake increased by 31% in EG subjects. There was a nonsignificant change in the fat, carbohydrates, various minerals, and vitamins intake of the CG subjects. However, among the EG subjects, a significant (P ≤ .01) decrease was observed in the fat (from 58.2 ± 22.2 g/d to 45.3 ± 14.9 g/d) and carbohydrate (from 268.9 ± 47.5 g/d to 228.3 ± 71.6 g/d) intake. Among minerals and vitamins, intake of calcium, β-carotene, and ascorbic acid was found to increase significantly (P < .05) in the EG subjects.
Regarding percentage adequacy of various nutrients, energy and fat intake was found to be more than adequate among CG as well as EG subjects. Percentage adequacy of protein, calcium, iron, and β-carotene was found to be inadequate in the baseline data of both the groups. Post the counseling sessions, nutrients such as protein, calcium, magnesium, and ascorbic acid were reported to be adequate. A significant decrease in the fat adequacy from 145% to 113% was observed.
Diabetes Risk Score
The data collected in the present study (Figure 5) indicate that the majority of the selected subjects were under the high-risk category (45% in CG and 47% in EG) followed by moderate risk (41.7% in CG and 39% in EG) in both the groups. However, postintervention data showed a significant reduction in the high risk and moderate risk category among the EG subjects. As no intervention was given to the CG, so the percentages of high risk and moderate risk remain the same.
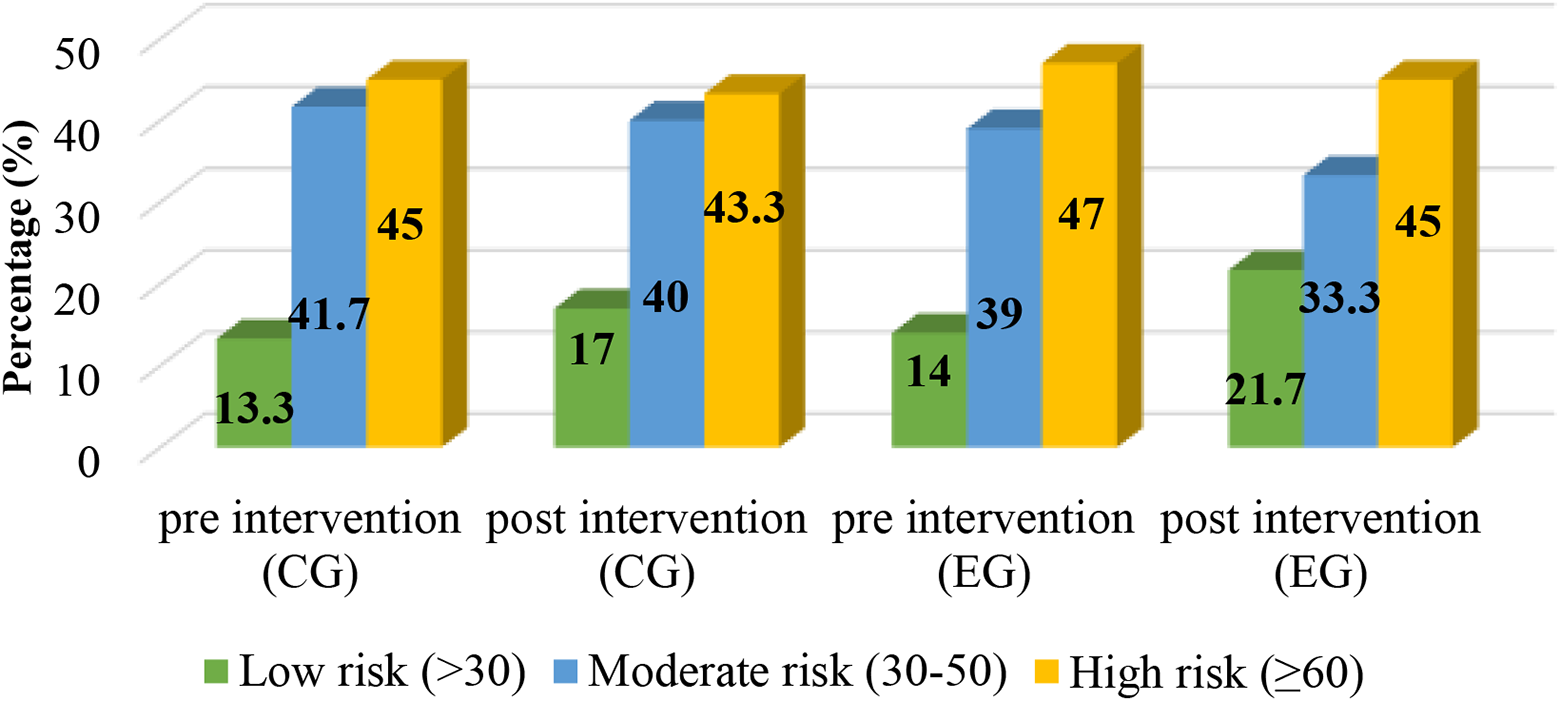
Classification of the experimental group subjects according to diabetes risk score.
Discussion
Diabetes is a fast-growing health problem worldwide. Diabetics have to depend on medication along with lifestyle and dietary modification right from the time they are diagnosed with the disease. In order to reduce the incidences of diabetes, early detection is needed and that category is termed as prediabetes, in which a person is at the edge of being diabetic. Lifestyle modifications and dietary guidelines can reverse back a prediabetic to normoglycemic by providing long-term intervention. India has devised a simple risk score, called the IDRS, which has factors such as age, waist circumference, and family history of diabetes and physical activity, according to which scores are given.
In the present study, the mean age of the selected subjects was 42.7 years. The results of the present study are in similarity with Anjana et al 17 who have reported the mean age for developing prediabetes as 42.5 years. The results of the present study indicate that 57.5% of the selected women had positive family history of diabetes. The majority of those who had a family history of prediabetes was linked to father. A study in Chennai on diabetics reported that 38.2% had a family history of diabetes. 18
The average height of the selected subjects in both the groups was found to be 159.8 cm, which was slightly higher than the average height (151 cm) of Indian women as given by ICMR (2010). 13 The classification of the subjects according to BMI indicated that maximum subjects in both the groups were under the preobese category (25-29.99 kg/m2). Misra et al 19 had reported that in North India 19.5% of the females in age group of 31 to 50 years had BMI above 25 kg/m. 2 In the present investigation, there was a decline in the preobese category among the experimental subjects after the intervention period. Comparing waist/hip ratio, it was noted that majority (55%) of the EG and CG women belonged to the high-risk category (≥ 0.85), depicting a higher prevalence of abdominal obesity among the subjects, but post data of the EG showed an increase in the low risk and moderate risk category on the basis of waist/hip ratio and diabetes risk score which might be due to a decrease in their waist circumference as an impact of increased PAL. Parker et al 16 reported that there is a reduction in the diabetes risk score of patients given MNT than the patients who were on the usual care.
During nutrition counseling sessions, the EG subjects were advised to include multigrain flour instead of wheat flour and 4 to 5 servings of seasonal fruits and vegetables in their daily dietaries. So, there was an increase in protein and dietary fiber intake, which eventually resulted in a decline in the FBG, HbA1c levels, total triglycerides, and total cholesterol:HDL-C ratio of the EG. Al-Sinani et al 20 concluded that counseling diabetic patients about the impact of food, nutrition, and physical exercise shifted the patients from “poor” to “good” metabolic control in terms of glycosylated hemoglobin, fasting glucose, and total cholesterol. As a result of the altered food intake, the percentage adequacy of nutrients such as protein, calcium, and ascorbic acid also improved. Along with dietary modification, the subjects were also counseled regarding physical activities like brisk walking, jogging, and cycling for at least 30 minutes a day which resulted in the improved PAL of the EG subjects. Parker et al 16 had also reported that after MNT for 12 weeks, the percentage of the subjects indulging in 30 minutes of physical activity increased from 20.9 to 95. Similarly, Busari et al 21 had also reported that empowerment with adequate knowledge is necessary to motivate the people to modify their lifestyle as a preventive measure to various health hazards.
Conclusions
From the above discussion, it can be concluded that prediabetes is a stage where dietary and lifestyle modification can play a significant role in improving the glycemic control of an individual. But once the diabetes is set in, the patient has to be put on medication along with dietary and lifestyle modification for whole of his life, which puts a great burden on the physical, mental, social, and economic aspects of the individual/society/country. So, nutrition intervention can be recommended as an effective tool in improving the metabolic control of the individuals, preventing them from being diabetics.
Footnotes
Authors’ Note
This work was done in collaboration with all the authors. Neerja Singla designed the study. Harleen Kaur performed the experimental work, wrote the protocol of this manuscript, and managed the analysis of this study. Rohini Jain managed the literature searches and associated in statistical analysis.
Acknowledgments
We are grateful to all the volunteers who in spite of their busy schedules agreed to participated in this study and for their cooperation in the fulfilment of this work. We are also thankful to all the instructors for their valuable comments during the study.
Declaration of Conflicting Interests
The author(s) declared no potential conflicts of interest with respect to the research, authorship, and/or publication of this article.
Funding
The author(s) received no financial support for the research, authorship, and/or publication of this article.