
Abstract
This article presents findings from baseline surveys in 5 states of Nigeria to assess the nutritional outcomes on target groups on attaining the UN Sustainable Development Goal 2. The augmented regression technique was applied to analyze data from a sample of 1642 households with at least 1 child under the age of 5 years (U5) and their mothers or caregivers out of a total of 2500 households that were drawn from the 250 enumeration areas of the Nigeria Bureau of Statistics in the 5 states. The results support the growing evidence base that poverty and household hunger are pervasive. The incidence of poverty highlights inequalities among states. The combination of poverty and hunger was mirrored in the damning extent to which all forms of malnutrition coexisted in children U5, particularly during the second year of infancy and among poor households. Evidence from this study points to poor dietary quality of complementary food rather than other childcare practices as majorly responsible for child malnutrition. Child wellness was positively affected by maternal health-seeking behavior but negatively by the poverty probability index of the household. Notably, maternal health-seeking behavior played a more relevant role in child wellness than mothers’ educational attainment.
Introduction
In the Global Nutrition Report of 2015, Nigeria was grouped among countries where only a minority of children are growing healthily. 1 Nigeria’s under-five stunting and under-five wasting prevalence of 43.6% and 10.8%, respectively, are significantly greater than the average of developing countries with 25% and 8.9%. This is further complicated by the worrying coexistence of stunting, wasting, and overweight with the prevalence of 1.6% overweight in under-fives in Nigeria in 2015. 1 On the issue of hunger, Nigeria with a Global Hunger Index (GHI) of 27.9 ranked 93 out of 117 countries places the country in the category of those with a serious hunger problem being worse than the global level of hunger and malnutrition estimated at 20.0. 1,2 In addition, 53.5% of Nigeria’s population lives on less than US$1.90 a day at 2011 purchasing power parity. 3 These poor trends occurring together in 1 location are not surprising as Barrett and Lentz 4 and Headey 5 already found that poverty and hunger are closely correlated, with each influencing the other; they rather reinforce the UN Children’s Fund’s thesis that the causes of child malnutrition are complex, multidimensional, and interrelated. 6,7 Nevertheless, there has been a reduction in GHI scores since 2000, which demonstrates that hunger and undernutrition are not immutable problems and it serves as cause for cautious optimism. In many countries, progress is too slow to be able to achieve the second Sustainable Development Goal (SDG)—known in short as Zero Hunger—by 2030. At the current pace, approximately 45 countries will fail even to reach low hunger as defined by the GHI Severity Scale by 2030. It is now essential to double down on the task of reducing hunger and undernutrition in the many parts of the world that are faltering.
Concerned on the one hand by the deteriorating poverty, hunger, and malnutrition reports and on the other hand bolstered by the successes recorded by Brazil, Ethiopia, and Bangladesh on the same subject, 2,8 the Federal Republic of Nigeria committed in September 2015 to achieving the “2030 Agenda for Sustainable Development” (also known as SDGs), including the measurement and monitoring of progress toward achieving the set targets. Among the goals, numbering 17, Nigeria prioritized the SDG 2, the so-called Zero Hunger goal, calling on member states to “End hunger, achieve food security and improved nutrition, and promote sustainable agriculture” by 2030. 9 The principal targets of SDG2 comprise (1) ending hunger and ensuring access to safe, nutritious, and sufficient food; (2) ending all forms of malnutrition; (3) doubling the productivity and incomes of small-scale food producers; (4) ensuring sustainable food production systems and implementing resilient agricultural practices; and (5) maintaining the genetic diversity of seeds, plants, and animals. Supplemental measures to promote the achievement of the targets include: (1) increasing investment, (2) correcting and preventing trade restrictions and distortions, and (3) ensuring the proper functioning of food commodity markets.
In the words of Webb et al, 2 the SDGs require all countries and their citizens to act together to end hunger and all forms of malnutrition by 2030. Setting targets is a good first step, but actions need to follow quickly. Urgent attention to achieve such goals is seriously overdue. Policy action must be designed to reduce malnutrition in all its forms and be adequately funded. Measures must be evidence based, implemented at scale, and include both broad based and targeted actions aimed at the most nutritionally vulnerable people. The evidence to support such actions is growing, but it is already plentiful and compelling; there is no need for delay. The rapidly escalating threats posed by malnutrition represent a planetary challenge on a par with poverty and climate change. An appropriate response at the required scale is top priority for decision-makers globally. It cannot wait.
The Nigeria Zero Hunger Strategic Review was established that sought to articulate what Nigeria must do to achieve SDG2 (Zero Hunger) by 2030 through an open and consultative process. 10 One of the major activities of the Strategic Review was to conduct a baseline survey to establish the true situation at the start as benchmarks and enable tracking of the implementation progress. The International Institute of Tropical Agriculture (IITA) was charged with the responsibility to lead baseline surveys in 5 states—Benue, Ebonyi, Kebbi, Ogun, and Sokoto—spread across 4 of the Nigeria’s 6 major agroecological zones. Following a design workshop by stakeholders, field activities for data collection, analyses have been completed and representatives of these states met at IITA, Ibadan, where they reviewed and subsequently validated the findings of the surveys. Technical reports and policy briefs were produced. This article presents findings from a more rigorous analysis of the data from the baseline surveys and it provides deeper insights on key issues and findings for the scientific community, development partners, and policy-makers.
After the Introduction, the Methods (study area, data collection, data analysis, theoretical/ analytical framework, and empirical model) are presented in the next section. The third section is on Results and Discussion. The last section is on Summary and Conclusion.
Methods
Study Area, Sampling, and Data
The Nigeria Zero Hunger Baseline Survey (NZHBS) was implemented in 5 states—Benue, Ebonyi, Kebbi, Ogun, and Sokoto, Nigeria. The sample design for the survey derives from the National Integrated Survey of Household (NISH; https://www.nigerianstat.gov.ng/nada/index.php/catalog/22/sampling) developed by National Bureau of Statistics (NBS). The NISH design employed a replicated sampling design that is technique by which many samples (replicates) were selected independently from a population such that each replicate sample represents the population. Essentially, the NISH sample design is a 2-stage replicated and rotated cluster sample design with enumeration areas (EAs) as first stage sampling unit or primary sampling unit and housing units as the second-stage sampling units (secondary sampling units). Generally, for each State of the Federation, the NISH master sample is made up of 120 EAs drawn in 12 replicates. A replicate consists of 10 EAs. The EAs demarcated by the National Population Commission (NpopC) for the 1991 population census served as the primary sample frame for the design. In the first stage selection, 50 EAs were selected with equal probability from the list of EAs in each state of the survey states. The selected EAs cut across rural and urban sectors. The study EAs for NZHBS were drawn from replicates 8, 9, 10, 11, and 12 of the master sample of each state. In the second stage selection, in each selected EA, a listing of housing units was carried out based on NpopC, 1991 data. The result provided the frame for the second stage selection. Ten households were selected systematically in each EA.
Since the NZHBS was implemented in 5 states as an NISH module, 5 replicates were studied per state. With a fixed take of 10 households systematically selected per EA, 500 households thus were selected for interview per state. Hence, a total of 2500 households were drawn from the 250 EAs in the 5 states. From this sample of households, only those with at least 1 child under the age of 5 years (U5) totaling 1642 households were retained for the interview and were included in the analyses.
Data
The survey was conducted in collaboration and with full support of governments in the states, the NBS, UN International Children’s Emergency Fund, and the World Food Programme in providing personnel, equipment, and training. All the enumerators had a minimum of Ordinary National Diploma up to holders of MSc degree. A special consideration was given to those who have the knowledge in the use of Information and Communication Technology and also to gender sensitivity in the appointment of enumerators to ensure balance in each team. This ensured interviewing of female household members (mothers/caregivers) by female enumerators taking into account the local culture in some of the study areas. Enumerators were trained in the use of Computer Assisted Personal Interview tool based on SurveyBe, anthropometric measurement, georeferencing sampled household locations using the necessary Geographical Position System measuring machine, and in appropriate documentation procedure. The questionnaires were jointly designed and agreed to by stakeholders who participated in the survey design workshop. Data collection using tablets in the field helped to reduce the data entry time, enabled remote monitoring, early detection of errors, and data cleaning, all of which contributed greatly to data quality. The collected data came from a single cross-sectional survey on the nutritional statuses of surveyed children that were based on anthropometry. Analyses were done using SPSS and EPI Info.
Theoretical/Analytical Framework
The analytical approach used to fit the data collected during this study is based on a well-known model in which a household maximizes a long-run utility function that depends on the health and nutrition of each member as well as goods consumed from purchase or household production and leisure. 11,12 The basic utility function U for the ith member of household is represented as follows:

where Hi is an indicator of health and nutrition status of the ith member of the household, Ci is the member’s consumption of purchased and household produced goods, Li is the ith member’s leisure, Xi is a vector of exogenous variables specific to the ith member, and Y is a vector of variables specific to the kth household. The function can be maximized subject to certain constraints, for example, resource levels, production function, income levels. When the components or elements of a household model are separable, for example, decisions on production, consumption, and leisure are taken sequentially rather than simultaneously, then the optimization problem can be solved through a system of recursive equations. If the decisions are not taken sequentially, rather simultaneously, then a reduced form or structural equations may be applied to solve the optimization problem. 13
The focus of this analysis is child nutritional status measured by height-for-age z-score (HAZ) and weight-for-age z-score (WAZ) obtained using the US National Center for Health Statistics/World Health Organization international reference population. 14 Weight-for-age z-score has been used in many epidemiological studies of undernutrition and child mortality, including in the latest systematic review and meta-analysis 15 and is suitable for the analysis of multiple determinants of child health, including socioeconomic determinants. 16 Height-for-age z-score is an indicator for linear growth and reflects cumulated and chronic child health conditions. Assuming that the elements of the utility function are not separable, we define a child’s growth production function as follows:
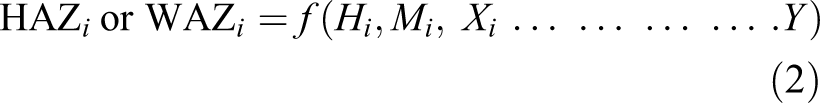
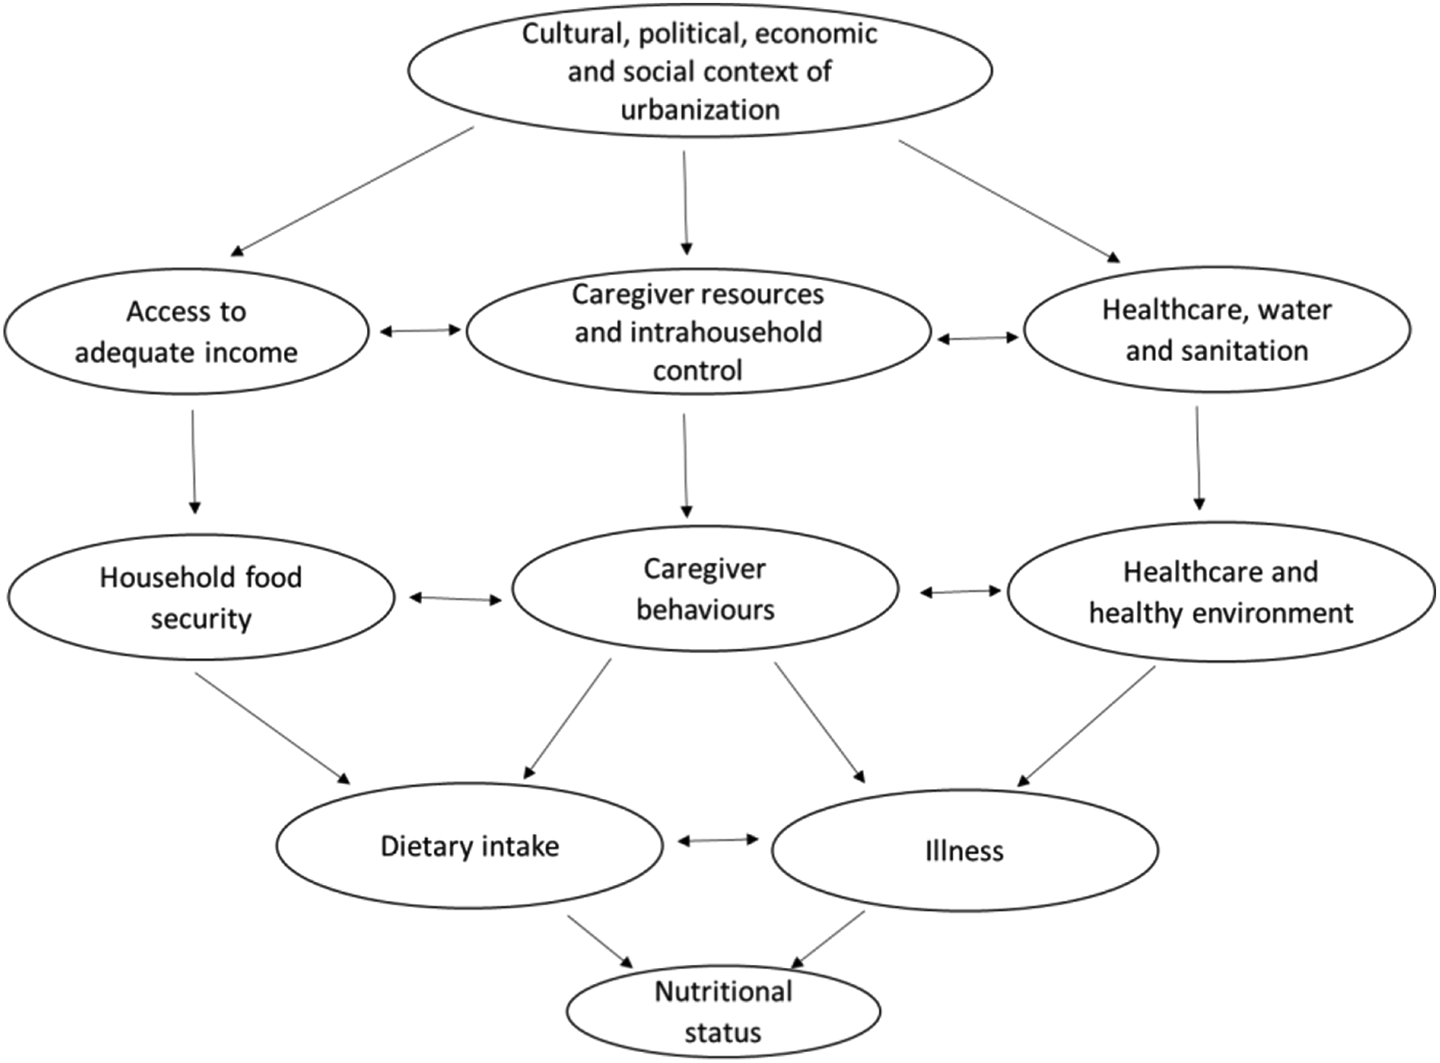
Where HAZ i and WAZ i are the height-for-age and weight-for-age z-score, respectively, of the ith child, Hi is an endogenous variable representing the overall health and nutritional status for household k, Mi is an endogenous variable representing standardized anthropometric measurement of the body mass index (BMI) to reflect a mother’s or caregiver’s health and nutritional status in the kth household, Xi is a vector of specific characteristics of the ith child, for example, child’s age and gender; Y is a vector of exogenous variables characterizing the kth household, for example, household well-being. In summary, Equation 2 hypothesizes that a child’s health and well-being depend jointly and primarily on the household’s well-being, the status of health and nutritional status of the child’s primary caregiver, the child’s inherent characteristics, and the physical environment affecting the child’s growth. In other words, the causes of child malnutrition are complex, multidimensional, and interrelated. This is in consonance with UN Children’s Fund’s framework for the causes of child malnutrition 6,7 and its subsequent extension 17 to incorporate childcare as illustrated in Figure 1.
If the set of endogenous variables, namely Hi and Mi in Equation 2, are represented by Wi, then the demand function for each variable can be structurally represented as follows:

Where Wi is a production outcome, for example, household well-being, Ui is at least one of the above endogenous variables, and xi and y are relevant variables selected from Xi and Y as previously defined.
In Equations 2 and 3, the variables have been characterized as exogenous and endogenous in recognition of the problem of estimation bias introduced into production functions when some inputs are endogenous and correlated with the error term. This simultaneity is often resolved by estimating reduced form models with all the exogenous variables and through the use of instrumental variables or augmented regression technique to arrive at predicted values of the endogenous inputs into the production function. 19,20 Although reduced form models are easier to estimate and appear suitable for determining the effects of particular interventions associated with exogenous variables in the models, they are less amenable than production functions to extrapolation beyond existing conditions. 20 -23 However, this analysis is not intended for extrapolation and the reduced form approach remains applicable. 24
The Empirical Model and Definition of Variables
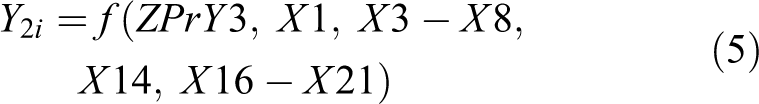
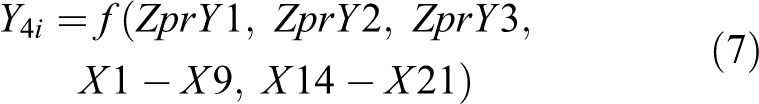
In this analysis, HAZ and WAZ are the key indicators of child health and nutritional status, and the following structural model has been specified with the variables identified for the best fit equations to capture the direct and indirect influence of various factors on HAZ and WAZ in a sequential manner:


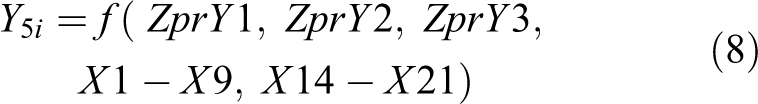
where:
Y1i is an index of status of health and nutrition of the ith child and ZPrY1i is its predicted value,
Y2i is the BMI of the mother/caregiver of the ith child and ZPrY2i is its predicted value,
Y3k is an index of well-being of the kth household and ZPrY3k is its predicted value,
Y4i is the HAZ of the ith child, and
Y5i is the WAZ of the ith child.
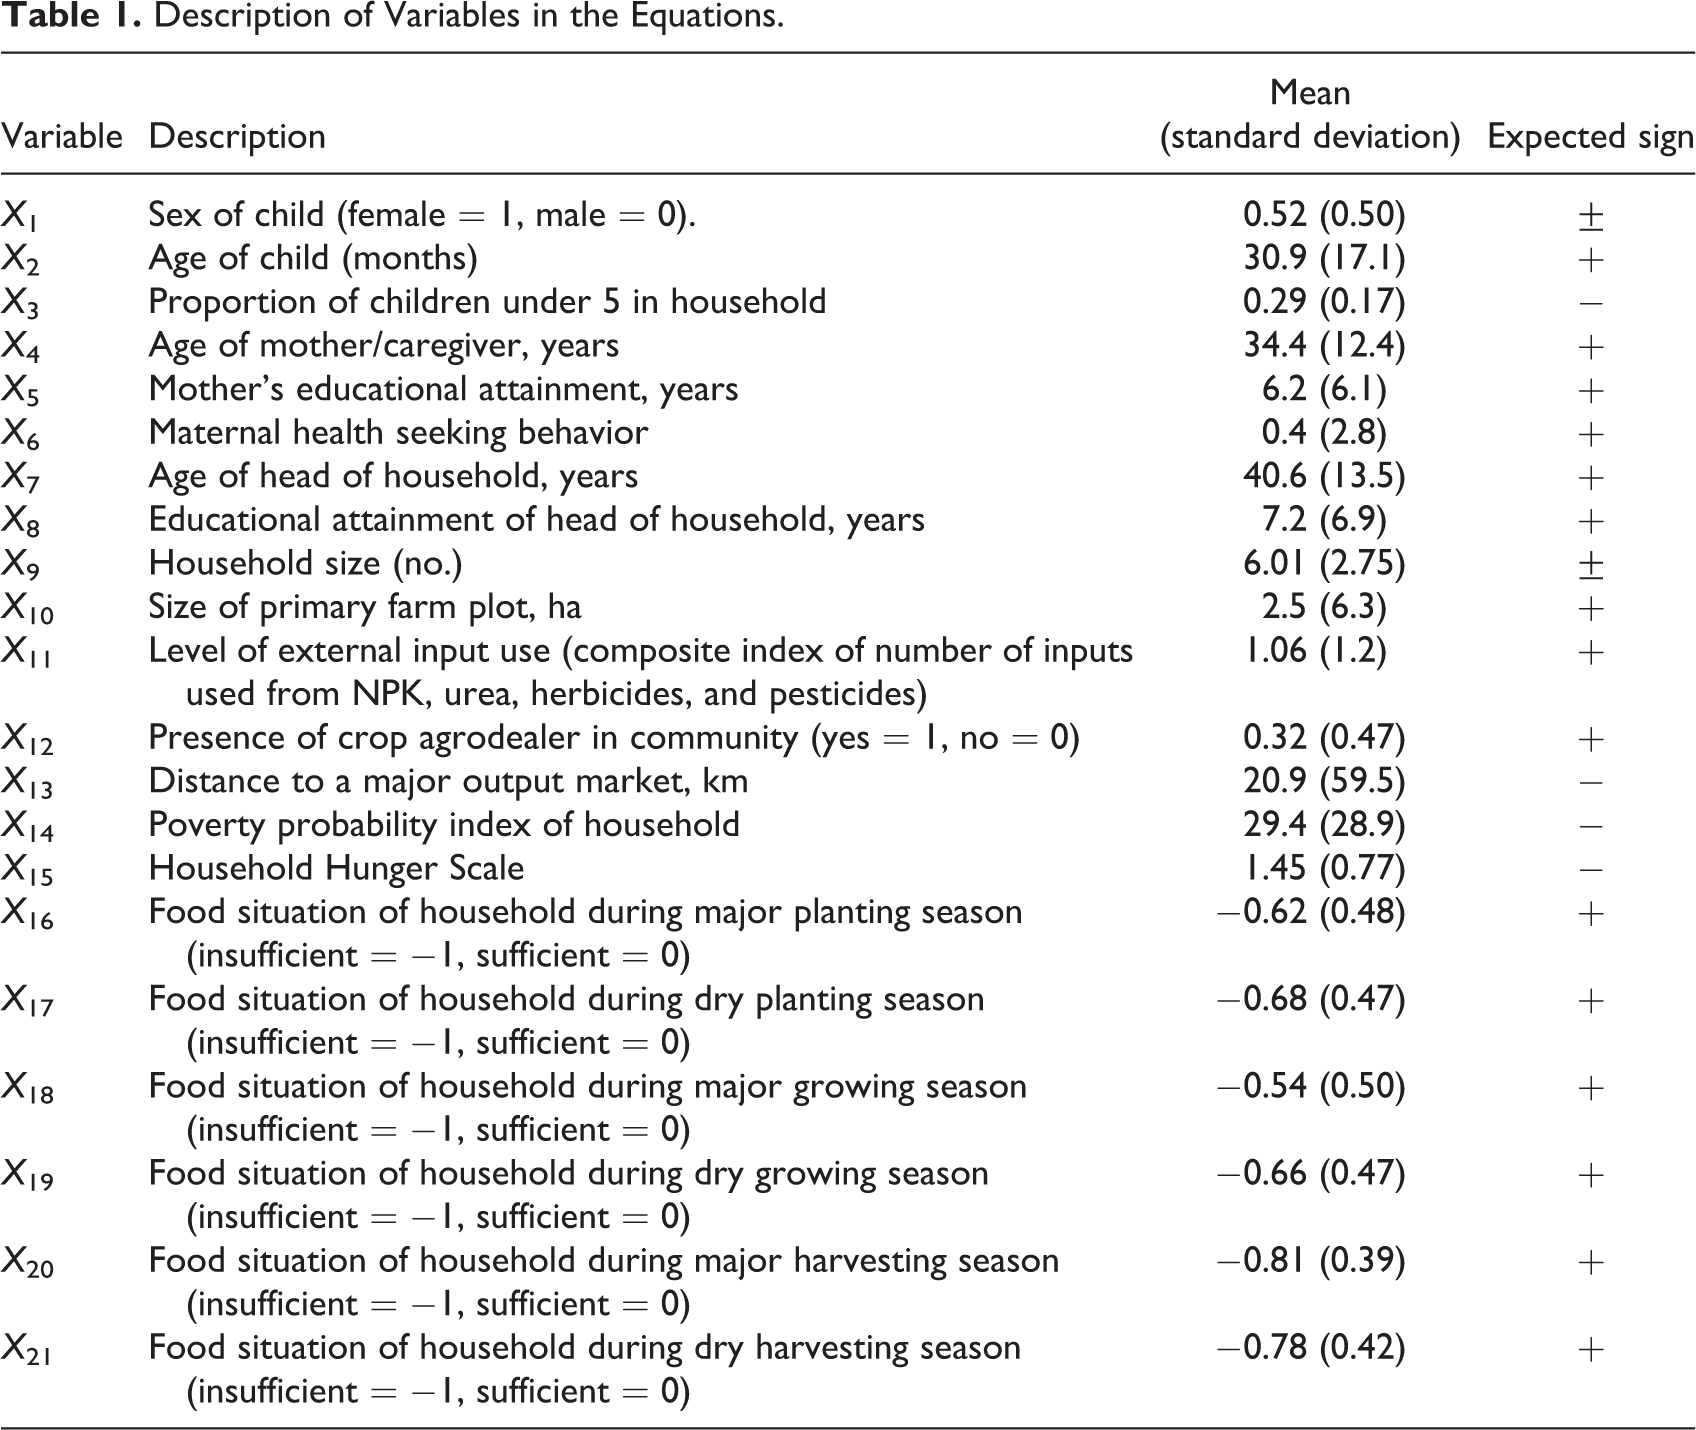
There are 21 variables (X1-X21) representing the characteristics of the child, mother, and household variables in the empirical model. They are described in Table 1 with further description of indices that were constructed by the authors in Appendix A.
Description of Variables in the Equations.
The parameters of the equations were estimated by using augmented regression technique to arrive at predicted values of the endogenous inputs. In the first stage, Y1, Y2, and Y3 were regressed on all exogenous variables for the given inputs. In the second stage, standardized predicted values of, that is, ZPr_Y1, ZPr_Y2, and ZPr_Y3 were then included in the estimated regressions. Appropriate test using procedures recommended by Hausman 19 and Davison and Mackinnon 20 were used to test for simultaneity and endogeneity by comparing ordinary least square estimates with estimates from the standardized predicted values.
Results and Discussion
Results from descriptive statistics on key variables (household hunger, poverty, infant and young child feeding practices [IYCFP]) are presented and discussed followed by results from the empirical analyses.
Household Hunger
Based on Household Hunger Scoring, 27.7% of the surveyed households suffered moderate to severe hunger due to food shortage (Table 2).
Percentage of Households Suffering Little, Moderate, or Severe Hunger in Benue, Ebonyi, Kebbi, Ogun, and Sokoto States, Nigeria.a,b
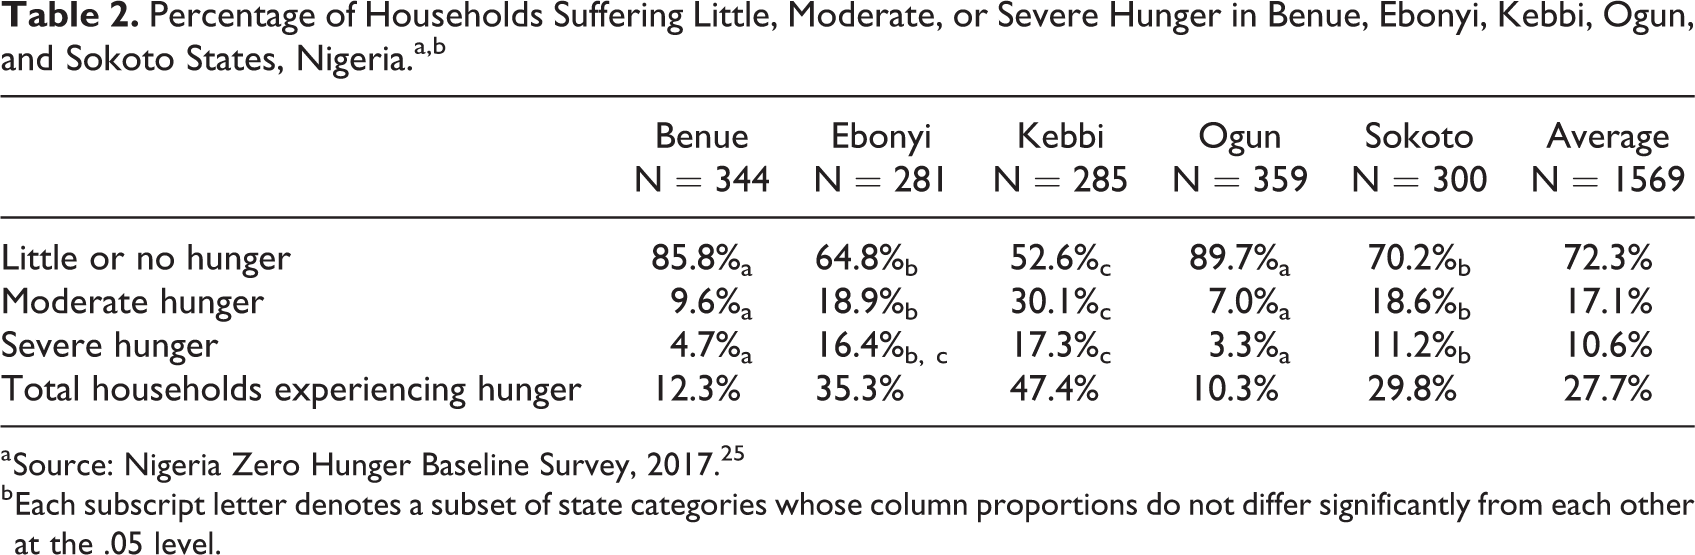
a Source: Nigeria Zero Hunger Baseline Survey, 2017. 25
b Each subscript letter denotes a subset of state categories whose column proportions do not differ significantly from each other at the .05 level.
The incidences of moderate and severe hunger were highest in Kebbi State and lowest in Ogun State, for both cases as well. Of the 13 potential reasons for food shortage in the household (Table 3), the commonest across all states was that food was too expensive and/or that the household did not have enough money to buy sufficient food.
Reasons for Food Shortage in Benue, Ebonyi, Ogun, and Sokoto States, Nigeria (Percentage of Households).a
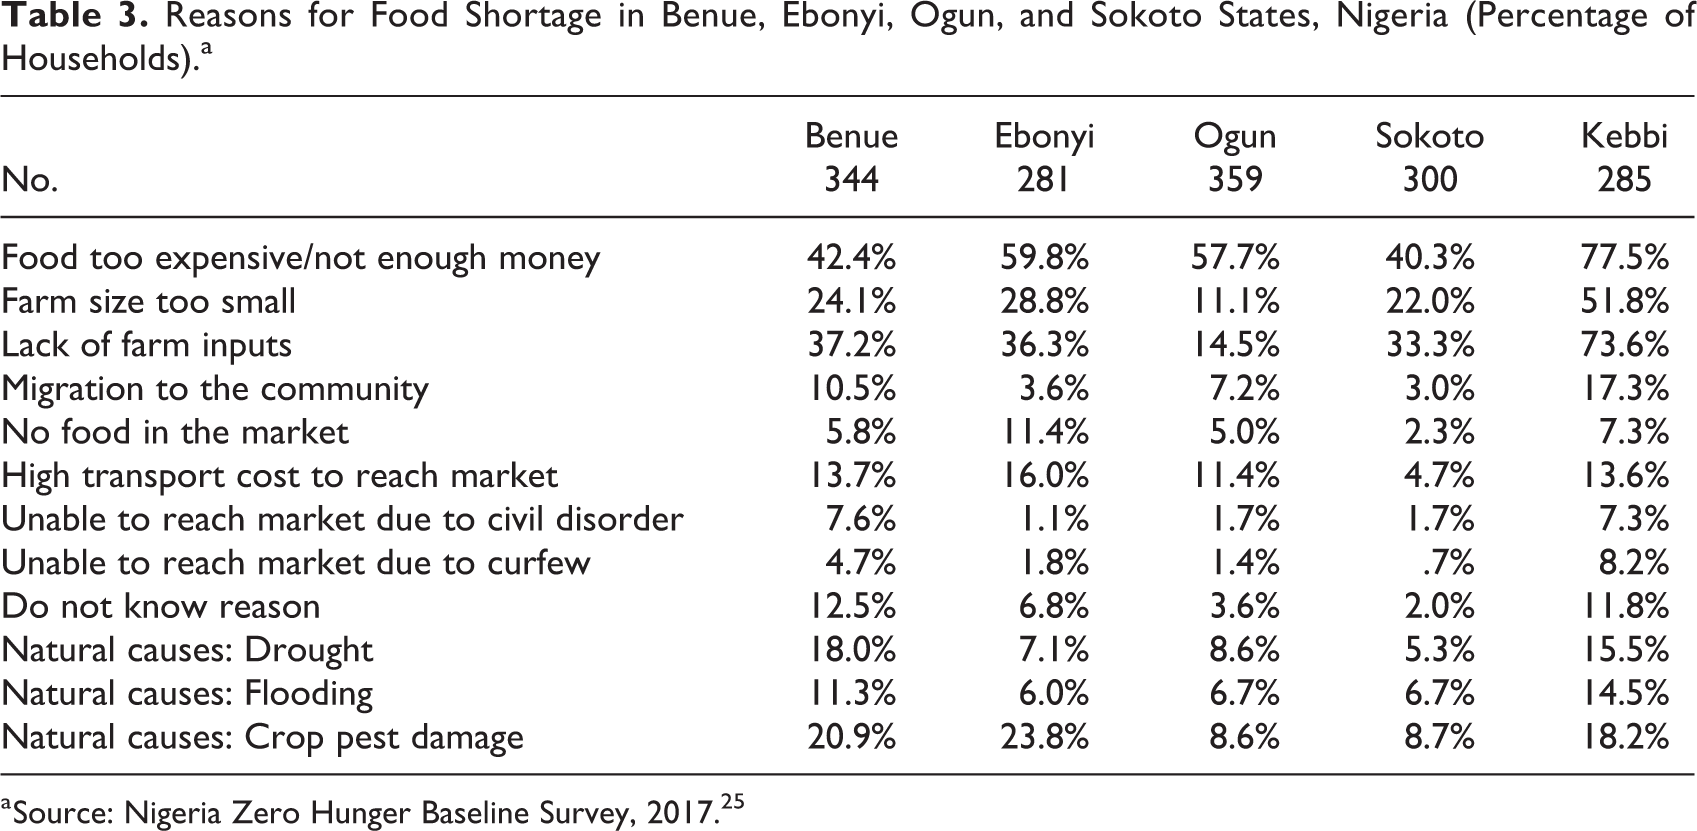
a Source: Nigeria Zero Hunger Baseline Survey, 2017. 25
The second and third most important reasons were lack of farm inputs followed by farm size being too small. The first strengthens the thesis by Barrett and Lentz 4 and Headey 5 that poverty and hunger are closely correlated, with each influencing the other. This is one of the common cases where households suffered hunger because they could not afford to buy food or successfully grow sufficient quantity due to low productivity occasioned by low external input use and unviable farm size. 26 The agricultural calendar in Nigeria has 6 seasons, namely, major planting, dry planting, major growing, dry growing, major harvesting, and dry harvesting (Table 4).
Percentage of Households Not Having Enough Food to Eat During Various Seasons in Benue, Ebonyi, Kebbi, Ogun, and Sokoto States, Nigeria, in 2017.a,b
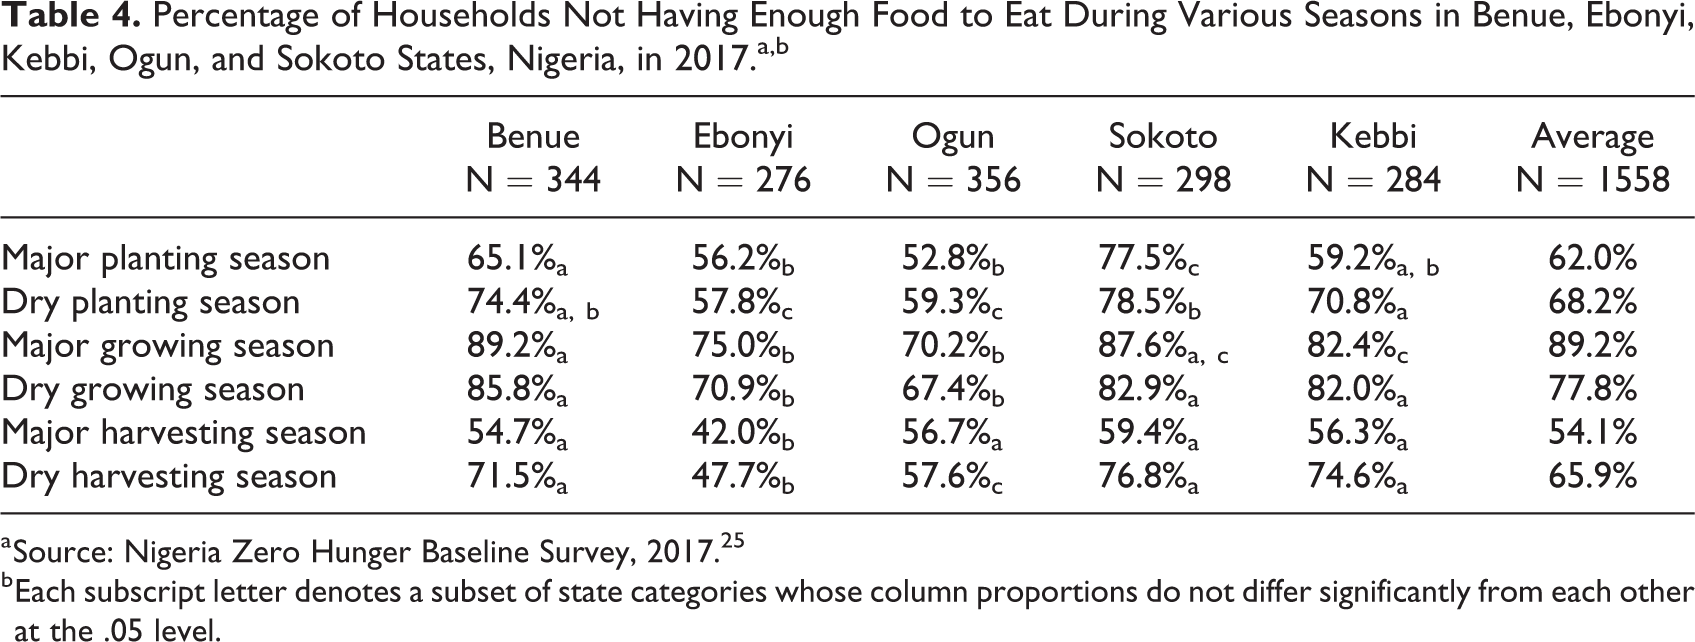
a Source: Nigeria Zero Hunger Baseline Survey, 2017. 25
b Each subscript letter denotes a subset of state categories whose column proportions do not differ significantly from each other at the .05 level.
Households were found to be most food insecure during main planting and main growing seasons (also known as hunger periods) and least food insecure during the harvesting seasons. This is according to expectations and reinforces the need to target the planting and growing seasons for release of buffer stocks from public food reserves to reduce the impacts of hunger or in the alternative to purchase grains for storage and also boost commodity prices during harvest seasons to mop-up excess products from markets and avoid glut.
In situations of household food insufficiency, households adopted varying strategies to cope. The level of strategy adopted per state out of 18 potential coping strategies is presented in Table 5. A lesson that appears to emerge from the choices of coping strategies is for programs that seek to address household hunger especially in poor households to seriously consider how to make a variety of food available and cheap at all times.
Percentage of Households Deploying Various Coping Strategies Against Food Shortage During Major Growing Season in Benue, Ebonyi, Kebbi, Ogun, and Sokoto States, Nigeria.a
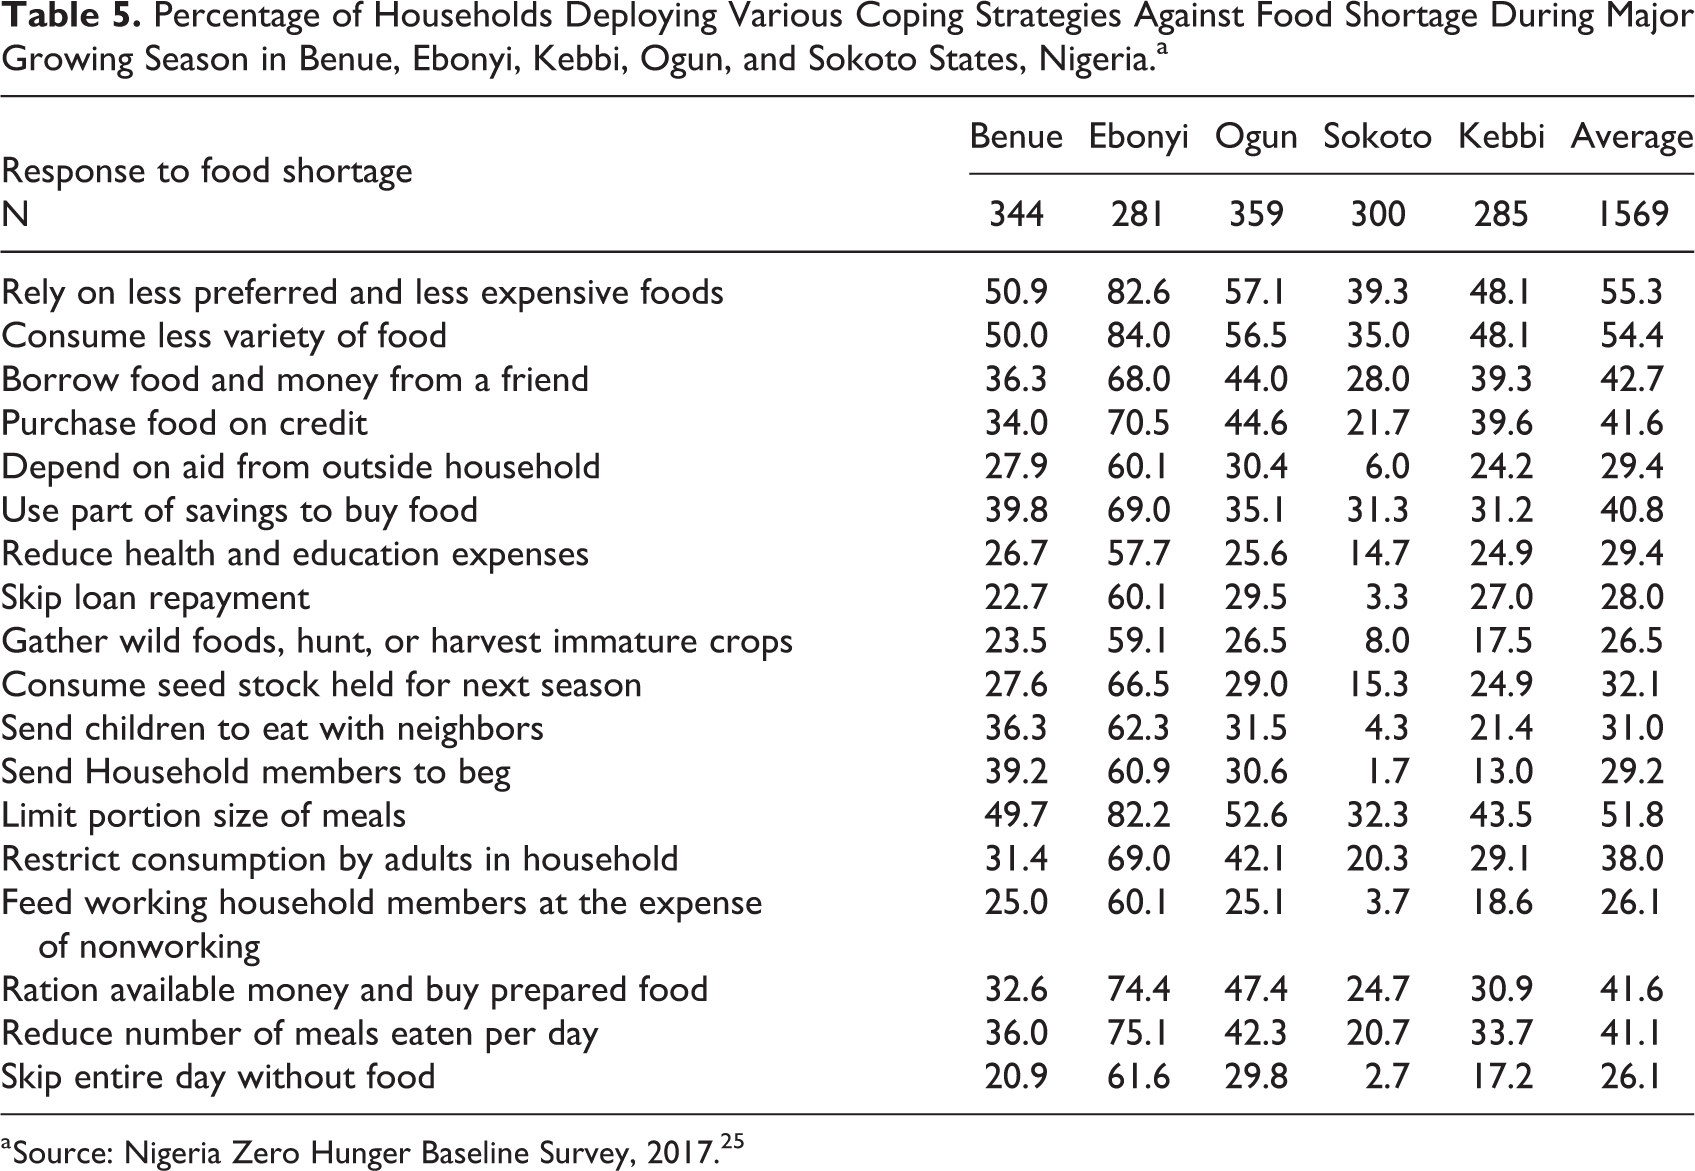
a Source: Nigeria Zero Hunger Baseline Survey, 2017. 25
Poverty
Results based on US$1.9 per person per day poverty line (http://www.worldbank.org/en/topic/poverty/global-poverty-line-faq) showed that, overall, 29.4% of the surveyed households had persons living below that poverty line (Table 6).
Poverty Probability Index of Households in Benue, Ebonyi, Kebbi, Ogun, and Sokoto States, Nigeria, With Members’ Consumption Likely to be Below US$1.9 Per Person Per Day.a
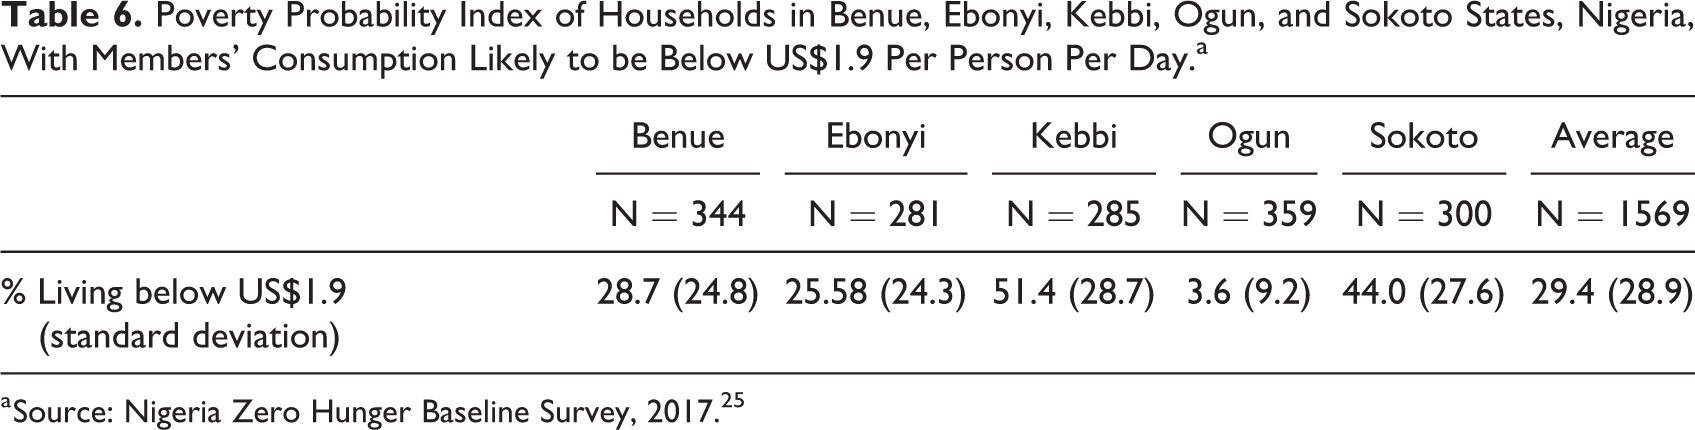
a Source: Nigeria Zero Hunger Baseline Survey, 2017. 25
Poverty was most pervasive among households Kebbi State (51.4%) and least among households in Ogun State (3.6%). The cumulative frequency distributions of poverty likelihood among households as depicted in Figure 2 confirm not only the pervasive nature of poverty in most of the study area but also illustrates glaring inequalities existing among states, especially for Ogun and Kebbi States.
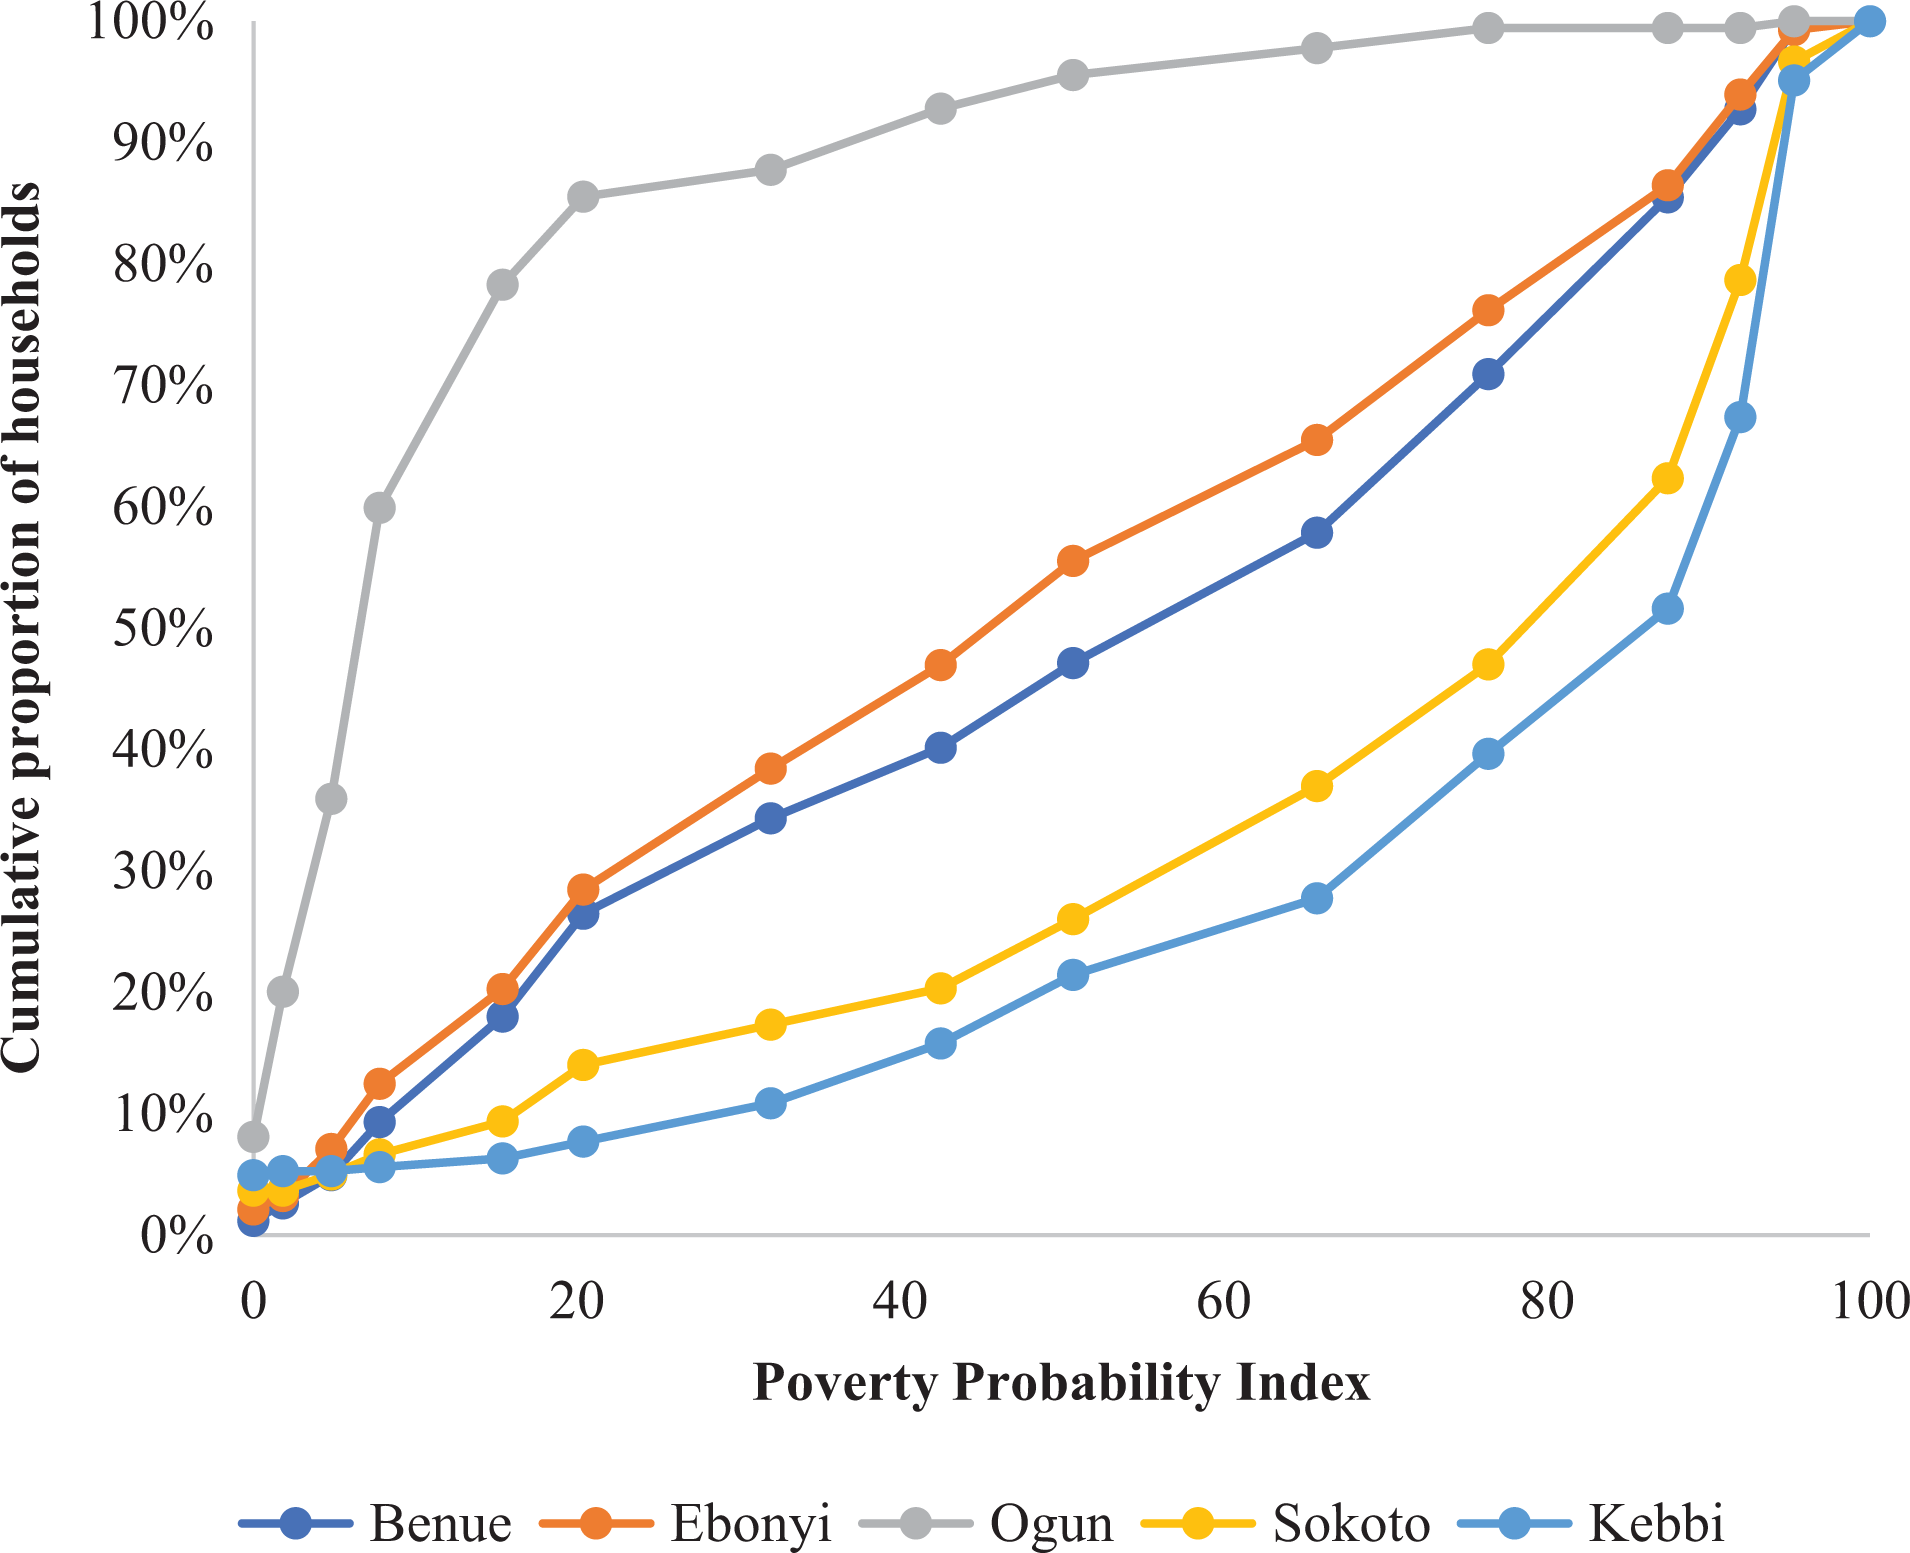
Cumulative frequency distribution of households with members in Benue, Ebonyi, Kebbi, Ogun, and Sokoto States, Nigeria, likely to be living below the US$1.9/person/d poverty line. Source: Nigeria Zero Hunger Baseline Survey by IITA, 2017. 25
Although the distribution of wealth, more or less, follows the normal curve for Benue and Ebonyi States, the graph for Ogun has a convex surface—more nonpoor versus poor, considered as positive—compared to Kebbi (less so Sokoto) with a concave surface depicting proportionately more poor versus nonpoor which is adverse. For example, based on the US$3.1 poverty line, 80% of households in Ogun have only about a 15% chance and below of living in poverty; but for the same 80% of households in Sokoto, the likelihood of being poor is more than 80% for some.
Infant and Young Child Feeding Practices and Care
Good caregiving practices related to child feeding and use of preventive health services were a strong determinant of children’s HAZ. 27
As shown in Figure 3, IYCFP relating to breastfeeding, for example, early initiation of breastfeeding, children ever breastfed, predominant breastfeeding at 1 year, all appear to be within expected ranges especially when compared with the country profile of Nigeria published in the Food and Nutrition Technical Assistance II Project. 28
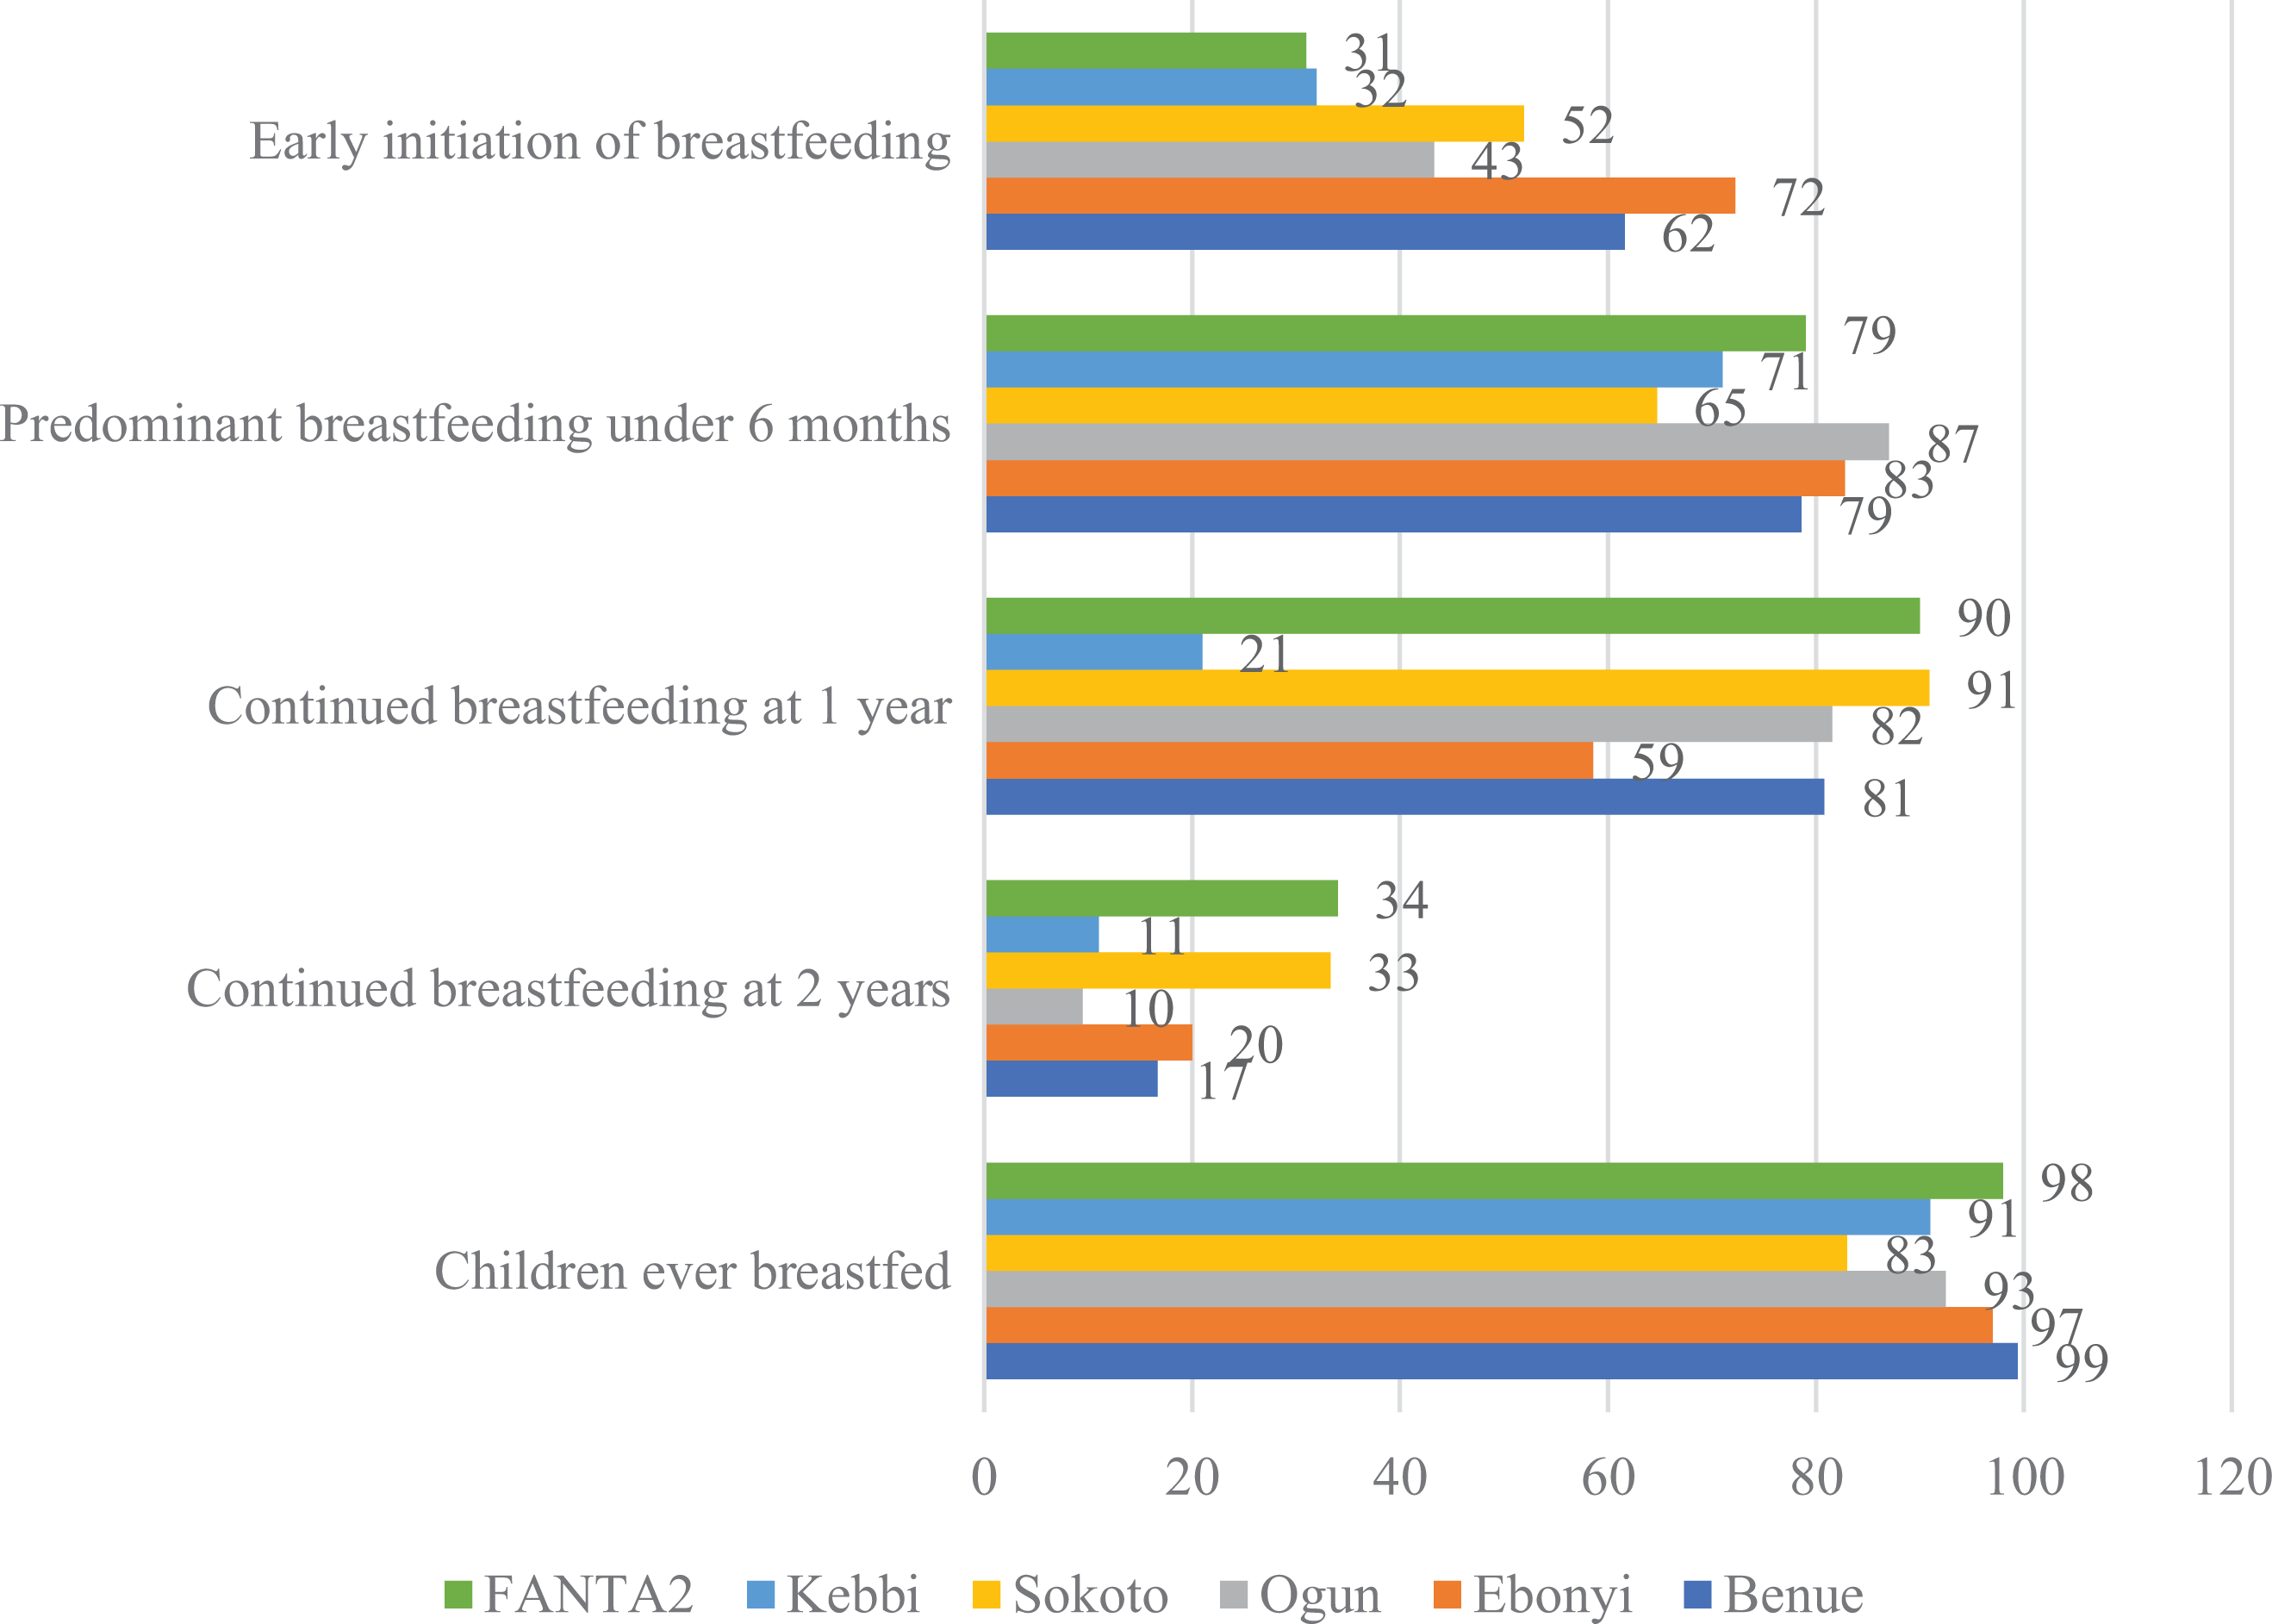
Child breastfeeding practices in Benue, Ebonyi, Kebbi, Ogun, and Sokoto States, Nigeria, compared to FANTA2. Source: Nigeria Zero Hunger Baseline Survey, 2017. 25 FANTA2 indicates Food and Nutrition Technical Assistance II Project.
There is discernible disparity for continued breastfeeding at 2 years, at which point breastfeeding is of doubtful advantage without complementary feed (foods other than breast milk or infant formula). World Health Organization 29 defines complementary feeding as “a process starting when breast milk alone is no longer sufficient to meet the nutritional requirements of infants, and therefore other foods and liquids are needed, along with breast milk.” According to Abeshu et al 30 , the challenges during complementary feeding are context specific, but many are common across settings and are often characterized by poor feeding practices and poor dietary quality of homemade complementary foods. 31,32 Table 7 shows the types of complementary feeds offered to infants in the study area.
Complementary Feeds Offered at Weaning in Benue, Ebonyi, Ogun, Sokoto, and Kebbi States, Nigeria.a,b
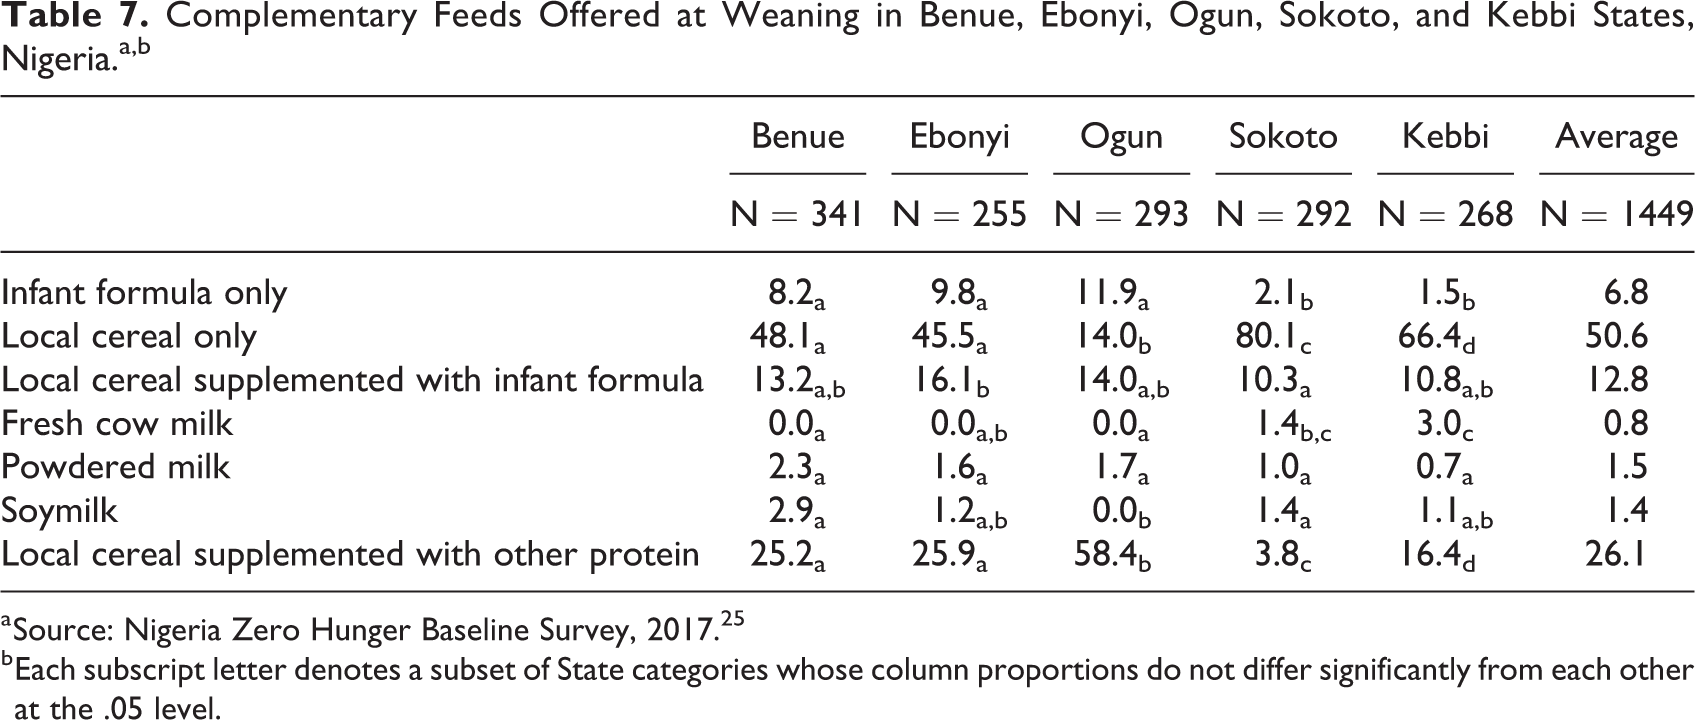
a Source: Nigeria Zero Hunger Baseline Survey, 2017. 25
b Each subscript letter denotes a subset of State categories whose column proportions do not differ significantly from each other at the .05 level.
By far, the most common complementary feed was local cereal (unfortified) which was offered, on average, by 50.6% of nursing mothers to their children. Specifically, 80.1%, 66.4%, 48.1%, 45.5%, and 14.0% of mothers and caregivers in Sokoto, Kebbi, Benue, Ebonyi, and Ogun States offered their infants local cereal (unfortified) as complementary feed. By contrast, for local cereal supplemented with other protein, proportions of mothers and caregivers offering this compared to local cereal only were reversed. For example, only 3.8% of mothers and caregivers in Sokoto offered fortified local cereal compared to 80.1% for unfortified; while in Ogun State, 58.4% of mothers and caregivers offered fortified local cereal compared to 14.0% only for local cereal. Although laboratory analysis of quality of complementary foods was not conducted as part of this survey, an inference can be reached that sharp contrasts exist in the quality of complementary feeding offered to infants in different states which are expected to be reflected in the anthropometry of the children. However, at this level of analysis that excludes the influences of maternal education and maternal health-seeking behavior, it is difficult to infer whether differences in quality of complementary food were as a result of poverty or lack in knowledge concerning dietary quality of complementary feeds and/or other factors.
Empirical Models
The regression analyses derive the parameter estimates for factors affecting child morbidity, mother’s or caregiver’s nutritional and health status, and household well-being and how these factors jointly influence short- and long-term nutritional outcomes. The results are summarized in Table 8. For each model, other parameters of the regression, for example, sum of squares, degree of freedom, mean square, F statistic, level of significance, R square, and standard error of the estimates, are specified.
Summary of Estimated Coefficients of Variables in the Various Models Explaining Nutritional Outcomes in Benue, Ebonyi, Kebbi, Ogun, and Sokoto States, Nigeria.a
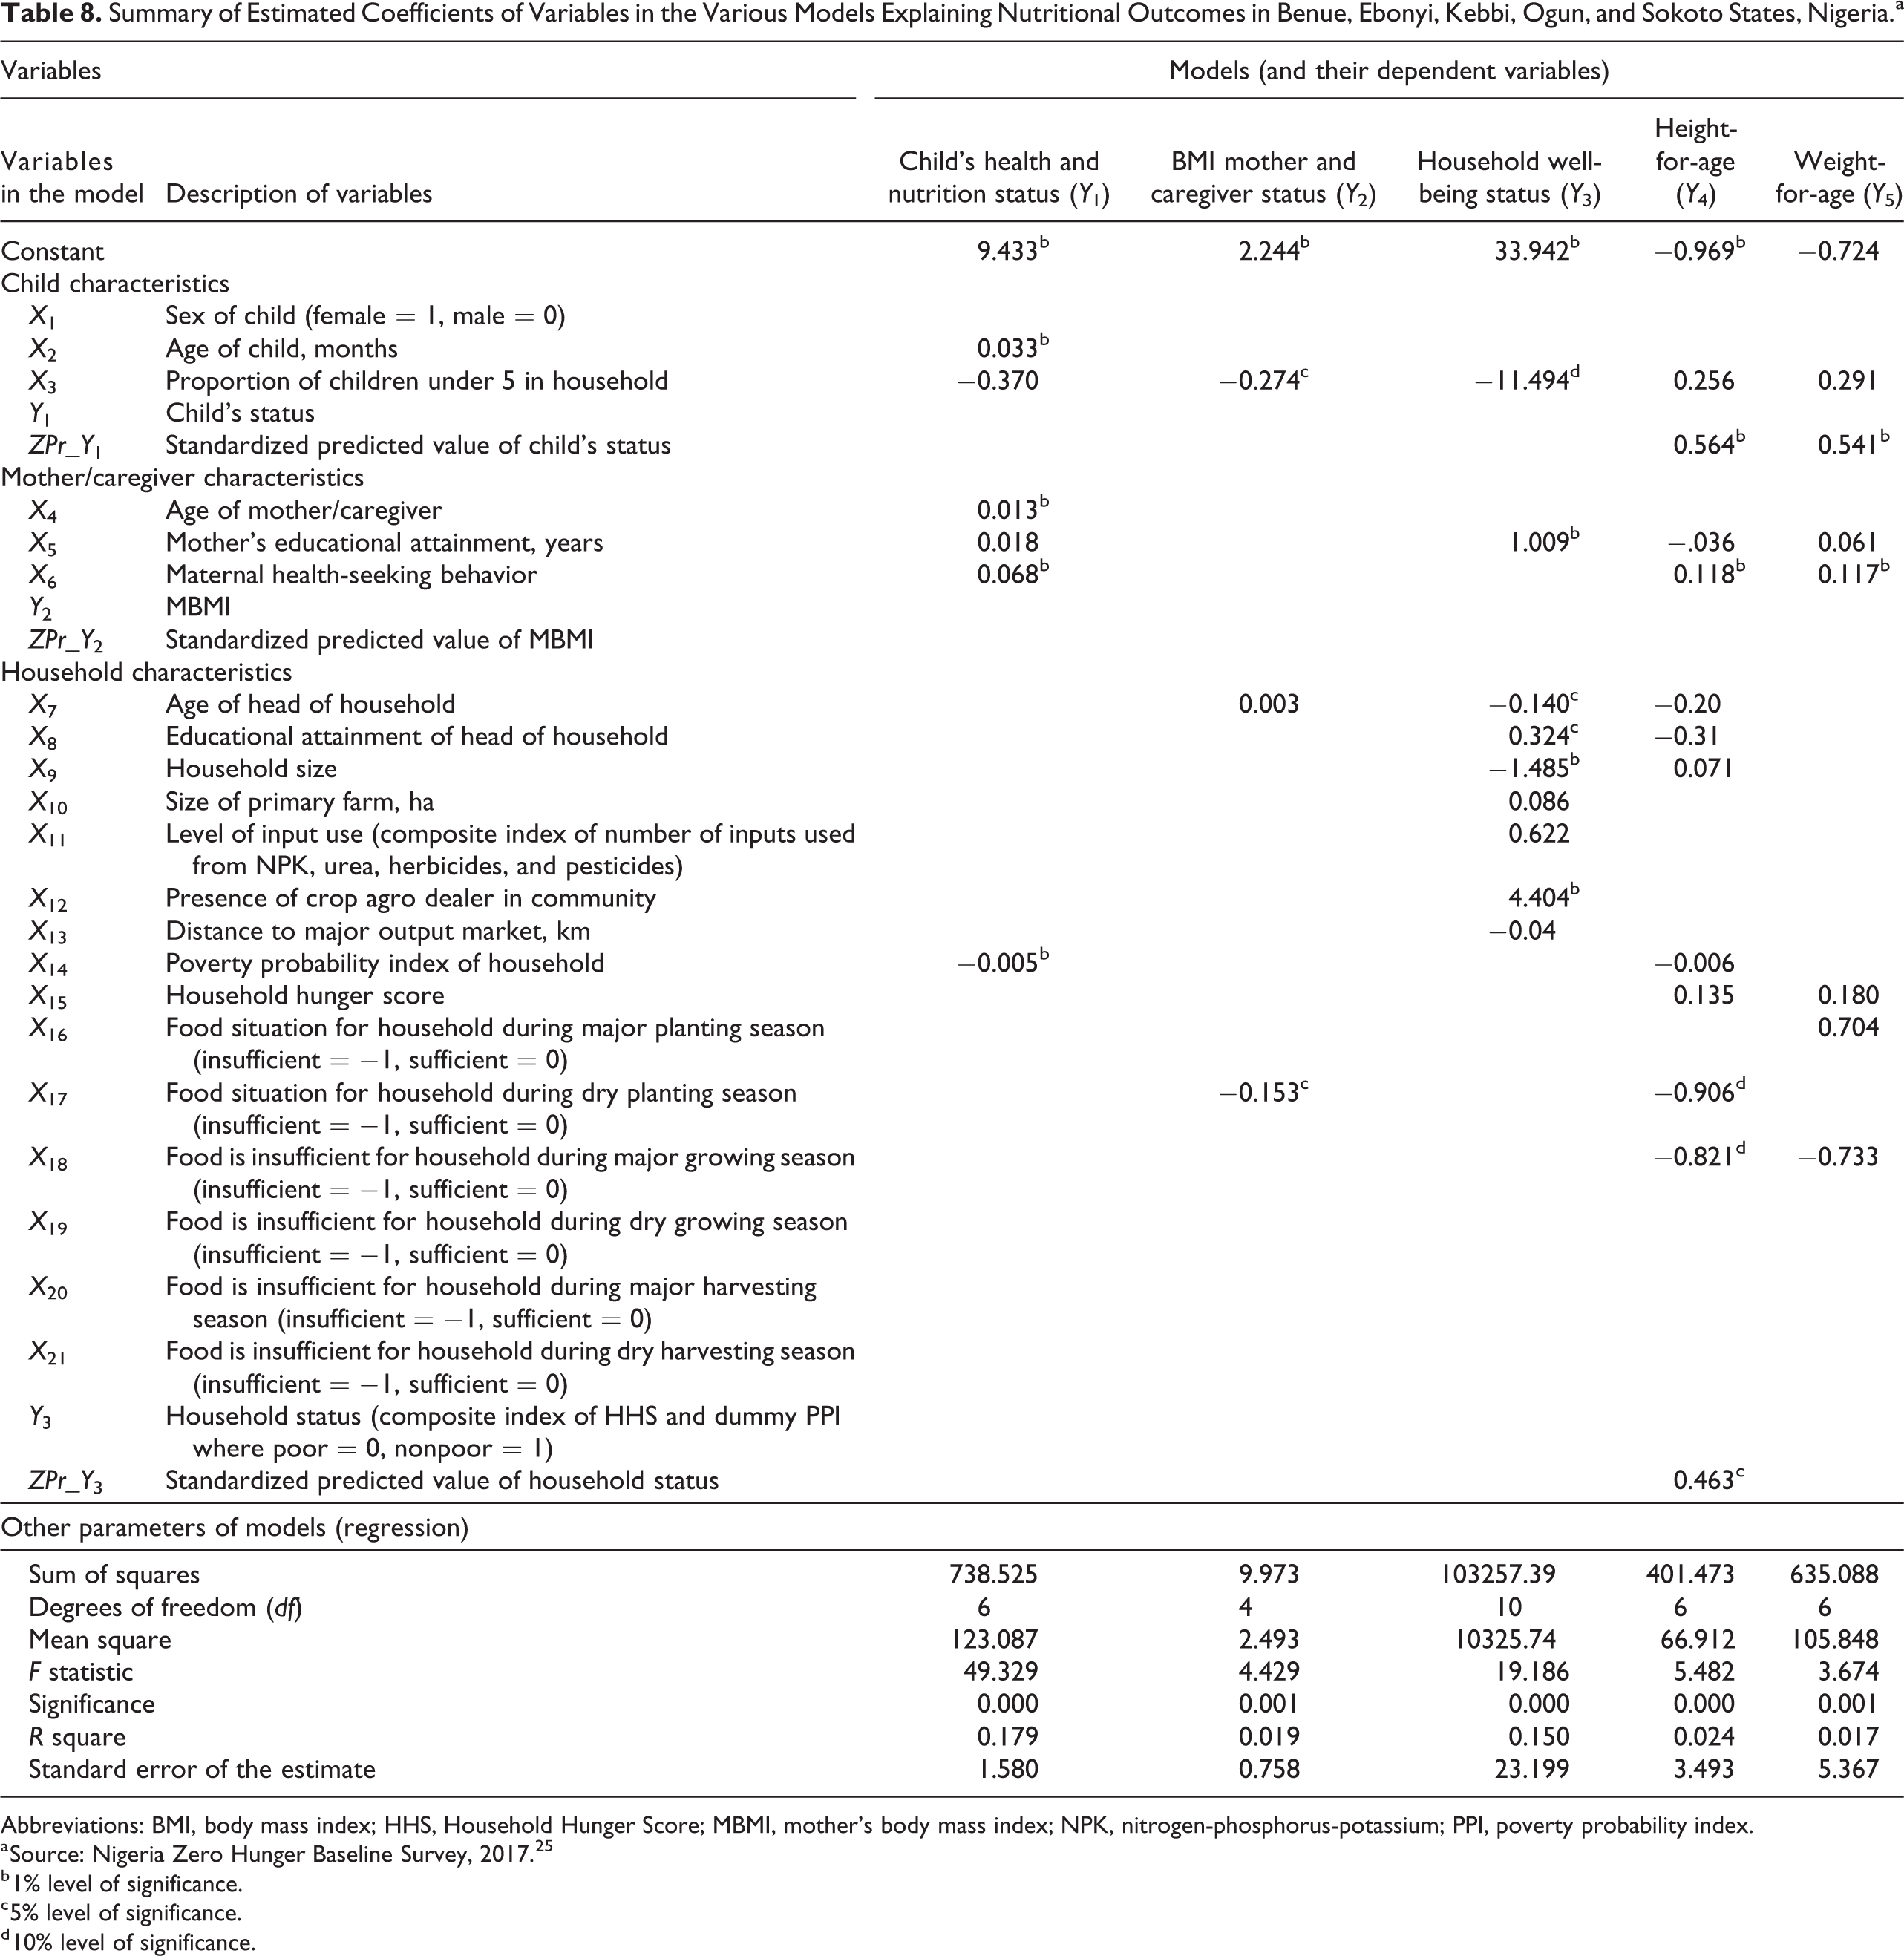
Abbreviations: BMI, body mass index; HHS, Household Hunger Score; MBMI, mother’s body mass index; NPK, nitrogen-phosphorus-potassium; PPI, poverty probability index.
a Source: Nigeria Zero Hunger Baseline Survey, 2017. 25
b 1% level of significance.
c 5% level of significance.
d 10% level of significance.
Child health/morbidity
Based on the composite index which had a range 0 to 10, the minimum scored was 2 while the maximum was 10 with a mean of 8.36 and standard deviation of 1.42. As shown in Figure 4, more than 60% of all surveyed households (average 65.3%) started an immunization program for their infants while about 61.1% completed the programs (the tabulation is available if needed). Each infant is required to get inoculations for diphtheria, tetanus, and whooping cough (DTap); polio (IPV); measles, mumps, and rubella (MMR); chickenpox; influenza (Flu) to complete the immunizations program (https://www.cdc.gov/vaccines/parents/by-age/years-4-6.htm). By state, the completion rate was least in Kebbi State (38.2%) and among poor households (57.1%). Recumbence due to illness was common and highest in Sokoto State (49.7%) and among children of poor households (34.7%) compared to the mean (32.1%). There were significant incidences of diarrhea, cough, and ringworms which could be attributed to poor hygiene and exposure to the elements due to poor housing.
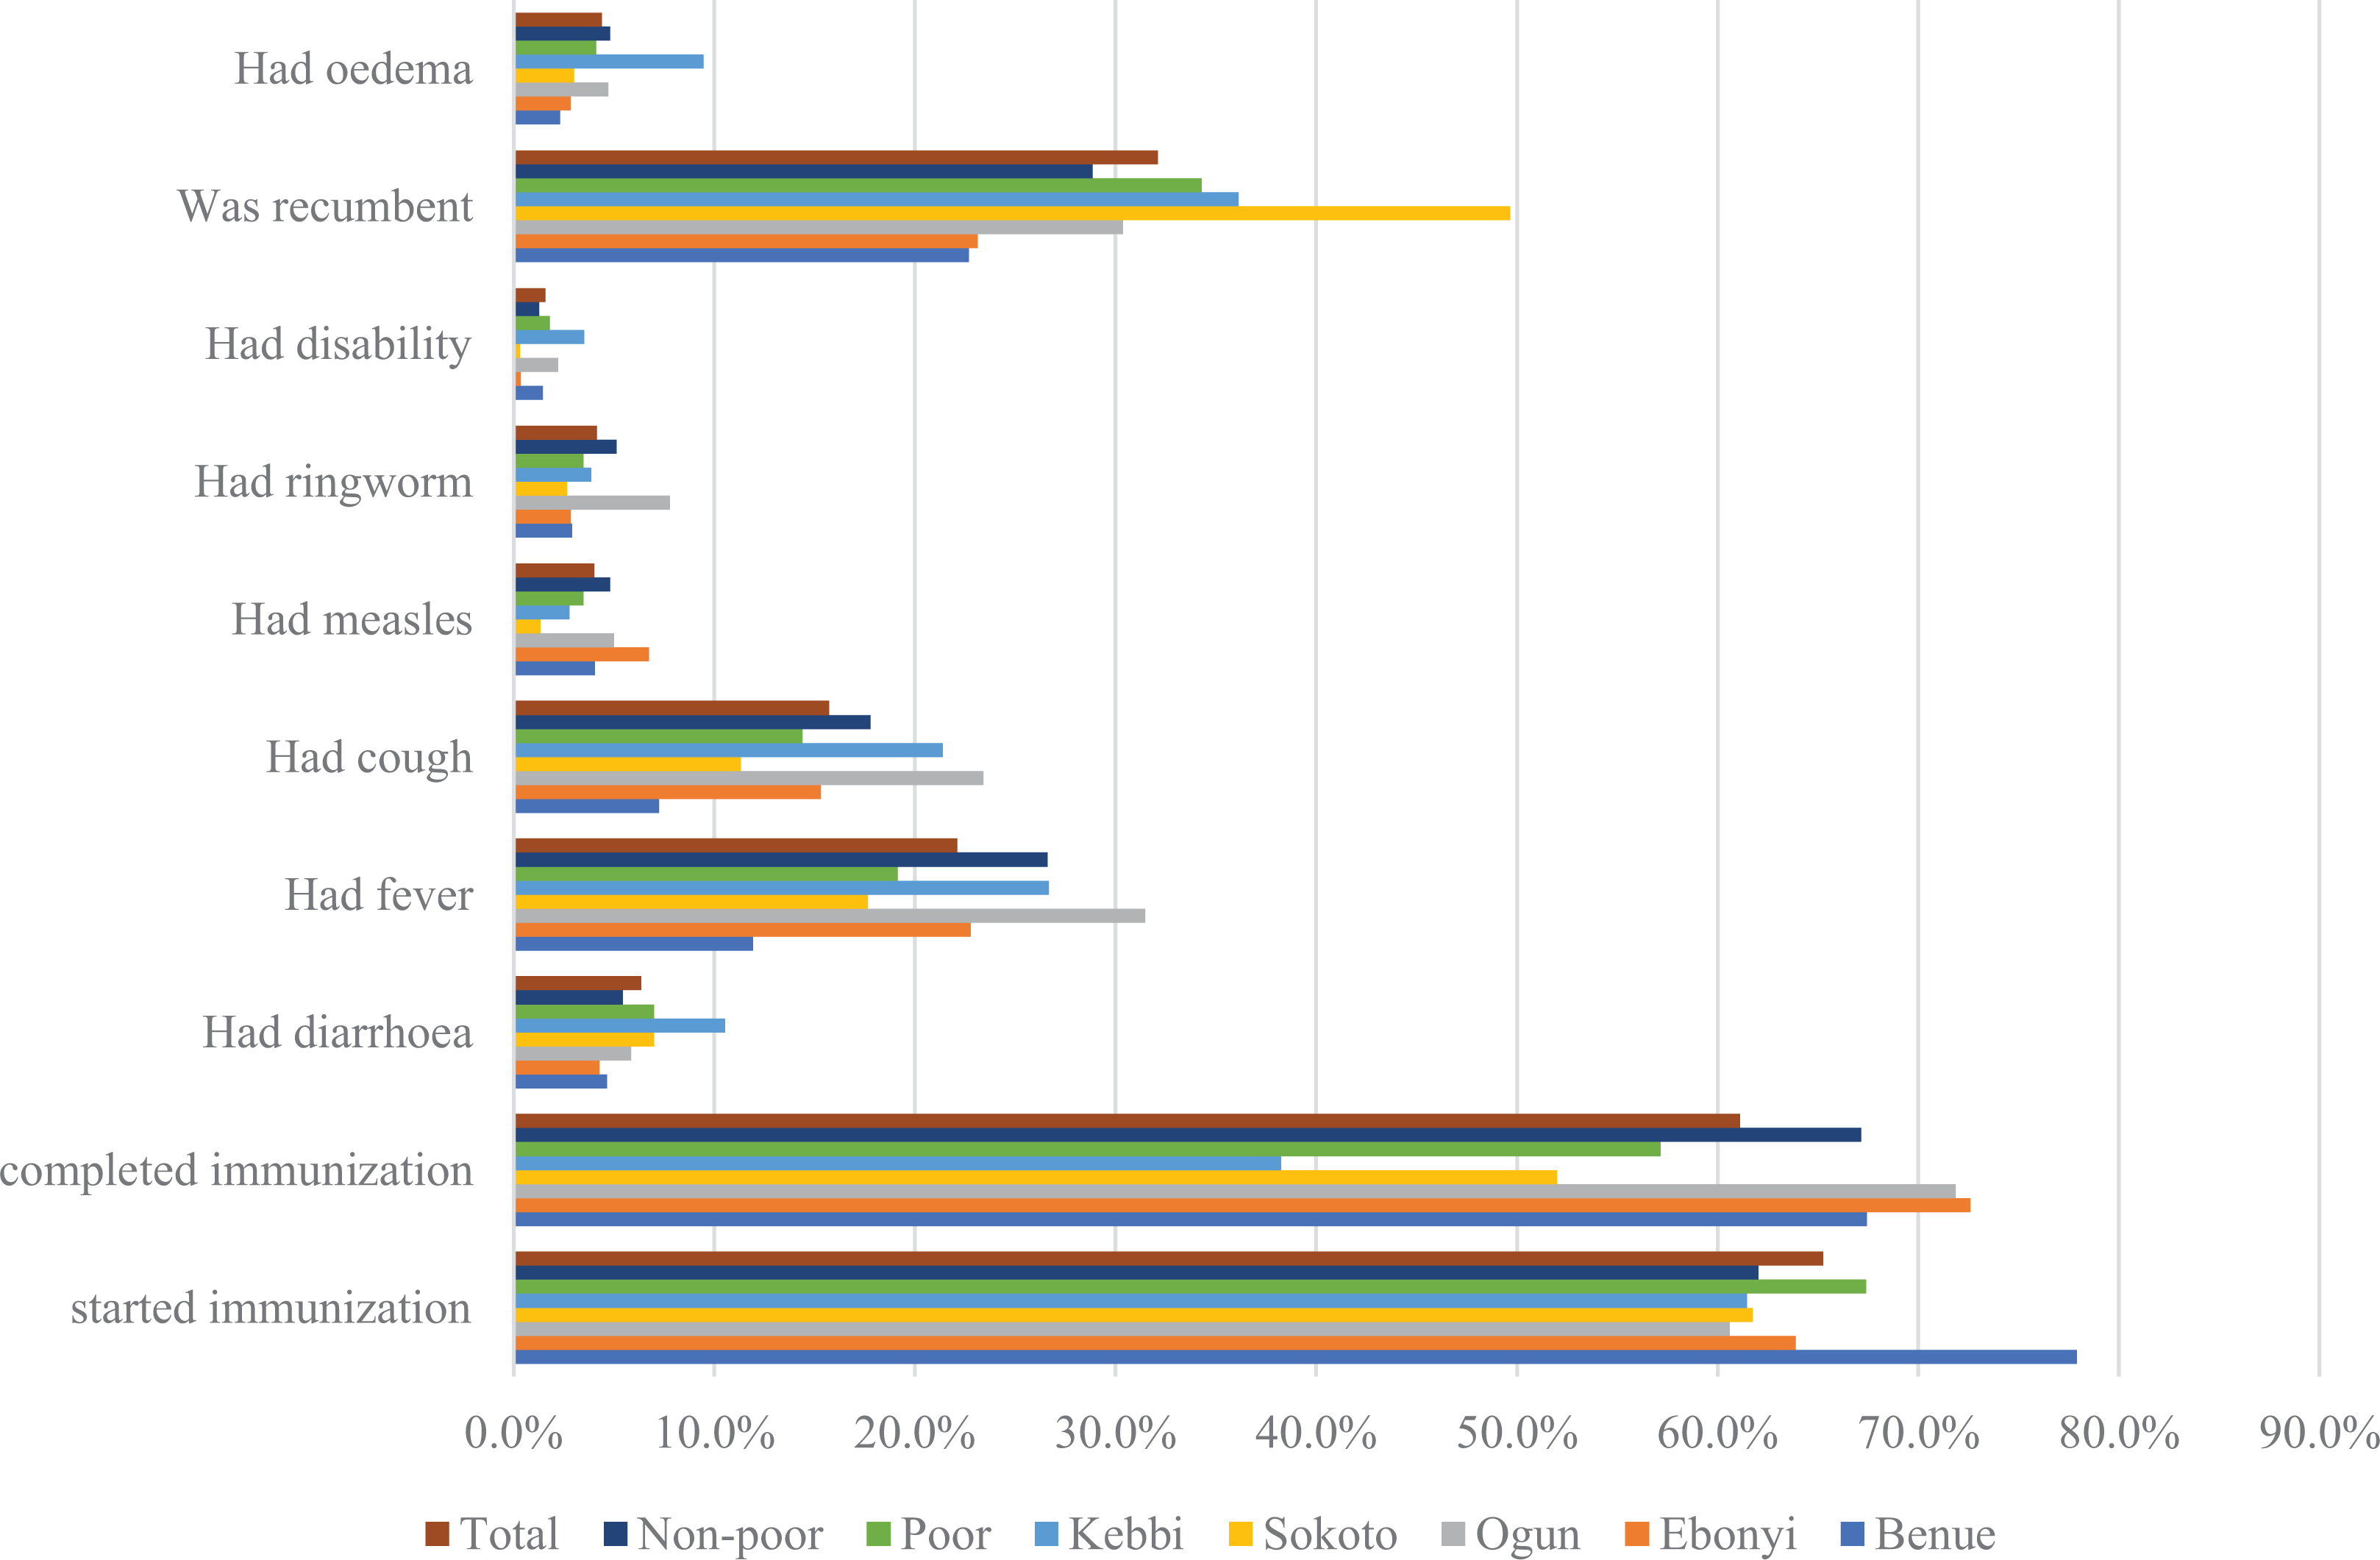
An overview of proportion of child health/care events among poor and nonpoor households and among Benue, Ebonyi, Kebbi, Ogun, and Sokoto States, Nigeria. Source: Nigeria Zero Hunger Baseline Survey, 2017. 25
Edema which is clearly linked to malnutrition was observed to have been affecting 4.4% of all children; worst in Kebbi State at 9.5%.
Child health and nutrition status were shown to be positively affected by the age of the child, age of mother or caregiver, and maternal health-seeking behavior but negatively by the poverty probability index of the household. These factors and their signs are as expected. The descriptive analyses of malnutrition for underweight, overweight, and stunting earlier presented show heightened malnutrition around weaning (year 2) which improved significantly thereafter. The results suggest that this improvement is facilitated when the mother or caregiver is experienced and the lower the household poverty probability index the more favorable the child morbidity outcome. A very important finding is that maternal health-seeking behavior (significant at 1% level) matters more than maternal education (not significant at 10% level) in explaining the observed differences in child morbidity. This finding is in line with that of Uchudi 33 while studying infant and child mortality in Mali’s urban and rural areas and suggests that though maternal education has usually been a key variable in the demographic studies of child mortality, Das Gupta 34 warns that in the majority of settings, the residual variation should not be ignored because it includes the impact of mothers’ health-seeking competence. Thus, Uchudi 33 recommends that it is important that public health education (health awareness) programs be organized as components of public health efforts intended to help mothers understand disease processes and the difference between favorable and unfavorable health practices. The same applies to infant and young childcare and nutrition practices.
Body mass index mother’s status
Mother’s or caregiver’s status was measured by BMI (note 1) which had an overall mean of 25.53 (standard deviation 27.42). Mean BMI was significantly lower among mothers from poor households 24.92 (standard deviation 28.58) compared to those from nonpoor households 26.44 (standard deviation 26.62). Although these weight differences may be interpreted culturally (loosely) as showing better living among mothers from nonpoor households, it is actually a sign of a tendency toward malnutrition among mothers from nonpoor households manifesting in overweight. The central tendency for mothers from poor households was to remain within the normal weight range. An analysis by BMI class showed 10.6% overweight, 63.9% normal weight, and 25.5% overweight among whom 9.1% were obese.
Table 8 shows that mothers’ BMI was negatively affected by the proportion of children U5 relative to household size and the food sufficiency situation for the household during the dry planting season. The results are expected and pinpoint the sources of concern and/or burden to mothers among which childcare is arguably primary, as well as highlights the need for food adequacy in households at all times. Recall from Table 3 that households were found to be most food insecure during planting and growing seasons (also known as hunger periods). There is an initiative “National Campaign on Right to Food in Nigeria,” with the objective to introduce policy and practice change in the general perception of food, from food as a mere human need to food as a fundamental human right; in which regime the right to food is “inalienable, undeniable, actionable, justiciable and ultimately remediable” by law. 35 This campaign has been instrumental to sponsoring a legislative Bill at the National Assembly since in 2010 to amend the federal constitution in certain sections to consciously incorporate the right to food into public agricultural policy and promote policy action in that direction. Programs to improve nutrition need to incorporate this concept and promote its related policy actions. 36
Household well-being status
The average score was 1.84 (standard deviation = 0.94), where 45.5% scored 1 (ie, belonged to poor households suffering severe hunger), 31.7% scored 2 (ie, poor households suffering moderate hunger or nonpoor households suffering severe hunger, which is less likely), 15.6% scored 3 (ie, nonpoor households suffering moderate hunger or poor households suffering little or no hunger which is less likely), and finally 7.3% scored 4 for nonpoor households suffering little or no hunger. The modal class of households for Benue (54%), Ebonyi (36.7%), Sokoto (73.0%), and Kebbi (62.8%) scored 1 and, therefore, belonged to poor households suffering severe hunger. The modal class for Ogun (47.6%) scored 2 and could be rated as better off than the rest of the other surveyed states. These results show clearly that poverty and hunger were pervasive in the study area and reinforce the findings of Barrett and Lentz 4 and Headey 5 that poverty and hunger are closely correlated.
Table 8 shows that household status was influenced positively by the presence of a crop agrodealer in their community, the educational attainment of household head, and the educational attainment of mother/caregiver while the proportion of children U5 in the household, age of household head, and household size affected household status negatively. The study communities are mostly agrarian and the use of external inputs is expected to boost production and improve household food availability as well as create marketable surplus. The positive influence of the presence of crop agrodealer in the communities is, therefore, expected as low use of external agroinputs is one of the major banes of agriculture in West Africa. 26 Educational attainment especially for mothers has usually been a key variable in the demographic studies. 37,38 The amount of formal schooling received by a mother is assumed to affect household well-being by increasing her intellectual capacities and bargaining skills and by giving her a greater sense of authority and self-confidence, allowing her to assert her views in the household and in the community. Educated mothers tend to have a better understanding of disease and child health management processes and to seek medical attention on time and/or a regular basis. Uchudi 33 infers that formal schooling heightens a mother’s ability to make use of government and private health care resources, and it may also provide her with the decision-making autonomy necessary to advocate for her child in the household and in the outside world. On the other hand, it is expected that in a precarious situation of food insufficiency in the household modified by poverty, there will be extra pressure resulting from large household size worsened in situations where the proportion needing extra attention is high.
Child Anthropometry
The survey revealed significant prevalence of both acute (short-term exposure) and chronic (long-term exposure) malnutrition reflected by underweight, moderately overweight, and obese on the one hand and stunted children on the other hand as measured by WAZ (note 2) and HAZ (note 3).
Weight-for-age z-score
Incidences of underweight and overweight coexisted at general prevalence rates of 19.7% and 9.5%, respectively. This is a cause for serious concern as it shows the presence of malnutrition in all its forms. By state, underweight was most serious and with equal statistical significance in Sokoto and Kebbi States affecting 24.0% and 22.8% of U5 out of which 17.7% and 14.4% were moderately underweight while 6.3% and 8.4%, respectively, were severely underweight (Table 9).
Prevalence (%) of Underweight in Children Under 5 Years of Age in Benue, Ebonyi, Kebbi, Ogun, and Sokoto States, Nigeria.a,b
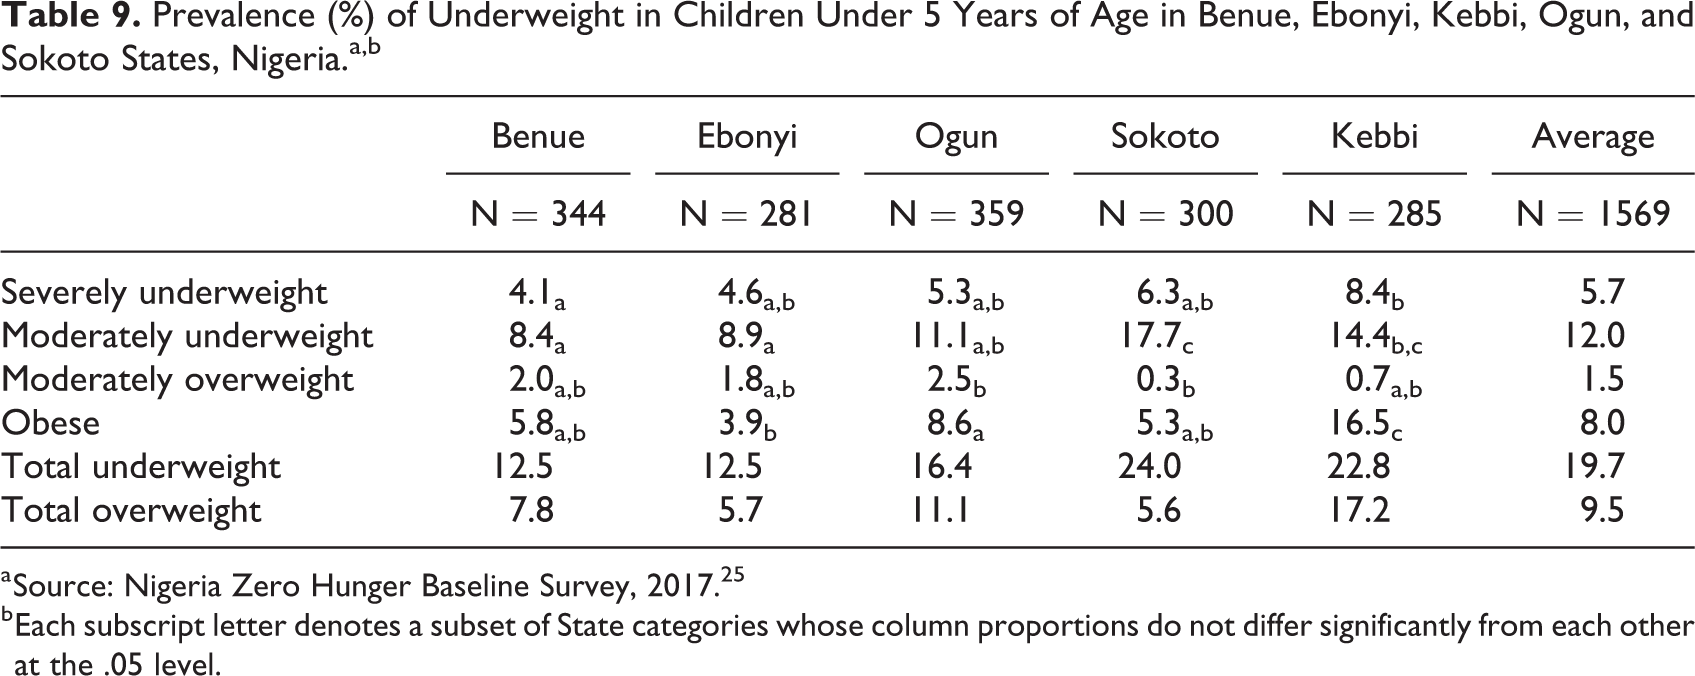
a Source: Nigeria Zero Hunger Baseline Survey, 2017. 25
b Each subscript letter denotes a subset of State categories whose column proportions do not differ significantly from each other at the .05 level.
Obesity rates in U5 were alarming at 8.0% overall with Kebbi leading at 16.5% of its U5 obese. Recall that the least proportion of mothers and caregivers in Sokoto and Kebbi States fed local cereal supplemented with infant formula and/or other protein to their infants (see Table 7). On the other hand, significantly higher proportions of mothers and caregivers in Benue, Ebonyi, and Ogun States fed local cereal supplemented with infant formula and/or other protein to their infants to the effect that underweight incidences (combining moderate and severe) were significantly lower—12.5%, 12.5%, and 16.4%, respectively. This is evidence, all other things being equal, that meals from unfortified local cereal fail to meet dietary quality for complementary feed as they could lead to or exacerbate malnutrition.
When examined by sex, age in years, and wealth class of household (poor vs nonpoor), we found that the differences between female and male children were insignificant, the second year of infancy was when malnutrition results were worst for both underweight and overweight, and that a significantly higher proportion of the severely underweight children (6.8%) were from poor households compared to 4.0% similar affected children from nonpoor households (Table 10). These results continue to confirm the complexity and related nature of factors affecting the nutritional statuses of U5.
Prevalence of Underweight in Children Under 5 Years of Age Among Male and Female Children in Benue, Ebonyi, Kebbi, Ogun, and Sokoto States, Nigeria.a,b
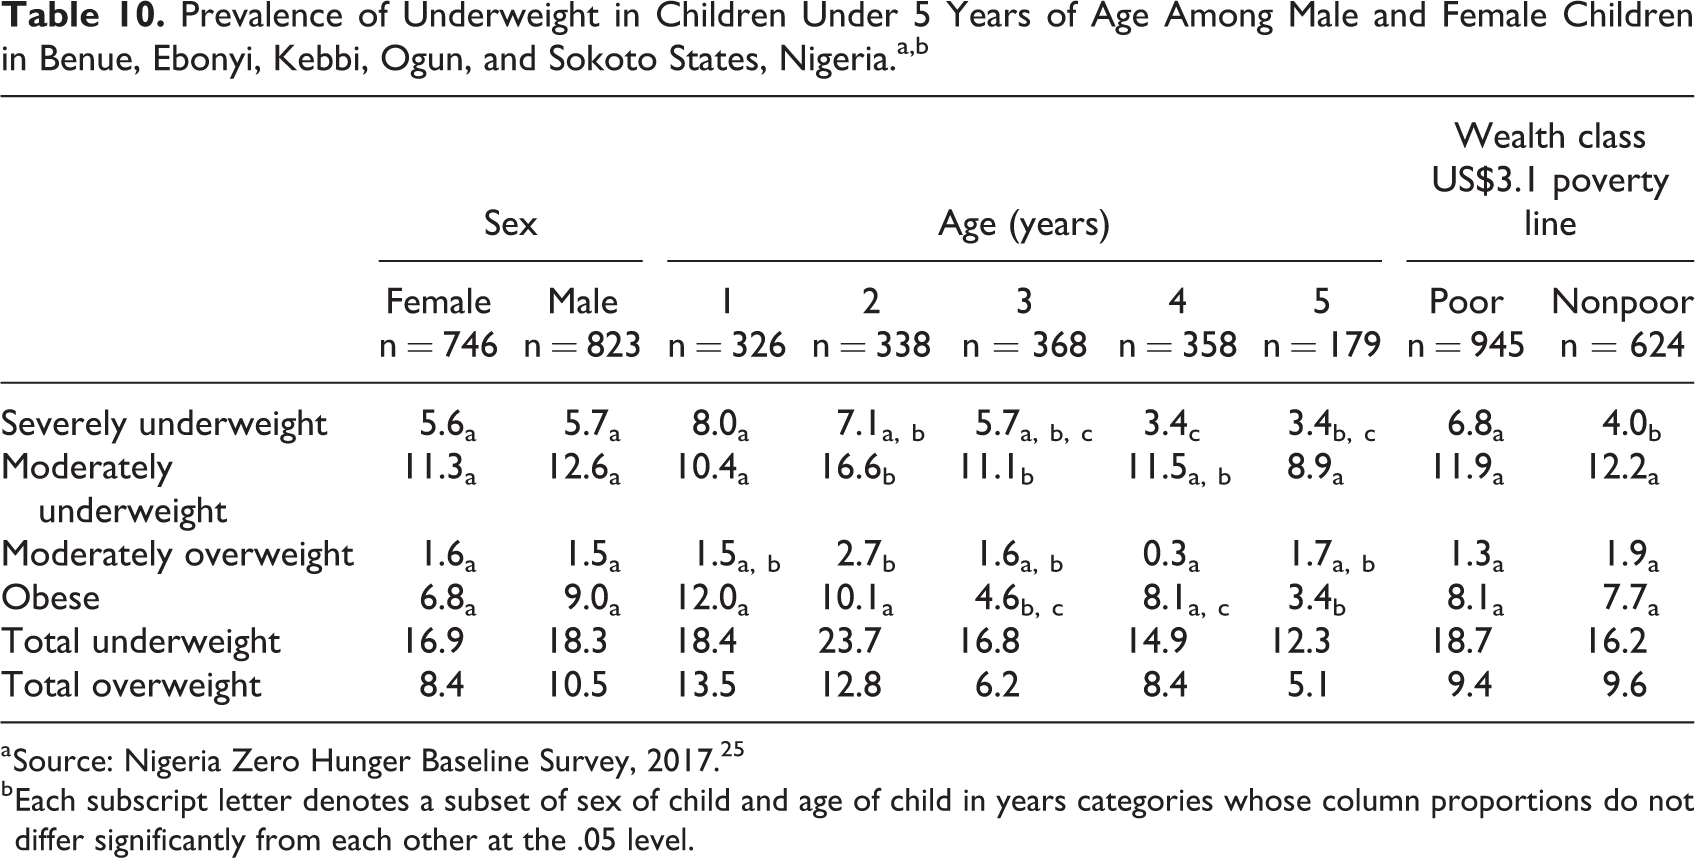
a Source: Nigeria Zero Hunger Baseline Survey, 2017. 25
b Each subscript letter denotes a subset of sex of child and age of child in years categories whose column proportions do not differ significantly from each other at the .05 level.
The empirical analysis shows that WAZ was positively influenced by child’s status instrumented by its standardized predicted value obtained during the first stage of the regressions. It was also affected by maternal health-seeking behavior already discussed as an important factor in household well-being and especially child morbidity.
Height-for-age z-score
Stunting is a reflection of medium- to long-term malnutrition.
By state, the average proportion of stunted children ranged from 28.5% in Ebonyi to 33.9% in Kebbi State (Table 11). For moderate stunting, which ranged from 13.1% in Benue to 16.0% in Sokoto, the differences were not significant. However, for severe stunting, the proportion of affected U5 in Kebbi (28.1%) was significantly higher than the rest. The results of the analysis by sex, age, and wealth class followed a similar pattern as for underweight incidences where there were no differences due to sex, the worst cases were in the second year of infancy and majority of severely stunted children were from poor households (Table 12).
Prevalence of Stunting in Children Under 5 Years of Age in Benue, Ebonyi, Kebbi, Ogun, and Sokoto States, Nigeria.a,b
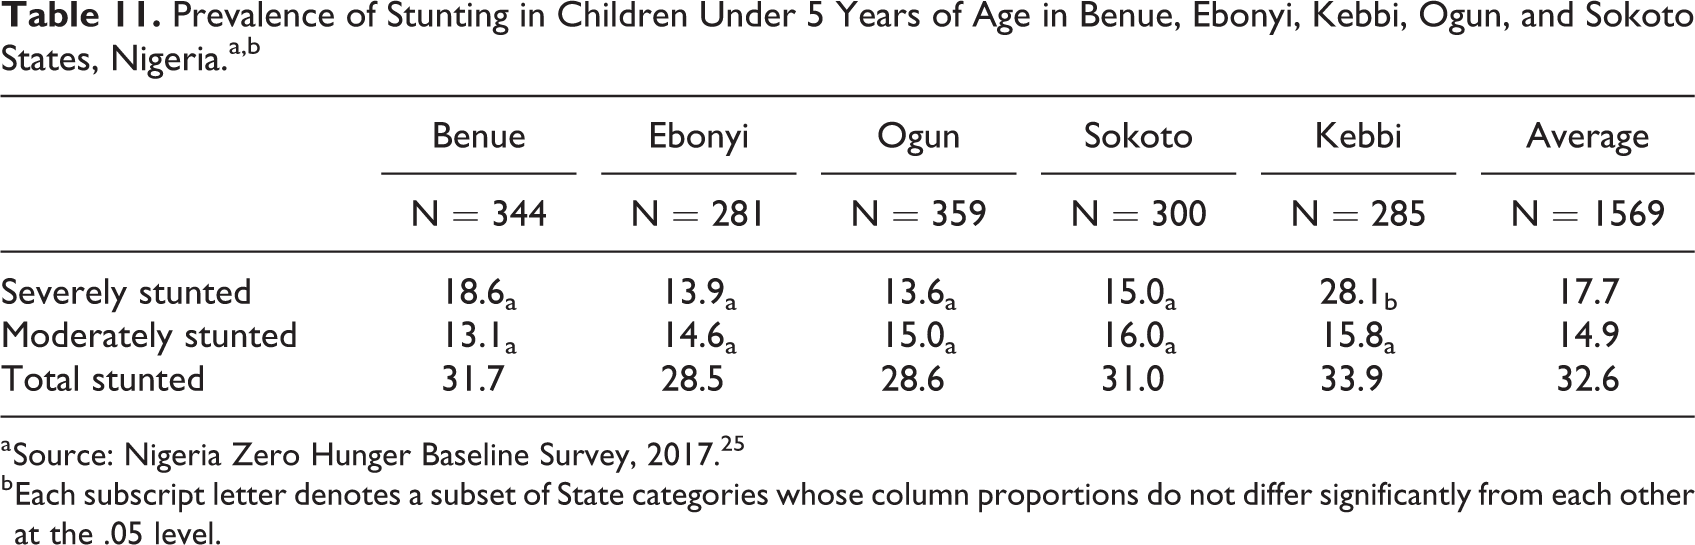
a Source: Nigeria Zero Hunger Baseline Survey, 2017. 25
b Each subscript letter denotes a subset of State categories whose column proportions do not differ significantly from each other at the .05 level.
Prevalence of Stunting in Children Under 5 Years of Age Among Male and Female Children in Benue, Ebonyi, Kebbi, Ogun, and Sokoto States, Nigeria.a,b
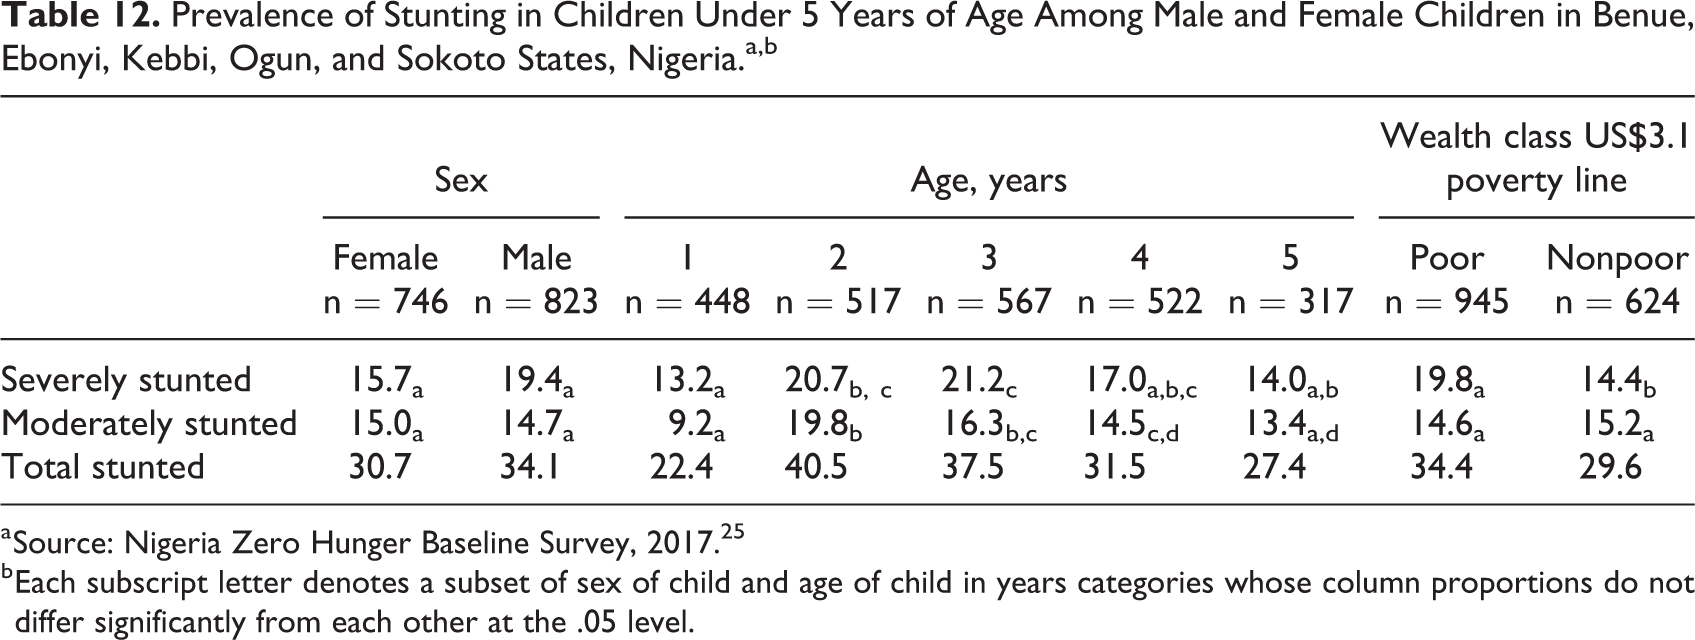
a Source: Nigeria Zero Hunger Baseline Survey, 2017. 25
b Each subscript letter denotes a subset of sex of child and age of child in years categories whose column proportions do not differ significantly from each other at the .05 level.
The emerging scenario from the malnutrition analysis, taking together the incidences of underweight and stunting, is one in which child feeding after weaning which occurs at about the mean age of 17.5 months (standard deviation = 5.7) suffers inadequacy of quality nutrients in complementary feed until children make a transition to adult rations. Complementary feeding, therefore, emerges as one of the points for attention in designing programs to improve infant and young child nutrition.
The empirical analysis for HAZ produced similar results as for WAZ and was positively influenced by child’s wellness status instrumented by its standardized predicted value obtained during the first stage of the regressions. It was also affected by maternal health-seeking behavior already discussed as an important factor in household well-being and especially child morbidity. In addition, the food sufficiency situation in the household during the dry planting and the major growing seasons was significant with negative signs indicating that in the medium to long terms, food availability at all times and especially during the hunger periods is a necessary condition to meet in implementing programs to improve nutrition.
Conclusions
Nigeria’s situations regarding hunger, poverty, and malnutrition among school-age children were dire. About 28% of the households suffered moderate to severe hunger due to food shortage while poverty was pervasive and inequalities existed among states. A composite index of poverty probability index class and household hunger category produced further disturbing results—showing that about 45.5% belonged to poor households suffering severe hunger. This index showed how hunger and poverty potentiate each other and, therefore, why a fight against one must be complemented with a fight against the other, to be successful. Infant and young child feeding practices in terms of early initiation of breastfeeding, children ever breastfed, and predominant breastfeeding at 1 year appeared to proceed well till the second year of infancy when complementary feeding is required. The complementary food offered were from a narrow range of choices of doubtful dietary quality and more worryingly with state level data showing sharp contrast among states on matters of improving complementary food through fortification with some states falling far behind. Apparently, states that performed poorly for complementary feed fortification also were poor in child immunization. All forms of malnutrition coexisted in the 5 states. There was no significant difference among the children due to sex, although malnutrition results were worse during the second of the 5 years of infancy mainly due to poor complementary feeding which was worse in poor households and those with lower health-seeking behavior and educational status of mothers and caregivers. All levels of analyses implicate poverty, household hunger, and childcare especially postweaning in malnutrition of children U5 in the surveyed states.
Countries with a successful resolution of undernutrition have been reported in literature such as Brazil, Ethiopia, and Bangladesh. For example, Brazil saw its prevalence of child stunting decline from 37% in 1974 to 1975 to 7% in 2006 to 2007. It achieved these gains through a sustained commitment to expand access to maternal and child health services (reaching into previously underserved geographical regions). This was coupled with large scale investment in social reform and safety net programs that supported a narrowing of the income gap (through equitable poverty reduction), rising numbers of girls in school, declining fertility, and greater stability in income flows, and food consumption among the poor. Stable food consumption was achieved through food supplementation targeted at mothers and children and with cash transfers targeted at the poorest groups. All of this was helped by improved stability of governance. Few of these actions focused explicitly on nutrition, but many were driven by a policy agenda called “Zero Hunger.” Nigeria has done well to recognize the problems of hunger, poverty, and malnutrition—for which evidence is growing—and taken the first good steps including committing to the achieving the 2030 Agenda for Sustainable Development (also known as SDGs), particularly the SDG Number 2—the Zero Hunger goal for which serious action has been long overdue. Now, policy action must be designed, given top priority, be adequately funded, and implemented to reduce malnutrition in all its forms.
Footnotes
Appendix A
Authors’ Note
Please note well that IITA operates an open access policy in support of the same policy of the CGIAR regarding data, samples, and other research materials.
Acknowledgments
This activities and surveys leading to this article benefited from contributions from several individuals, institutions, and State Governments of the 4 pilot states without which it would not have been possible to produce this final document. The design of the baseline survey was led by International Institute of Tropical Agriculture (IITA) experts in collaboration with representatives from the World Food Program, the African Development Bank, the Federal Ministry of Health, the Nigeria Zero Hunger Strategic Review (NZH) Secretariat, and State Governments. The Governments of Benue, Ebonyi, Kebbi, Ogun, and Sokoto States supported fieldwork in the form of transport, accommodation, security, and in some cases cash awards to enumerators. UN International Children’s Emergency Fund co-ordinated with the National Bureau of Statistics (NBS) to provide all the anthropometric equipment needed. In addition, the NBS facilitated training on the use of the equipment, assisted in the design of the sampling scheme, and conducted field monitoring exercises during the surveys. We thank all the enumerators and their supervisors who were involved in data collection and all the respondents who patiently provided answers to the survey questions. IITA houses the Secretariat of NZH and the Institute’s management provided all the required support for the successful completion of the baseline survey.
Declaration of Conflicting Interests
The author(s) declared no potential conflicts of interest with respect to the research, authorship, and/or publication of this article.
Funding
The author(s) received no financial support for the research, authorship, and/or publication of this article.