
Abstract
Background:
Healthy diets promote optimal growth and development and prevent malnutrition in all its forms, including undernutrition, obesity, and diet-related noncommunicable diseases (NCDs).
Objective:
This background paper for the International Expert Consultation on Sustainable Healthy Diets characterizes healthy diets and their implications for food system sustainability.
Methods:
Three complementary approaches to defining healthy diets are compared: World Health Organization (WHO) guidelines or recommendations developed between 1996 and 2019; 2017 Global Burden of Disease (GBD) risk factor study estimates of diet-related risk–outcome associations; and analyses associating indices of whole dietary patterns with health outcomes in population studies and clinical trials.
Results:
World Health Organization dietary recommendations are global reference points for preventing undernutrition and reducing NCD risks; they emphasize increasing intakes of fruits, vegetables (excepting starchy root vegetables), legumes, nuts, and whole grains; limiting energy intake from free sugars and total fats; consuming unsaturated rather than saturated or trans fats; and limiting salt intake. Global Burden of Disease findings align well with WHO recommendations but include some additional risk factors such as high consumption of processed meat; this approach quantifies contributions of diet-related risks to the NCD burden. Evidence on whole dietary patterns supports WHO and GBD findings and raises concerns about potential adverse health effects of foods with high levels of industrial processing.
Conclusions:
Implied shifts toward plant foods and away from animal foods (excepting fish and seafood), and for changes in food production systems have direct relevance to the sustainability agenda.
Highlights
Global evidence about elements of healthy diets—calling for a shift away from many animal foods and toward plant foods, and significant changes in food production systems—has direct relevance to the sustainability agenda.
Introduction
Viewed from the perspective of human health and well-being, a globally relevant definition of a healthy diet is one that promotes optimal human growth and development and prevents malnutrition in all its forms. Malnutrition has serious and lasting economic, social and clinical impacts on the health of individuals and families, and at community and national levels. The World Health Organization (WHO) definition of malnutrition includes 3 categories: undernutrition (eg, wasting or stunting), micronutrient deficiencies (inadequate vitamins or minerals), and obesity and diet-related noncommunicable diseases (NCDs; eg, heart disease, stroke, diabetes, and certain cancers; note 1). 1 A high prevalence of undernutrition is still a major public health problem in some low- and middle-income countries (LMICs), where it may be seen in its more severe forms. In contrast, many middle- and high-income countries are primarily concerned with NCDs, taking dietary adequacy for granted except among the most economically disadvantaged populations. Noncommunicable diseases are now a major cause of disability and death in all countries. World Health Organization data for 2016 indicate that more than three-quarters of NCD deaths—31.5 million—occurred in LMICs, with nearly half (46%) of these occurring before age 70 years. 2 A large proportion (around 45%) of deaths among children aged younger than 5 years are linked to undernutrition, occurring primarily in LMICs, while rates of childhood overweight or obesity are rising in these same countries. Globally, 38 million children younger than 5 years of age are overweight. For adults, WHO estimates that 1.9 billion are overweight or have obesity, while 462 million are underweight.
These different types of malnutrition must be considered as an integrated set of concerns affecting populations globally, because they may coexist within the same countries, communities or families, or even within individuals. 1 What is needed for normal human physiological functioning is generally well-established (note 2), and undernutrition can be prevented if these needs are met. For obesity and diet-related NCDs, the basis for dietary recommendations may relate to nutrients or constituents within foods or may be associated with specific foods or food categories or dietary patterns depending on how dietary intake has been measured in epidemiologic studies or randomized controlled trials (RCTs) with NCD-related outcomes. 3 Noncommunicable diseases have multiple causes, not all of which are diet-related; thus, diet-related interventions will only partly mitigate the risk of NCDs. Furthermore, whereas a nutritional deficiency has relatively similar effects for everyone, the risk of developing NCDs varies among individuals. Hence, the NCD-oriented recommendations are less certain; also, they are more likely to change over time in response to changes in population dynamics and in dietary and disease patterns and their relationships.
This article describes various approaches to defining healthy diets that explicitly or implicitly consider adequacy and that may also address NCD risk reduction. Definitions of nutrient and dietary requirements to prevent undernutrition have a long history, but some nutrient-dense foods, when eaten in excess, can increase NCD risk. For such foods, dietary recommendations must encourage “enough, but not too much.” For example, red meat may be an important source of iron in some dietary patterns, but recommendations to reduce NCD risk may discourage high consumption of processed meat or high levels of red meat in any form. For application to populations experiencing the double burden of undernutrition and NCDs, considerations of adequacy and NCD risk are integrated, such that any healthy diet recommendations or interventions address both concurrently, rather than addressing undernutrition and then considering NCD risk.
The text that follows first provides background on current WHO recommendations for a healthy diet and ongoing efforts to update these recommendations based on extensive and rigorous systematic reviews of epidemiologic studies and RCTs. The next section presents key findings from empirically derived epidemiological data to quantify the global burden of disease (GBD) from unhealthy diets, from the 2017 update of the GBD study. 4 The third section addresses the conceptual challenges and methods for characterizing healthy diets of populations in terms of whole dietary patterns (ie, overall dietary quality observed, rather than constructed or aggregated from separate dietary constituents), and assesses the evidence to support recommendations on dietary patterns related to certain sustainability considerations as well as health outcomes. Finally, the conclusions section highlights the main elements of consensus on healthy diets and potential implications for developing principles for sustainable diets.
World Health Organization Recommendations on Healthy Diet and Nutrition
Developing definitions of healthy, sustainable diets is a strategic priority for WHO’s work in relation to nutrition. 5 Between 1996 and 2019, WHO developed (note 3) or updated more than 50 nutrition guidelines or recommendations, some of which concern population intakes of particular nutrients.
The development of dietary guidance is challenging, owing to the limitations of scientific research on the links between diet and health. Evidence can vary tremendously in quality. The strongest evidence comes from systematic reviews of well-conducted RCTs, which assess the direct impact of a dietary change. Evidence from nonrandomized trials, cohort studies, case–control studies, and cross-sectional studies is weaker, and observational studies (eg, cohort studies) can only provide indication of an association. Methodological challenges associated with dietary studies include intake data collection and food composition databases. Also, people eat foods (rather than individual nutrients), and diets are made up of many separate, interdependent components. These challenges make it difficult to attribute risk to specific components of diets and to set nutrient-specific guidance.
Systematic reviews required for developing and updating WHO guidelines and recommendations use the Grading of Recommendations Assessment, Development and Evaluation methodology for assessing the quality and certainty of evidence. The outcomes of these systematic reviews are further assessed by the WHO Nutrition Guidance Expert Advisory Group (NUGAG), to formulate recommendations for WHO nutrition and diet-related guidelines. This methodology provides a structured framework for assessing the quality and certainty of evidence, while ensuring that processes and judgments are transparent. 6 World Health Organization’s current guidance on healthy diet is based on guidelines on specific nutrient intakes, 7 -10 expert consultation reports, 11 -14 and previous reports on diet and disease. 15,16
Infant and Young Child Feeding
World Health Organization’s guidance on a healthy diet for infants and children is similar to that for adults but also focuses on the following important elements: infants should be breastfed exclusively during the first 6 months of life; infants should be breastfed continuously until 2 years of age and beyond; from 6 months of age, breast milk should be complemented with a variety of adequate, safe, and nutrient-dense foods; salt and sugars should not be added to these complementary foods.
More detailed guidance on complementary feeding is set out as guiding principles for feeding breastfed children 17 and nonbreastfed children aged 6 to 24 months. 18 Furthermore, WHO is currently in the process of developing a guideline on complementary feeding through its guideline development process.
Vitamins and Minerals
For micronutrients, recommended nutrient intakes to meet the nutrient requirements of almost all apparently healthy individuals have been defined for water-soluble and fat-soluble vitamins and minerals, for age- and sex-specific groups. 13 Recommendations for water-soluble vitamins address B vitamins (folate, thiamine, riboflavin, niacin, pantothenic acid, biotin, vitamin B6, and vitamin B12) and vitamin C. Recommendations for fat-soluble vitamins relate to vitamins A, D, E, and K. Recommendations for minerals cover iron, calcium and phosphorous, magnesium, zinc, iodine, and selenium.
Energy and Protein
Energy intake should be in balance with energy expenditure, to maintain a body mass index (BMI) in the range 18.5 to 24.9 kg/m2. 15 Specific WHO estimates of energy requirements for different population groups were issued in 2004, 12 continuing a long tradition of this work, 19 -22 which evolved as new methodologies to measure energy expenditure became available.
For healthy adults, WHO advises a population average requirement of 0.66 g of protein per kg of bodyweight per day, and recommends that an intake of 0.83 g/kg will meet almost everyone’s requirements and be safe. 14 Protein requirements per kg of bodyweight vary for infants, children and adolescents, and for women during pregnancy and lactation. 14 The recommendations in the 2007 guidance were about 10% higher than in the 1985 report, 22 and previous guidance recommended that protein should provide 10% to 15% of total energy. 15
Currently, there is no plan for a revision of recommendations on amounts of energy and protein. However, the definition of protein quality will be reviewed, to take into account the relative value of animal versus plant sources.
Fats
World Health Organization’s guidance on fats includes recommendations for total fat intake and for groups of fatty acids, based on the number of double bonds (ie, whether the fats are saturated or unsaturated). This approach has limitations—within each group, individual fatty acids may have different properties or effects; also, the combination of individual fatty acids commonly present within each group will vary from one geographical region to another.
Total Fat Intake
In 2008, the report of an expert consultation advised minimum total fat intakes of 15% energy for most individuals (20% for women of reproductive age and adults with BMI <18.5) and maximum total fat intakes of 30% to 35% for most individuals. 11 Earlier guidance for prevention of NCDs recommended intakes of 15% to 30% of energy, although highly active groups could sustain up to 35%. 15 A 2016 systematic review, commissioned by WHO, found high-quality evidence from 30 RCTs that reducing total fat intake (as a proportion of energy) without any intention to reduce bodyweight consistently showed lower bodyweight relative to controls. 23
Saturated Fatty Acids
A draft WHO guideline, issued for public consultation in 2018, suggested that saturated fatty intakes of adults and children (2-19 years) should be less than 10% of total energy intake, based on evidence of the low-density lipoprotein (LDL) cholesterol-lowering effect of reducing saturated fatty acid (SFA) intake in adults and children (high-quality evidence) and reduced risk of cardiovascular events in adults (moderate-quality evidence). 9 The draft guideline also states that replacement, if needed, should be with polyunsaturated fatty acids (PUFA). These recommendations are consistent with earlier guidance. 11,15
Trans-Fatty Acids
A draft WHO guideline, issued for public consultation in 2018, recommended that trans-fatty acid intakes should provide not more than 1% of total energy intake, regardless of whether the trans-fatty acids come from ruminant sources or are produced industrially and that trans-fatty acids should be replaced with PUFA. 9 The proposed recommendations are based on, among other things, high-quality evidence for the LDL-cholesterol-lowering impact of reducing trans-fatty acid intakes in adults and moderate quality evidence for the reduced risk of coronary heart disease in adults. The recommendations for children are based on extrapolation of adult data on disease risk and blood lipids. These recommendations are in line with previous guidance, 11,15,24 but the explicit inclusion of ruminant trans-fatty acids in the recommendation is new. Concerns that low average intakes can mask high intakes in some population groups have led to a focus on the need to remove industrially produced trans fats from the food supply.
Unsaturated Fatty Acids
A new WHO guideline on PUFA is in preparation. In 2008, an expert consultation recommended that 6% to 11% of energy come from PUFA (n-3 = 0.5%-2%; n-6 = 2.5%-9%). 11 Prior to that, the 2003 report on NCD prevention recommended that 6% to 10% of energy come from PUFA (n-3 = 1%-2%; n-6 = 5%-8%). 15 Both reports recommended that monounsaturated fats make up the difference when the combined total of SFA, PUFA, and trans-fatty acids is subtracted from total fat. 11,15
Carbohydrates
World Health Organization is currently preparing a new guideline on carbohydrate intakes (including fiber) for adults and children. In 2007, a joint Food and Agriculture Organization (FAO)/WHO scientific update recommended that dietary carbohydrate provide 50% to 75% of total energy. 25 This reduced the previously recommended lower limit from 55% to 50%. 25,26 The scientific update stressed the importance of the nature of carbohydrate rather than the quantity; also, in line with previous guidance, it emphasized the important contribution of whole grains, legumes, vegetables, and intact fruits. 15,25 A daily intake of at least 400 g of fruit and vegetables (excluding potatoes, sweet potatoes, cassava, and other starchy roots) is recommended. 15
Fiber
An intake of fiber of more than 20 g (when defined as nonstarch polysaccharide) from foods—or more than 25 g from foods (when defined as total dietary fiber)—was recommended for the prevention of NCDs. 15
Free Sugars
A WHO guideline issued in 2015 strongly recommended that adults and children reduce free sugars (note 4) intake to less than 10% of total energy intake. This was based on evidence from RCTs in adults and meta-analyses of prospective cohort studies in children on the relationship between free sugars intake and bodyweight, and evidence from cohort studies and national population studies on the relationship between sugars intakes and dental caries. 10 Moreover, a conditional recommendation to reduce intakes to below 5% of total energy intake—which goes further than earlier recommendations 15 —is based on the observation in ecological studies of a dose–response relationship between free sugars and dental caries at intakes of less than 5% of total energy intake. 10
Sodium and Potassium
The latest guideline strongly recommends that adults should reduce sodium intakes to less than 2 g per day (equivalent to 5 g per day of salt). 7 Children’s intakes should be adjusted downward based on their energy requirements relative to adults. 7 These recommendations are based on high-quality evidence on the relationship between sodium intake and blood pressure and lower quality evidence on sodium intake and all-cause mortality, cardiovascular disease (CVD), stroke, and coronary heart disease. These recommendations are consistent with the 2003 guidance for the prevention of NCDs 15 in which the expert consultation agreed to reduce an earlier recommendation of 6 g of salt per day. 16
To complement the sodium guideline, the first WHO guideline on potassium intake recommended potassium intake from food of at least 90 mmoL/d (3510 mg/d) for adults (adjusted downward for children relative to their energy requirements). 8 These recommendations are based on evidence that increasing potassium intake is beneficial in relation to blood pressure in adults and that higher potassium intakes are associated with a reduced risk of incident stroke. 8
Current WHO Recommendations
The WHO Healthy diet factsheet
27
summarizes the current guidance and translates the key points into food-based messages. It states that a healthy diet includes:
Fruit, vegetables, legumes (eg, lentils and beans), nuts, and whole grains (eg, unprocessed maize, millet, oats, wheat, and brown rice).
At least 400 g of fruit and vegetables per day, excluding potatoes, sweet potatoes, cassava, and other starchy roots.
Less than 10% of total energy intake from free sugars, which is equivalent to 50 g (or about 12 level teaspoons) for a person of healthy bodyweight consuming about 2000 calories per day, but ideally is less than 5% of total energy intake for additional health benefits.
Less than 30% of total energy intake from fats. Unsaturated fats (found in fish, avocado and nuts, and in sunflower, soybean, canola, and olive oils) are preferable to saturated fats (found in fatty meat, butter, palm and coconut oil, cream, cheese, ghee, and lard) and trans-fats of all kinds, including both industrially produced trans-fats (found in baked and fried foods, and prepackaged snacks and foods, such as frozen pizza, pies, cookies, biscuits, wafers, and cooking oils and spreads) and ruminant trans fats (found in meat and dairy foods from ruminant animals, such as cows, sheep, goats, and camels). It is suggested that the intake of saturated fats be reduced to less than 10% of total energy intake and trans fats to less than 1% of total energy intake. In particular, industrially produced trans fats are not part of a healthy diet and should be eliminated from the food supply.
Less than 5 g of salt (equivalent to about one teaspoon) intake per day. Salt should be iodized.
World Health Organization also encourages drinking safe tap water, or water from other improved sources (eg, protected boreholes) in preference to other drinks, especially sugar-sweetened beverages. 10 The WHO Guidelines for drinking water quality 28 note that estimates of quantities needed for health vary widely; it is assumed that, for adults, about 2 L per capita per day can meet needs, noting that actual consumption varies by climate, activity level, and diet.
The GBD Approach to Characterizing Healthy Diets
Approach
The GBD study uses data from 195 countries and territories, as well as subnational data from 16 countries, to model health risk and outcome associations. This approach is described here and is based on the most recent publication from the GBD 2017 Collaboration unless otherwise specified. 4 Risks include low intake of fruits, vegetables, legumes, whole grains, nuts and seeds, milk, seafood, n-3 fatty acids, n-6 PUFA, calcium and fiber, as well as high intake of red meat, processed meat, sugar-sweetened beverages, trans-fatty acids, and sodium (see Table 1 for the GBD definition of the 15 dietary risk exposures analyzed). The dietary risk factors included in GBD were selected based on 4 major criteria: the importance of the risk factor to either disease burden or policy; the availability of sufficient data to estimate risk factor exposure; the strength of the epidemiologic evidence supporting a causal relationship between the risk factor exposure and disease end points; and the availability of data to quantify the effect size of the risk exposure on disease incidence or mortality from the disease end point.
Dietary Risk Factor Exposure Definitions, Optimal Intake Thresholds, and Average Global Intakes: Global Burden of Disease Study.a
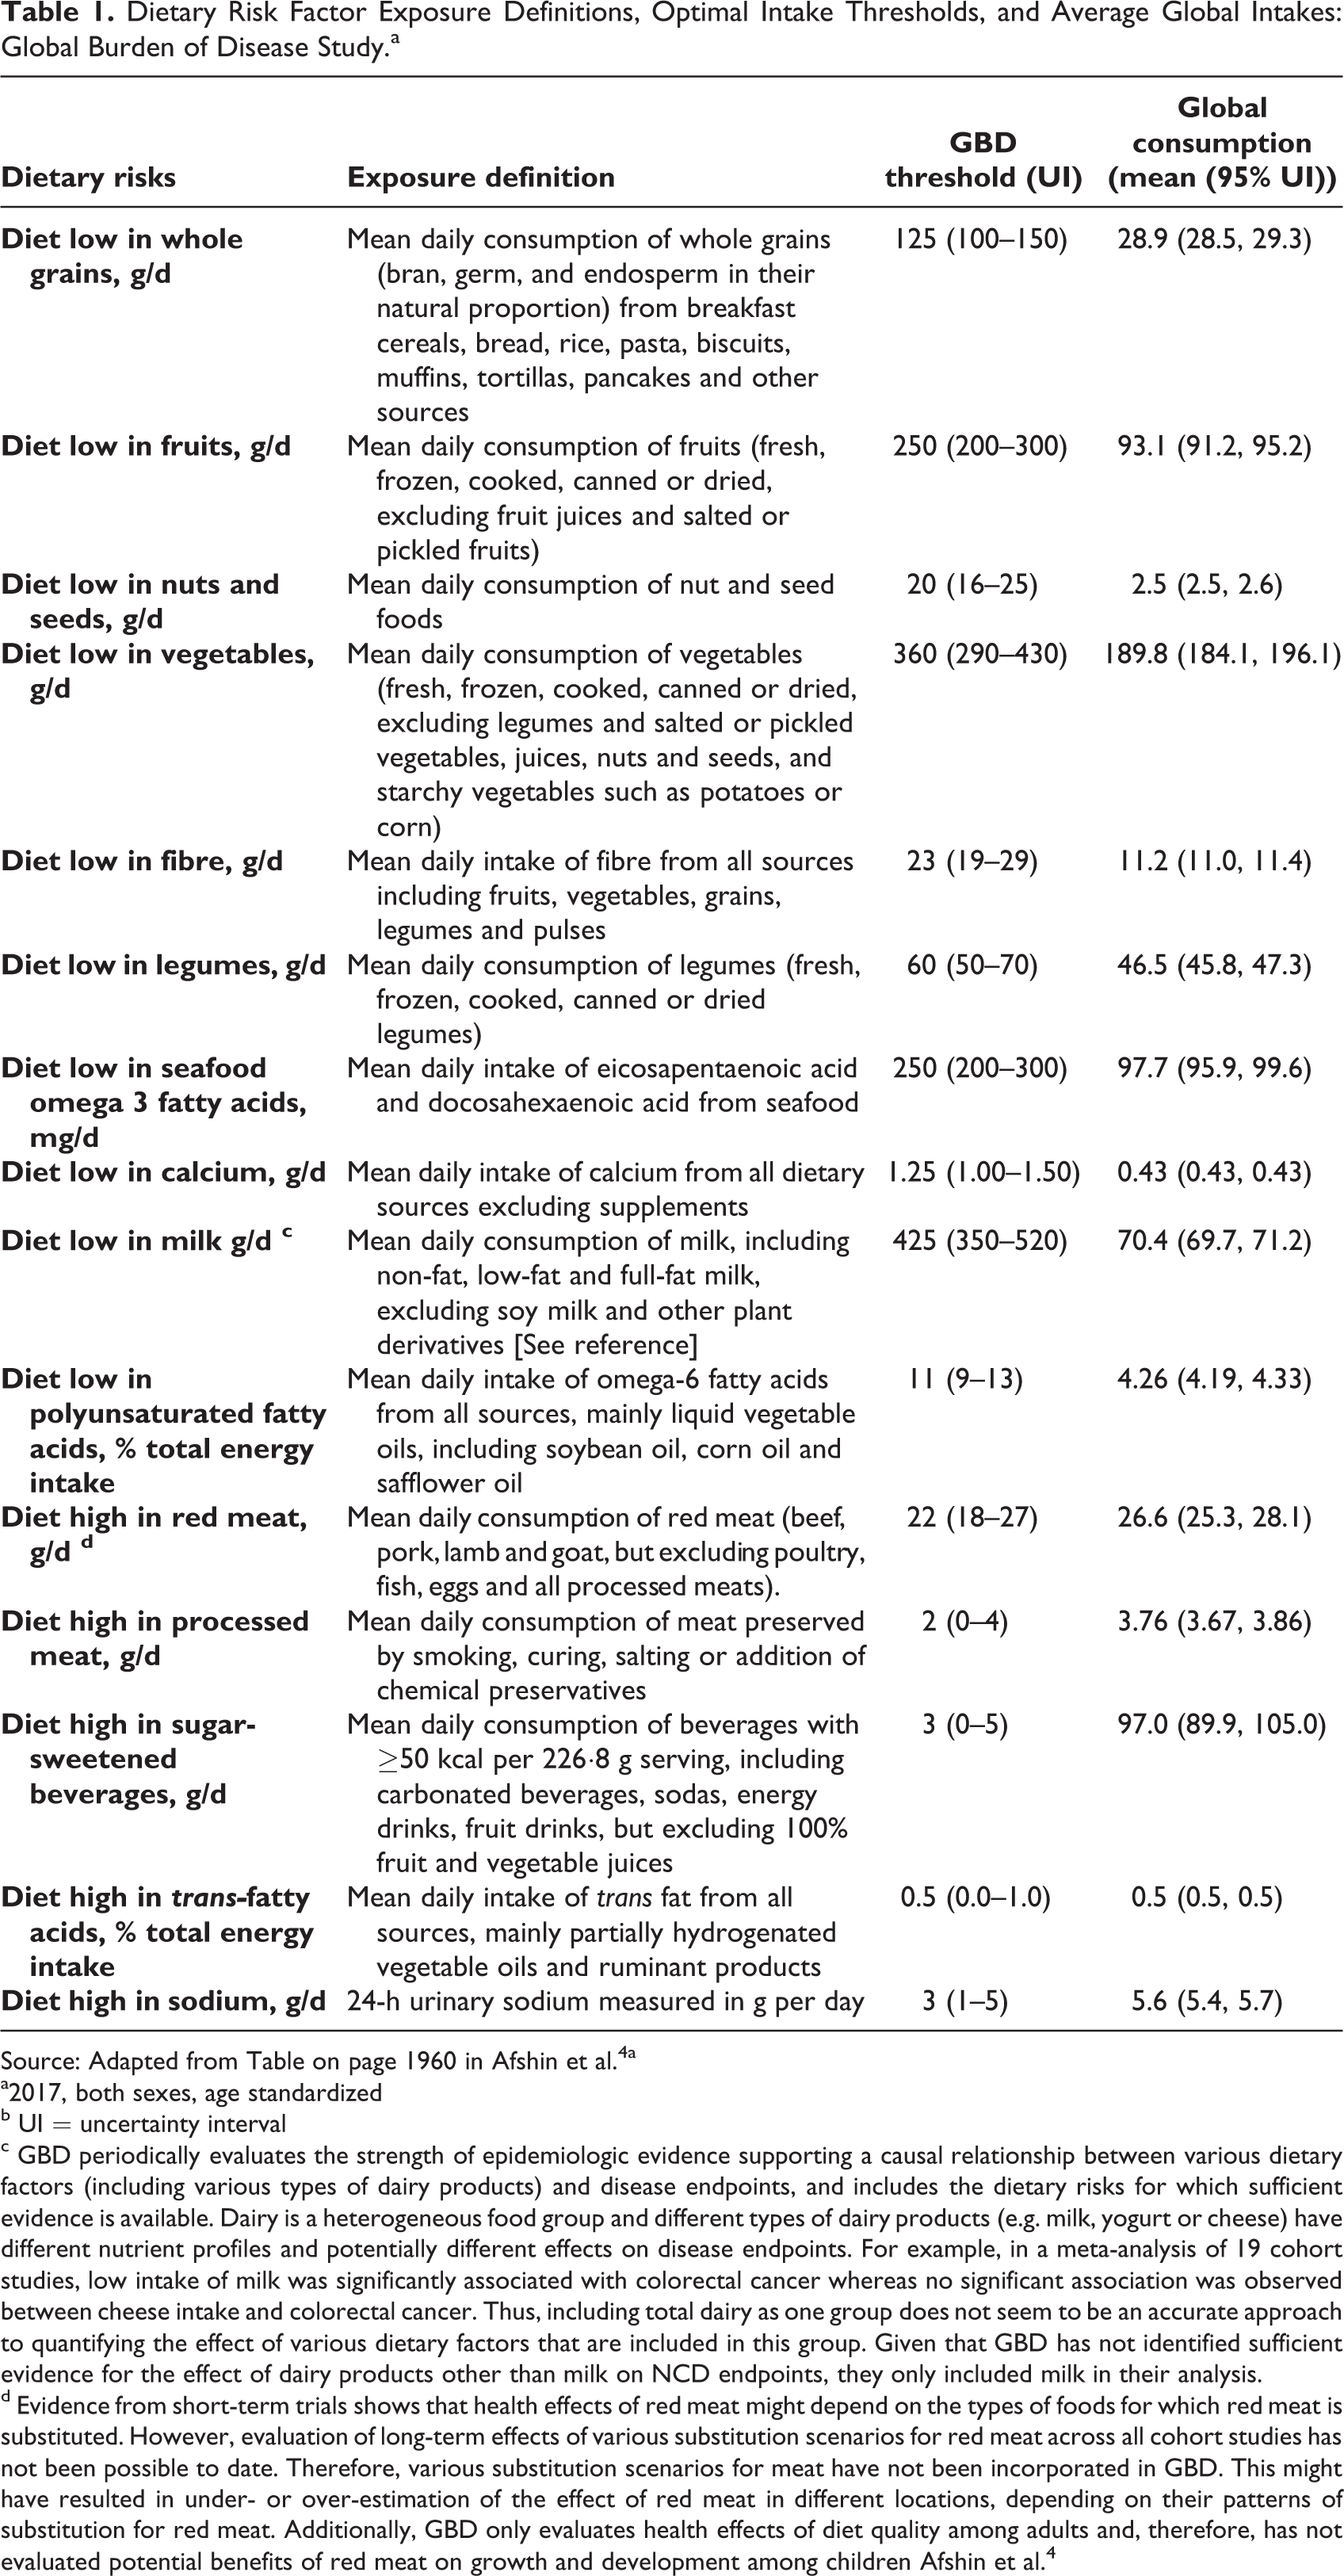
Source: Adapted from Table on page 1960 in Afshin et al. 4 a
a2017, both sexes, age standardized
b UI = uncertainty interval
c GBD periodically evaluates the strength of epidemiologic evidence supporting a causal relationship between various dietary factors (including various types of dairy products) and disease endpoints, and includes the dietary risks for which sufficient evidence is available. Dairy is a heterogeneous food group and different types of dairy products (e.g. milk, yogurt or cheese) have different nutrient profiles and potentially different effects on disease endpoints. For example, in a meta-analysis of 19 cohort studies, low intake of milk was significantly associated with colorectal cancer whereas no significant association was observed between cheese intake and colorectal cancer. Thus, including total dairy as one group does not seem to be an accurate approach to quantifying the effect of various dietary factors that are included in this group. Given that GBD has not identified sufficient evidence for the effect of dairy products other than milk on NCD endpoints, they only included milk in their analysis.
d Evidence from short-term trials shows that health effects of red meat might depend on the types of foods for which red meat is substituted. However, evaluation of long-term effects of various substitution scenarios for red meat across all cohort studies has not been possible to date. Therefore, various substitution scenarios for meat have not been incorporated in GBD. This might have resulted in under- or over-estimation of the effect of red meat in different locations, depending on their patterns of substitution for red meat. Additionally, GBD only evaluates health effects of diet quality among adults and, therefore, has not evaluated potential benefits of red meat on growth and development among children Afshin et al. 4
Identifying Dietary Risks
Global Burden of Disease uses the World Cancer Research Fund evidence grading criteria to evaluate the strength of causal relationships between dietary risks and disease end points, and it only includes the risk–outcome pairs for which convincing or sufficient evidence is available. In the most recent cycle of GBD, more than 300 studies, including 82 trials, were evaluated to establish causality between dietary risk–outcome pairs. Evidence supporting a causal relationship between most dietary risks, and health outcomes in GBD comes from prospective observational studies. For selected risk–outcome pairs (eg, n-3 fatty acids and ischemic heart disease, and PUFA and ischemic heart disease), evidence from trials has also been used. Additionally, evidence supporting the relationship between sodium intake and ischemic heart disease mostly comes from the trials that have assessed the effect of sodium intake on systolic blood pressure. For a few risk–outcome pairs with fewer than 5 prospective studies, evidence from case–control studies was also used to assess the strength of the causal relationship. Overall, the strength of causal relationships varied widely across dietary risks–outcomes.
As an additional consideration, evidence on causal relationships of diet components and NCDs comes mainly from high-income countries. For example, evidence on long-term effects of nuts comes mainly from prospective cohort studies conducted in the United States and other high-income countries such as Australia and the Netherlands. This might raise concerns over generalizability of these findings to LMICs, where the diet composition might be different, or specific components of the diet are not commonly consumed (eg, nuts, milk). However, evidence from LMICs on the relationship between diet components and NCDs is consistent with evidence from high-income countries. For example, in the case of nuts, the results of the few studies that assessed the relationship with nuts and ischemic heart disease in China were similar to the results of the studies conducted in the United States. 29 Similarly, in the case of milk consumption and colorectal cancer, the effect sizes reported from Asian cohorts were not significantly different from the effect sizes reported from studies conducted in the United States or Europe. 30 Given the lack of evidence to support the generalizability of diet–disease relationship across countries, perhaps the most reasonable approach is to make causal inference based on current evidence and make recommendations accordingly.
Characterizing Population Dietary Intake
After selecting dietary risks, GBD uses a wide range of data sources to characterize the mean and population distribution of intake for each dietary component by age and sex across countries and over time. These data sources include nationally and subnationally representative 24-hour dietary recall and food frequency questionnaires (FFQs). Additionally, for selected food groups, GBD uses data from household expenditure surveys and market research reports (eg, Euromonitor). Global Burden of Disease also uses data on food availability from the UN FAO food balance sheets, and data on nutrient availability from the Global Nutrient database that was created using data from FAO’s supply utilization accounts and the US Department of Agriculture’s food composition tables. For sodium, data from 24-hour urinary sodium are also used in the GBD estimation process. Given that these dietary data come from various sources and that each source has different types of biases, GBD uses different statistical approaches to harmonize these data and make them comparable. This is done at the mean level rather than the distribution level (see full description in Afshin et al). 4 Briefly, for all dietary factors other than sodium, data from 24-hour dietary recall (adjusted for within-person variation) are considered the gold standard. Then, for each dietary factor, the relationship between the gold standard and non-gold standard data sources is characterized by age and sex in a subset of countries with both types of data and all non-gold standard data are adjusted accordingly. For sodium, data from 24-hour urinary sodium is considered the gold standard. After harmonizing dietary data, GBD uses spatiotemporal Gaussian process regression to estimate the full-time series of mean intake for each dietary factor. Next, using the relationship between mean intake and standard deviation of intake, GBD estimates the standard deviation of intake in each population, then characterizes the population distribution of intake. Global Burden of Disease uses an ensemble of commonly used probability density functions fitted to individual-level data for each dietary factor to empirically characterize the shape of the distribution of intake at the population level.
Estimating Health Effects Attributable to Dietary Risks
Once the population distribution of intake has been characterized, the health effect of each dietary risk on disease incidence and mortality is quantified using the population attributable fraction (PAF). Population attributable fraction represents the proportion of the burden of each disease that could have been prevented if the exposure to each dietary risk had been sustained at the minimum risk level. In other words, for each dietary factor, GBD quantifies what percentage of each disease could have been prevented if people had an optimal intake of each dietary component. Global Burden of Disease defines the optimal level of intake for each dietary component as the level that minimizes mortality from all-causes and estimates that level based on the intake associated with the lowest risk of cause-specific mortality in prospective cohort studies. In doing this, GBD first calculates the level of intake associated with the lowest risk of mortality from the meta-analysis of prospective cohort studies. Dietary assessments in cohort studies are conducted by FFQs. Although FFQ might be an acceptable instrument for ranking people based on their intake of various foods, it is not an accurate instrument for estimating the absolute intake of foods and nutrients. Global Burden of Disease uses 20% to account for the biases of FFQs in estimating the true intake of foods and nutrients. This was consistent with the average error that is observed in FFQ validation studies. To calculate the overall effect of dietary factors, GBD assumes that the distributions of dietary factors are independent of each other at the population level and estimates the joint PAF in the multiplicative scale (see full description in Afshin et al). 4
Findings: Diet-Related Disease Burden
Among the 15 dietary components included in GBD, each of the leading risk factors for disability-adjusted life years (DALYs) accounted for more than 20 million DALYs globally. These factors were low intake of whole grains (82.5 million DALYs [95% UI: 59.0 million-109.1 million]); high intake of sodium (70.4 million DALYs [33.6 million-117.8 million]); low intake of fruits (64.8 million DALYs [95% UI: 40.6 million-92.0 million]); nuts and seeds (49.9 million DALYs [33.1 million-68.0 million]); vegetables (34.2 million DALYs [17.7 million-55.7 million]); and seafood omega-3 (32.4 million DALYs [15.2 million-52.7 million]). Low intake of whole grains was the leading dietary risk factor for DALYs in all WHO regions other than the Western Pacific Region, where high intake of sodium was the leading risk factor for DALYs. Globally, the ranking of leading dietary risk factors has not significantly changed over the past 3 decades. Following are highlights of findings related to each of the 15 leading dietary risk factors. The GBD definitions of these dietary risk factor exposures, thresholds for optimal intakes and average global intakes are shown in Table 1.
Low Intake of Healthy Components of Diet
Diet low in whole grains
Across WHO regions, the highest intake of whole grains was observed in the South-East Asia Region (37.6 g/d, 95% UI 36.7-38.6 g/d) and the lowest in the Eastern Mediterranean Region (8.2 g/d, 95% UI 8.0-8.4 g/d). Low intake of whole grains was associated with higher risk of CVD and diabetes, and in 2017, accounted for 82.5 million DALYs (95% UI: 59.0 million-109.1 million) globally. The highest age-standardized DALY rate attributable to low intake of whole grains was observed in the WHO Eastern Mediterranean Region (3486.0 per 100 000, 95% UI: 2498.9-4569.4) and the lowest was observed in the WHO Region of the Americas (1190.8 per 100 000, 95% UI: 815.6-1633.1 per 100 000; note 5).
Diet low in fruits
Across WHO regions, the highest intake of fruits was observed in the Region of the Americas (131.0 g/d, 95% UI: 128.5-133.7 g/d) and the lowest in the African Region (74.4 g/d, 95% UI: 73.1-75.8 g/d). Globally, low intake of fruit was the third leading dietary risk factor, accounting for 64.8 million DALYs (95% UI: 40.6 million-92.0 million) due to CVD, diabetes, and cancers (lip and oral cavity, pharynx, esophagus, larynx, and lung). The highest age-standardized DALY rate attributable to low intake of fruits was observed in the WHO Eastern Mediterranean Region (2001.5 per 100 000, 95% UI: 1167.2-2983.3) and the lowest in the Region of the Americas (717.1 per 100 000, 95% UI: 376.0-1121.1 per 100 000).
Diet low in nuts and seeds
Across WHO regions, the highest intake of nuts and seeds was observed in the European Region (3.81 g/d, 95% UI: 3.68-3.93 g/d) and the lowest in the South-East Asia Region (1.81 g/d, 95% UI: 1.68-1.96 g/d). Diet low in nuts and seeds was associated with ischemic heart disease and diabetes and was responsible for 49.9 million DALYs (95% UI: 33.1 million-68.0 million) globally. The highest age-standardized DALY rate attributable to low intake of nuts and seeds was observed in the WHO Eastern Mediterranean Region (2154.5 per 100 000, 95% UI: 1415.0-2965.8 per 100 000) and the lowest was observed in the Western Pacific Region (801.1 per 100 000, 95% UI: 534.6-1097.0).
Diet low in vegetables
Across WHO regions, the highest intake of vegetables was observed in the Western Pacific Region (236.2 g/d, 95% UI: 218.0-256.7 g/d) and the lowest intake of vegetables was observed in the African Region (95.7 g/d, 95% UI: 94.1-97.5 g/d). Globally, low intake of vegetables was the fifth leading risk factor for DALYs, accounting for 34.2 million DALYs (95% UI: 17.7 million-55.7 million) due to CVD and esophageal cancer. The highest age-standardized DALY rate attributable to low intake of vegetables was observed in the WHO Eastern Mediterranean Region (1266.4 per 100 000, 95% UI: 645.7-2068.8) and the lowest in the European Region (512.0 per 100 000, 95% UI: 226.9-895.6 per 100 000).
Diet low in fiber
Across WHO regions, the highest intake of fiber was observed in the African Region (17.0 g/d, 95% UI: 16.8-17.2 g/d) and the lowest in the Western Pacific Region (9.03 g/d, 95% UI: 8.60-9.49 g/d). Globally, low intake of fiber was associated with ischemic heart disease and cancers of colon and rectum, accounting for 19.9 million DALYs (95% UI: 11.6 million-30.4 million) in 2017. The highest age-standardized DALY rate attributable to low intake of fiber was observed in the WHO Eastern Mediterranean Region (702.2 per 100 000, 95% UI: 374.5-1121.7 per 100 000) and the lowest in the African Region (237.2 per 100 000, 95% UI: 115.5-403.5).
Diet low in legumes
Across WHO regions, the highest intake of legumes was observed in the South-East Asia Region (79.4 g/d, 95% UI: 77.3-81.6 g/d) and the lowest in the European Region (19.7 g/d, 95% UI: 19.4-19.9 g/d). Globally, low intake of legumes accounted for 11 million DALYs (95% UI: 4.4 million-18.7 million) due to ischemic heart disease. The highest age-standardized DALY rate attributable to low intake of legumes was observed in the WHO European Region (457.2 per 100 000, 95% UI: 194.3-746.5) and the lowest in the South-East Asia Region (116.3 per 100 000, 95% UI: 42.4-219.0).
Diet low in seafood n-3 fatty acids
Across WHO regions, the highest intake of seafood n-3 fatty acids was observed in the Western Pacific Region (202.0 mg/d, 95% UI: 196.2-208.5 mg/d) and the lowest in the South-East Asia Region (19.0 mg/d, 95% UI: 18.7-19.2 mg/d). Globally, low intake of seafood n-3 fatty acids was associated with ischemic heart disease and accounted for 32.4 million DALYs (95% UI: 15.2 million-52.7 million) in 2017. Among 15 dietary risk factors included in GBD, low intake of omega-3 fatty acids ranked sixths. The highest age-standardized DALY rate attributable to low intake of seafood n-3 fatty acids was observed in the WHO Eastern Mediterranean Region (1536.6 per 100 000, 95% UI: 708.0-2506.0) and the lowest in the Region of the Americas (376.0 per 100 000, 95% UI: 158.5-657.0).
Diet low in calcium
Across WHO regions, the highest intake of calcium was observed in the European Region (0.732 g/d, 95% UI: 0.728-0.735) and the lowest in the African Region (0.281 g/d, 95% UI: 0.280-0.283). Globally, low intake of calcium was associated with colorectal cancer, accounting for 3.9 million DALYs (95% UI: 2.45 million-5.48 million). The highest age-standardized DALY rate attributable to low intake of calcium was observed in the WHO Western Pacific Region (102.7 per 100 000, 95% UI: 68.1-140.8) and the lowest in the Eastern Mediterranean Region (72.4 per 100 000, 95% UI: 47.3-101.0).
Diet low in milk
Across WHO regions, the highest intake of milk was observed in the European Region (163.0 g/d, 95% UI: 161.4-164.7 g/d) and the lowest in the African Region (24.2 g/d, 95% UI: 23.9-24.5 g/d). Globally, low intake of milk accounted for 2.7 million DALYs (95% UI: 1.0-4.7 million) due to colorectal cancer. The highest age-standardized DALY rate attributable to low intake of milk was observed in the WHO Western Pacific Region (72.2 per 100 000, 95% UI: 25.5-122.4) and the lowest in the South-East Asia Region (46.4 per 100 000, 95% UI: 16.0-79.3).
Diet low in n-6 PUFAs
Across WHO regions, the highest intake of PUFA was observed in the Region of the Americas (8.31%, 95% UI: 8.20%-8.44%) and the lowest in the African Region (2.28%, 95% UI: 2.26%-2.30%). Globally, low intake of PUFA accounted for 17.9 million DALYs (95% UI: 7.8 million-29.0 million) due to ischemic heart disease. The highest age-standardized DALY rate attributable to low intake of PUFA was observed in the WHO Eastern Mediterranean Region (856.2 per 100 000, 95% UI: 361.9-1416.8 per 100 000) and the lowest in the Region of the Americas (118.4 per 100 000, 95% UI: 44.2-222.6).
High Intake of Unhealthy Components of Diet (note 6)
Diet high in red meat
Across WHO regions, the highest intake of red meat was observed in the Region of the Americas (43.7 g/d, 95% UI: 42.5-45.0 g/d) and the lowest in the South-East Asia Region (3.78 g/d, 95% UI: 3.64-3.92 g/d). Globally, high intake of red meat was associated with type 2 diabetes and colorectal cancer. Among all dietary risks, high intake of red meat ranked 15th and accounted for 1.3 million DALYs (95% UI: 0.5-2.2 million). The highest age-standardized DALY rate attributable to high intake of red meat was observed in the WHO Region of the Americas (63.4 per 100 000, 95% UI: 21.8-110.8) and the lowest in the South-East Asia Region (0.048 per 100 000, 95% UI: 0.000-0.322).
Diet high in processed meat
Across WHO regions, the highest intake of processed meat was observed in the Region of the Americas (10.46 g/d, 95% UI: 9.92-11.01 g/d) and the lowest in the South-East Asia Region (0.98 g/d, 95% UI: 0.90-1.07 g/d). Globally, high intake of processed meat was associated with ischemic heart disease, type 2 diabetes, and colorectal cancer. Among all dietary risks, high intake of processed meat ranked 13th and accounted for 3.6 million DALYs (95% UI: 1.3 million-6.8 million). The highest age-standardized DALY rate attributable to high intake of processed meat was observed in the WHO Region of the Americas (272.0 per 100 000, 95% UI: 110.8-438.8) of WHO and the lowest in the African Region (7.4 per 100 000, 95% UI: 0.0-37.2).
Diet high in sugar-sweetened beverages
Among all dietary risks, high intake of sugar-sweetened beverage ranked 11th and accounted for 4.5 million DALYs (95% UI: 1.5 million-7.7 million) due to ischemic heart disease and type 2 diabetes. The highest age-standardized DALY rate attributable to high intake of sugar-sweetened beverages was observed in the WHO Region of the Americas (307.3 per 100 000, 95% UI: 117.0-532.9 per 100 000) and the lowest in the South-East Asia Region (25.1 per 100 000, 95% UI: 6.4-57.2 per 100 000).
Diet high in trans-fatty acids
Among all dietary risks, high intake of trans-fatty acids ranked 10th and accounted for 6.2 million DALYs (95% UI: 1.9 million-13.8 million) ischemic heart disease. The highest age-standardized DALY rate attributable to high intake of trans-fatty acids was observed in the WHO Eastern Mediterranean Region (533.3 per 100 000, 95% UI: 216.4-984.5 per 100 000) and the lowest in the African Region (29.5 per 100 000, 95% UI: 0.2-119.2 per 100 000).
Diet high in sodium
High intake of sodium was associated with CVD (through high systolic blood pressure) and stomach cancer (note 7). Among all dietary risks, high intake of sodium ranked second and accounted for 70.4 million DALYs (95% UI: 33.6 million-117.8 million). The highest age-standardized DALY rate attributable to high intake of sodium was observed in the WHO Western Pacific Region (2900.8 per 100 000, 95% UI: 1657.5-4142.3 per 100 000) and the lowest in the African Region (648.3 per 100 000, 95% UI: 21.1-1956.0 per 100 000).
Aggregated Risk Diet
Overall, dietary risk accounted for 254 million DALYs (95% UI: 234 million-274 million) globally. The disease burden of dietary risk has not significantly changed over the last 3 decades. The total DALYs attributable to diet have significantly increased, but this increase is simply the result of the population growth and population aging. On the other hand, the age-standardized DALY rates related to diet have significantly declined as a result of decrease in the underlying mortality rate, mostly from CVD.
Data Limitations
The GBD has systematically collected dietary data from nutrition surveys and has evaluated and synthesized epidemiologic evidence supporting the relationship between different components of diet and disease end points. Through this effort, GBD has identified and highlighted several important limitations in data and methods used in nutrition surveys and epidemiologic studies of diet. The limitations include inconsistent definition of diet components in nutrition surveys and epidemiologic studies; inconsistent statistical modeling; issues related to the practice of adjusting statistical models for energy intake; the inherent measurement error in dietary assessment instruments; issues associated with correlations among dietary factors; and publication bias that may skew the available studies to those that find diet–disease relationships.
In summary, over the past 7 years, the GBD has tried to provide accurate estimates of the health effects of dietary risks at the population level and has annually updated the estimates based on the best available data. Although there are some differences between the GBD approach and existing WHO dietary guidelines, the GBD has proven to be a useful source for guiding dietary policies at the national, regional, and international levels. The GBD shows that the aggregated risk of unhealthy diet accounts for more DALYs globally than systolic blood pressure, tobacco and high fasting plasma glucose, indicating the urgent need to improve diet. The GBD also indicates that efforts to improve diet could potentially have a greater impact if focused more on increasing the intake of healthy foods (eg, whole grains, fruits, vegetables, and nuts) than on decreasing the intake of intake of less healthy foods.
Dietary Pattern Evidence for Defining Healthy Diets
Value of Direct Evidence on Whole Dietary Patterns for Defining Healthy Diets
As noted in the introduction, historically, a healthy diet was typically defined as one that was nutritionally adequate, assessed against evidence-informed nutrient reference values. Now that diet-related NCDs, obesity and undernutrition are the leading contributors to the GBD 31 and are linked inextricably with sustainability considerations, 32,33 the definition of a healthy diet has been broadened to focus on making recommendations about NCD risks. For this purpose, investigating nutrition and health relationships in ways that contribute to the body of evidence for defining a healthy and sustainable diet requires a summative approach to allow for consideration of the total picture of food intake that reflects the way people eat. In terms of health effects, separately identified characteristics of foods cannot account for the complexity of individual foods and their interdependence within dietary patterns. Innovations in nutrition research to help determine what constitutes a healthy diet are being informed by observing the truism that people eat foods, not nutrients, and that those foods are consumed in combinations and amounts that vary over time. Hence, characteristics of dietary patterns—that is, “the quantities, proportions, variety, or combination of different foods, drinks, and nutrients (when available) in diets, and the frequency with which they are habitually consumed” 34 —are particularly authentic considerations to inform what constitutes a healthy diet. In other words, dietary pattern studies are especially fit for purpose for identifying healthy diet attributes because they directly investigate “real world” exposures of interest.
There is a theoretical basis to viewing dietary patterns as a distinct concept of nutrition. The theory is that dietary pattern effects on health outcomes are stronger and more extensive than the sum of the actions of the individual nutrients 35 -38 and the individual foods they contain. This theoretical underpinning is reinforced by biologically plausible mechanisms that help explain why a nutrient’s and a food’s metabolism and subsequent influence on a health outcome can vary, depending on whether they are consumed in isolation or within a dietary pattern setting. From a nutrient exposure perspective, there are synergies among the nutrients present in dietary patterns, 39,40 and their bioavailability is influenced by the physical structure of the food matrices within which nutrients are found. 41 From a food exposure perspective, there are synergies among the foods present in dietary patterns, 40 and the degree of processing of a food can influence its physical and chemical characteristics, and its subsequent health impact. 42 Critically, these conceptual, theoretical, and mechanistic propositions have been supported with findings from empirical studies. Several dietary pattern trials and modeling studies in which foods within a diet context 43 or the whole diet 32,44 have been manipulated, have reported associations with health outcomes and/or food system sustainability. Dietary pattern indices can be used in monitoring and surveillance to assess how well people comply with dietary guidelines; they can also be used to monitor trends in the population over time, and to target diet and nutrition messages for the public.
Approaches to Studying Dietary Patterns
Dietary patterns are generally studied using either hypothesis-driven (a priori) approaches based on the development of diet scores or indices that reflect existing knowledge or dietary recommendations, or data-driven (a posteriori) approaches that generate food patterns based on empirical data, using multivariate statistical techniques. The type of dietary pattern methodology most suitable for a study will depend on the research question or policy issue. In general, both approaches are useful for exploring associations between dietary patterns and health outcomes. However, a priori approaches based on national and global dietary guidance, that refer to predefined food categories and components, are described here on the assumption that they are most relevant to characterizing both health and sustainability outcome considerations across populations. A posteriori approaches, which are data driven, will vary with each data set and statistical method and may be useful in assessing the fit of a priori characterizations in each population setting.
Diet Quality Metrics Reflecting a Priori Dietary Patterns (note 8)
Diet quality metrics capturing a priori dietary patterns are numerous and have been widely reviewed.
45
-53
As a metric is designed and constructed, specific decisions are taken (depending on the purpose), making comparisons difficult. Decisions include: demographic groups (age, physiological status) for which the metric should be valid; expression (eg, continuous score, count or ordinal score, dichotomous or trichotomous, and whether designed to be “disaggregated” into component parts); data requirements or constraints (eg, quantitative, semiquantitative, or qualitative dietary data, and over what period of dietary intake or consumption); choice of the components to include (eg, food groups, nutrients, or food substances; note 9)
54
; assigning foods to food groups; choice of cutoff values and algorithms for scoring each component; operational definition of each component; weighting—the relative contribution of the individual components to the total score, and how to balance “positive” and “negative” elements in indices that include both; and whether and how to account for energy intake.
A systematic review and meta-analysis of dietary patterns and type 2 diabetes by Jannasch and Kroger 55 provides extensive supplementary tables describing and comparing characteristics of 30 indices.
Metrics for global and national monitoring under resource constraints require relative simplicity in measurement and also must validly reflect diet quality across many types of cultural dietary patterns. 56 When metrics are needed to inform programs and policies, it is useful if the metric can be disaggregated into its component parts, to help identify foci for needed action. For example, the Diet Quality Index—International 57 covers 4 dimensions—variety (overall and within protein sources), adequacy, moderation, and overall balance, including proportionality in energy sources. In another example of “disaggregation,” Krebs-Smith at al 58 advise using radar graphs to examine component (eg, food group) scores and patterns when using the Healthy Eating Index (HEI). Finally, for communication and advocacy—and particularly across sectors, in policy dialogues or for public health messaging—metrics should be amenable to simple explanation and presentation. Examples include dichotomous indicators that can be expressed as a prevalence, trichotomous indicators that can be expressed as “stop lights” (green/yellow/red), and various graphical presentations.
Widely used metrics and “families” of metrics include indices capturing adherence (or relative adherence) to versions of the Mediterranean diet or the Dietary Approaches to Stop Hypertension (DASH) diet, or indices operationalizing national food-based dietary guidelines (FBDG), as described below.
Mediterranean Diet Scores
There are numerous Mediterranean Diet Score (MDS) that constitute a family of metrics with similar objectives and elements. Sofi et al
59
provide a summary of score elements from a large set of prospective cohort studies published between 2010 and 2013. Studies were primarily from Europe—including the multicountry European Prospective Investigation into Cancer and Nutrition study—with some from the United States and none from Asia, Africa, or Latin America. There was high consistency in terms of components of the adherence score across studies; however, there was variability in the amounts per food group that defined higher versus lower intake, and thus determined scoring. Across most studies, components included: high intake of legumes (rarely grouped with vegetables or nuts); high intake of cereals (rarely grouped with potatoes, or specified as pasta, or as whole grain); high intake of fruit and nuts, or of fruit only; high intake of vegetables (rarely grouped with legumes or with potatoes); high intake of fish; low intake of meat and meat products (rarely specifying processed meat or poultry as well; rarely, including eggs in addition to meat and meat products); low intake of dairy products (rarely low butter only); high ratio of monounsaturated fatty acids (MUFA) to SFA (rarely high PUFA: SFA; or MUFA + PUFA: SFA; or high olive oil and low butter; note 10); moderate intake of alcohol; and rarely included low intake of soft drinks and low intake of potatoes.
Most MDS are derived from quantitative or semiquantitative dietary data, usually FFQs covering various time periods and aiming to capture usual consumption of food groups.
Dietary Approaches to Stop Hypertension Diet Scores
The original DASH diet was designed to have the (previously established) blood pressure–lowering effects of vegetarian diets but with enough animal-source foods to be acceptable for nonvegetarians in the US context. 60 The DASH diet was not designed with attention to sustainability considerations. Adherence to a DASH-style diet has also been associated with reductions in other risk factors and NCD end points in numerous studies, primarily from Europe and North America. In the DASH-Sodium trial, researchers showed progressively larger impacts of a DASH diet with lower sodium content than in the original trial. 61 The OmniHeart Trial showed that replacing some carbohydrate in the original DASH diet with either protein or unsaturated fats had added benefits for blood pressure and LDL-cholesterol levels. 62 This indicated that a DASH diet with flexibility in macronutrient profile could be beneficial. 63 The current version of the DASH diet, now called the DASH eating plan, is described at the US National Heart, Lung, and Blood Institute website (note 11), as follows:
The DASH eating plan requires no special foods and instead provides daily and weekly nutritional goals. This plan recommends: Eating vegetables, fruits, and whole grains Including fat-free or low-fat dairy products, fish, poultry, beans, nuts, and vegetable oils Limiting foods that are high in saturated fat, such as fatty meats, full-fat dairy products, and tropical oils such as coconut, palm kernel, and palm oils Limiting sugar-sweetened beverages and sweets.
The DASH diet differs from the MDS in that it includes positive scoring for dairy and no specific targets for fish.
Indices Operationalizing National FBDG
National FBDG aim to translate available science into behavioral advice for populations. Metrics have been developed to assess adherence to FBDG; the most widely used include the various iterations and adaptations of the HEI, which is updated with each new version of the US dietary guidelines. As described in Kirkpatrick et al,
64
the HEI has been used for various purposes; for example, to assess diet quality of the population, to compare across population subgroups, to identify determinants of diet quality, to investigate associations to health risk factors and outcomes, and to examine the effect of interventions on diet quality. The most recent version, the HEI-2015, reflects the US 2015-2020 Dietary guidelines and includes the following 9 adequacy components and 4 moderation components (point scores in parentheses)
58
: Adequacy ◦ Total fruits (5) ◦ Whole fruits (5) ◦ Total vegetables (5) ◦ Dark green vegetables and legumes (5) ◦ Whole grains (10) ◦ Dairy (10) ◦ Total protein foods (5) ◦ Seafood and plant proteins (5) ◦ Fatty acids (ratio of PUFA and MUFA to SFA) (10) Moderation ◦ Refined grains (10) ◦ Sodium (10) ◦ Added sugars (10) ◦ Saturated fat (10)
As with the DASH diet scores, and in contrast to most MDS, dairy is scored positively as an adequacy component. As described in Kirkpatrick et al, 64 the HEI-2015 can be derived from various data sources (eg, 24-hour recalls, food diaries, and FFQs). However, appropriate analytic approaches vary by data source and research objectives.
Several comparative studies have included the widely used metrics or families of metrics described above (eg, the study by Jannasch and Kroger, 55 George et al, 65 Jacobs et al, 66 Liese et al, 67 Reedy et al, 68 Schwingshackl et al, 69 Schwingshackl and Hoffmann, 70 and Sotos-Prieto et al 71 ). Several studies conclude that multiple indices capture the same core dimensions of healthy diets (eg, the study by Liese et al 67 ). However, although this provides some evidence of convergence, there is as yet no widely accepted diet quality metric for global use that captures both nutrient adequacy and NCD risk reduction and is valid across diverse cultural dietary patterns. Additionally, both food safety and sustainable diets are of high concern.
For certain uses such as global monitoring and national monitoring under resource constraints, metrics requiring quantitative dietary intake data may be infeasible or unaffordable, and alternatives such as validated simple non-quantitative or semiquantitative recalls may be more promising. Given the importance of diet quality for health outcomes in all countries, several initiatives are underway that seek to help meet this need. 72 These and similar efforts are urgently needed to fill gaps and allow assessment, monitoring and advocacy for improved diet quality in all countries and globally.
Current Evidence Based on Dietary Patterns and Health Outcomes
As reflected in the previous section, there are growing numbers of studies using whole dietary pattern approaches; such studies are providing an increasing evidence base to inform what constitutes a healthy diet. During 2016, WHO commissioned a project team led by Deakin University’s Institute of Physical Activity and Nutrition to conduct a scoping review of the literature on dietary patterns and health outcomes for consideration by WHO’s NUGAG Subgroup on Diet and Health. The scoping review was guided by the research question: “What quantity and variety of evidence linking source, eating patterns and/or processing characteristics of dietary patterns with health and environmental outcomes is available?” Four databases were searched to identify relevant systematic literature reviews and primary studies published between January 1, 1980, and September 30, 2016: PubMed; Scopus, Global Health, and Environment Complete. The scoping review identified 188 systematic reviews on the health impacts of dietary patterns, of which 187 included studies that explored the health outcomes of dietary patterns. More than half of these reviews had been published in the previous 3 years (n = 112). Most were published by authors based in the United States (Figure 1).
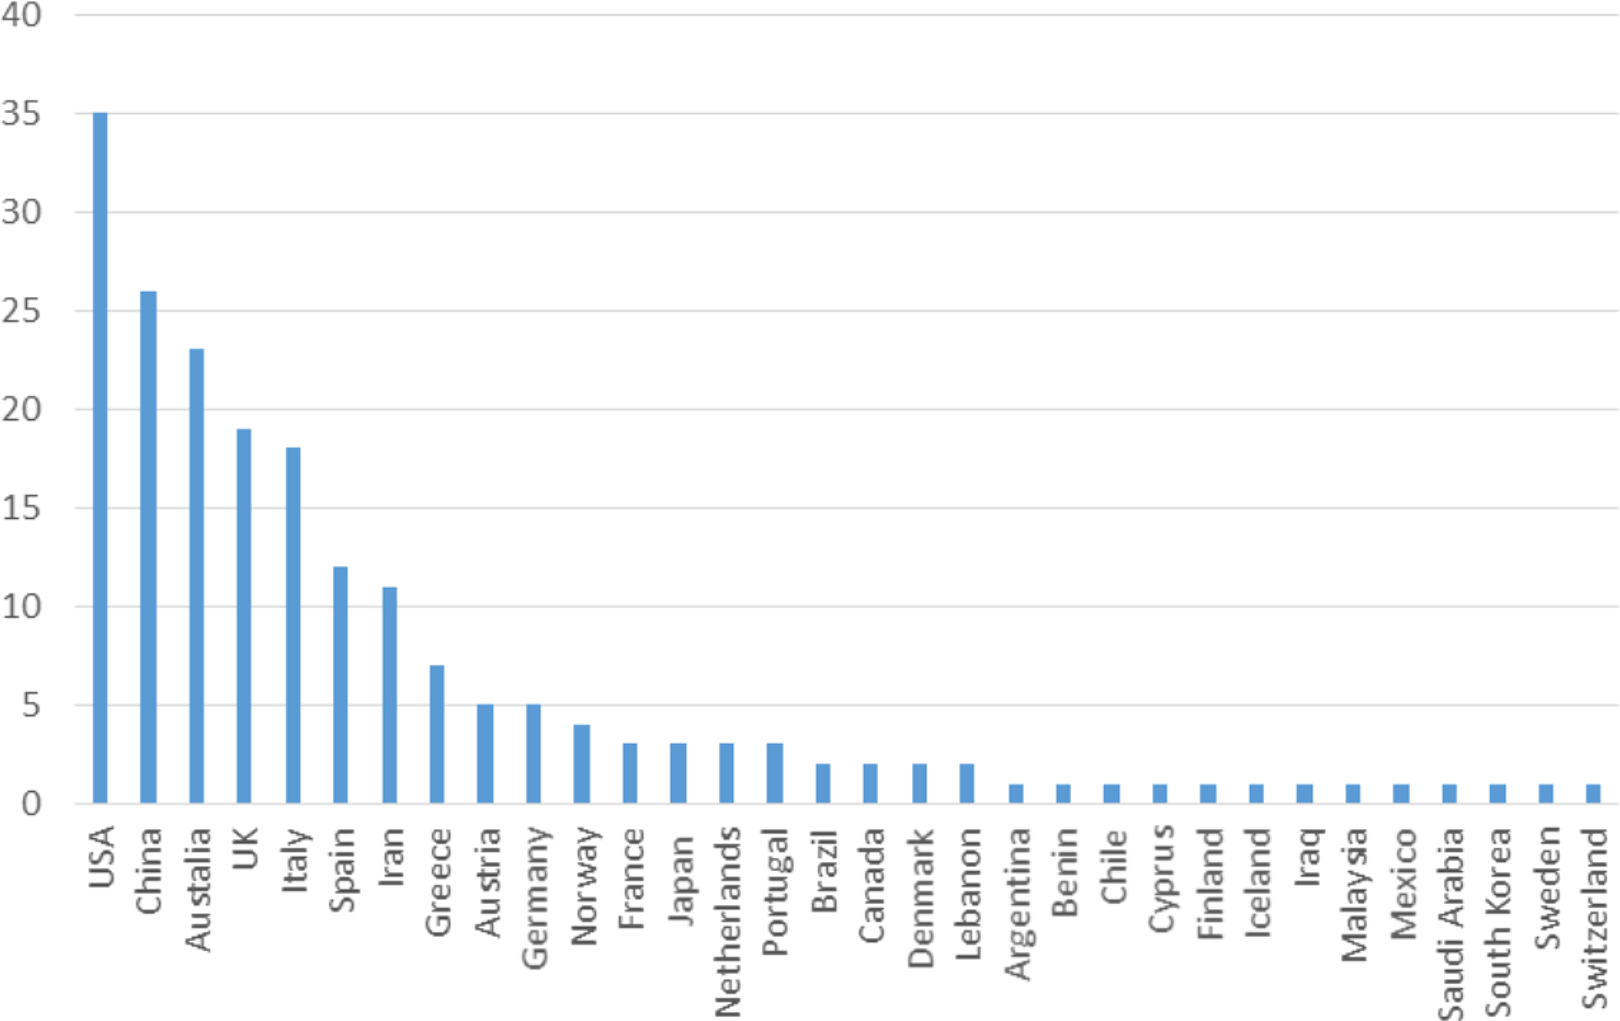
Number of systematic reviews by author address (n = 188).
The UN Decade of Action on Nutrition’s Work Programme has identified “Sustainable, resilient food systems for healthy diets” as the first of its 6 Action Areas. 73 Sustainable, resilient food systems and healthy diets share a reciprocal, bidirectional relationship. 74 Sustainable food systems are essential for providing a secure food supply necessary for a healthy diet; that is, food systems cannot require food demands that disrupt the ecological parameters within which the food system operates. As WHO states, “A healthy diet should be sustainably produced and consumed, and there is growing evidence that health and environment “win–wins” are possible.” 75
Two dietary pattern characteristics are consistently identified in the scientific literature, and in a few instances these have been translated into national dietary guidelines 76 -79 as key considerations for a healthy diet within sustainable, resilient food systems: source of protein (animal-based vs plant-based diets) and degree of food processing. For instance, a WHO information sheet notes that “A healthy diet that has a lower environmental impact includes a wide variety of foods—with an emphasis on plant-based foods (fruits, vegetables, whole grains, and pulses) and on locally produced, home-prepared foods—and provides just the right amount of calories. It includes sustainably sourced fish/shellfish, moderate amounts of milk and dairy products (or dairy alternatives) and modest amounts of fats and oils, mainly from vegetable sources. It is limited in meat (if eaten), especially red meat and processed meat products, and limited in processed foods high in fat, sugar or salt. It does not include sugar-sweetened beverages.” 75
The level of processing of individual foods and the proportion of those processed foods in the diet is predictive of a number of health outcomes. A modest level of food processing can promote a food product’s safety, convenience, and shelf life and contribute to the achievement of high-quality diets. Conversely, a high level of industrialized food processing can result in “ultra-processed” foods that typically contain high levels of added salt, sugar, and/or fat, and reduced levels of fiber and other bioactive compounds. Ultra-processed foods are formulations of ingredients, mostly of exclusive industrial use, made by a series of industrial processes, many requiring sophisticated equipment and technology (hence ultra-processed).80(p12)
A growing body of evidence is showing that having a large proportion of ultra-processed foods in the diet is associated with certain adverse health outcomes. 80 -82 Observational studies have shown associations between diets containing high proportions of ultra-processed foods and NCDs including CVD and cancer. An RCT reported a causal relationship between a diet containing a high proportion of ultra-processed foods and obesity. 83
The epidemiological evidence for associations between ultra-processed foods and adverse health outcomes is accompanied by evidence from mechanistic studies reporting plausible biological pathways that help to explain the observed associations. These mechanistic studies are showing that ultra-processed foods have a significantly altered chemical composition or physical structure of the food matrix relative to that of the source food or food ingredients from which they were derived. 42 It is being proposed that these chemical and physical changes are contributing to adverse health outcomes via their impacts on the gut microbiome and subsequent hormonal responses, as well as where and how the food is digested and metabolized, and subsequent physiological responses. 84
A high level of industrial food processing is also associated with adverse environmental sustainability outcomes. 85 Higher levels of industrial processing require more energy and water than lower levels of food processing. In addition, ultra-processed foods often require plastic packaging. More fundamentally, ultra-processed foods are not an essential part of a healthy diet and their production represents a waste of finite resources. The EAT-Lancet Commission on healthy diets from sustainable food systems 32 has quantified what it believes these characteristics mean for a transformation to healthy diets by 2050; dietary practice would require a greater than 50% reduction in global consumption of red meat and highly processed foods, and a greater than 100% increase in plant foods (with changes needed varying by region).
Summary and Conclusions
The key questions addressed in this article relate to the consensus inferred from comparison of the findings of 3 complementary, evidence-based approaches on elements of a healthy diet that can address all forms of malnutrition; and to the implications of these elements for developing and achieving goals related to the sustainability of the food system. The consensus elements are remarkably clear and consistent. The WHO recommendations, which set the tone as global reference points for elements of a healthy diet, are fitting for both preventing undernutrition and NCD risk reduction. They were derived from reviews of the best available evidence at the time they were developed, and they emphasize the importance of fruits, vegetables (excepting starchy root vegetables), legumes, nuts, and whole grains, limiting the intake of energy from free sugars and total fats, consuming unsaturated rather than saturated or trans fats and limiting intake of salt, while using salt that is iodized as a defense against iodine deficiency. The WHO carbohydrate guideline is in process. This will draw on a systematic review commissioned as part of the guideline development process, which found evidence consistent with causal associations between relatively high intakes of dietary fiber or whole grains with reduced risk for several NCD outcomes, which aligns with the current recommendation to consume whole grains. 86 Recommendations to limit intake of meat or high-fat dairy products are not included in the WHO guidance but are implied in the advice to limit saturated fat.
The GBD group’s empirical approach to characterizing healthy diets by analyzing risk–outcome pairs in a large and diverse population data set both complements and supports the WHO approach, by quantifying how much diet-related risks contribute to the NCD disease burden. One in every 5 deaths could potentially be prevented if dietary risks were brought into line with the optimal intake ranges they identify—more DALYs globally than are accounted for by high blood pressure, high fasting glucose, or tobacco. The specific dietary risk factors analyzed by the GBD authors were derived from extensive reviews of published evidence and they align well with the WHO recommendations. These risk factors—low intake of fruits, vegetables, legumes, whole grains, nuts and seeds, fiber, PUFAs, including omega-3 fatty acids in seafood—are associated with higher health risks in the GBD data, indicating a need to increase consumption of these foods. Thus, 10 of the 15 GBD risk factors indicate a need to increase the intake of healthier foods or food constituents identified as core to the WHO healthy diet recommendations. High intakes of sugar-sweetened beverages (a source of free sugars), trans-fatty acids, and sodium are associated with higher health risks, indicating a need to reduce consumption of these dietary constituents; this is also consistent with the WHO healthy diet recommendations.
The GBD risk factors involve 3 NCD dietary risk factors that have not been specifically assessed by WHO. The GBD finding about risk associated with high meat consumption is consistent with the emphasis on increasing plant food consumption and the need to reduce saturated fat, particularly if the meat consumed is not lean meat. Risk associated with high consumption of processed meats may emanate in part from the high sodium content of most of these products. The NUGAG review of health effects of a high degree of food processing is pending. The GBD finding, that low milk and calcium consumption increases risk, does not correspond to current WHO recommendations for NCD risk reduction; however, it is consistent with WHO recommendations for adequacy if the milk is low-fat or nonfat. With some differences (eg, explicit reference to increasing fish consumption), the foods or food constituents included in examples of dietary pattern indices associated with NCD risk reduction are consistent with the WHO and GBD recommendations.
From a human health perspective, the clearest implications for sustainability considerations relate to foods for which higher production and distribution would be required for a healthy diet, and those for which production may be ecologically harmful and which should therefore be targeted for reduction. This would mean shifts toward plant foods and away from animal foods (excepting fish and seafood, moderate amounts of dairy, and small amounts of red meat), or for food production systems that would improve the relative quantities and properties of these foods as currently produced and consumed from a health perspective.
The potential policy and practice implications for fostering a sustainable healthy diet are tremendous and will encounter the following interrelated challenges: selecting or completing the set of dietary variables to be taken as key drivers of changes related to sustainability to enable a focused, but complete picture of what is needed; developing an approach to characterizing dietary risk factors and patterns in ways that are specific to sustainability issues while being consistent with established health risks; quantifying these diet-related health and sustainability factors in a way that can be translated for analyses of agricultural and food policy options and goal setting, based on prototypical future populations.
This process will be complicated by the different levels of specificity and different groupings in risk factor characterizations (eg, what is grouped with what, and whether a particular food type within a category is specified; eg, red meat vs meat, or processed red meat or any type of processed meat, including poultry). Such differences in specificity are directly related to food production and processing.
In conclusion, the conceptual and methodological challenges for defining healthy diets, although substantial, must be addressed to inform the design of interventions (eg, policies) as well as for nutrition monitoring and surveillance. Although there are many general points of agreement across the different approaches reviewed here, sustainability discussions will require harmonization of specific risk factor definitions and dietary pattern indices. This process will engage WHO, GBD, FAO, and other key entities in prioritizing those diet-health associations that provide the strongest evidentiary support for potential health benefits of food systems change.
Footnotes
Acknowledgments
S.K. was the overall editor for the article, drafted the Introduction and Summary and Conclusions, and integrated text drafted by C.N. about WHO guidelines; A.A. drafted the section on the GBD estimates; and M.L., S.A.M., and M.A. collaborated to draft the section on whole dietary patterns. All authors reviewed and contributed revisions to the final version of the full paper.
Notes
Author's Note
This is an open access article distributed under the terms of the Creative Commons Attribution IGO License (![]() ), which permits unrestricted use, distribution, and reproduction in any medium, provided the original work is properly cited. In any reproduction of this article there should not be any suggestion that WHO or this article endorse any specific organisation or products. The use of the WHO logo is not permitted. This notice should be preserved along with the article's original URL.
), which permits unrestricted use, distribution, and reproduction in any medium, provided the original work is properly cited. In any reproduction of this article there should not be any suggestion that WHO or this article endorse any specific organisation or products. The use of the WHO logo is not permitted. This notice should be preserved along with the article's original URL.
Declaration of Conflicting Interests
The author(s) declared no potential conflicts of interest with respect to the research, authorship, and/or publication of this article.
Funding
The author(s) disclosed receipt of the following financial support for the research, authorship, and/or publication of this article: This paper was made possible with support from WHO.